45

Prediction of Pressure Characteristics in Settling Chamber of 0.6m Wind Tunnel for supersonic testing
Satyajeel Ratan Blroi G K Suryanarayana
Abstract
It is proposed to augment the NAL 0.6m wind tunnel with a Variable Mach number
Flexible NOz:le jVA4FV to enhance the testing capabiliy from transonic to
supersonic Mach numbers (up to 4.0). In order to avoid the start stop loads that are
inherent in blow down wind tunnels, it is proposed to start the tunnel at a low Mach
number (say 1.0) and then increasing the Mach number by reducing the n o d e
throat lmauimum Mach number = 4.0) by continuouslyflexing the nozzle walls; the
reverse process is to be adopted while stopping. In such an operation, hvo important
issues arise. Firstly, fhe settling chamber pressure should always be maintained
above the minimum ‘running’ pressure at any supersonic Mach number to avoid
jlow breakdown in the test section. Secondl.v, in order to maintain the pee-stream
dynamic pressure constant during the useful runtime and within desirable limirs
during the transition from Mach 1.0 to 4.0 and vice versa. the Pressure Regulating
Valve /PRI/J must be operated in a closc d - loop pressure control. In thi,s report, the
problem is forinulated based on assumptions of quasi-steadv iscntropic equation.s
and a program is presented in C language to stu& the nature of variation uf
stagnation pressure in the settling chamberfor various trajectories ofthe opening of
PRV and Mach number change. Good comparisons behveen [he restills predicted
from the program and experimental data obtained at .subsonic Mach numben in the
exisring 0.6m wind tunnel are shown. Predictions for VMFY operation show that the
settling chamber pressure rapid1,v biiilds up towards the value of storage tank
pressure, when the I’~V1F.V n o d e throat reduces from Mach 1.0 to ,I.lach 4.0
condition. presumably due to constriction of the flow passage at the first throat.
Likewise, the pressure rapid!vfalls when the VMFX reverses from .blach 4.0 to I . 0
condition. Bv .suitabl.v controlling the initial opening and the trajecron [If opening
and closing of the PRV if is possible to ensure that the stagnation pressure in the
settling chamber is always greater rhan the minimum lrunningl pressure [hat is
necessan, for stable jlow in the test section. However. it is seen t h ~ t durin~g the
trilnsition from Mach 1.0 to 4.0 and vice versa. the free-srream ajrnainic pressure
I

overshoots to relative1.v high balues, which has significance on model and balance
design for aerodynamic force and moment measurements at supersonic Mach
numbers in the 0.6m windtunnel.

Contents
Abstract
Contents
Symbols
1. Introduction
2. Project details
3. Objectives and parameters of the problem
4. Formulation of the problem 4.1. Assumptions made
4.2. Mathematical formulation
5. Method of solution
6. Computer program
7. Results and discussions I. 1. Validation of the method
7.2. Minimam stagnation pressures in 0.6m wind tunnel
at supersonic Mach nos
7.3. Pressure build-up characteristics
7.3.1. Effect of change of Mach no.
Page No.
I
... 111
V
I
2
2
3
3
4
8
10
10
10
I I
17
12
7.3.2, Effect of rule of change of Mach no. forgiven valve area
7.3.3. Effect of higher starting Mach no.
7.4, Run time pressure characteristics
7.4.1. Unregulated PRV
7.4.2, Regulated PR V
7.5. Pressure drop characteristics
7.5.1. Effect of change of iMucli no.
7.5.2. Effect of rate of change of Mach no. for given valve area
7.5.3. Effeei of higher stopping Mach no.
8. Concluding remarks
Acknowledgements
... 111

References
Figures (1 to 30)
Appendix A: Program listing
18
19-32
33
.
iv

Symbols
a
A
m
M
n
P P
r
R
t
T
U
V
q
Y
P
speed of sound
area
mass flow
Mach number
expansion index
pressure
total pressure
pressure ratio
gas constant
time
temperature
velocity
volume
dynamic pressure
ratio of specific heats
density
Subscripts
S storage tank
SC settling chamber
t throat
V valve
0 initial condition:
min minimum
max maximum
Supercript * sonic condition
V

1. Introduction
As a part of NTAF augmentation programme, it is proposed to augment the testing
capability of the NAL 0.6m blowdown wind tunnel from transonic Mach nos to
supersonic Mach nos up to 4.0. For this purpose, a Variable Mach number Flexible
Nozzle (VMFN), driven by a single hydraulic jack is being developed. In blow-
down wind tunnels, very high starting and stopping loads occur while testing at high
supersonic Mach nos (Ref. I ) . In the 0.6m wind tunnel, it is proposed to start the
VMFN at a low Mach no. (say. M = 1 .O) and a low stagnation pressure and reach the
test Mach no. (up to 4.0) to avoid starting loads. After completion of tests at the
desired Mach no.. the VMFN would be brought back to Mach I .O condition before
shutting down the run, in order to avoid stopping loads. During the entire operation,
the second throat would be kept fixed at a position corresponding to the starting
condition at Mach 1.2 so that the normal shock during starting of the tunnel is
anchored beyond the second throat at all supersonic Mach nos.
During the VMFN operation as described above, two important issues arise.
Firstly, after the flow stabilizes at Mach 1 .O during start. it is essential to maintain a
minimum stagnation pressure in the settling chamber using the Pressure Regulating
Valve (PRV). to avoid supersonic flow breakdown in the test section. Secondly.
since the storage tank pressure drops continuously as blowdown progresses; the
PRV must be close-loop controlled to maintain constant dynamic pressure in the
free-stream during the useful run. The available run time in the wind tunnel is
governed by the mass flow rate, which in turn depends on the VMFN throat as well
as opening area at the PRV, in addition to other parameters such as storage tank
pressure, storage tank volume. losses at the PRV. etc. Thus, the problem of
operation of VMFN involves the dynamics of Mach no. change and that ofqthe PRV
trajectory. besides the other fixed parameters related to the test facility. Further. in
order to minimize the wastage of compressed air from the storage tank. it is required
to reach the test Mach no. in the quickest possible time. after the flow is started at
Mach I .O. However, during the entire blowdown, the dynamic pressure in the test
section should not be undesirably high. since this affects the design of the model 3nd
the balance in supersonic Mach no. tests. I t is therefore necessary to understand the

stagnation pressure characteristics in the settling chamber, as a function of the
VMFN throat (equivalent to Mach no.) as well as the PRV trajectory.
In this report, the problem is formulated based on quasi-steady isentropic
equations to study the stagnation pressure characteristics in the settling chamber and
the pressure drop in the storage tank for various opening and closing trajectories of
the PRV when the Mach no. is varied from 1.0 to 4.0 and vice versa. A computer
program in C language is presented to predict the settling chamber pressure
characteristics. The program is validated with results from tests conducted in the
0.6m wind tunnel at few subsonic Mach nos. Predictions are made for the settling
chamber pressure characteristics relevant to VMFN operation.
2. Project details
Title : Prediction of Pressure Characteristics in Settling Chamber of
0.6m Wind Tunnel for supersonic testing
Project no. : N-0-420
Sponsor : NAL
3. Objectives and parameters of the problem
The desired output from the present exercise i s to predict the following with respect
to VMFN operation.
I . Effect of change of Mach no. (as well as the rate of change) from 1 .O to 4.0
on the settling chamber pressure for a fixed position of PRV (unregulated
condition)
2. Effect of PRV trajectory on the settling chamber pressure and test section
dynamic pressure as a function of Mach no..
3 , Maximum available run-time at ,Mach 4.0 using various numbers of storage
tanks (minimum volume of 25.000cft to maximum of 1.27.OOOcfi)
4. To study whether an optimum trajectory for the PRV can be predicted. which
ensures that
2

a) after the flow stabilizes at Mach 1.0 condition, the stagnation
pressure is always higher than the minimum safe limit to avoid flow
breakdown at any supersonic Mach no.,
wastage of compressed air is minimized by maximizing the useful
run time in a run,
the dynamic pressure in the test section is not undesirably high during
transition from M=I.O to 4.0 and vice versa and is constant during the
useful run time.
b)
c) I
The parameters that decide the above issues are the volume of storage tanks
(maximum 1,27.000 cft), the maximum initial storage tank pressure (163 psia),
temperature (300K), volume of the settling chamber (up to VMFN throat for
supersonic test conditions and up to second throat for subsonic and transonic test
conditions), first throat area (at the VMFN), flow area and losses at the PRV.
4. Formulation of the problem
Figure 1 shows a schematic of the 0.6m wind tui,nel. incorporating the VMFX. The
governing equations for the mass flow rate through the PRV depend on whether the
valve is choked or not, which in turn depends on the upstream and downstream
conditions across the PRV and the opening area at the PRV. If the flow is choked.
the mass flow is independent of pressure in the settling chamber and the variation of
settling chamber pressure and the storage tank pressure are related through coupled
linear equations. If the PRV is not choked. the entry mass flow depends on settling
chamber pressure as well as the storage tank pressure, and the governing equations
become coupled non-linear differential equations. These equations maybe solved
using standard numerical methods.
4.1. Assumptions made
I . Polytropic expansion of air in the storage tank.
2. Stagnation temperature in the storage tank and the settling chamber are
identical.

3. When the PRV is not choked, static pressure at the valve equals 0.96 times
the settling chamber pressure.
4. When the VMFN throat is not choked, 5% loss of total pressure occurs at the
throat.
5. Quasi-steady one-dimensional flow.
6 . Isentropic flow equations are valid.
4.2. Mathematical formulation
Writing the continuity equation between storage tank and the valve (PRV),
rate of change of mass in storage tank = mass flow rate through the valve.
For polytropic expansion with index n, and initial conditions PSO and Tso, the
equation becomes.
Writing the continuity equation between the valve and the test section.
mass flow rate through the valve = rate of mass buildup in settling chamber + mass
flow rate through the throat.
P Valve choked: The valve would be choked when' 5 C where C = P,
For this case.
J
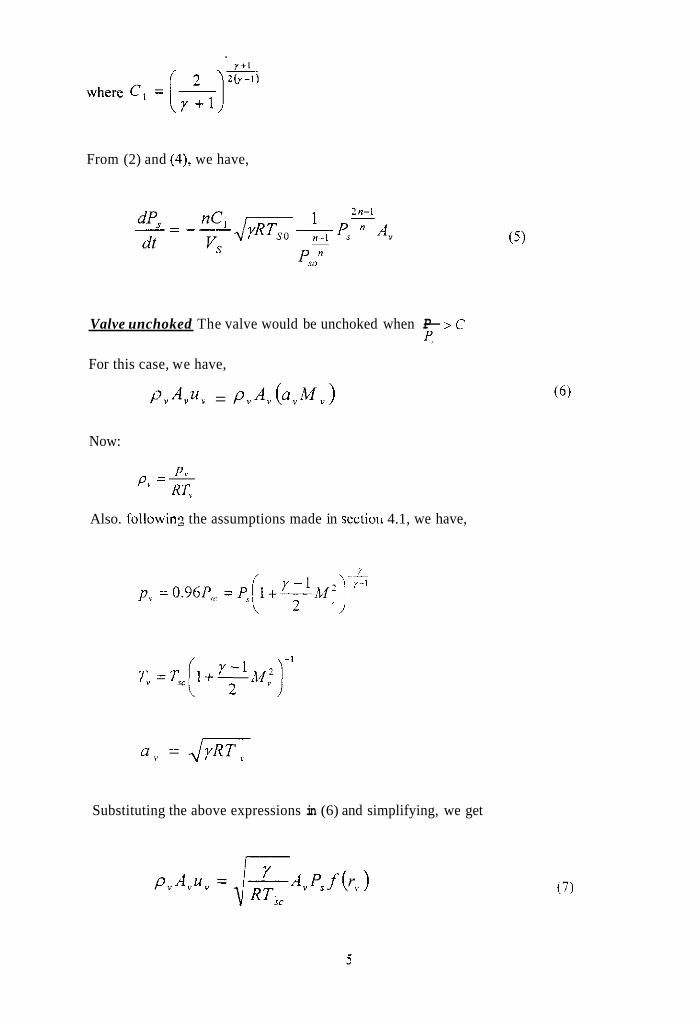
From (2) and (4), we have,
Valve unchoked The valve would be unchoked when - P 9
> C
For this case, we have,
P " b " = P . A " ( W " )
Now:
P Y
P , =- R T"
Also. followin2 the assumptions made in sectiou 4.1, we have,
Substituting the above expressions in (6) and simplifying, we get

where r, = 0.96 P,,/P,
Substituting (7) in (2), and simplifying we get,
Throat choked The throat would be choked when& s C
For this case,
p,,
Thoat unchoked The throat would be unchoked when
For this case, we have,
> C px
Now,
Also. followinz the assumptions made in section 4.1, we have,
r, = T>, 1 + - .w; i -r 6

a , = JrRri Substituting the above expressions in (1 1) and simplifying, we get.
where r, =par" / (0.95P,J
( 5 ) and (9) are the differential equations for the storage tank pressure variation for
valve choked and unchoked cases respectively. These equations may be rewritten as
a single equation as
To obtain the settling chamber pressure equation, the expressions (10) and (12) are
substituted in (3) for throat choked and unchoked cases respectively and simplified.
where
F(r>, )= C , if valve is choked if valve is unchoked = f ( r )
F(r, ) = c, if throat is choked if throat is unchoked = f ( r , 1
(13) and (14) constitute a pair of coupled non-linear differential equations for the
variation of P, and P,, with time respectively.
The static pressure can be obtained from the relation

and the dynamic pressure by
5. Method of solution
Fourth order Runge-Kutta numerical method is employed to solve the differential
equations. Nan dimensionalising P, and P,, with respect to the initial storage tank
pressure, P,,, we get,
the initial conditions when t = 0 are.
From ( I 3) and (14) we have
- d P , - ~ = F, (t, PI )
dt
- - - Lip$<
Lit -= F,( t .P , .P , ' )
( I S )
where
8

6
'JlaqM

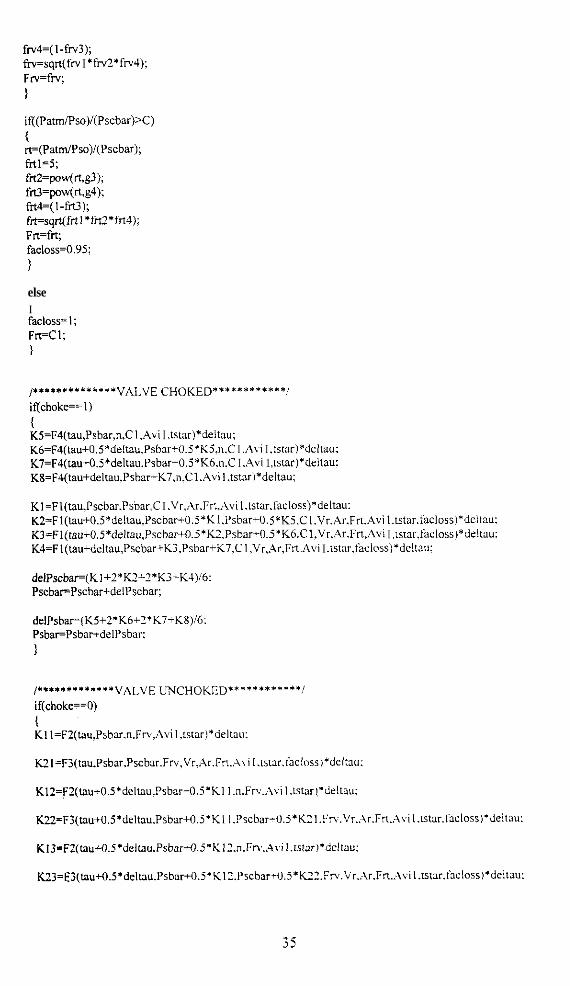
6. Computer program
I I
6089 0.2
609 I 0.5
I 6092 1 0.6 I
A computer program has been written using C language based on the method
described above. The input data to the program are Vs, VSC, At, dIWdt, dAJdt, n, y,
R, P,,, PSO, and PSCO, The program evaluates the variation of PS and Psc and also
computes the q. Appendix A includes listing of the program.
30 81.72 90.000
30 112.50 90.000
30 106.00 90.000
1
7. Results and discussions
7.1. Validation of the method
The computer program was run for each of the above cases to obtain the Pjc
and Ps characteristics. The measured valve-opening trajectory during the blowdonn
numbers 6089. 6091 and 6092 of 0.6m wind tunnel was used as input. The valve
opening trajectories for the run numbers 6089, 6091 and 6092 are shown in Figures
10
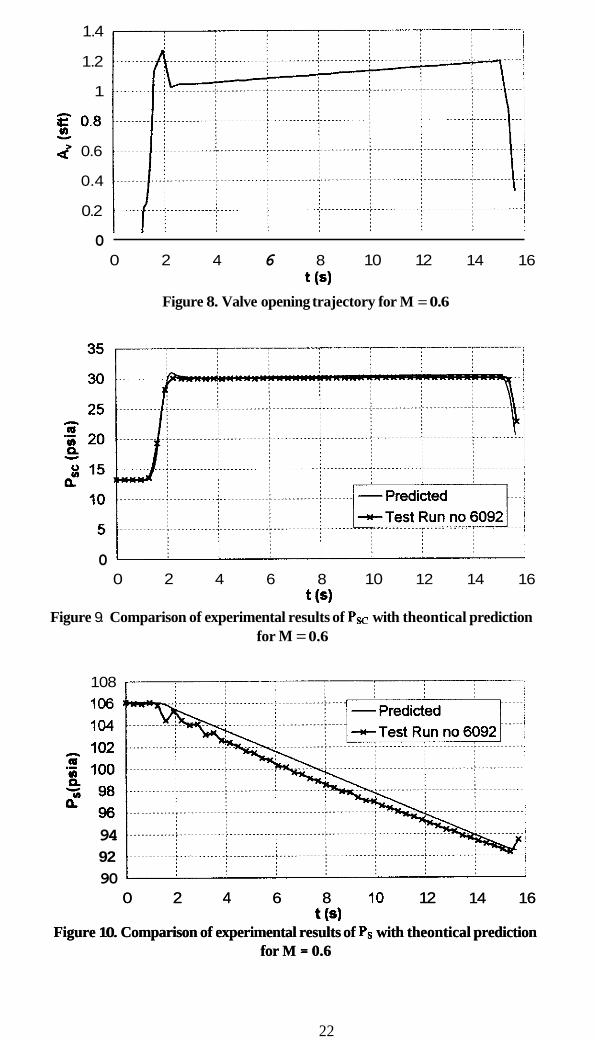
2, 5 and 8 respectively. Figures 3, 6 and 9 show the comparison of the predicted PSC
characteristics with the test run data. It is seen that except for the initial build-up of
Psc for M=0.2, the predicted pressure agrees well with the experimental data.
Figures 4, 7 and 10 show the predicted Ps drop with time compared with the test run
data. Good comparison between the predicted and experimental results can be seen.
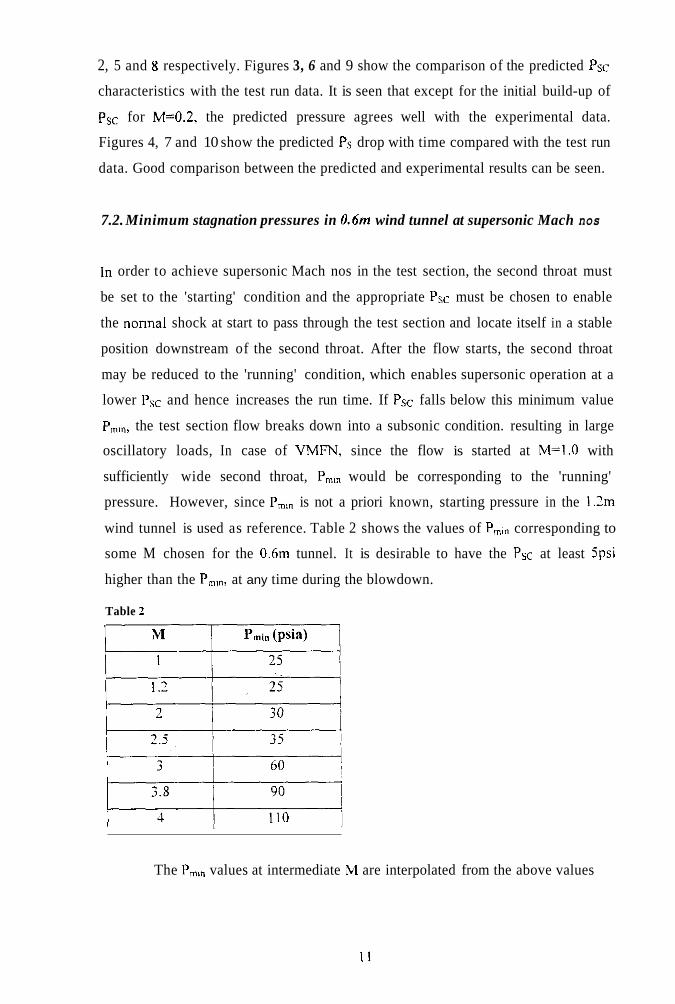
7.2. Minimum stagnation pressures in 0.6m wind tunnel at supersonic Mach nos
In order to achieve supersonic Mach nos in the test section, the second throat must
be set to the 'starting' condition and the appropriate PSC must be chosen to enable
the nonnal shock at start to pass through the test section and locate itself in a stable
position downstream of the second throat. After the flow starts, the second throat
may be reduced to the 'running' condition, which enables supersonic operation at a
lower Psc and hence increases the run time. If Psc falls below this minimum value
P,,,, the test section flow breaks down into a subsonic condition. resulting in large
oscillatory loads, In case of VMFW, since the flow is started at M=l.O with
sufficiently wide second throat, P,,, would be corresponding to the 'running'
pressure. However, since P,,, is not a priori known, starting pressure in the 1 . h
wind tunnel is used as reference. Table 2 shows the values of P,,, corresponding to
some M chosen for the 0.6m tunnel. It is desirable to have the PSC at least jpsi
higher than the P,,,, at any time during the blowdown.
Table 2
The P,,, values at intermediate M are interpolated from the above values
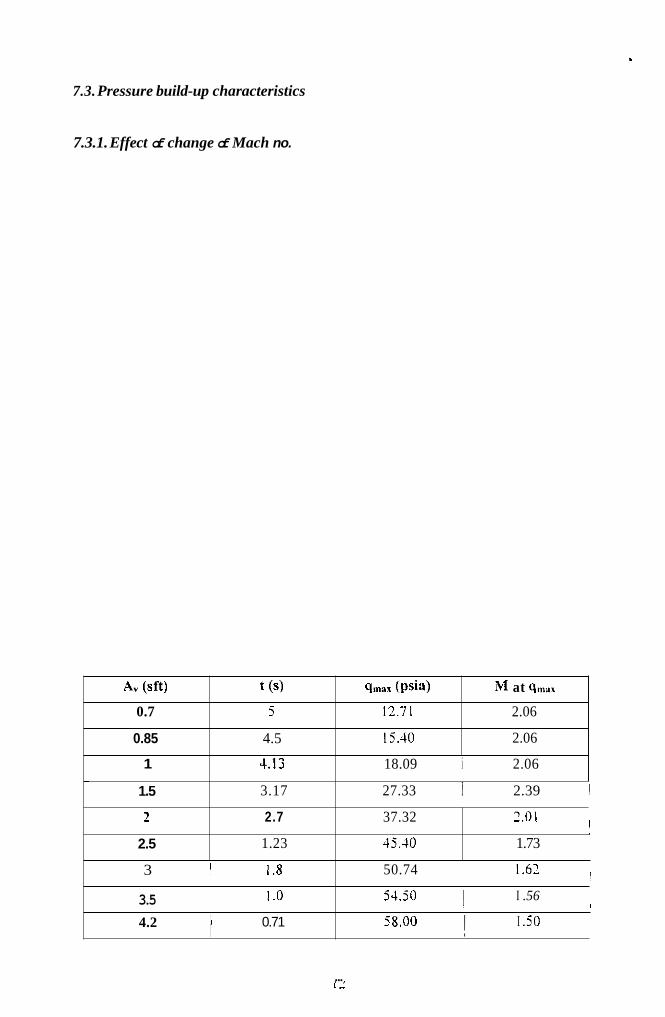
7.3. Pressure build-up characteristics
A, (Sft) t (s)
0.7 5
0.85 4.5
1 4.13
1.5 3.17
2 2.7
2.5 1.23
3 1 1.8
I .o
-
3.5 I I 0.71 4.2
7.3.1. Effect of change of Mach no.
qmar ( p s i 4 M at q,,,,
12.71 2.06
15.40 2.06
18.09 i 2.06 , 27.33 I 2.39 I
j 43.40 1.73 I
1 I
!
37.32 1.01
I 50.74 ~ 1.62
I .56 54.50
jS.00 I .50
...

It is noted from the table that if the PRV opening is not controlled, or if the PRV
gets into a ‘runaway’ condition, the instantaneous qmW values can be very large,
resulting in damage to model, balance etc.
dM/dt (Ws)
0.75
1
7.3.2. Effeet of rate of change of Mach no. for given valve area
Min A, (sft) t 6) q,,, ( p i n ) i at q m T
j ! 12.71 1 2.06 0.7 5
0 3 5 J 13.93 I .97 I
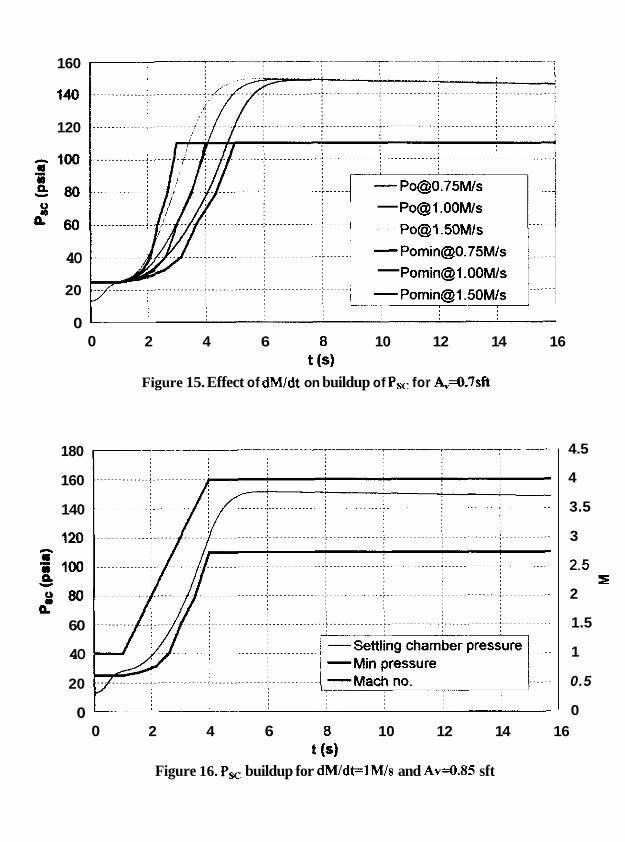
In order to maximize the run time, it is required to change the Mach no. at the
highest rate. Since P,,, is a function of M, which in turn is a function of time, P,,,
also becomes a function of time. Considering A, of 0.7sft as shown in Figure 1 I , the
effects of transition of M from 1.0 to 4.0 in 4s(dMidt=0,75M/s), 3s(dM/dt=l .OM/s),
and Zs(dM/dt=lSOM/s) are now discussed. Figure 15 show the PSC build up and the
P,,, values for various rates of transition of M for AV=0.7sft. It is observed that a
rate faster than 0.75M/s results in insufficient PSC. From several trials, it is noted that
to achieve dM/dt=l and l.jM/s the minimum values of A, required are 0.85 and I ,
to ensure that at any instantaneous M, achieved PSC is greater than P,,,. However as
indicated in Figure 16 and 17, for these conditions the achieved Psc is much higher
than P,i,, resulting in a loss of useful time for testing at M=J.O. This calls for
regulating the Psc to a prcscribed value in a pressure loop. Figure I 8 shows the
variation of q in the test section for various speeds of operation. Faster operation
results in a higher magnitude of.qmnn. Table 3 summarizes the time required to reach
120 psia, qmax and M at qmau under various speeds of operation at the minimum PRV
openings. It may be noted that high dM/dt causes increased q, which has a bearing
on the model and balance design.
1.5 , I 3 16.55 i 1.75 !

7.3.3. Effect of higher starting Much no.
Starting M
1.5
2
2.5
- Min A,(sft) t (s) 1 qmar (psis) M at qmrr
0.7 4.1 12.58 I .98
0.7 3.6 12.87 2
0.7 3 71 I 2.6 ~~~ ~
7.4. Run time pressure characteristics
The run time PSC and the maximum run time available are influenced by the VS 8
the drop in Ps. In the test facility, the air is stored in a series of five interconnect
storage tanks of 25000cft capacity each and not all tanks may be available to U
0.6m tunnel. The effect of increased Vs from minimum (1 tank) to maximum1
tanks) is studied. PSO has been taken as 163 psia though the tests can he done!
lower pressure also. Run time Psc characteristics have been evaluated consider!
M=l at start with rate of change of 0.75M/s. For the present studies it is assud
that the maximum run time would be up to the time Ps is higher than PSC by l0%/
the PSC.
7.4.1. linreguluted PR V
Figures 21 shows the variation in PS for different Vs for A,,=O.7sft in the unregul
mode of PRV (Figure I I). I t is seen that the rate of Ps drop is higher during
transition from Mach 1 .O to 4.0. Reduced Ps drop with increased Vg, as expect1
noted.

7.4.2. Regulated PRV
No.of t i Av2
Storage (sft) (s) (sft)
tanks
1 0.7 4.9 0.41
2 0.7 4.9 0.34
3 0.7 4.9 0.32
4 0.7 4.9 0.32
5 0.7 4.9 0.32
The control of PRV switches to the pressure mode when the pressure builds up to
PSC, For example if the PSC builds up more than 120psia at M=4.0, the pressure
mode will reduce the PRV area to maintain PSC at 120psia. A typical PRV trajectory
is shown in Figure 22. It is to be noted that the PRV opening gradually increases to
compensafe for the continuous drop in the Ps as the run advances. The parameters
defined in Figure 22 for regulated PRV have been obtained by trial and error and are
tabulated below for various numbers of storage tanks to buildup and maintain the
constant Psc of 120psia at M 4 . 0 .
dt d&/dt 1 Maximum
(s) (sft/s) I ru;;c
0.2 0.0096 1 I I
0.2 0.0044 30
0.2 0.0024 ~ 55
0.2 0.0016 ~ 80
0.2 0.0012 100
,
I
Table 6
The P ~ c along with PS drop and the M variation for one and two storage tanks are
shown in Figures 23 and 24 respectively. The typical runtime proposed in VMFN
operation is 30s and maximum proposed is 120s. The results show that for runtime
of 30s one tank wobld not be sufficient.
7.5. Pressure drop characteristics
7.5.1. Effect of change of Macli no.
The PRV is set to start closing simultaneously as the nozzle contour is changed from
Mach 4.0 to 1.0 at the rate of 0.75 M/s after completion of the test. The PSC characteristics for different rates of closing the PRV are shown in Figure 25. It is
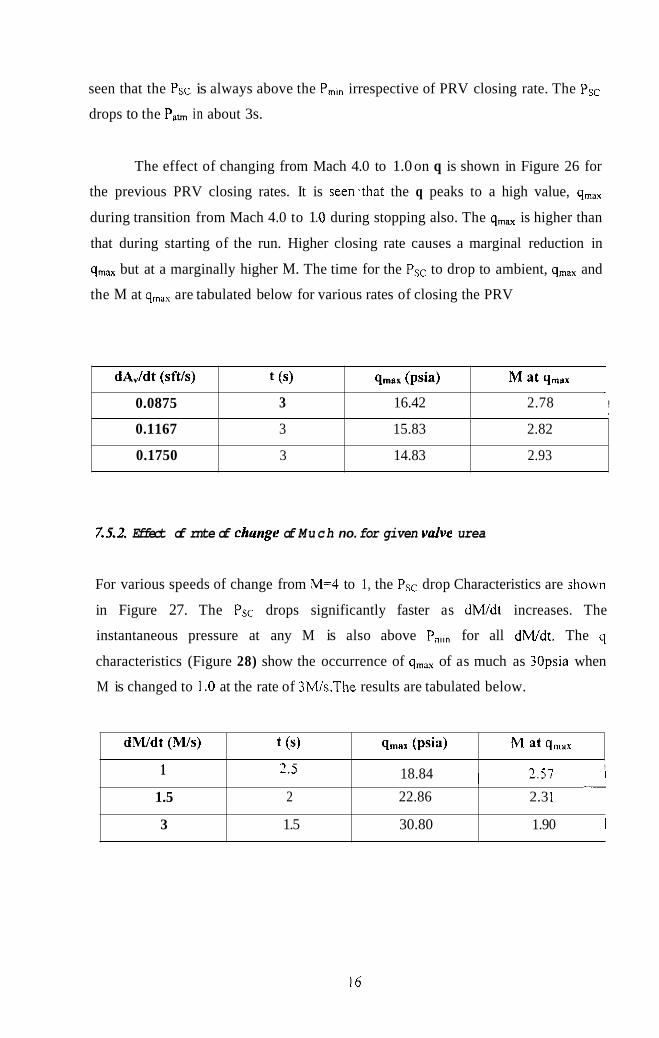
seen that the PSC is always above the P,," irrespective of PRV closing rate. The Psc
drops to the Pam in about 3s.
dA,/dt (sft/s)
0.0875
0.1167
0.1750
The effect of changing from Mach 4.0 to 1.0 on q is shown in Figure 26 for
the previous PRV closing rates. It is seen.that the q peaks to a high value, q,,,
during transition from Mach 4.0 to 1 .O during stopping also. The qmax is higher than
that during starting of the run. Higher closing rate causes a marginal reduction in
qmaX but at a marginally higher M. The time for the Psc to drop to ambient, qmaX and
the M at qmax are tabulated below for various rates of closing the PRV
t (s) qmar (ps i4 M at qmar
3 16.42 2.78 ! I
3 15.83 2.82
3 14.83 2.93
dWdt ( W s )
1
1.5
3
7.5.2. Effect of rnte of change of Much no. for given valve urea
t 6) qmax (psW ,M at q,,,
2.5 , 18.84 2.51 I - I
2 22.86 2.3 1 I
1.5 30.80 1.90 I
For various speeds of change from M=4 to 1, the PSC drop Characteristics are jhown
in Figure 27. The PSC drops significantly faster as dM/dt increases. The
instantaneous pressure at any M is also above P,,, for all dMidt. The q
characteristics (Figure 28) show the occurrence of q,,, of as much as 30psia when
M is changed to 1 .O at the rate of 3Ws.The results are tabulated below.
16

7.5.3. Effect of higher stopping Mach no.
Stopping M dM/dt (MIS) t (s) qmax (psia) M at qmrx
1.5 0.75 3 16.42 2.78
2 0.75 3 16.42 2.78 ___________
The effect of stopping at higher M is studied. The PSC drop characteristics are
considered by changing the Mach no. at the rate of 0.75M/s, as the PRV is
simultaneously closed at the rate of 0.0875sWs. The results are shown in Figure 27.
It is seen that, the Psc drop characteristics do not change with the higher stopping M.
The effect on q is shown in Figure 28. Again, it can be noted that the qmax does not
change as well as M a t q,,,. The results are tabulated below.
, 2.5
8. Concluding remarks
0.75 3 16.42 2.78 ~
Predictions of the PSC characteristics for VMFN operation in 0.6m wind tunnel are
presented. The predictions are validated with experimental data from 0.6m wind
tunnel at subsonic M. The simulation has been used to predict the PRV opening
trajectory necessary to maintain Psc above P,,, value required to maintain the
supersonic flow in the test section at any M. During transition from M=1.0 to M=4.0
and vice versa, peak values of q of as much as 30psia are indicated. Thus it appears
that even though the use of VMFN may alleviate start stop loads. the need to design
wind tunnel models for loads arising from high q still continues
Acknowledgements
Useful discussions with Dr S N ‘eshadri. former Head. NTAF. >u,\L and Shri G
Rajendra. Emeritus Scientist. NTAF. NAL are acknowledged with thanks. The
efforts of staff of instrumentation and controls group of NTAF in acquiring data in
the 0.6m tunnel for the generation of experimental data for validation purposes are
gratefully acknowledged.
17

References
1. Pope, A. and Goin, K., High-speed Wind Tunnel Testing, Krieger
Publishing Company, Wiley, New York, 1965
2. Anderson, John D., Jr, Modern Compressible Flow: with Historical Perspective, McGraw-Hill Book Co., New York, 1982.
t

Model Subsonic Fixed Pt VMFN cart diffuser diffuser ..........................................................
Ps Test section
.....-_...... L _ _ ....
Storage tank Settling Chamber (area At) Throat (volume V,) (volume VSC) Storage tank Settling Chamber (volume V,) (volume VSC)
Figure 1. Schematic of 0.6m wind tunnel with VMFN

0.8
0.7
0.6
0.5 'R 0.4
a? 0.3
0.2
0.1
0 0 2 4 6 8 10 12 14 16
t (5)
Figure 2. Valve opening trajectory for M = 0.2
0 2 4 6 8 10 12 14 16
Figure 3. Comparison of experimental results of Psc with theoritical prediction t (5)
83
82
81 - 80 a u) .- - P 79
2 78
77
76
75
for M = 0.2
0 2 4 6 8 10 12 14 16
Figure 4. Comparison of experimental results of Ps with theoritical prediction for M = 0.2
t (5)

1.2
1
0.8
0.4
0.2
0
35
30
25
10
5
0
0 2 4 6 8 10 12 14 16 t (5)
Figure 5. Valve opening trajectory for M = 0.5
0 2 4 6 8 10 12 14 16 t (s) . .
Figure 6. Comparison of experimental results of Px with theoritical prediction for M4.5
112
110
108 - - a 106
2 104
1 02
100
981 I
0 2 4 6 8 10 12 14 16 t Is)
Figure 7. Comparison of experimental resulisbf PS with theoritical prediction for M = 0.5
1.4
1.2
1
0.6
0.4
0.2
0 0 2 4 6 8 10 12 14 16
t (5 )
Figure 8. Valve opening trajectory for M = 0.6
0 0 2 4 6 8 10 12 14 16
Figure 9. Comparison of experimental results of Psc with theontical prediction for M = 0.6
t (4
108 I 106 104
0 2 4 6 8 10 12 14 16
Figure 10. Comparison of experimental results of PS with theontical prediction for M = 0.6
t (5 )
94 92 90 '
0 2 4 6 8 10 12 14 16 t Isl . .
Figure 10. Comparison of experimental results of PS with theontical prediction for M = 0.6
22

0.9
0.8
0.7
0.6
5 0.5
0.4
0.3
0.2
0.1
0
-
0 2 4 6 8 10 12 14 16
Figure 11. Inputs of PRV trajectory and Mach number profile t (5 )
180
160
140
120 - + loo a - 8 0 a
60
40
20
0 0 2 4 6 8 10 12 14 16
Figure 12, Effect of change of nozzle throat on P, buildup t (5 )

180
160
140
120
60
40
20
0 0 2 4 6 8 10 12 14 16
t (s) Figure 13. Effect of change of M on buildup of Psc for some A,
16
14
12
10
8
6
4
2
0
4.5
4
3.5
3
2.5 5
2
1.5
1
0.5
0
)
4.5
4
3.5
3
2.5 I
2
1.5
1
0.5
0 0 2 4 6 8 10 12 14 16
t (s) Figure 14. Effect of change of M on q for some 4.
160
140
120
s 0 6 0
40
20
0
180
160
140
60
40
20
0
- Pornin@ .OOM/s
0 2 4 6 0 10 12 14 16 t (5)
Figure 15. Effect of dlwdt on buildup of Psc for AV4.7sft
4.5
4
3.5
3
2
1.5
1
0.5
0 0 2 4 6 0 10 12 14 16
t (8)
Figure 16. Psc buildup for dM/dt=lM/s and Av4.85 sft

0 2 4 6 a 10 12 14 16
Figure 17. Psc buildup for dM/dt=l.SMls and Av=lsft t (4
- 1 dM/dt= MIS
dMldt=1.5 Mls
0 2 4 6 a 10 12 14 16
Figure 18. Effect of dWdt on q t 04

, -- - ,
- (I
P
0
- a 1
160
140
120
100
80
60
40
20
0
14
12
10
8
6
4
2
0
I - P o & M s t a r t F l I - Po@Mstart=2 ~
i Po@Mstart=2.5 . ~ . i
_ _ _ _ ~
i~ . ,
!
-Pomin@Mstart=1.5 ~ ~ ~ ~ . ~ ;
- Pornin@Mstart=2
- Pomin@Mstart=2.5 1 j ~~~~~~
_.___...-.-~i '
0 2 4 6 8 10 12 14 16 t (s)
Figure 19. Effect of higher starting M on P, buildup
0 2 4 6 8 10 12 14 16 t (5)
Figure 20. Effect of higher starting M on q

3
0 2 4 6 8 10 12 14 16 18 20 22 24 26 28 30
Figure 21. Effect of V, on drop in PS t (8)
11 t (s)
Figure 22. Typical A, trajectory in regulated mode

0 2 4 6 8 10 12 14 16 18 20 22 24 26 28 30
Figure 23. Psc and P, in regulated mode of PRV for one storage tank t (8)
180
160
140
120
80
40
20
0
4.5
4
3.5
3
2
1.5
1
0.5
0
0 5 10 15 20 25 30 35 40 45 50
Fwre 24. Psc: and P, in regulated mode of PRV for two storage tanks t (3)

4
3.5
3
2.5
2
1.5
1
0.5
z
27 29 31 33 25 t (8)
Figure 25. Effect of change of M from 4.0 to 1.0 on Psc drop characteristics for some rates of closing the PRV


18
16
14
12
t (s) Figure 29. Effect of higher stopping M on Psc drop characteristics
-..-. . - 1
! U '
31 33 27 29
Figure 30. Effect of higher stopping M on q
25 t (8)

Appendix A: Program listing
I' Settling chamber pressure buildup characteristics Input parameters: Storage tank volume Vs Senling chamber volume Vsc expansion index n initial storage tank pressure Pso atmospheric pressure Palm ratio of specificheats gamma=I.J valve opening trajectories (Avi), (Avi.tm),(Avil;tl.Avi2, 0.13) Av=4.305sft gas constant R initial storage tank temperature Tso test section area AinS=4 test section mach number Minf ambient temperature Tinf ' 1
#include<stdio.h> #include<stdlib.h> #include<math.h> #include<conio.h>
float F 1 (float,Iloat.float.float,iloat.float.lloat.iloat.flo~t.float); float F2(float, tloat.!loat,tloat,float,float): float F3 ( f loa t . f l oa t , f l oa~f loa t , f l oa t . f l oa t . ! l oa t . i l ) : float F4(float,float.iloat.float.flnat.float); float Av(floa1); float stroke(float,float); float Pmin(float); float M(float.float);
void main0 i
float Vsc.Vs,Vr; float n,Patm,Tso.gamma.R float Ainf,At,Ar; float CI,C,C2: float rt,frtl,frt2.frtj,frtJ.frt.fn.rv.fwI .fn,2.fw3.fwNJ.l'rv.Fn;: float Avil,Avi; float Pso.Pscbar.delPscbar; float KI,K2.K3,K4K5.K6.K7.K8: in1 choke: float K1 I.KI2.Kl3.K 14.KZ I .K23.KZ3.K1J: float Psbar.delPsbar: float tstar.tau.tdelt.deltau: float Tmax; float [email protected]: float Mts,Minf: float q,Ps.Ae: float facloss=l:
!
i' floats:
FILE *data=~open~"data.ist"."\~"):
printf("Enter Minf : "):

scanf("%P',&Mint);
Pso=163; Pam= 13.2:
n=l.2; gamma= I .4; Tso=546; Ainf=J; R=1707: Avil=l;
g1=3; g2=3.5: g3=1.4286; g4=0.2857;
C1-0.578703; C=0.528282:
if(Minfbl.2) Vsc=900: else vsc=1000: Vr=VscNs:
tstar=Vs/(Avi 1 *sqrt(gamma*R*Tso));
Pscbat-PatmPso; Psbar=l;
delt=0.02.:; deltau=deltitstar; Tmu=30;
for(t=O:t<=Tmax;t=t+delt)
Mts=M(t,Mint); C2= I+02*Mts*Mts: Ps = Pscbar'Psoipow(CZ.3.5): q = 0.7*Ps*Mts*Mts: s=pow(c2.g I): tau=tktar; Avi=Av(stroke(tau.tstar)): At=Ainl*Mts/(Cl Is); At=AtiAvil:
fprintf(data."9/of9/of9/of?/af O6f %f %f%f?od \n".t.Pscbar*Pso.Psbar*Pso.q.~lts.4int?At.l\~~i.Pmin( Mts).chokc):
if(0.95*PscbariPsbar<=C) choke=l:
else
vs=25000:
{
t choke=O: n-O.95'PscbadPsbar: f n l=5 : fn,?=po\\lri..g3): fn-3=pow(n,.g-L):
frv4=(l-frv3); frv=sqrt(frv I *frv?* frv4);
i
if((PatmiPso)i(Pschar)>C) { rt=(PatmiPso)i(Pschar); frtl=5; frtZ=pow(rt.g3); fro=pow(rt,g4); frt4=( l-frt3); frt=sqrt(frtl *frt2*frt4); Frt=frt; ~ ~ c I o s s = o . ~ ~ ; i
Frv=frv;
else I facloss=l; Frt=CI;
,*"**********'VALVE CI<OKED****I*******, if(choke==l)
KS=F4(tau,Pshar,n,C 1 ,Avi I .tstarJ*deltau: K6=F4(tau+O.S*deltau.Pshar+O.j*Kj.n.C I .Avi I .tsrar)*deltau: K7=F4(tau+O.j*deltau.Pshar+O.j*K6.n.C I .Avi 1 ,tstar)*dcltau: K8=F4(tau+deltau.Psbar+K7,n.CI .Avi 1 .tstari*deltau;
Kl=FI(tau.Pscbar.Psbar,C I .Vr,Ar.Frt.Avi 1 .tstar.fac!oss)*deltau; K2=Fl(tau+O.S*deltau.Pscbar+O.j'KI.Psbar+O. j*Kj.CI.Vr.Ar.Frt.Avi l.tstar.iacloss)*dcltau: K3=Fl(tau+O.5*deltou,J'scbar+O.j*K2.Psbar-O.j*K6.CI,Vr.Ar,Fn.~Zv~ I .israr.ijcloss)*de!tau: K4=FI(tau+deItau,Pscbar+K?.Psbar+K7,C 1 .Vr,.k.Fn.Avi I .tstar.iaclossi*delt~u:
delPscbar=(K 1 +Z*K?i2*K3+K-1)/6: Pscbar=Pschar+delPschar;
delPshar=(K5+2*K6+2*K7+K8Ji6: Psbai=Psbar+delPshor:
(
i

K14=F2(tau+deltau,Psbar+K13,n,Frv,Avi 1 ,tstarj*deltau;
K24=F3(tau+deltau,Psbar+Kl~.Pscbar+K2j.Frv,Vr,Ar.F~,~~~ I,tstar,facloss)*deltau;
delPsbar=(K11+2*K12+?*K13+K14)16; delPscba~(K21 +2'K22+2'K23+K24)/6; Psbar=Psbar+delPsbar: Pscbar=Pscbar+delPscbar; ) )
fclose (data); )
float Fl(float tau. h a t Pscbar.float Psbar,float Cl,float Vr,float Ar,lloat Frt. h a t Avil.11oat tstar,iloat facloss) { return (Psbar*Av(stroke(tau.tstarj)*CI/Avi I-Ar*facloss*Pscbar*Frt)/Vr; }
float F?(float tau. h a t Psbar.1loat n.iloat FrvJloat Avi1,float tstar)
iloat g l ; gl = (Z*n-l)/n: return (-1 )*n*Frv*pow(Psbar.gl )*Av(stroke(tau.tstar))iAvi 1 ; )
float F3(float tau, float Psbar.float Pscbar.float Frv.float Vr.float Ar. float Frt,float 4vi I.iloat tstardloat facloss)
return (Psbar*~\(stroke(tau,tstar))*Frv/Avi I-Ar*facloss*Pscbar*Frtp'r. {
1
float FJ(float tau.float Psbar.kloat n. float Cl.kloat Avil.float tstar) : float g I ; g l =(Z*n-l)/n: return -n*Cl *pow(Psbar.~l)*Av(stroke(tau.rstar))/Avi I ; 1
tlaat Prnin(t1oat MI
if(M<=l) return 25:
, ,. else if(M<=1.8543) return 77.03j7+(79.08Y-27.0~j7)/0.j289*(M-l.525J): else if(M<=?.19) return ?9.089+(3 1.9-~9.089)/0.3357*(~l-1.85~31; else if(M<=?.j91?) return 31.93 jY. j6-jI.5Yl~O.JO1~*(.L1-Z.1Yl: else if(.LI<=j.OlOY) return j9.j6-(60.-1-j9.561~0..1197*(bI-2.j912~: else if(bI<=3.48621
36

else if(M<4) return 78.2325+( 1 lO-78.?325)/0.5 l38*(M-3.4862): else return 110; 1
float stroke(float tau,float &tar) { FILE *inputI=fopen("prvpos.txt"t"r"); FILE 'inputZ=fopen("prvpS.t?;t","r");
float t,t 1 ,t2,ti=O,Av I .Av2,Av3=0: t=tau*tstar:
1 while(t3<-t): fclose(inpuf.2);
rmm Avl+(Av2-Avl)*(t-tl)/(l2-~l); 1
float Av(floa1 stroke)
/*FILE *inputI=fopen("stroke.txt","r"): FI!,E *input2=fopen("stroke.txt"."r");
float t,tl,t2,0=O,Avl .AvZ,Av3=0;
(
t=smke;
do
float h!(float t.float Llinn (

if(K=l) return 3; else if(t<=2.3333) return 3+1'(t-1)/1.3333; else if (1-24) return Minf; else if(t<=28) return 4-3*(t-24)/4; else return I ; 1

Documentation Sheet ,
Class Unrestricted
No. of copies
National I Aerospace Laboratories
i i I
I
Title Prediction of Pressure Characteristics in Settling Chamber of 0.6m Wind Tunnel for supersonic testing Satvaieet Ratan Bhoi & Dr.G K Survanaravana I Autlzor(s)
I j Division NTAF I NAL Project NO. N-0-420 I
i Document No. PD NT 0809 ~ Date of issue March 2008
1 Contents: Pages Fl Figures T a b l e a Reference,
! External Participation - I
j sponsor NAL Approval Head, NTAF L
1 Kevwords Variable Mach no. Flexible Nozzle. Settling Chamber. Running Pressure Abstract
I t is proposed to augment the NAL 0.6m wind tunnel with a Variable Mach number Flexible Nozzle (VMFN enhance the testing capability from transonic to supersonic Mach numbers (up to 4.0). In order to avoid the start stop I c that are inherent in blow down wind tunnels, it is proposed to start the tunnel at a low Mach number (say I .O) and t increasing the Mach number by reducing the nozzle throat (maximum Mach number = 4.0) by continuously flexing nozzle walls; the reverse process is to be adopted while stopping. In such an operation, two important issues arise. Fir! the settling chamber pressure should always be maintained above the minimum ‘running’ pressure at any supersonic M number to avoid flow breakdown in the test section. Secondly, in order to maintain the free-stream dynamic pres! constant during the useful runtime and within desirable limits during the transition from Mach 1 .O to 4.0 and vice versa, Pressure Regulating Valve (PRV) must be operated in a closed - loop pressure control. In this report, the probler formulated based on assumptions of quasi-steady isentropic equations and a program is presented in C language to stud) nature of variation of stagnation pressure in the settling chamber for various trajectories of the opening of PRV and N number change. Good comparisons between the results predicted from the program and experimental data obtaine subsonic Mach numbers in the existing 0.6m wind tunnel are shown. Predictions for VMFN operation show that the sen chamber pressure rapidly builds up towards the value of storage tank pressure, when the VMFN nozzle throat reduces f Mach 1.0 to Mach 4.0 condition, presumably due to constriction of the flow passage at the first throat. Likewise, pressure rapidly falls when the VMFN reverses from Mach 4.0 to 1.0 condition. By suitably controlling the initial ope and the trajectory of opening and closing of the PRV, it is possible to ensure that the stagnation pressure in the sen chamb’er is always greater than the minimum (running) pressure that is necessary for stable flow in the test sec However, it is seen that during the transition from Mach 1.0 to 4.0 and vice versa, the free-stream dynamic pres overshoots to relatively high values, which has significance on model and balance design for aerodynamic force moment measurements at supersonic Mach numbers in the 0.6m wind tunnel.
Distribution Copy No. 1 to 2 : Head & Dy. Head
3 to 4 : Author(s) I 5 to 7 : Project Office/ Library


