TECHNISCHE UNIVERSIT ¨ AT M ¨ UNCHEN Leh rst uhl f ¨ ur funktionelle Materialien E13 Forschungsneut ronenquelle Heinz Maier-Le ibnitz Construction of a sputtering reactor for the coating and processing of monolithic U-Mo nuclear fuel Wolfgang Schmid Vollst ¨ andiger Abdr uck der von der Fakult¨ at f¨ ur Physik der Technischen Universit¨ at M¨ unchen zur Erlangung des akademischen Grades eines Doktors der Naturwissenschaften (Dr. rer. nat.) genehmigten Dissertation. V ors it ze nd er: Un iv.- Prof. Dr. Hara ld Fr ie dric h Pr ¨ ufer der Dissertation: 1. Univ.-Prof. Dr. Winfried P etry 2. Univ.-Prof. Dr. Peter B¨ oni DieDisse rt ation wurde am 28. Juli 2011 bei der T echnisc hen Universit¨ at M ¨ unchen eingereicht und durch die Fakult¨ at f ¨ ur Physik am 12. August 2011 angenommen.
Transcript
8/13/2019 Prediction of protein structural features by machine learning methods
The work presented in this thesis was conducted within the framework of the
fuel conversion research program at the research reactor ”Forschungsneutronen-
quelle Heinz Maier-Leibnitz” (or: FRM II) in Garching/Germany. The intention
of this program is to clarify, whether there is a possibility to convert FRM II from
its current nuclear fuel, that contains highly enriched uranium (235 U content of
93%), to a new one that is significantly lower enriched (235 U content ≤ 50%). The
problems related to a fuel conversion like this touch the fields of reactor physics,
metallurgy, engineering and processing technology as well as economic aspects
and national and international political guidelines.
This first chapter briefly describes the background of the fuel conversion researchprogram, and explains the present need for a high density nuclear fuel. It also
locates this thesis into the frame of current international fuel development activ-
ities.
1.1 Background
The considerations to build a high flux research reactor at the Technische Univer-
sitat Munchen (or: TUM) reach back to the 1970s [boe98]. Already before 1980
first design works and calculations for a compact reactor core, that use a fuel
containing highly enriched uranium, started in the group of Prof. Glaser. The
compact core concept was presented for the first time 1981 at the ’International
Conference on Neutron Irradiation Effects’ and was first published in 1982 in the
’Journal of Nuclear Materials’ [boe82]. In the following years, it was continuously
enhanced.
In 1987, first funds were granted by the Bavarian Government, and the so called
”Projektgruppe FRM II” (’project group FRM II’) could be established that started
to work out a detailed physical and technical concept for the construction of a
1
8/13/2019 Prediction of protein structural features by machine learning methods
new research reactor at TUM. The German ”Wissenschaftsrat” (’scientific advi-
sory committee’) examined the project in 1989 and concluded its examination
with a strong recommendation for the construction of a high flux research reactor
in Garching [gla99]. The nuclear licensing process started in 1993 and continueduntil 2003 when the ”3. Teilbetriebsgenehmigung” (’third partial operational li-
cense’) was finally granted. FRM II was constructed from August 1996 to January
2001 and the first criticality was reached at 2nd of March in 2004 [her04].
1.1.1 FRM II
FRM II combines the technical and regulatory advantages of a research reactor of
relatively low thermal power with the neutron flux and usability of a large high
power neutron source. It has the purpose to serve as a strong neutron source for
science, industry and medicine. Therefore the main aim for the operation of FRM
II is to provide a maximum neutron flux to its users for as many days per year as
possible.
Construction Regarding the basic design, FRM II is a so called beam tube
reactor with a pool. Figure 1.1 shows a cut view of the FRM II pool region. The
core of the reactor is a single fuel element in the middle of an Al tank filled
with high purity D2O. The tank is at the bottom of the H2O containing pool.Huge tubes, filled only with He, penetrate the pool walls and the D 2O tank and
are arranged tangentially around the fuel element. These ’beam tubes’ allow
the neutrons to leave the area close to the core and to reach the experiments,
while their tangential arrangement avoids a direct line of sight contact and
thus prevents the gamma radiation emitted from the fuel element to reach the
experiments.
The fuel element is the primary neutron source in the core region of FRM II. It
produces fast neutrons (E ∝ 2 MeV) by nuclear fission, that are quickly mod-
erated to thermal energies (E ∝ 25 meV) in the D2O moderator. The D2O also
’conserves’ the neutrons, as it has a very small neutron absorption cross section
(σ ≈ 1.32 mbarn). Therefore a high thermal neutron flux of up to 8 ·1014 ncm2s
can
build up in the D2O volume around the fuel element. This flux is extracted via
the beam tubes but also used to supply several secondary neutron sources as the
hot neutron source (for epithermal neutrons, E ∝ 10 eV), the cold neutron source
(for cold neutrons, E ∝ 10 meV), the ultra-cold source (for ultra-cold neutrons, E
∝ 100 neV) or the converter plate (for fast neutrons, E∝ 2 MeV). With its primary
and its secondary sources FRM II can thus provide a wide spectrum of epither-
mal, thermal and subthermal neutrons for wide variety of applications. Figure
2
8/13/2019 Prediction of protein structural features by machine learning methods
Figure 1.1: Cut view of the FRM II pool region (from [for09]). The D2O moderator tank is po-sitioned at the bottom of the H2O pool. During operation the fuel element is mounted inside avertical channel that leads centrally through the D2O tank and is part of the cooling circuit. TheD2O tank houses also the secondary neutron sources. Beam tubes filled with He represent open-ings in the D2O volume, that also works as a reflector, and allow the neutrons from primary andsecondary sources to leave the core area and to reach the experiments. The H2O pool outside hasprimarily no meaning for reactor physics but serves as a biological shielding. Next to the H2Opool is a storage pool for spent fuel elements.
3
8/13/2019 Prediction of protein structural features by machine learning methods
Figure 1.2: Top view of the FRM II core region with its concentric structure (from [for09]). The
closed D2O moderator tank (blue area) is located at the bottom of the H 2O containing pool (greenarea). The pool itself is limited by the pool wall (gray). A vertical tube leads through the centerof the D2O tank. The fuel element and the control rod are positioned inside this chimney (pinkcircle). Inside the D2O there are four secondary neutron moderators (called ’hot source’, ’coldsource’, ’ultra-cold source’ and ’converter plate’) located close to the fuel element as well as apositron source and several irradiation positions. Ten horizontal beam tubes (denoted as bt 1 - 10)are arranged tangentially and allow neutrons from the primary and secondary sources to leavethe core region and reach the experiments.
1.2 shows a top view of the core region with the ten beam tubes as well as the
primary and secondary neutron sources.
Compact core The design of the FRM II reactor core is based on a compact core
concept that was developed at TUM [boe82]. The core contains only one single
fuel element at the center of a moderator tank filled with high purity1 D2O (see
figure 1.3).
A stream of H2O flows through channels inside the fuel element and guarantees a
permanent cooling during operation. Both the D2O in the moderator tank around
1D2O is usually contaminated by H2O. In FRM II the H2O impurity in the D2O has to be ≤
0.2 %. Otherwise the neutron absorption in the tank will be too large to allow a criticality in the
reactor.
4
8/13/2019 Prediction of protein structural features by machine learning methods
Figure 1.3: Cut view of the FRM II core region (from [for09]). The fuel element is positioned insidethe central channel. Inside the fuel element there is the control rod that is used to regulate reactorpower. During reactor operation the fuel element produces a thermal power of 20 MW. A majorfraction of this power (about 19 MW) is removed by the primary cooling circuit, i.e. cooling water(H2O) from the primary circuit streams from the top side through the fuel element and back tothe system. The remaining power is deposited into the D2O moderator and transported into thepool by natural convection. The D2O moderator tank is however a closed system and completelyautarkic from the primary cooling circuit and the pool.
the element and the H2O inside the cooling channels of the element serve as neu-
tron moderators. The D2O further has the function of a neutron reflector for the
fuel element. The whole arrangement of fuel, surrounding D2O and internal H2O
allows to reach criticality even tough the fuel element is very compact and its ura-
nium load is with 8.1 kg (7.5 kg 235 U) small compared to other high flux reactors2.The compactness on the other side provides inherent safety features as well as a
very high thermal neutron flux of up to 8·1014 ncm2s
at a reactor power of only 20
MWth3. Because of the special compact design FRM II is currently the reactor
with the highest ratio of neutron flux to reactor power in the world [for09].
2High Flux Isotope Reactor (HFIR, Oak Ridge National Lab): uranium load 10.1 kg (9.4 kg235U) [xou04], Reacteur Haut Flux (RHF, Institut Laue Langevin): uranium load 9.2 kg (8.6 kg235U) [mo89].
Fuel element The fuel element of FRM II is an upright standing cylindrical ar-
rangement of 113 single fuel plates inside a cylindrical tube (see figure 1.4).
All fuel plates are involutely bended along their short side. Aluminum spacers
and combs keep the plates in position and guarantee a constant gap of 2.2 mm
between each pair of plates for an equal distribution of cooling water stream.
A control rod of metallic Hf with a Be follower is located and moved inside the
cylindric central channel of the fuel element. At the beginning of a reactor cycle
it is nearly completely inside the fuel element and during reactor operation it is
moved more and more out of the central channel as the burnup 4 of the fuel in-
creases. A B ring, located at the bottom of the fuel element, has the function to
avoid the formation of undesired large temperature gradients along the height of
the element.
Every fuel element can be operated for a total of 60 days at a maximum thermalpower of 20 MW, which is denoted as one reactor cycle, until the control rod is
completely drawn out from the central channel. At this point the excess reactiv-
ity5 of the fuel element approaches zero and it has to be replaced. The fuel has
then reached an average 235U burnup of 20.4% [bre11].
Fuel FRM II uses the intermetallic compound U3Si2 as a nuclear fuel. The mate-
rial contains U with an 235U isotope content of 93 at%, which is the fuels´ primary
fissile isotope [nud00]. A grinded powder of the U3Si2 fuel is embedded into an
Al matrix forming a so called U3Si2-Al ’meat’ structure. There are two coherentmeat zones in a fuel plate (see figure 1.5): an inner zone with a U3Si2/Al volume
ratio of 27 vol%6 and an outer zone with a U3Si2/Al volume ratio of 14 vol%. The
meat zones have a size of together 700 mm x 62.4 mm and a thickness of 600 µ m.
They are completely surrounded by a so called ’cladding’ layer consisting of the
alloy AlFeNi7 with 380 µ m thickness (see figure 1.5). The final structure, the fuel
plate, has a size of 720 mm x 76 mm and a thickness of 1360 µ m [har04].
1.1.2 RERTR program
The ’Reduced Enrichment for Research and Test Reactors’ (or: RERTR) program
was launched in 1978 by the US-Department of Energy (DOE). The aim of the
program is to provide the fuel technology and the analytical support required
4The percentage of the initial fissile isotope inventory that has been consumed by fission is
denoted as ’burnup’.5Excess reactivity denotes the amount of surplus reactivity over that needed to achieve criti-
cality in the reactor. Excess reactivity is brought into a reactor by the installation of additional fuel
in the core and is supposed to compensate fuel burnup and the buildup of neutron poisons.6Also called fuel volume loading, see substection 1.2.2.
7See table 3.3 in chapter 3 for the exact composition of this Al alloy
6
8/13/2019 Prediction of protein structural features by machine learning methods
Figure 1.4: Cut of the FRM II fuel element (fuel element model from [bre11]). The fuel is containedin 113 single fuel plates that are mounted between an inner and an outer tube. Between each twofuel plates there is an equidistant gap that allows cooling water to flow between the plates. Asieve that is located above the fuel plates stops particles that are larger than the gap between the
plates and could possibly block the cooling channels. The inner tube defines the central channelwhere the control rod is located during reactor operation. The outer tube is the hull tube thatreinforces the structure. On the bottom a B ring surrounds the fuel element. B is a potent neutronpoison (σ abs = 764 barn), and the ring has the effect of suppressing the neutron flux in the bottomarea of the fuel element. This limits the local fission power density at the beginning of the cycleand thus avoids local hot spots.
7
8/13/2019 Prediction of protein structural features by machine learning methods
Figure 1.5: The fuel element is an arrangement of 113 involutely shaped fuel plates (fuel elementmodel from [bre11]). Each fuel plate has a size of 720 mm x 76 mm and a thickness of 1360 µ m. Itconsists of a meat kernel that is surrounded by an AlFeNi cladding layer of 380 µ m thickness. Themeat itself is composed of U3Si2 fuel powder dispersed into an Al matrix. The U 3Si2/Al volumeratio is 27 vol% for the inner meat zone and 14 vol% for the outer meat zone.
8
8/13/2019 Prediction of protein structural features by machine learning methods
to convert research and test reactors worldwide from nuclear fuels that utilize
highly enriched uranium (HEU8) to fuels based on low enriched uranium (LEU9)
[rob09].
Since 1978 about 40 reactors could be converted to LEU by using traditional fueltypes including U3Si2 [rertr]. Anyhow, some research reactors were identified,
that cannot be converted by this fuel types for several reasons, and FRM II is one
of these reactors. A conversion of these facilities would need novel fuel materials
with a very high uranium density.
Obligation Today FRM II is the only research reactor in Germany that uses nu-
clear fuel containing HEU. As the operator of FRM II, TUM has engaged itself
to take all necessary measures to reduce the uranium enrichment of the used
fuel to ≤ 50 at% if it is technically feasible without compromising the operationof the facility [tg3]. TUM is therefore participating in the RERTR program and
also established its own fuel conversion research program [boe04]. The aim of
this program is an investigation of possible high-density nuclear fuels, that could
allow a conversion of FRM II (see subsequent section), and a study of the metal-
lurgy and the behavior of these materials under the irradiation conditions given
inside a reactor core. However, the program aims as well towards a near-term
utilization of these fuel materials, i.e. its activities also involve the development
of techniques for high-density fuel plate fabrication.
1.1.3 Conversion
Different conversion scenarios for FRM II were investigated by the fuel conver-
sion research program [boe02],[boe04]. A prerequisite for all of these scenarios
was a conservation of the very high safety standard and the scientific quality of
the neutron source [boe04].
Conversion considerations A first main result gained by the fuel conversion
research program was the conclusion, that any realistic and technically feasible
conversion scenario for FRM II could only concern the nuclear fuel itself, as
the size and geometry of the fuel element and the reactor power should retain
unchanged [boe02],[boe04]. Alternative scenarios, that are based on a change
of size or geometry of the fuel element, or that try to increase reactor power,
would require a major modification of core components or reactor systems and
therefore generate enormous costs and a long reactor downtime, which both
should be avoided.
8According to IAEA defined as uranium with ≥ 20 at% 23 5U isotope content.
9According to IAEA defined as uranium with ≤ 20 at% 23 5U isotope content.
9
8/13/2019 Prediction of protein structural features by machine learning methods
As already mentioned, the aim for the operation of FRM II is to provide its
users a maximum neutron flux at a maximum cycle length. To preserve both
parameters at a reduced level of fuel enrichment means, that the 235 U inventory
in the core has to stay constant. In fact, it has even to be increased, as a lowerfuel enrichment also means a higher concentration of the neutron absorbing238 U, and the additional absorption has consequently to be compensated by an
additional increase of the 235 U inventory. Therefore, the fuel element used after
conversion would indeed have a lower enrichment of 2 35U, but at the same time
it would have to contain a much larger amount of 235 U and therefore a much
larger total amount of U than the present fuel element.
Both factors together, an increased 235 U inventory at a lower enrichment and a
fixed size and geometry of the fuel element, lead to the conclusion, that the fuel
material in a converted fuel element has to provide a much higher U density thanthe U3Si2 that is used today, as the additional U inventory can only be stored in
the given geometry by increasing the fuel density.
Conversion scenario Rohrmoser calculated the necessary amounts of U and235 U as well as the necessary U density of a fuel material for the given fuel el-
ement geometry and the given prerequisites [roe05]. Figure 1.6 illustrates the
results graphically. As already mentioned, the inventories of 235U and U have to
be increased more than linearly with decreased enrichment due to absorption in238 U. As the fuel volume is fixed, the fuels’ U density has to increase more than
linearly just as well. An upper limit for the U density and likewise for the U and235 U inventory in the fuel element is given by the density of pure metallic U in
the alpha phase with 19.06 gU cm3 [hol58], as no material can have a larger U den-
sity. This natural U density maximum defines the theoretical lowest achievable
enrichment for a FRM II fuel element with about 31 at%235 U, which is just one
third of the present enrichment and far below the 50 at% value that was obligated
for FRM II by contract, but is still above the maximum enrichment of LEU. Figure
1.6 thus clearly shows, that it is not possible to convert FRM II to a fuel based onLEU under given circumstances (see also [bre11]). It further shows, that any real-
istically feasible conversion scenario for FRM II requires a HEU fuel with reduced
enrichment (which is often referred to as ’medium enriched uranium’ or ’MEU’)
but increased U density.
The dispersed U3Si2 fuel used today in FRM II has a maximum U density of up
to 3.0 gU cm3 with an 23 5U content of 93 at%. To reach an enrichment value of 50 at%,
about 8.0 gU cm3 will be necessary. So theoretically a nuclear fuel needs to have a
U density between 8.0 - 19.06 gU cm3 and would by that allow an enrichment of 31
- 50 at%235 U in a conversion scenario. Unfortunately, at the moment there is no
10
8/13/2019 Prediction of protein structural features by machine learning methods
Figure 1.6: Correlation between required 235 U mass, total U mass, U density and 235 U enrichmentof a fuel assuming the present geometry of the FRM II fuel element (according to [roe05]). Themasses are given as inverse values, as lower enrichment of course means larger inventories of both U (green graph) and 23 5U (blue graph). The inventory of 2 35U increases more than linearlywith decreasing enrichment, as smaller fraction of 23 5U means a higher fraction of 23 8U and thusa higher absorption. The U density of the fuel (pink graph) is determined by the total U inventory
and the fixed fuel volume in the fuel element. A ’conversion window’ (purple area) results, whenthe minimum required U density of 8
gU cm3 and the maximum possible U density of 19
gU cm3 are
considered. The mass, density and enrichment parameters of all feasible conversion scenarios arelimited to the values covered by this window.
11
8/13/2019 Prediction of protein structural features by machine learning methods
qualified high-density nuclear fuel that can provide an U density of this order of
magnitude.
1.2 High density fuels
To identify an appropriate high-density nuclear fuel material, the necessary prop-
erties have to to be specified. The properties themselves together with the way of
assembly then specify the composition of the fuel.
1.2.1 Properties
The technically relevant properties that allow to use a material as a nuclear fuel
are its fissile isotopes density, its thermal conductivity as well as its expansion
behavior under the influence of heat and radiation (also referred as dimensional
stability).
Fissile isotopes density The technically relevant fissile isotopes are 2 33U, 2 35U,239 Pu and 2 41Pu. Only 235U will be focused here as fissile isotope, as it is the pri-
mary fissile isotope in the fuel element of FRM II.
It was shown in the previous section, that fuel with a U density of at least 8.0 gU
cm3
will be necessary to convert FRM II to ≤ 50 at%235U enrichment. This value can
be seen as a fixed lower limit for our further considerations. The upper limit of U
density is not fixed but given by the particular composition of the fuel that will be
used. Pure metallic U would provide the maximum possible U density of 19.06 gU cm3 , but is out of question as it shows an instable behavior under reactor condi-
tions (see also appendix A3). The addition of certain materials to U can stabilize
its behavior, but automatically reduces the U density of the fuel. Therefore 19.06 gU cm3 can somehow be seen as the natural upper limit for U density, but realistic U
densities will be well below this value.
Thermal conductivity The thermal conductivity of the U3Si2-Al fuel (U3Si2 dis-
persed in Al) currently used in FRM II is in between the thermal conductivities
of pure Al (235 W m·K ) and pure U3Si2 (15 W
m·K ) and determined by the degree of
dispersion. Dependent on the fuel volume loading, it has a value of about 109W
m·K for 27 vol% U3Si2/Al volume ratio respectively about 165 W m·K for 14 vol%
U3Si2/Al volume ratio. The temperatures reached thereby in the fuel are approx-
imately 130 C [bre11]. These parameters are not fixed however and can be varied
within reasonable limits when converting to a new fuel material. Moreover it is
hardly possible to give a defined lower limit of thermal conductivity before the
12
8/13/2019 Prediction of protein structural features by machine learning methods
fuel selection, as this depends strongly on the composition of fuel material used
and the temperatures it can tolerate.
Dimensional stability In contrast to the fissile isotope density and thermal con-
ductivity, that immediately affect the behavior of the reactor, the dimensional sta-
bility of the fuel gets important when the reactor is operated for longer times. It
is self-evident that major deformations of reactor core components are in general
undesired as it always imposes the danger of malfunctions, damages or even ac-
cidents. Nevertheless, a certain amount of deformation, the so called ’swelling’,
will appear in fuel elements and cannot be avoided. It is possible already during
the construction of a fuel element to account for a certain amount of swelling and
thus to control this effect. If the swelling is however larger than the accounted
amount, the undesired potentially dangerous situation is given again. It is there-
fore necessary to understand the swelling effect in fuel elements and to minimize
it.
The swelling of fuel elements is in general always a result of a change in the geom-
etry of fuel and cladding materials during reactor operation. The reason for this
change are heat and radiation driven effects that include phase transformations,
diffusion and diffusion induced chemical reactions between different materials,
the accumulation of fission products in the fuel matrix. To reduce the swelling to
a minimum amount, these effects have to be reduced or avoided if possible.
For the FRM II fuel element the swelling effect is especially critical, as a thick-ness increase of the fuel plates narrows the width of the cooling channels in be-
tween the single plates. Swelling directly lowers therefore the cooling water flux
through the fuel element and thus increases the fuel temperature during opera-
tion. The maximum acceptable fuel temperature sets here a limit for an acceptable
amount of controlled swelling. The appearance of uncontrolled swelling has to
be avoided completely.
1.2.2 AssemblyThere are two common types of fuel assembly for research reactors, plate type
and pin type. Only the plate type should be considered here, as it allows a higher
power density and is therefore used by all high flux reactors worldwide.
In plate type fuel elements, the fuel is contained in plates or blank sheets that can
be flat or bent. The plates consist of a central meat region as well as a cladding
around the meat. There are two existing designs of meat: so called monolithic
meat, that consists only of pure fuel material, and so called dispersed meat, where
the U-Mo fuel material is distributed inside a matrix material. Generally the meat
layer is always completely surrounded by a cladding, which is the only barrier
13
8/13/2019 Prediction of protein structural features by machine learning methods
Dispersed meat Dispersed meat is formed by a fuel powder which is embed-
ded into a carrier matrix, so that nearly every fuel powder grain is surrounded by
the matrix material. This design provides a large contact area between fuel and
carrier matrix and guarantees a good heat removal from the single fuel grains.
Due to this the dispersed meat can be operated at high power. However it also
offers a large interaction area for reactions between fuel and matrix material and
for heat and radiation driven atomic migration between both.
Dispersed meat was investigated since the 1950s [fue57] and the existing tech-
nologies for manufacturing it are simple and well developed. A drawback of dis-
persed meat is the fact, that with increasing fuel to matrix volume ratio (or: fuel
volume loading) the thermal conductivity of the dispersed meat decreases drasti-cally [cah94]. Furthermore from manufactors experience a fuel volume loading of
55 vol% seems to be the upper limit reachable for a commercially viable process
[sne96].
Monolithic fuel Increasing the fuel volume loading of the meat to 100 vol%
one reaches the so called monolithic fuel. Here the meat is one single massive
fuel layer that is surrounded directly by the cladding. This design offers the ad-
vantage of a small interaction area between fuel and cladding and the maximum
achievable fuel volume fraction [cla03]. Unfortunately, it has also the disadvan-tage that the heat transport from the fuel into the cladding and further into the
cooling water is mainly dependent and limited by the thermal conductivity of the
fuel.
At the moment, the technologies for manufacturing monolithic fuel are in devel-
opment.
Cladding The cladding fulfills two very important functions in the fuel ele-
ment: first, it provides the thermal contact between meat and cooling water that is
needed to remove the fission heat from the fuel. A good thermal contact betweenmeat and cladding guarantees a steady and predictable transport of the fission
heat from the fuel into the cooling water. If this contact worsens10, a steady heat
removal from the fuel cannot be guaranteed any more and the fuel temperature
rises to some new equilibrium temperature or, in the worst case, even to the fuels
melting point. Second, it separates the fuel and the fission products that accumu-
late during reactor operation from the cooling water outside. A separation of the
fuel from water is mandatory, as otherwise the hot unprotected fuel would face
10The two reasons for a worsening of the thermal contact are a delamination of meat and
cladding or the buildup of new phases or chemical compounds between fuel and cladding.
14
8/13/2019 Prediction of protein structural features by machine learning methods
Table 1.1: Some high-density uranium compounds that were identified during the US screeningcampaign in the 1990s (according to [sne96]). In subsequent investigations it was found, that noneof them is suited to be used as high-density nuclear fuel.
a massive chemical erosion in the quick stream of cooling water. A retainment of
the fission products within the cladding is also desirable, as otherwise the cooling
water and the cooling system of the reactor would be massively contaminated.
Both functions are of outstanding importance for the operation and safety of the
reactor. Therefore the integrity of the cladding and a stable thermal contact be-
tween fuel and cladding have to be guaranteed at any time.
1.2.3 Composition
From the view of reactor physics, it is usually not necessary to contain fissile iso-
topes into fuel alloys or compounds, as only the types of present nuclides, their
cross sections for interactions with neutrons and their three-dimensional arrange-
ment are of relevance. From the view of engineering, materials science and solid
state physics, the use of such compounds or alloys is however mandatory most
of the time to construct a realistically and safely working fuel element.
Material selection Mid of the 1990s, working groups at the Argonne NationalLaboratory (or: ANL) and later at the Idaho National Laboratory (or: INL)
started an effort to develop dispersed fuels with an U density of 8 - 9 gU cm3 for
the RERTR program [sne96]. They screened the relevant literature to identify all
known uranium alloys and compounds that offered available material data and
had a density greater than U3Si2. Tables 1.1 and 1.2 show a selection of some of
the alloys and compounds that were identified during this screening.
From the list of identified fuel materials only those with a bulk U density of at
least 15 gU cm3 were considered for further investigations. This value comes from
15
8/13/2019 Prediction of protein structural features by machine learning methods
Table 1.2: Some high-density uranium alloys that were identified during the US screening cam-paign in the 1990s (according to [sne96],[hof99]). The RERTR irradiation scoping campaigns re-vealed, that binary and ternary uranium molybdenum (U-Mo) alloys with 6 - 10 wt% Mo contentshow an excellent irradiation performance and could be suited to be used as high-density nuclearfuels.
the fact, that the U density of a dispersed fuel is given as the bulk U density of the
pure fuel material times the fuel volume loading in the dispersion. Accounting
the maximum produceable fuel volume loading today, which is 55 vol% [sne96],
a bulk U density of at least 15 gU cm3 would thus be necessary to reach a dispersed
U density of 8 - 9 gU cm3 . The remaining materials consisted of U alloys with small
amounts of other metals and of intermetallic U compounds of the structure U6X
(like U6Fe or U6Mn).
The selected high-density fuel materials were reviewed concerning their irradia-tion behavior. Several irradiation tests indicated, that all U6X compounds could
be subject to so-called breakaway swelling11 or show other poor swelling prop-
erties [hof87], thus they were excluded from further study.
Dispersed samples of the remaining U alloys were tested in two low tempera-
ture irradiation scoping campaigns at the ATR reactor at INL called RERTR-1
and RERTR-2. Post-irradiation examinations (or: PIEs) of the samples revealed,
that binary and ternary alloys of U with 6 - 10 wt% Mo content show an excel-
lent irradiation performance up to high burnups while all other alloys performed
poorly [sne99],[mey02]. Subsequent studies were therefore focused mainly onU-Mo alloys.
1.2.4 U-Mo alloys
A series of further irradiation campaigns followed to study the ’in-pile behav-
ior’12 of dispersed U-Mo alloys at high temperatures, heat fluxes and burn-ups
11The term breakaway swelling denotes a swelling that has led to a material volume increase
of ≥ 100% [que98].
12The term ’in-pile’ denotes the conditions inside a reactor core during reactor operation.
16
8/13/2019 Prediction of protein structural features by machine learning methods
(see table 1.3). These tests were necessary steps on the way to qualify these mate-
rials as nuclear fuels.
IDL formation Although RERTR-1 and RERTR-2 had demonstrated very
promising results, later irradiation campaigns revealed an unexpected problem.
At elevated temperatures, an irradiation supported diffusion process could be
observed between the dispersed U-Mo and the Al matrix, that leads to the for-
mation of a so-called interaction diffusion layer (or: IDL) between both mate-
rials [mey00]. The fuel/matrix interaction product showed a very bad thermal
conductivity that worsened the heat contact between fuel and cladding signif-
icantly. Moreover, it was subject to porosity formation in the meat resulting
in an increased swelling behavior, and was prone to the formation of large fis-
sion gas bubbles that eventually lead to the onset of breakaway swelling andmeat/cladding delamination at higher burn-ups [mey00],[ham05],[wac08]. The
worldwide research activities thus focused on the topic IDL formation and pre-
vention.
IDL prevention A first and very simple idea to reduce IDL formation was the
minimization of contact area between U-Mo and Al. The so-called monolithic fuel
design, where the U-Mo fuel is no longer dispersed as small grains in the Al but
only present as one compact structure, is based on that idea. Several irradiation
campaigns showed the effectivity of this measure (see table 1.3). Unfortunately,
the monolithic design cannot completely avoid IDL formation and has the disad-
vantage of reduced thermal conductivity.
Another idea that is also under investigation is to apply certain additives to the
U-Mo fuel or to the Al matrix that slow down IDL formation. This measure was
proposed as a way to form interaction products more similar to the stable materi-
als observed for example in U3Si2 based dispersion fuels. The addition of Ti, Zr,
V, Nb, Pt, Bi, Mg and Si to the fuel as well as to the Al matrix was investigated
extensively and first results are promising [hof06],[par05] [kim05],[jun11].
A way not only to reduce but to completely avoid IDL formation could be to re-place Al in the fuel system. For the dispersed fuel design it was attempted to
replace the Al matrix by a Mg matrix, as Mg does not react with U. However, it
turned out that the manufacturing of a Mg matrix fuel is extremely difficult due
to matrix/cladding interactions during fabrication [dub06]. Similar problems are
expected for other alternative matrix materials as well. Therefore the topic was
not further studied and other alternative matrix materials have not been investi-
gated up to now. For the monolithic fuel design a replacement of the Al cladding
by Zr cladding was studied13 [ari10]. The measure had the desired effect and
13More precisely the Zr alloy Zry-4 was used, see table 3.3 for the composition.
17
8/13/2019 Prediction of protein structural features by machine learning methods
RERTR-8 matrix Si addition IDL between fuel and claddingRERTR-9 [wac08].
AFIP-1 dispersed Si addition reduces IDL formation and
IRIS-3 full-size plates porosity [rob10].
IRIS-TUM matrix Si addition
AFIP-2 monolithic Good performance, no delamination,
AFIP-3 full-size plates formation of thin IDL [rob10].
Si and Zr barriers
IRIS-4 dispersed Si addition reduces IDL formation.
full-size plates Only minor influence of oxide coating
matrix Si addition [rip09]
oxide coated particles
Table 1.3: Brief review of the most important irradiation campaigns worldwide to test the in-pileperformance of U-Mo alloys. Descriptions and results are very much simplified. For more detailssee the cited publications.
18
8/13/2019 Prediction of protein structural features by machine learning methods
no IDL formation could be observed during irradiation. The low thermal con-
ductivity of Zr (22.6 W m·K ) is however considered as a fundamental problem of Zr
cladding, and thus was not accepted as satisfying solution to the problem.
The most promising idea today to avoid IDL formation in both the dispersed aswell as monolithic fuel design is the separation of U-Mo and Al from each other
by a barrier of an appropriate third material. For dispersed meat, a coating should
surround each single fuel grain inside the matrix, for monolithic meat it should
surround the monolithic fuel core. An appropriate coating material is supposed
stop radiation enhanced thermal diffusion reactions by replacing Al in the dif-
fusion process, either by not forming reaction products with U-Mo at all or by
forming only stable reaction products.
Barrier application Several methods to apply diffusion preventive barrier coat-ings onto dispersed and monolithic U-Mo fuel have been investigated in the last
years. Most of them work however only for certain barrier materials.
Oxide coatings for dispersed fuel grains were produced simply by the oxidation
of hot U-Mo fuel during air contact. It has been shown however, that coatings
from UO2 have only a small effect on IDL formation [rip09],[jun11]. A similar
nitridation reaction can be used to create UNX coatings, if hot fuel is exposed to
a pure nitrogen atmosphere. KAERI is currently testing UNX coatings created by
this method, the irradiation behavior of UNX hasn´t been studied yet.
Pasqualini proposed chemical vapor deposition (CVD) to coat U-Mo fuel [pas04].He used a chemical reaction based on silane to condense Si on the surface of U-Mo
fuel powder. The same method seems to be feasible as well for monolithic fuel. Si
has proven to decrease IDL formation by the formation of U3Si2. Silanes are how-
ever known to be dangerous in handling, as these substances are extremely toxic
and highly reactive. Pasqualini also describes dipping and painting as methods
to coat monolithic U-Mo fuel foils [pas04]. The foils are dipped into or painted
with appropriate chemicals to form Mg and Ge coatings. The effect of coatings of
this type has never been tested however.
Plasma spraying has been used to apply Si coatings [moo08] as well as ZrN
[izh09] onto monolithic U-Mo fuel. Coatings of ZrN have shown to strongly de-
crease IDL formation during irradiation.
The current standard process to coat monolithic U-Mo fuel is colamination dur-
ing U-Mo foil fabrication [moo08]. Zr coatings of 20 µ m thickness have proven to
nearly prevent IDL formation. The co-rolling process is however extensive and
error-prone [tec08].
A technique, that is well known and widely used for the application of coat-
ings is sputter deposition. In contrast to all of the mentioned techniques, sput-
ter deposition could be used to apply any type of coating onto U-Mo fuel. This
promising method is thus investigated in the framework of the FRM II fuel con-
19
8/13/2019 Prediction of protein structural features by machine learning methods
version research program. Currently groups at FRM II [ste11] and at SCK/CEN
in Mol/Belgium [van10] investigate the process for the dispersed fuel design. The
application of the process for the monolithic fuel design, which is also the major
topic of this thesis, is currently only investigated by a group at FRM II [jar09].
1.3 Aim of thesis
The basic idea to use ion sputter erosion and deposition on monolithic U-Mo
fuel was developed at TUM already in 2006 [pat06]. The technique provides the
possibility of coating, cleaning and processing of the material, and thus seemed
to have several possible applications in the field of fuel fabrication. This thesis
represents the first detailed investigation of this topic. The aim of the thesis wastherefore to realize an experimental setup, that allows to perform both sputter
erosion and deposition on full-sized monolithic U-Mo fuel, and to investigate a
potential application of the process in fuel fabrication.
20
8/13/2019 Prediction of protein structural features by machine learning methods
Sputtering occurs over a wide range of projectile energy, beginning at some elec-
tron volts (eV) up to the MeV range and even above. However only sputtering
with ions as projectile particles at energies in the eV and low keV energy range
is technically easy to realize and relevant for industrial applications. This thesistherefore focuses exclusively on low energy ion sputtering.
Definition Material ejection during the particle bombardment of a targets´ sur-
face is not necessarily the result of sputtering. Processes like evaporation due
to beam heating or structural modifications like blistering of flaking also lead to
material ejection, but are not denoted as sputtering. Only in the case that even a
single ion may in principle lead to an atom ejection, sputtering is given.
Physical and chemical sputtering An atom ejection after ion impact can be the
result of a collision cascade induced by the energy and momentum transfer of
the ion. It can also be the result of a chemical reaction induced by the ion, that
releases energy or generates a chemical instable compound on the surface of the
target [beh81]. Both effects are denoted as ’sputtering’, the first non-reactive one
as ’physical sputtering’, the last reactive one as ’chemical sputtering’. In purephysical sputtering, the ejected atoms receive enough energy to overcome the
surface binding by a collision or ionisation cascade. In pure chemical sputtering,
molecules are formed on the surface of the target due to a chemical reaction be-
tween the incident ions and the target atoms, which have a binding energy low
enough to desorb at the current target temperature. It is the common principle
of physical and chemical sputtering, that enough energy has to be transfered to
the ejected atoms, that the binding forces exerted by the target can be overcome.
Whether this energy is of kinetic or chemical origin is not of relevance.
Usually pure physical sputtering appears exclusively when noble gas ions are
used for bombardment. For reactive ions a mixture of physical and chemical
sputtering can be observed, as bombardment of a solid surface with other than
noble gas ions usually leads to a chemical reaction between the incident ions and
the atoms of the solid. For ion energies in the low eV range this reactions accom-
pany or even dominate the physical sputtering effect. For higher energies the
chemical reactions follow the physical sputtering and may even be merely a side
effect. To separate physical and chemical sputtering from each other the ejection
mechanism is regarded. However the borderline between both is not sharp. For
small binding energies, the distinction whether a physical or chemical sputtering
effect is present is often difficult [beh83].
22
8/13/2019 Prediction of protein structural features by machine learning methods
Sputtering is initiated by the collision of a bombarding ion with surface atoms of
the sputtering target. If the ion is not reflected immediately it will penetrate thetarget material. Depending on the mass and type of ion and target atoms and de-
pending on the kinetic energy involved, the ion will undergo elastic and inelastic
collisions with the target atoms, loose energy and probably be neutralized on its
way through the target material. Finally the ion will either come to rest within
the target material (i.e. it is ’trapped’ respectively it undergoes a chemical reac-
tion) or it will be able to escape through the target surface with reduced kinetic
energy. Noble gas ions can generally be trapped only at damage sites in the target
material or precipitate as separate phase like gas bubbles [beh83]. Reactive ions
can be dissolved or may form a compound phase in the target material or on thesurface.
Collision regimes In an elastic collision process the kinetic energy is conserved,
which means that the initial kinetic energy of the projectile particle distributes
into the kinetic energies of all particles involved in the collision. For metallic sput-
tering targets elastic collision processes are most important [beh81], as the con-
duction electrons guarantee a quick distribution of the collision energy between
the target atoms. In an inelastic collision reaction kinetic energy is not conserved
but to a certain fraction channeled into excitation reactions. For non-conductivesputtering targets inelastic collisions may produce significant numbers of excited
electronic states with lifetimes long enough to transfer their energy into atomic
motion [beh81] and sputtering reactions.
Regarding the devolution of a collision, it is convenient to distinguish between
three qualitatively different situations or ’regimes’, that basically depend on the
collision energy [beh81] and are shown in figures 2.1 a-f.
For elastic collisions the ’collision regimes’ are denoted as ’single-collision
regime’ (see figure 2.1a), ’linear cascade regime’ (figure 2.1b) and ’spike regime’
(figure 2.1c), in the case of inelastic collisions the regimes are defined quitesimilar as ’localised ionisation regime’(figure 2.1d), ’linear ionisation cascade
regime’(figure 2.1e) and ’spike ionisation regime’(figure 2.1f).
As we delimit our considerations onto sputtering with ions in the low, medium
and high eV range, we have mainly to consider the regimes of single collisions
and to some extent linear cascade collisions while sputtering conductors respec-
tively the localised ionisation and to some extent linear ionisation cascade regime
when sputtering isolators [beh81]. The spike or spike ionisation regimes could
however only occur in the case that we would use very heavy bombarding ions2.
2As it will be shown later an Ar plasma will be used, therefore the bombarding ions have an
23
8/13/2019 Prediction of protein structural features by machine learning methods
Figure 2.1: Figures by [nor10]: Schematic diagram on the principle evolution of collision reactionsin the three collision regimes for conductive (figures a to c) and non-conductive target materials(figures d to f). (a) Single-collision regime: at low kinetic energies the projectile ion (blue) pene-trates the target surface (horizontal line) and collides with an atom transferring kinetic energy and
momentum to it. The trajectory of the ion ends after the collision meaning the ion is stopped now.The primary recoil atom (red) moves through the target and collides with another atom generat-ing a secondary recoil atom (purple) and stopping the primary recoil atom itself. The trajectory of the secondary recoil atom points away from the targets surface and as it does not undergo furthercollisions it is ejected from the target. Collisions of higher orders do not appear. (b) Linear cas-cade regime: at higher kinetic energies the projectile ion penetrates the target surface and collideswith several target atoms generating primary recoil atoms. In the cascade of following collisionssecondary, tertiary (green) and higher orders of recoil atoms (yellow) are generated and severalatoms can be ejected. Collisions between the moving atoms are however not frequent. (c) Spikeregime: for even higher kinetic energies or large projectile masses the different orders of recoilatoms cannot be determined any more as all atoms in a certain volume are in motion and thereis a multitude of collisions between them. The cascade transforms to the so-called spike. (d) Lo-calised ionisation regime: at low kinetic energies the projectile ion penetrates the target surfaceand deposits a major part of its kinetic energy during an inelastic collision into a small volumethat is ionized (red cloud). The deposited energy in this volume is sufficient to eject an atom fromit, but no further collisions or ionisations appear. (e) Linear ionisation cascade regime: at higherkinetic energies the projectile ion penetrates the target surface and undergoes several inelasticcollisions, that each produce ionized areas. The energy deposited in this areas is sufficient to ejectatoms or to generate areas of secondary (blue clouds) or higher order ionisation (green and yellowclouds), that again can eventually eject atoms. (f) Spike ionisation regime: for even higher kineticenergies or large projectile masses the different ionized volumes in the cascade merge and form alarge, ionized volume, the ionisation spike.
24
8/13/2019 Prediction of protein structural features by machine learning methods
An algorithm that simulates ion sputtering in the relevant regimes based on a
quantum mechanical treatment is implemented in the program SRIM, which was
developed by Ziegler and Biersack [zie84], and is described in the appendix.
Atom ejection If an atom receives enough chemical or kinetic energy to over-
come the local binding forces it can be considered as energetically unbound. De-
pending on the position of the atom in the solid and depending on the direction
of its momentum vector, the atom usually has to undergo several collisions with
surrounding atoms first until it reaches the surface and can possibly leave the
solid. Only if an atom reaches the solids´ surface, has a momentum vector that
points away from the solid into the vacuum, and is still energetically unbound
after all the collisions, it is ejected. Otherwise it is again bound to the solid.
The energy that is necessary to eject an atom from a solid is dependent on the
local binding energy as well as on the position of the atom. Generally, atoms on
the target surface need less energy to be ejected, as they do not have to undergo
collisions to reach the surface and they are weaker bound to the target as bulk
atoms. The energy needed to eject surface atoms is therefore an energy threshold,
below which no sputtering takes place. If the energy insertion by a collision or
chemical reaction is equal or slightly above the threshold, the ejection of surface
atoms will begin. For higher energies also an ejection of atoms from the solids
bulk is possible.
Usually sputtering energy thresholds are in the range between 20 and 50 eV, de-pending on the material and depending on the type of bombarding ion. Exact
analytical calculation of energy thresholds is unfortunately not possible. They
have to be measured experimentally or can also be approximately determined
in simulations, for example with the program SRIM (see appendix A1). If only
low energetic ion bombardment and the ejection of surface atoms is considered,
it is also possible to roughly approximate the energy threshold with the surface
binding energies.
2.1.2 Ejected particles
The particles ejected from a target surface during sputtering are mostly neutral
atoms with a broad angular and energetic distribution [beh91]. The so-called
sputtering yields are used to describe these distributions.
Total sputtering yield The ejection efficiency of a sputtering reaction is mea-
sured by the total sputtering yield S, which is defined as the average number of
atomic mass of only about 40 AMU. The spike regime will not appear for this mass and energies.
25
8/13/2019 Prediction of protein structural features by machine learning methods
atoms ejected from the target per incident projectile particle [beh81]:
S = e jected atoms
pro jectil e particle
(2.1)
Total sputtering yields may reach values between 0 and 10,000 [joh04], but typi-
cally they lie between 1 to 5 [beh81].
The total sputtering yield is dependent on the projectiles´ mass, its kinetic energy
and incident angle as well as on the masses and (surface) binding energies of the
target atoms involved. For crystalline targets, also the orientation of the crystal
axes with respect to the target surface is relevant. It should be noted, that the
total sputtering yield always gives the total number of atoms ejected, regardless
their energies or directions. If the latter ones are of importance, the differential
sputtering yields should be regarded.
Angular distribution The differential sputtering yield dSdΩ is a measure for the
number of atoms emitted in a certain solid angle. Investigations of dSdΩ are one
of the most important sources of information on the fundamental mechanisms of
sputtering, as they allow to draw conclusions on the momentum distribution in
the single sputtering event.
Sigmund developed a theory for cascade sputtering in random media, that repro-
duces the measured total yields and angular distributions in the single collision
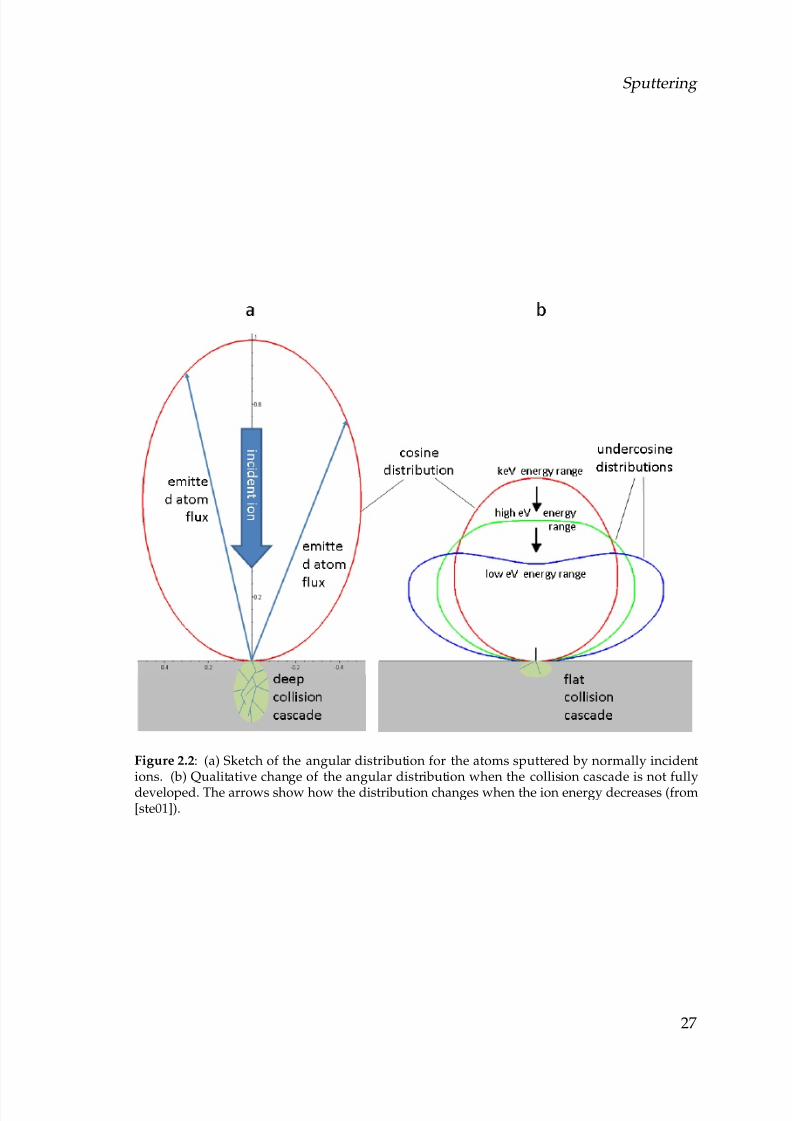
and linear cascade regime quite correctly for amorphous and polycrystalline tar-gets3 [beh91]. The theory predicts a cosine-like angular distribution for normal
ion incidence, which is formally given as
dS
dΩ ∝ cos(θ e)β, 1 ≤ β ≤ 2 (2.2)
where θ e is the polar angle of the emitted particle and β is a number depending
on material and ion energy, which has to be determined experimentally.
Sigmunds theory assumes spatial isotropy of the collision cascades, which is
well fulfilled in the case of atom ejection from deeper layers, which appears
in the keV energy range. However in case of surface atom ejection or near-surface cascades, as they appear at eV range energies, the spatial isotropy is
not given any more [ste01]. For these low energies, the angular distributions
often take an undercosine shape with a β < 1 (shown schematically in figure 2.2).
If the direction of ion incidence deviates from the surface normal at a fixed en-
ergy, an inclination in the ejection distribution can be observed (see figure 2.3a).
3Sigmunds theory also reproduces a major fraction of the atom flux from monocrystalline tar-
gets, and can be applied for them too. However it does not describe the characteristic ’Wehner
spots’ that appear in low-index lattice directions.
26
8/13/2019 Prediction of protein structural features by machine learning methods
Figure 2.2: (a) Sketch of the angular distribution for the atoms sputtered by normally incidentions. (b) Qualitative change of the angular distribution when the collision cascade is not fullydeveloped. The arrows show how the distribution changes when the ion energy decreases (from[ste01]).
27
8/13/2019 Prediction of protein structural features by machine learning methods
Figure 2.3: (a) Sketch of the angular distribution of atoms sputtered by normal incident ions (0°),
as well as ions at 30° and 60° to the surface normal. (b) Sketch of the angular distribution of atomssputtered by ions at 30° to the surface normal and different ion energy ranges.
The distribution tends to assume an over-cosine shape. For a fixed angle of in-
cidence on the other hand, the observed ejection distributions tend to assume a
cosine shape normal to the surface for increasing energy (see figure 2.3b). Both
statements are however again only true for an isotropy of the collision cascades.
For low ion energies and surface atom ejection, it is hardly possible to determine
any general principles in the appearing ejection distributions. They have to be
measured in experiment for each combination of ion, target material, incidence
energy and angle of incidence.
Energy distribution The differential sputtering yield dSdE is a measure for the
number of atoms emitted with a certain energy. It has been well established ex-
perimentally and theoretically, that the energy spectrum of sputtered atoms com-
ing from a fully developed collision cascade is well reproduced by the Thompson
28
8/13/2019 Prediction of protein structural features by machine learning methods
Figure 2.4: Qualitative plot of the energy distribution of ejected atoms for keV ion bombard-ment (isotropy of collision cascades, Thompson distribution) and sub-keV ion bombardment(non-isotrope collision cascades, sub-Thompsonian distribution).
formula [dep08]:
dS
dE ∝
1−
(U surface + Eatom)/γ Eion
E2atom(1 + U surface/Eatom)3
,γ = 4mion matom
(mion + matom)2 (2.3)
where Eion and mion are the kinetic energy and mass of the incident ion, Eatom
and matom are the energy and mass of the ejected atom and Usurface is the surface
binding energy of the atom (see figure 2.4).
Experimentally measured energy distributions of sputtered atoms with not fully
developed cascade have been observed to deviate from Thompson’s prediction,
especially for light bombarding ions in the sub-keV range. The peak of the energyspectrum tends to shift to lower energies, the width of the spectrum becomes
narrower and the high-energy tail of the energy distributions falls off faster.
Multicomponent yields In case that a sputtering target is composed of more
than one species of atoms (also called a ’multicomponent target’), each atom
species has its own total sputtering yield as well as its own energy and angular
distributions. This multicomponent yields are usually not identical to the sput-
tering yields of the single components in their pure form.
29
8/13/2019 Prediction of protein structural features by machine learning methods
Continuous atom ejection has a direct influence on the topography of the sputter-
ing target. If the target consists of more than one species of atoms, the sputteringwill also change the elemental composition of the target surface and possibly
even the elemental composition of the bulk material. The steady ion bombard-
ment will moreover heat up the target. Vice versa will topography, composition
and temperature of the target surface have an influence on the sputtering process
itself.
Topography change Generally, the sputter ejection of atoms from a surface does
not occur uniformly on the ion bombarded area, even if the bombardment is uni-
formly. This is due to the fact, that the atom ejection during sputtering is a purestatistical effect based on a random collision cascade respectively random ion tar-
get reactions. Additionally to that, bombardment and atom ejection continuously
modify the surface and the surface near layers. Ions penetrate and leave the tar-
get, may react or get implanted, atoms are ejected, displaced and rearranged.
Thus, during sputtering the topography of the target surface evolves from its
original state toward a new state that is usually very different.
On flat monocrystalline surfaces it can be observed, that small inhomogeneities
on atomic scale start to grow and develop into micrometer-sized pyramids,
ridges, grooves or holes, depending on the starting conditions, the orientation of crystal and bombardment to each other, the crystal temperature and the type and
energy of the bombarding ions. In a flat polycrystalline surface the situation is
similar. Each crystallite however behaves as a small monocrystal with unique ori-
entation, and faces therefore unique sputtering conditions and a unique erosion
rate, that is different from the surrounding crystallites. The continuous erosion
causes by that the crystallites to become visible. Additional grooves or smooth
transitions develop at grain boundaries, depending on grain orientation. Thus
flat surfaces generally roughen during sputtering.
Very rough surfaces on the other side generally smoothen during sputtering, as
prominent domains of the surface will be stronger exposed to erosion while at the
same time shadowing less prominent domains. This smoothing continues until
the surface roughness is in the order of the grain size (for polycrystalline targets)
respectively in the order of the micrometer inhomogeneities (for monocrystalline
targets).
The feedback of surface roughness to the sputtering process is a change in the
macroscopic atom ejection characteristic of the sputtering target. The macro-
scopic ejection characteristic is a superposition of the atoms ejected in every single
sputtering process on the target surface. The roughness of the surface determines
the local angle of ion incidence in every single sputtering process and therefore
30
8/13/2019 Prediction of protein structural features by machine learning methods
Figure 2.5: Qualitative sketch of single microscopic sputtering reactions and the local angulardistributions of the ejected atoms for (a) a flat target and (b) a rough target.
the local angular distribution of the ejected atoms (see figure 2.5). An increase
in roughness leads to a randomization of the angles of incidence for ion impact
and therefore to a randomization of the different angular distributions of ejected
atoms. The resulting macroscopic ejection characteristic is more uniformly dis-
tributed and has a less emphasized preferential direction.
Preferential sputtering For a monoatomic target material, the probability for
an atom to be ejected during sputtering is determined by several factors as ion
type, energy and angle of incidence as well as atom position and local binding
forces. The type of target material influences the ejection probability in so far, as
it determines the atom positions and the local binding forces. In a material that
has more than one species of atoms, the local binding force for an atom of a sin-
gle species is usually different form the local binding forces of atoms of different
species. This means, that even for identical bombardment conditions (ion type,
energy, angle of incidence, atom position) the different species will have differ-
ent probabilities to be ejected during sputtering. This phenomenon is denoted as
’preferential sputtering’.
Preferential sputtering causes the surface composition of a multicomponent tar-
get to change, as atom species with a high ejection probability will be depleted on
the surface while atom species with a low ejection probability will be enriched.
Due to this effect, the total surface fraction covered with low ejection probability
atoms will increase while the surface fraction covered with high ejection proba-
31
8/13/2019 Prediction of protein structural features by machine learning methods
bility atoms will decrease. The surface starting composition changes due to this
effect toward an equilibrium composition, which is determined by p iAi = p jA j
∀ i,j, where i and j are different components, p i is the ejection probability of the
i-th component and Ai is the fraction of surface area covered by atoms of the i-thcomponent. After the surface equilibrium is reached, the preferential sputtering
effect is exactly compensated by the new surface composition. The different atom
species will be ejected according to their fraction in the bulk distribution. Prefer-
ential sputtering is therefore just an effect that appears at new targets during the
first sputtering, but disappears after the erosion of several atom layers.
Heating and diffusion Ion irradiation heating of the target is a side effect of
the ion bombardment during sputtering. Continuous ion bombardment appliesa permanent heating to the target, that has therefore to be cooled adequately. Oth-
erwise it will heat up more and more until it starts to melt or to evaporate.
Next to this quite apparent need for cooling, the target temperature also affects
the sputtering process. As mentioned in the last paragraph, preferential sputter-
ing changes the surface composition of the target until an equilibrium is reached.
If the target is hot enough however, diffusion mechanisms in the target bulk ma-
terial will appear that avoid this equilibrium to be reached. The depletion of atom
species with a high ejection probability at the target surface will cause diffusion
processes, that transport further atoms of the high ejection probability speciesfrom the target bulk to the surface. This causes a continuous depletion of the
whole target.
2.1.4 Sputter deposition mechanism
The atoms ejected from a target during sputtering have kinetic energies in the
range of several eV and velocities in the range of kilometers per second. In the
usual technical applications, where sputtering is used inside closed vessels invacuum, these atoms will collide very soon after their ejection with gas atoms or
solid structures of the sputtering apparatus like the walls of the vacuum cham-
ber for example. During these collisions4 the atoms will lose kinetic energy and
momentum and finally remain at some surface. If a large number of atoms ac-
cumulates on a surface and close to each other they start to nucleate and finally
form a solid film.
4As for the ions in the previous section there is also a certain probability that an atom is re-
flected from a surface. However even if an atom is reflected several times it will lose its energy
sooner or later due to collisions.
32
8/13/2019 Prediction of protein structural features by machine learning methods
Collision If the atoms ejected from the sputtering target hit the surface of a solid
substrate, they will be either reflected or bound to the surface. An implantation
is unlikely to occur, as the kinetic energy of the atoms is too low. A reflection
occurs, if the atom does not loose enough kinetic energy and momentum duringthe collision with the solids´ lattice; typical duration of this process is in the pi-
cosecond range, which is the time of one oscillation of the solids lattice. If the
atom can however transfer enough of its kinetic energy and momentum into the
lattice to come below the surface potential, it will be bound loosely as an adatom
to the surface.
At the surface of the substrate a continuous competition between absorption and
desorption of atoms takes place. The absorption results from physical surface
bonds (physisorption) and chemical surface bonds (chemisorption) and produces
adatoms. This adatoms will however desorb again, if they receive enough en-ergy or momentum to overcome the surface potential, perhaps by the thermal
vibrations of the solids lattice or by impinging atoms from the gas or from the
sputtering target.
Surface diffusion and cluster formation If not desorbed, the adatoms stay on
the substrate surface and may have the possibility to diffuse. Dependent on the
substrate temperature and dependent on the binding forces an adatom has cer-
tain degrees of freedom in diffusion. For strong bonds or a very low substrate
temperature no adatom movement will be possible at all. Reduced bond strengthor higher temperatures will however allow a diffusion on the surface of the sub-
strate (surface- or 2D-diffusion) or even a diffusion into the lattice of the substrate
(bulk- or 3D-diffusion). After some time of migration the adatoms will conden-
sate at some germ.
The reason for adatoms to condensate is an energy gain during nucleation. The
single adatoms are only bound to the substrate with the substrates surface poten-
tial. By developing further bonds to other adatoms, the total potential for each
atom increases and they will become more tightly bound, which lowers their rate
of desorption. The condensation of adatoms leads by that to the formation of adatom clusters or so-called nuclei.
Nucleation A cluster can grow both parallel to the substrate by surface diffu-
sion of adatoms as well as perpendicular to it by direct impingement of incident
atoms. Depending, whether the adatoms are stronger bound to each other or to
the substrate, and depending on the adatom diffusion, the clusters will therefore
grow differently. Three different modes of cluster growth are discriminated and
shown in figure 2.6.
33
8/13/2019 Prediction of protein structural features by machine learning methods
Figure 2.6: Illustration, how the relation of bond strength between adatoms and substrate willinfluence film growth in its earliest stages. If the bond of the adatoms to each other overweightsthe bond to the substrate atoms, a nucleus will grow three dimensionally in width an height.This is called Volmer-Weber growth. If the bond of adatoms to the substrate atoms overweights
the bond of adatoms to each other, the film will grow two dimensionally as single atomic layers.This is called Frank-van der Merwe growth. If the differences in bond strength between substrateatoms and adatoms is not clearly emphasized, a mixed growth or Stranski-Krastanov growth willappear.
34
8/13/2019 Prediction of protein structural features by machine learning methods
If the bond of nucleus atoms to each other overweights the substrate bond, the nu-
cleus will grow three dimensionally in width and height. This case is called island
growth (or: Volmer-Weber growth). It also appears, if the diffusion of adatoms
on the substrate surface is slow. In the case the substrate bond overweights thenucleus atom bond or the adatom diffusion is very quick, the nucleus grows two
dimensionally as single atomic layers in a layer by layer growth (or: Frank-van
der Merwe growth). Usually the differences in bond strength are however not
so clearly emphasized and the diffusion speed is neither slow nor fast. Thus nu-
clei will undergo a mixed growth (or: Stranski-Krastanov growth), that begins as
layer by layer growth and starts to form three dimensional islands later on.
A process competing to growth is the breakup of nuclei. It is caused by the nu-
cleus´ surface energy, that increases with the size of the nucleus and causes small
nuclei to break apart to reduce both surface and surface energy. Both effects con-tinuously create and destroy nuclei. If a nucleus grows however to or above a
certain critical size, the gain in condensation energy will overweight the separat-
ing effect of surface energy for every additional adatom. A critical nucleus like
that won´t disappear any more but collect further and further adatoms and grow
continuously.
The critical nuclei grow in number as well as in size until a saturation nucleation
density is reached. The nucleation density and average nucleus size depend on
various parameters as energy of the impinging atoms, deposition rate, energies
of adsorption and desorption, diffusion rate, temperature, substrate topography
and materials involved.
Agglomeration In the next stage of film formation the grown nuclei start co-
alescing with each other in an attempt to further reduce their surface and sur-
face energy. This tendency to form bigger structures is denoted as agglomeration
and the resulting structures are so-called islands. Larger islands grow together,
leaving channels and holes of uncovered substrate. The structure of the deposit
changes at this stage from discontinuous island type to porous network type. A
completely continuous film is formed by filling of the channels and holes.All stages of microscopic growth finally lead to the formation a macroscopic film
on the substrate, if it is continued long enough. The properties of this film are
strongly influenced by the grown microscopic structures.
2.1.5 Deposited film
Understanding and control of microscopic growth processes open the possibil-
ity of microstructural film engineering, in order to design materials with tailored
properties for specific technological applications. Extensive studies of the corre-
35
8/13/2019 Prediction of protein structural features by machine learning methods
lation between the microstructure of deposited films and the related macroscopic
deposition parameters have therefore been carried out in the past decades. The
aim of such studies is to get a deeper understanding of how microscopic film
growth processes can be influenced by macroscopically controllable parameters.This has led to the development and refinement of structure zone models, which
systematically categorize self-organized structural evolution during film deposi-
tion.
MD zone model Movchan and Demchishin identified three different mi-
crostructures with distinct structural and physical properties, that appear in
every film that is deposited in a thermal evaporation process onto a substrate[mov69]. The microstructures are called zones 1 to 3 and result from the
microscopic growth processes described in the last section. They were able to
show, that these microstructures could be ordered in terms of the homologous
temperature T/Tm, where T is the substrate temperature and Tm is the melting
point of the deposited material (both in Kelvin).
The low temperature zone 1 structure consists of tapered columnar grains
separated by pores or voids. In this zone the adatom mobility is low and incident
atoms adhere where they impinge. Microscopic growth is dominated by grain
shadowing effects, and voids can occur between the grains due to the missingsurface diffusion. At higher temperatures adatom mobility rises and the zone
2 structure with its dense columnar appearance can form. The structure still
has a distinct columnar composition, but due to surface diffusion there are no
voids between the columns any more. In zone 3, at even higher homologous
temperatures, the adatom bulk diffusion starts. Recrystallization and grain
formation processes dominate the film growth, and the resulting deposit has an
equiaxed grain structure with full bulk material density.
Movchan and Demchishin recognized, that substrate temperature is the domi-
nant factor in the microstructural evolution of films deposited in high vacuum.
Based on their observations, they developed their classic structure zone model
or Movchan-Demchishin (MD) model (see figure 2.7). For the transitions of zone
1/zone 2 and zone 2/zone 3 in metallic coatings they determined homologous
temperatures of 0.3 respectively 0.5, for non-metallic coatings they found simi-
lar values. The MD model assumes however, that microstructure evolution and
diffusion processes are primarily temperature dependent, which is only true for
films deposited by evaporation in a high vacuum. In case of other deposition
techniques and a less pure environment, other factors will influence film growth
as well and the MD model has to be improved.
36
8/13/2019 Prediction of protein structural features by machine learning methods
Figure 2.7: Zone model by Movchan and Demchishin (from [mov69]).(a) Cross section of the zonemodel with the zones 1,2 and 3 ordered according to homologous temperature. (b) Top view of the zone model to emphasize the microstructure.
Thornton zone model During sputter deposition, the substrate and the de-
posited film are subject to an energetic particle bombardment, that does not ap-
pear during evaporation deposition. The bombarding particles are on the one
hand target atoms ejected during the sputtering process, on the other hand en-
ergetic neutrals, that were generated during ion bombardment by neutralization
and reflection of ions from the sputtering target. It was soon recognized, that
continuous bombardment of the substrate affects the adatom diffusion processes
during film growth, therefore several attempts have been made to include thiseffects in the MD model.
Thornton investigated the microstructure of sputter deposited metal films and
compared them to the structures of the MD model [tho74]. He observed, that
for the sputtered coatings the zone 1 structure persisted at higher homologous
temperatures with increasing process gas pressure. This is due to gas phase scat-
tering of the bombarding particles, which both reduces the energy of impinging
particles and accentuates the atomic shadowing effect during growth. He also ob-
served a fourth microstructure, that consists of densely packed fibrous grains and
would be located between the zones 1 and 2 in the MD model. This was denoted
’zone T’, as it seemed to be a transition between the two MD zones. Dependent
on the gas pressure, the transition between different microstructures could be ob-
served for the homologous temperatures 0.1 - 0.3 (zone 1/zone T), 0.2 - 0.5 (zone
T/zone 2) and 0.3 - 0.7 (zone 2/zone 3). These values varied however slightly for
all investigated materials.
Based on his observations, Thornton extended the MD model to describe the
structure of sputter deposited films. By adding a second axis, he could account
the effect of surrounding gas pressure on the film growth (see figure 2.8). The
most important point of this extension was to emphasize the pressure as a deci-
sive process parameter, that, together with the substrate temperature, allows to
37
8/13/2019 Prediction of protein structural features by machine learning methods
Figure 2.8: Zone model by Thornton (from [tho74]). (a) Cross section of the zone model at onefixed working gas pressure value (here argon) with the zones 1, T, 2 and 3 ordered according tohomologous temperature. (b) The top view of the zone model with temperature and the pressureaxis maps the observed microstructures.
influence sputter deposition systematically and to grow films with defined prop-
erties.
Modern zone models Today several further processing parameters are identi-
fied, that affect film growth and morphology. The application of a bias voltageto the substrate generates an additional ion bombardment of the deposited films,
that enhances adatom mobility. At high enough bias voltages, this allows to com-
pletely suppress the zone 1 structure for all substrate temperatures. By external
electric or magnetic fields, the bias ion bombardment can also be directed and
adjusted in energy and flux to utilize the atomic shadowing effects to affect tex-
ture. Recent experiments also indicate, that even the ion-to-atom ratio incident
at the substrate might have an influence on microstructure evolution. Other ex-
periments demonstrated, that impurities in the surrounding gas or in the target
material affect grain growth. An increased deposition rate has found to decrease
grain size, and columnar grains tend to grow in the direction of the sputtering
source.
Every additional processing parameter that is identified to influence film growth
can be used to extend the classic MD model and be utilized as a further tool
to produce deposits with tailored properties. In this way several different zone
models have been developed in the last decades. Other parameters are known
to have an influence, but first need to be studied systematically until they can be
developed into a zone model. It should be noted however, that the structure zone
models are nothing more than a way to order and classify experimental data. A
fundamental theory of macroscopic film growth still doesn´t exist.
38
8/13/2019 Prediction of protein structural features by machine learning methods
Material deposition onto a sputtering substrate usually hardly affects the sub-
strate at all. Vice versa will the sputtering substrate however have a strong influ-ence on the growth of the deposited material and the properties of the emerging
film. The zone models have been mentioned already as a tool to classify some of
the influences of the substrate on film growth. Others are however not systemat-
ically studied yet, but have been mentioned in a rather qualitative way.
Substrate condition The structure zone models described in the last section are
intended to predict the influence of processing parameters to the film growth
process, especially the influence of substrate temperature. What is not covered
by the zone models is however the condition of the substrate prior to the deposi-tion process, as it can hardly be quantified.
The substrate is the basis of the growing film. Its surface therefore strongly af-
fects the growth at least of the first layers of the deposited film. There are three
essential factors that have an influence on the film growth process: the atomic
structure of the substrate, the topology and the surface contamination.
The atomic structure, that means grain size and crystallographic orientation of
the substrate surface, determines the binding energies and nucleation sites of the
adsorbed adatoms and by that has an effect on the growth of the growing film
[was92]. Generally, a fine grained substrate offers more nucleation sites than arough grained one, and by that leads to the growth of a more fine grained film
with a better adhesion. For a substrate with large grain sizes or even a monocrys-
talline substrate and in case of crystallographic compatibility between film and
substrate, also epitaxial growth may be achieved. In opposite to that, it is pos-
sible to grow films with a controlled orientation or even amorphous films on an
amorphous substrate.
The surface topology is caused by the grains on one side as well as by surface
roughness on the other side. It affects adatom diffusion on the surface, and also
influences the deposition and desorption of adatoms by shadowing effects. Gen-
erally, a smoother surface allows higher adatom mobility and causes less shad-
owing, which results in a more uniform growth behavior and denser films with
better adhesion.
The microscopic effect of surface contamination is primarily a change in the sur-
face binding, desorption and diffusion energies of the adatoms. These energy
changes again influence the film growth process. Depending on the amount of
contamination, the growth process may be only slightly disordered on atomic
scale or even be completely disturbed up to the macroscopic scale. In the latter
case, the resulting films usually show deformed grains, non-uniform growth and
a worse substrate adhesion (see paragraph ’Defects’ later in this section).
39
8/13/2019 Prediction of protein structural features by machine learning methods
Atomic structure and surface topology of the substrate can usually be controlled
by a proper substrate selection and preparation prior to sputtering. A contami-
nation may result from adsorbed impurities from the working gas, or even from
impurities in the sputtering target itself, that get ejected and deposited. A mon-itoring of the impurity content of the working gas as well as the target material
is therefore necessary. Usually, the contamination is however already present on
the surface of the substrate before the sputtering process starts, and can therefore
also be avoided by a proper substrate preparation.
Reflection The flux composition of atoms sputtered off a multicomponent tar-
get does not significantly change between the moment of ejection at the target
surface and the moment of incidence at the substrate surface5. A composition
change appears however, when the impinging atom flux gets deposited on the
substrate. As the different arriving atomic species have different reflection prob-
abilities, there will be a selective reflection of impinging atoms from the growing
film. The species with higher reflection probability will of course have a lower
concentration in the growing film as in the original target material. This com-
position change can however be calculated accurately and therefore accounted
adequately prior to the sputtering process.
Stress Sputter deposited films usually show a certain internal or residual stress,that can be tensile or compressive. If this stress cannot be compensated by the me-
chanical stability of the substrate, it causes the substrate to bend concavely (for
a film with tensile stress) or convexly (for a film with compressive stress). The
stress also imposes a shearing force, that may cause the film to break off the sub-
strate, if the film adhesion is too weak to withstand the force.
The residual stress results from two factors [ohr02]: intrinsic stress built up dur-
ing film growth and extrinsic stress due to thermal effects. The extrinsic or ther-
mal stress is well known from the bimetallic effect. When the film and substrate
material are not identical, the film usually shows another thermal expansion be-
havior as the substrate. Stress appears, when the film is prepared at a temperature
different to the temperature where the film is used. It can be avoided however, if
the film is already produced at the same temperature it will be used later on.
The reason of intrinsic stress is not fully understood up to now. Several expla-
nations are given in literature, but a universal theory is still not existing. It has
been shown, that the incorporation of atoms, for example from the working gas,
5For distances in the range of several meters or more between target and substrate, a slight
change in flux composition might be possible, as different atomic species have different angular
ejection characteristics. In typical technical applications, the distance between target and substrate
is however small enough that these composition changes can be neglected.
40
8/13/2019 Prediction of protein structural features by machine learning methods
strongly affects intrinsic stress. But also lattice mismatch between film and sub-
strate during growth, variation of interatomic spacing with crystal size, micro-
scopic voids, the arrangement of dislocations, phase transformations and recrys-
tallization processes contribute. Intrinsic stress has shown to manifest itself astensile as well as compressive stress during sputter deposition. Via the process-
ing parameters it is therefore possible to control the stress.
Defects An effect, that is closely related to the contaminations already men-
tioned, are so-called ’defects’ of the growing film. Three types of defects are usu-
ally classified [bun94]: ’spits’, ’flakes’ and ’nodules’.
’Spit’ denotes liquid target material, that gets ejected from the target surface assmall droplets, is thrown upon the growing film and gets incorporated into the
film. The bond between the droplet and the surrounding film is usually poor.
The droplet may even fall out, leaving a pinhole in the film. The ejection of spits
is caused by the eruptive release of gas on the target surface. Gas can be included
in porosities in the target bulk material or be generated during the thermal de-
composition of impurities.
Spits or other foreign particles that are thrown onto the surface of the growing
film lead to the second class of defect, which is denoted as ’flake’. The particle
lying on the film faces a higher exposure to the atom flux coming from the tar-get than the general growing film surface. This induces a preferential growth of
the film in this area, which is denoted as flake. Usually there is only a marginal
bonding between the flake and the surrounding film, so a flake can also fall out,
leaving a pit or a crack.
The third type of defect is denoted as ’nodule’ and describes cone-shaped struc-
tures, that evolve during the film growth process. As spits, they also have a
weak adhesion to the surrounding film. They can be caused by asperities on the
substrate, but they can also appear without the presence of an asperity [zho98].
The driving force that allows nodule growth is a low adatom surface diffusiv-
ity, which is related to substrate temperature. A high degree of scattering of the
incoming atom flux due to high working gas pressure as well as a high rate of
deposition further increase the nodule size.
The listed defects are usually undesired in the sputtered deposits and should be
avoided if possible. Spits can be suppressed, if porosities and impurities in the
target material are eliminated, that means if the target material is prepared accu-
rately. Flakes can be avoided, if the presence or impingement of foreign particles
on the substrate is prevented. The nodular growth is dependent on substrate
temperature and working gas pressure, and can thus be eliminated by choosing
appropriate processing parameters.
41
8/13/2019 Prediction of protein structural features by machine learning methods
Up to the present day, the physics of sputtering is not fully understood and still
a topic of experimental and theoretical research worldwide. It is well enough
understood however to be used successfully in a multitude of technical appli-
cations. Generally all of these applications utilize the sputtering effect either to
ablate atoms from an objects surface (to clean it or to shape it for example) or to
deposit atoms to an objects surface (to coat it or to change its properties) [beh81].
2.2.1 Process
Various methods are described in literature to realize and utilize both physical
and chemical ion sputtering for erosion and deposition purposes. It is however
not the aim of this thesis, to give a general investigation of all this methods and
their applicability in fuel element fabrication. Such a task would go far beyond
the feasible scope of a work like that.
We wanted to focus our work on the actual application of functional coatings
onto monolithic fuel to demonstrate the feasibility of this method. Therefore we
delimited our experimental effort on the realization of a setup, that allows us
to utilize the simplest ion sputtering technique necessary for our purpose. We
decided to realize an experimental setup, that is able to provide the possibility of
physical sputtering as well as reactive physical sputtering. We considered thesetwo processes as sufficient, as they would allow us to deposit all pure elements
as well as a variety of simple chemical compounds.
2.2.2 Technical realization
The basic components of a sputtering reactor are denoted as target and substrate.
The denotation refers to chapter 2.1, where the target is subject of sputter erosion
and the substrate subject of atom deposition. The erosion of the target is started
and caused by an ion bombardment, that has to be generated technically. The
coating of the substrate is result of the flux of sputtered atoms ejected from the
target. Both processes, coating and erosion, thus only need a strong source that
provides an intense ion bombardment.
Very effective sources to generate the ion bombardment needed for ion sputter-
ing are gas discharge plasmas. They are technically easy to generate and they
constantly produce large numbers of ions, that can be accelerated onto materials
by simply applying electric fields. With acceleration voltages of several hundred
volts one can induce in this way an intense ion bombardment on surfaces, that
leads to a significant sputter erosion and ejection of atoms.
42
8/13/2019 Prediction of protein structural features by machine learning methods
Gas discharge The term gas discharge denotes a process, where an electric cur-
rent can flow through a gas by the formation of a plasma. The driving force for
the current in the discharge is usually an externally applied electric field. Many
different types of gas discharges are known, and nearly every type has some tech-nical application. The types can be discriminated by the used electric field (direct
field or oscillating field), by the pressure of gas (atmospheric pressure or low pres-
sure), by the temperature distribution in the plasma (thermal or non-thermal) and
by their lifetime (self-sustaining and non-selfsustaining) [rai91]. However not ev-
ery type of discharge is suited to be used as a source for ion bombardment and
sputtering in a technical application.
For our particular application we decided to use a glow discharge, which can
be classified as a self-sustaining low pressure gas discharge. It can be generated
with relatively simple technical means and offers the advantage of continuous ionproduction together with a homogeneous ion bombardment. We decided against
high pressure discharges, as we wanted to avoid the handling of thermal (’hot’)
plasmas and localized arcs. In opposite to that, the glow discharge produces a
non-thermal (’cold’) plasma and can be operated both by a direct or an oscillat-
ing electric field.
Glow discharge The simplest setup to create a glow discharge is a planar
diode, that means an anode and a cathode plate. When a certain voltage isapplied to the plates and a gas with an appropriate low pressure is present
between the plates, a direct field (DF) glow discharge will evolve. The necessary
pressures and voltages to start the discharge are given by the so called ’Paschen
curves’ for any type of gas and any distance of the electrodes (see figure 2.9).
The formation or ’ignition’ of a plasma in the diode setup happens within 10−7
- 10−3s [rai91], when the ’ignition condition’ defined by the Paschen curve is
reached. After that the discharge plasma has reached a stable state.
The stable glow discharge shows several regions that are associated with different
physical processes (see figure 2.9), which will not be discussed in further detail
here. The interested reader should refer to literature for details. For our pur-
pose it is enough to assume the glow discharge plasma as an electric resistance
that is located between anode and cathode. An electric current constantly flows
from cathode to anode through the plasma volume, and the electric energy is con-
sumed by the plasma resistance.
The charge transport in the plasma works via free electrons and ions, that contin-
uously flow to the anode respectively cathode. The source of the free electrons
and ions are ionisation processes in the plasma and at the electrodes driven by the
applied electric field. The most important process of this kind is the so called ’vol-
43
8/13/2019 Prediction of protein structural features by machine learning methods
Figure 2.9: The Paschen curve describes the voltage necessary to ignite a discharge plasma in adiode with given distance d between anode and cathode inside a certain gas type with given gaspressure p. The Paschen curve for a particular gas type is dependent on the ionisation energy of the gas and the mean free path of electrons and ions in the gas. The Paschen curves of severalcommon gases are shown here (from [lie05]). For every gas type the curve shows a minimumvoltage to ignite a plasma and thus an optimum value of pd. Larger values of pd (’far break-down’) require a larger voltage, as either the electrode distance d rises, which decreases electronacceleration between two collisions, or the pressure p rises, which decreases the mean free pathof the electrons and thus effectively also decreases electron acceleration between two collisions.The voltage increase is linearly to pd in this range. Smaller values of pd (’close breakdown’) alsorequire an increased voltage, that is however far above linear dependence. This results from thefact, that either the pressure p gets too small, which increases the electron mean free path andthus reduces the collision rate, or the distance d gets too small, which allows the electrons to veryquickly reach the anode, which effectively also reduces the collision rate.
Figure 2.10: Different regions in a glow discharge. Basically, it is distinguished between glowareas, that emit light, and dark spaces, that don´t emit light. Every region is characterized by
certain plasma physical effects, that do not appear in the other regions.
44
8/13/2019 Prediction of protein structural features by machine learning methods
ume ionisation’, where electrons that have been accelerated in the electric field hit
gas atoms and ionize them. The second important process is ’surface ionisation’,
where accelerated ions hit the cathode and eject electrons. Other processes as the
ionisation of atoms by collision with ions or the ejection of ions from the cathodecan be neglected, as they have practically no meaning for the glow discharges.
A glow discharge plasma is a continuous and intense source for gas ions, that
can be extracted and used for the bombardment of surfaces simply by applying
an electrical field to the plasma. In the very simple diode concept it is however
not necessary at all to apply an extra electric field to accelerate plasma ions, as an
electric field is already applied to generate the glow discharge. The diode field is
thus used for two purposes, to generate ions and to accelerate them.
A major drawback of DF glow discharges in a diode is, that both anode and cath-
ode have to be electrically conductive to allow a current in the plasma to flow.Thus if a DF diode is used for sputtering, the target materials are limited to con-
ductive materials only. In case a non-conductive material is used, the surface of
the target will accumulate charge, create an electric field of opposing direction to
the DF field prevent a further surface ion bombardment. A way to avoid this is
a permanent reversion in the polarity of the electrodes. If the frequency of pole
changes is chosen high enough, the target surface will not charge up too much
and the remaining DF field is still sufficient to allow the glow discharge to ignite.
This allows the sputtering of non-conductive materials. The resulting oscillating
electric field (OF) glow discharge is very similar to the DF case, as the basic ionisa-
tion processes in the plasma stay the same. However there will be no more charge
transport through the plasma, and the plasma will not work as a conductor but
as an capacitance.
2.2.3 Sputtering setup
According to the assumptions of the previous section, our sputtering setup has
to consist basically only of a planar diode, that is a parallel pair of metallic plates.
The diode is used as sputtering target and substrate and at the same time as a gen-
erator for the glow discharge plasma, that provides the necessary ion bombard-
ment. To reach the low pressure conditions necessary for the discharge, the diode
has to be mounted inside a closed pressure chamber, that can be pumped to the
required pressures and fed with appropriate working gases. A pumping system
as well as devices for vacuum monitoring and gas flow control are mandatory.
The voltage necessary to ignite the glow discharge can be generated by using a
high voltage power supply.
45
8/13/2019 Prediction of protein structural features by machine learning methods
Operation The described sputtering diode can be operated both in DF and in
OF mode. The operation in DF mode requires less aparative effort but allows only
the processing of conductors. As most of the materials relevant to us were metals
and alloys, we used DF sputtering for all of our applications. The OF operationis currently investigated and described in chapter 5.
The sputtering process can be operated as a pure physical sputtering process,
when a non-reactive working gas is used, or as a physical/chemical sputtering
process, when a reactive working gas is used. We wanted to avoid the appear-
ance of chemical reactions during sputtering, thus we used the noble gas Ar as
working gas. Reactive sputtering is currently investigated as well and also de-
scribed in chapter 5.
DF diode If operated in DF mode, the electrodes will be subject of sputter ero-
sion respectively deposition as soon as a glow discharge plasma is ignited inside
the sputtering diode. The electric field inside the diode determines the direction
of ion and electron movement and thus the direction of bombardment and ero-
sion. As the bombarding ions are positively charged, they will always bombard
the cathode. So in a diode glow discharge the cathode is automatically the sput-
tering target, the substrate is the anode.
Figure 2.11 shows the basic assembly when the diode is operated in DF mode
(also called direct current or DC mode). The cathode is continuously eroded and
will also face an intense ion irradiation heating. An active cooling of the targetwill therefore be necessary. The substrate and the inner walls of the pressure
chamber will be subject to continuous deposition of material ejected from the
target. However only the deposition conditions on the substrate have to be mon-
itored and controlled to achieve desired film growth behavior (especially temper-
ature), the material deposited to the walls is regarded as lost.
Magnetically enhanced glow discharge A DF glow discharge between planar
electrodes lead to a uniform ion bombardment of the cathode, that causes con-
tinuous and uniform sputter erosion. The deposition rate of usual diode sput-tering setups is however rather slow compared to other deposition techniques.
An easy way to increase deposition speed significantly is given by the so-called
magnetron sputtering process. It uses an additional magnetic field, which is su-
perposed to the electric field in the sputtering diode. The magnetic field forces the
electrons in the plasma to gyrate and move according to the magnetic field lines
due to Lorentz force6, and by that confines many electrons in regions of high
magnetic flux. The chance for working gas atoms to be ionized in this regions
6The ions are forced to gyration as well, but their gyration radius is much larger and can
therefore be neglected.
46
8/13/2019 Prediction of protein structural features by machine learning methods
Figure 2.11: Basic assembly of a diode sputtering setup for DF operation. The diode is mountedinside a pressure chamber with pumping system P and devices for vacuum monitoring and work-ing gas supply. The high voltage needed for discharge ignition is provided by a power supply G.On the surface of both anode and cathode the actual target and substrate materials are mounted.They can be exchanged after the process. A magnetic assembly on top of the cathode providesa magnetic field on the target surface. It confines electrons and increases the discharge plasmadensity, which leads to a significant increase in erosion rate as well as a decrease in working gaspressure.
47
8/13/2019 Prediction of protein structural features by machine learning methods
increases drastically, which leads to a higher degree of ionisation in the whole
plasma and of course to a more intense ion bombardment of the target.
The simplest and most commonly used design for magnetically enhanced
glow discharges is the plane magnetron design, where permanent magnets aremounted on the back side of the cathode to get a strong magnetic field on the
front plasma facing side. The magnets are usually arranged in a double ring
shape, that creates a magnetic field in shape of a torus on the cathode front side.
During operation a high density plasma ring forms in the field, and causes mas-
sive erosion in the target regions close to it.
The magnetically enhanced glow discharge leads to much higher erosion and
deposition rates, operates at much lower working pressures and voltages and al-
lows to define the regions on the target where erosion takes place. It has however
the disadvantage, that the target is not eroded homogeneously and the substrateis not coated uniformly any more.
Pressure chamber, vacuum system Low pressure glow discharges can be op-
erated in the pressure range of 10−2 - 101 mbar. Above this pressure range, the
glow discharge collapses into an arc discharge, below this pressure range the dis-
charge cannot be ignited. If magnetic electron confinement is used, the pressure
range can be extended to a lower limit of 10−4 mbar. All these processes are
however in the low vacuum pressure range, that means they have to be operated
in a vacuum vessel.To achieve the necessary pressures pumps have to be used. For a pressure range
of 10−2 - 101 mbar, the use of a forepump is sufficient. Much lower pressures are
required however to reach a pure process atmosphere. Commonly a base vacuum
of 10−5 - 106 mbar is recommended, to achieve a ratio of at least 1000:1 between
process pressure and base pressure. This ensures an impurity content of < 0.1%
in the working gas and avoids unwanted chemical reactions in the process. To
reach a base vacuum of 106 mbar, a turbomolecular or some equivalent pump
has to be used however.
48
8/13/2019 Prediction of protein structural features by machine learning methods
Figure 3.1: Full size reactor inside inert gas glove box in the LMU Physics Section. The whole fullsize reactor setup contains the sputtering reactor itself, a vacuum system, a gas system, a coolingsystem, a power supply, an control system, the autarkic gas purification/glove box system as wellas several auxiliary systems.
Figure 3.2: Partial cut of the full size setup. The sputtering reactor (blue) is mounted inside aglove box. Glove box and all other systems are displayed in gray. The high purity Ar atmospherein the box avoids oxidation of the substrates or sputtered deposits when the reactor is opened.
Moreover it retains contamination and therefore permits to handle radioactive materials.
50
8/13/2019 Prediction of protein structural features by machine learning methods
Figure 3.3: Tabletop reactor inside a fume hood in the TUM Institute for Radiochemistry. Theprocessing chamber as well as the turbomolecular pump, the vacuum gauge and the needle valvefor the adjustment of the working gas pressure were installed inside of the fume hood due to ashortage of space. All other components were installed outside.
3.1.1 Tabletop reactor
The tabletop reactor consists of a sputtering head and a sample table, that to-
gether form a diode and are both mounted inside a vacuum chamber (see figure
3.4). The sputtering head consists of a magnetic assembly for electron confine-
ment and structures for cooling and suspension. The sputtering target is mounted
underneath the sputtering head. The sample table is composed of a table plate
and a cooled table foot. The sputtering substrates are mounted on the surface of
the table plate.
Sputtering head The suspension of the sputtering head is a 3 mm thick copper
plate (size 160 mm x 80 mm) with a 6 mm diameter copper cooling tube soldered
along its edging on top side. The cooling tube forms a frame. In between this
frame a magnetic assembly is located.
The magnetic assembly consists of 39 cubic Nd2Fe14B permanent magnets sized
10 mm x 10 mm x 10 mm with a residual magnetism of B = 1.43 T, that adhere
onto an iron plate of dimension 148 mm x 68 mm x 10 mm. The magnets are
arranged rectangularly in two chains and form a so-called magnetron racetrack
(see figure 3.5). The outer chain of magnets consists of magnetic north poles, the
51
8/13/2019 Prediction of protein structural features by machine learning methods
Figure 3.4: (a) Schematic view of the tabletop sputtering reactor. On top the sputtering head withthe magnetic assembly (magnets, field closing plate), the cooling tubes and a mounted sputteringtarget. The sputtering head is at high voltage and isolated from the vacuum chamber. Duringprocess a glow discharge plasma erodes the target and deposits the target material into the vac-uum chamber. The sample table is equipped with cooling tubes and optionally with a heater andtemperature sensors for temperature control. Samples on the sample table can by that be coatedat defined conditions. (b) Partial cut of the vacuum chamber with installed sputtering head andsample table that displays gas inlet and pump outlet. The chamber can be accessed only via thefront and back flanges.
52
8/13/2019 Prediction of protein structural features by machine learning methods
inner one of magnetic south poles. Together the assembly of magnets forms a
magnetic field in the geometry of an elongated torus, which is necessary for the
magnetron enhanced glow discharge described in chapter 2.1.
Figure 3.6 shows a cut of the given assembly with the calculated magnetic fieldlines. It is clearly visible, that the assembly produces two main maxima and two
side maxima. In three dimensions this is equivalent to a magnetic field in the
shape of two tori, an inner an an outer one. The smaller, inner torus is formed
by the main maxima and located perpendicular beneath the target. This is the
desired field structure for the electron confinement that supports glow discharge.
The larger, outer torus is formed by the side maxima and located lateral to the
target. If not inhibited, this field structure will lead to a second plasma ring,
that would sputter the suspension structure. As figure 3.6 shows, it is sufficient
to surround the target with an 10 mm x 10 mm diameter aluminum frame tosuppress this second plasma ring. The field line distribution of the assembly was
calculated with the electromagnetic finite element software VIZIMAG 3.18.
The magnetic assembly is lying upon the cooled copper plate and is surrounded
by a copper cooling tube. The good heat conductivity of copper and the proxim-
ity of the water cooling assures, that the magnetic assembly always stays below
its maximum working temperature2 of 100 C.
The copper cooling tube is formed as a twisted loop: it enters the vacuum
chamber through the attachment flange of the sputtering head, leading straightdown to the copper plate, describes a curve on the copper plate around the mag-
netic assembly, and leads again straight upwards and through the flange. The
sputtering target is mounted underneath the copper plate. It is monolithically
shaped with size 122 mm x 54 mm x 10 mm, and affixed by a single M5 screw
onto the copper plate above. To guarantee good heat transfer from the target into
the copper, a 1 mm graphite foil is placed in between copper plate and target.
By mounting the target underneath the copper plate in the described suspension,
one achieves three important things: first, a good cooling of the target by a large-
area contact of target and copper suspension and the proximity of cooling water
to the target. Second, an adequate magnetic flux through the target without the
danger of overheating the magnets. Third, a shielding of the magnetic assembly
and the suspension from the erosive effects of the plasma by avoiding a contact
between them.
The sputtering head is attached to a DN 100 blind flange via a threaded bar of
150 mm length. The blind flange is electrically isolated to the rest of the vacuum
chamber by a special teflon seal, that guarantees good vacuum tightness down
2The maximum working temperature of the magnets is given by the manufacturer [che06]
53
8/13/2019 Prediction of protein structural features by machine learning methods
Figure 3.5: Isometric view of the sputtering head with a partial cut to accent the structure. Themagnetic assembly formed by 39 Nd2Fe14B permanent magnets is mounted underneath the fieldclosing plate (dark gray). The outer chain of magnets (red) forms the magnetic north pole, theinner chain (blue) the magnetic south pole of the assembly. Ferromagnetic attraction keeps themagnets in contact with the field closing plate, an aluminum spacer (light gray) keeps the dis-tance between north pole and south pole magnets. The target (green) is mounted underneath thesuspension (copper), that cools the sputtering head. An aluminum frame (blue gray) surrounds
the target. It suppresses the side maxima of the magnetic field assembly (see figure 3.6), which isundesired.
54
8/13/2019 Prediction of protein structural features by machine learning methods
Figure 3.6: Side cut of the sputtering head with field lines that indicate the direction of magneticforce in the field generated by the magnetic assembly (calculated by the program VIZIMAG 3.18).The shielding effect of the field closing plate is clearly visible. The magnetic field lines leave theassembly mainly through the plasma facing side, where the target is mounted. The assembly pro-duces two main and two side maxima respectively a main toroidal field a secondary toroidal field.The main field is located beneath the target. It increases the local electron density by magneticalconfinement and by that generates the high density glow discharge plasma needed for the intenseion bombardment of the target surface. The secondary field would generate another plasma ringlateral to the target, that would lead to a bombardment and erosion of the suspension structure.
By placing an aluminum frame around the target, the lateral plasma can be suppressed however.
55
8/13/2019 Prediction of protein structural features by machine learning methods
to ultra high vacuum range as well as an electrical disruptive strength of sev-
eral kilovolts. The cooling water flux enters and leaves the vacuum chamber by
two liquid media feedthroughs in the flange. Outside the vacuum chamber the
cooling water is conducted in isolated flexible tubes.
Sample table The sample table consists of the table foot and the table plate. The
table foot is a massive copper cylinder with 40 mm diameter and 80 mm height
attached to the vacuum chamber. It is wrapped with several loops of a 6 mm cop-
per tube, that is soldered to the cylinder surface for water cooling. The table foot
represents a massive heat sink due to its good thermal conductivity. The table
plate is a cylindric copper plate with 120 mm in diameter and 10 mm in height,
that is screwed onto the table foot. The samples to be coated are placed on the
top side of the sample plate.Due to the simple construction and mounting of the table plate, it is easily possi-
ble to extend or upgrade its functionality. For room temperature coatings a plain
table plate can be used. For coatings that require an elevated temperature, an
upgraded table plate with electrical heating and temperature sensor is available.
Moreover there are table plates that allow gripping of nine foil substrates sized
25 mm x 25 mm as well as one foil substrate sized 100 mm x 100 mm.
Vacuum chamber Sputtering head and sample table are installed in a vacuum
chamber as shown in figure 3.4. The chamber is a stainless steel vessel and pro-vides a DN 160 flange on top and a DN 100 flange on bottom for the sputtering
head respectively the sample table. The interior of the chamber can be accessed
by two DN 160 flanges on the front and back side of the chamber. During opera-
tion these flanges are shut by blind flanges. The process gas Ar is induced via a
DN 16 flange on the left side and the vacuum system is attached at a DN 40 flange
at the right side of the vacuum chamber. Ar and other gases can be induced into
the vacuum chamber by a needle valve, and the process pressure can be adjusted
to the needed values.
Vacuum system, cooling water, gas and power supply Figure 3.7 shows the
flow scheme of the tabletop reactor setup. The vacuum system consists of a
turbomolecular pump in line with a forepump. The forepump is a rotary vane
pump, that can provide a base vacuum in the vacuum chamber in the order of
10−2 mbar. Together with the turbomolecular pump, a base vacuum in the order
of 10−6 mbar can be reached. The exhaust gas of the vacuum system is fed into
the fume hood, as it might possibly be contaminated.
The high voltage needed for the glow discharge is provided by a DC sputtering
56
8/13/2019 Prediction of protein structural features by machine learning methods
Figure 3.7: Flow scheme of the tabletop reactor setup. The left branch shows the vacuum systemconsisting of a turbomolecular pump, a forepump, a vacuum gauge and a valve. The right branchshows the working gas supply consisting of an Ar line regulated by a needle valve and secondarygas line regulated by a needle valve. The top and bottom branches are the cooling water flux andreflux tubes of sputtering head respectively sample table. The cooling water was supplied by alaboratory water/air heat exchanger.
power supply with a voltage range of 0 - 1 kV, a current range of 0 - 1.2 A and
a power of up to 1 kW. The minus pole of the power supply is connected to the
electrically isolated blind flange and the sputtering head (so being the cathode),
its plus pole and the ground potential are connected to the sample table and vac-
uum chamber itself (so being the anode) for a sputter coating of the substrate. For
a sputter cleaning of the substrate, the polarity has to be reversed.
The standard working gas Ar is provided by the laboratory Ar line. The working
gas pressure inside the vacuum chamber can be controlled by a needle valve and
is monitored by a vacuum gauge. In case, that a reactive working gas is needed,
it can be fed into the reactor by a second needle valve.
The cooling water for sputtering head and sample table is provided by a temper-
ature controlled laboratory water to air heat exchanger. It is a closed system with
a cooling water reservoir of 10 liters.
3.1.2 Full size reactor
The full size reactor consists of a sputtering electrode and a carrier electrode, that
form a diode and are mounted inside a processing chamber (see figure 3.8). The
sputtering target is mounted to the sputtering electrode. The electrode contains
a magnetic assembly for electron confinement as well as cooling channels. The
carrier electrode consists of a water cooled substrate table as well as a cooled
carrier frame, that allows to mount sputtering masks and shields.
57
8/13/2019 Prediction of protein structural features by machine learning methods
Figure 3.8: (a) Schematic view of the full size reactor. On top is the sputtering electrode, whichis operated at a high voltage and therefore electrically isolated from the processing chamber. Themagnetic assembly (magnets, field closing plate) is built up identically to the tabletop reactor, butis now located outside of the processing chamber. The water cooling of the sputtering electrode isalso done from outside of the processing chamber. The carrier electrode is inside the processingchamber, water cooled and temperature monitored. It provides a carrier frame, that allows tointroduce masks and shields into the sputtering process. (b) Partial cut of the full size reactorwith installed sputtering and carrier electrode.
Sputtering electrode The sputtering electrode is a massive water cooled copper
component shaped like a trough (see figure 3.9). It has a size of 792 mm x 154mm at its fringe and a height of 65 mm. Unlike the sputtering head in the
tabletop reactor, which was mounted inside the vacuum chamber, the sputtering
electrode in this reactor is itself a part of the processing chamber. It works as a
cover of the processing chamber, which has a cavity on its top side that exactly
fits with the electrode. The sputtering electrode is lifted into the cavity and
finally bears on a special teflon isolating seal. The teflon seal has two important
functions: first, it seals the sputtering electrode to the processing chamber so that
the chamber is vacuum tight and can be evacuated down to ultra high vacuum
range. Second, it isolates the electrode to the grounded vacuum chamber and
allows the electrode to be operated at a high voltage of several kilovolts. The
concept is basically identical to the teflon seal in the tabletop experiments, but
the teflon seal here includes two integrated o-ring seals and is more advanced
from the vacuum engineering point of view.
The sputtering target is mounted underneath the sputtering electrode via 13 M5
screws. The target can be one single monolithic plate with size 702 mm x 122
mm x 10 mm or up to 13 single target elements with size 54 mm x 122 mm x 10
mm each. The size of one of this target elements corresponds to the size of the
sputtering targets of the tabletop reactor. The single target elements (’bricks’) can
therefore be used in the small tabletop as well as in the large full size sputtering
58
8/13/2019 Prediction of protein structural features by machine learning methods
Figure 3.9: Isometric view of the sputtering electrode (copper) with a partial cut. The magneticassembly (blue) is formed by about 300 Nd2Fe14B permanent magnets and shielded by the fieldclosing plate (light gray). An aluminum frame (gray) keeps all magnets in position. The target(green) consists of up to 13 single target elements and is mounted on the bottom side of thesputtering electrode by M5 screws. Cooling channels inside the bottom side of the electrode coolthe target and prevent the magnets from getting overheated. The channels are supplied withwater via flexible tubes that are attached to flanged sockets.
reactor.
The bottom side of the sputtering electrode contains wide flat cooling channels
that are only about 3 mm away from the top side of the target. They provide
cooling to a large area above the target and in parallel prevent the magnetic
assembly from getting overheated. To guarantee a good heat contact between
target and electrode, a 0.4 mm graphite foil is is placed between the targets and
electrode surface. The cooling channels end in two flanged sockets at the atmo-
spheric side of the electrode. From there they are connected via two electricallynot conductive flexible tubes to a water feedthrough that leads out of the glove
box. The feedthroughs themselves are connected to the central cooling water line.
The magnetic assembly consists of the cubic Nd2Fe14B permanent magnets sized
10 mm x 10 mm x 10 mm, that were already used in the tabletop reactor. About
300 of them are arranged rectangularly in two chains and form a magnetron race-
track (see figure 3.9). A cut view of the toroidal magnetic field geometry is shown
by figure 3.10.
Like in the tabletop reactor, the magnetic assembly shows again two main and
59
8/13/2019 Prediction of protein structural features by machine learning methods
Figure 3.10: Side cut of the sputtering electrode with field lines that indicate the direction of mag-netic force in the field generated by the magnetic assembly (calculated by the program VIZIMAG3.18). Unlike the magnetic assembly used in the tabletop reactor, this assembly produces twostrongly pronounced maxima that leave the assembly mainly through the plasma facing side of the electrode where the target is mounted. The side maxima are present, but very much sup-pressed. The attachment of an aluminum frame or similar constructions is not necessary, as theside maxima always stay within the sputtering electrode.
two side maxima of magnetic flux density. The bigger distance between the innerchain and the outer chain of magnets results however this time in an increased
size of the main maxima and vice versa in a decreased size of the side maxima.
The change in the magnetic geometry allows therefore to avoid an aluminum
frame around the target, as the electrode geometry itself can suppress the gener-
ation of a lateral secondary plasma ring.
Carrier electrode The carrier electrode is a water cooled rectangular copper ta-
ble sized 690 mm x 110 mm inside the processing chamber. It is mounted onto
a telescopic tray, that can be completely extended from the processing chamber.
Moreover it is adjustable in height, which means, that also the distance between
substrate and target can be adjusted. The carrier electrode contains wide flat cool-
ing channels that are only 2 mm away from the bottom side of the substrate. The
channels end in two flanged sockets at the bottom side of the electrode. Via two
full-metal flexible tubes they are connected to a UHV water feedthrough, that
leads out of the processing chamber into the glove box. Another pair of flexible
tubes connects the cooling channels to the central cooling water line.
On the carrier electrode a water cooled copper frame is mounted. Its position can
be adjusted in height relatively to the electrode, and it serves as a suspension if
60
8/13/2019 Prediction of protein structural features by machine learning methods
components like deposition shields3 or sputtering masks4 have to be mounted in
between the carrier electrode and the sputtering electrode.
Inside the carrier electrode there are five PT-100 temperature sensors mounted 1
mm beneath the surface. They continuously monitor the temperature of a sub-strate lying on the electrode. For coatings that require an elevated temperature, a
secondary substrate plate with electrical heating and temperature sensors can be
installed on top of the carrier electrode.
Processing chamber The processing chamber is a 110 liter stainless steel vac-
uum vessel with a cavity on its top side to mount the sputtering electrode (see
figure 3.8(b)). The interior of the chamber can be accessed via two DN 350 flanges,
two DN 200 flanges, one DN 100 flange as well as four DN 40 flanges. The two
DN 350 flanges, that are at the front and back side adverse of each other, can
be sealed with doors. They provide access to the inside of the chamber during
substrate mounting. The two DN 200 flanges, located at the left respectively right
side, provide additional access in case of repairs. Usually they are however sealed
with blind covers. The DN 100 flange at the chambers´ bottom as well as the DN
40 flanges on the left and the right side are used for the attachment of vacuum and
gas system as well as to feed through cooling water and temperature sensors.
Vacuum and gas system Figure 3.11 shows the flow scheme of the full size
reactor setup. Again the vacuum system consists of a turbomolecular pump in
line with a forepump, and again a base vacuum in the order of 10−6 mbar can
be reached. The pumps are connected to the processing chamber via the DN 100
flange in the bottom of the chamber as well as via a DN 40 flange at the chambers
side. The chamber is mounted inside of the glovebox, the pumps are mounted
outside. Two automatic shutter valves can separate the processing chamber from
the vacuum system. The exhaust gas of the vacuum system is filtered twice and
fed into the laboratory exhaust line, as it might possibly be contaminated.
The Ar atmosphere inside the glove box is continuously purified and providesan impurity content of ≤ 1 ppm O2 and H2O, which corresponds to a gas qual-
ity of industrial Ar 6.0. For cost efficiency reasons the standard working gas Ar
is thus extracted from the Ar atmosphere inside the glove box and not provided
separately. The gas pressure in the processing chamber is regulated via an au-
tomatic mass flow controller. Reactive working gases can be fed into the reactor
externally via a needle valve.
3Deposition shields can prevent undesired material deposition onto the walls of the vacuum
chamber.
4See chapter 5.1
61
8/13/2019 Prediction of protein structural features by machine learning methods
Figure 3.11: Flow scheme of the full size reactor installed in the radioisotope laboratory of the’Sektion Physik’ in Garching. The processing chamber containing the planar sputtering diode
is mounted inside a glove box filled with Ar. The vacuum system is mounted underneath theglovebox and consists of a turbomolecular pump, a forepump, three pressure sensors and threeautomatic valves. The working gas for the sputtering process is purified Ar from inside the glove- box, that is regulated via an automatic mass flow controller. The glove box itself is an autonomicsystem. The two systems are connected to the auxiliary devices: a heat exchanger system, the gas bottle repository and the laboratory air system.
62
8/13/2019 Prediction of protein structural features by machine learning methods
Power supply, cooling water system The high voltage needed to supply the
glow discharge is provided by a DC sputtering power supply. It provides a volt-
age range of 0 - 800 V, a current range of 0 - 30 A and a power of up to 15 kW.
The reactor is operated with the sputtering electrode as cathode and the carrierelectrode as anode for a sputter deposition on the substrate. For a cleaning of the
substrate by sputter erosion, the polarity can be changed by an automatic relay.
The cooling water for the full size reactor is provided by a 20 kW self regulating
water to water heat exchanger system. It is a closed system with a cooling water
reservoir of 80 liters (see 3.12).
Glove box, gas purification system The glove box is filled with a high purity
Ar atmosphere, which is circulated and regenerated by a gas purification system.
The oxygen and a water impurity content is continuously kept below a value of ≤ 1 ppm each. The glove box guarantees, that not only the sputtering process it-
self but also related oxygen sensitive processing steps as the handling of cleaned
and coated substrates can be done in an inert atmosphere. A surface pollution
due to oxidation can therefore be avoided almost completely. Furthermore, the
box allows to handle harmful substances in much larger amounts as it would be
possible in a fume hood5.
The glove box together with the gas purification system form an autonomic in-
stallation. They have an automatic pressure and atmosphere regulation, and an
own and independent programmable logic controller (PLC) unit that operates thesystem.
Electronics The full size reactor is a half-automatized system. Preparational
works as mounting the sputtering target, preparing the substrate, removing the
coated substrates and cleaning of the setup have to be done by operating per-
sonal. The processing steps themselves as pumping the processing chamber, ad-
justing the working gas pressure as well as start, control and monitoring of the
sputtering process are done automatically by a PLC unit.
Processing chamber, power supply, vacuum and gas system as well as the coolingwater system with the heat exchanger are controlled and monitored by the PLC
unit. Glove box and gas purification system are controlled autonomically.
Auxiliary systems The full size reactor cannot be operated completely autar-
kic but has to use some systems of the radioisotope laboratory it is installed in.
The first of this systems is the radioisotope exhaust-air plant. It holds the pump
5During our work we identified three types of substances, that represented a risk during han-
dling: toxic substances (U, Cd), highly or self inflammable substances (U, Zr) and radioactive
substances (U).
63
8/13/2019 Prediction of protein structural features by machine learning methods
Figure 3.12: Heat exchanger system for the full size reactor setup installed in an auxiliary room of the radioisotope lab. The cooling circuit of the full size reactor setup is a closed system with a 80liter reservoir of deionized water. A pump drives the water circulation in the circuit.The processheat is removed over a plate type water to water heat exchanger and released into a cooling waterstream coming from a groundwater well and going into another groundwater well.
64
8/13/2019 Prediction of protein structural features by machine learning methods
gas composition diode geometry topography topographyplasma voltage ion flux purity pollution
plasma current ion energy homogeneity microstructure
substrate temperature ionization efficiency microstructure
substrate bias voltage
target temperature
Table 3.1: Factors, that have an influence on the deposition process inside a sputtering reactor.
exhaust of the vacuum system and of the Ar purification system during routine
operation. In the case of an emergency it guarantees underpressure inside the
glove box to retent harmful materials and radioactivity. Both functions are nec-
essary to assure compliance with radiation protection regulations. The second
system is the gas bottle repository. It supplies the full size reactor setup with Ar
for the processing chamber and the glove box and ArH for the regeneration of
the filters in the gas purification system. The third system is the automated alert
system, that is directly linked to the central control room of the TUM campus. As
the full size reactor is constructed to process actual nuclear fuel, this alert system
is a mandatory requirement to receive a license for operation.
3.2 Operation
A plasma can be ignited between the electrodes of a sputtering reactor, when the
correct pressure and voltage parameters are met. The ion bombardment and ero-
sion of the cathode starts immediately, and the sputtered material is dispersed
inside the surrounding vacuum chamber.
The sputtering process inside a sputtering reactor is characterized by reactor, tar-get and substrate properties as well as processing parameters (see table 3.1). The
properties of deposited film are to a large extent determined by these factors.
3.2.1 Reactor properties
The ion sputtering process is strongly influenced by the design of the reactor and
by the properties of the plasma it can produce. The reactor design includes the
diode geometry as well as the geometry of the magnetic assembly. It determines
the plasma position, by that the area of sputter erosion and material ejection,
65
8/13/2019 Prediction of protein structural features by machine learning methods
Figure 3.13: Paschen curves recorded for a distance d ≈ 10 cm between the electrodes. Thisdistance is identical for both reactors.
the spatial distribution of material deposition and the conditions necessary
for plasma ignition and operation. The plasma properties are affected by the
degree of electron confinement in the magnetic field and the resulting ionization
rate. They determine the plasma density and the rate of sputter erosion and
deposition.
Plasma ignition and operation The pressure and voltage conditions that are
necessary to ignite a glow discharge plasma in one of our sputtering reactors are
given by the Paschen curves (see chapter 2.2). They refer to a glow discharge
inside a pair of electrodes with distance d. For small values of d, a large fraction
of the material ejected from the sputtering target will reach the substrate surface,
as the substrate covers a large solid angle of the ejected material flux. A small
value of d is thus desirable. Indeed a too small value of d is fatal for the growthprocess of the deposited film, as energetic particles from the plasma region will
bombard the substrates surface. Indeed we found in experiment, that a value of
d ≥ 70 - 80 mm is necessary to have a largely undisturbed growth process. To be
secure, we chose d to be 100 mm for both sputtering reactors. Figure 3.13 shows
the measured Paschen curves for different target materials in this configuration.
They are valid both for the tabletop as well as for the full size reactor.
Once ignited, the plasma quickly reaches a stable mode of operation with
constant plasma voltage and plasma current. The voltage-current (or: U-I)
66
8/13/2019 Prediction of protein structural features by machine learning methods
Figure 3.14: U-I characteristics in the tabletop reactor for some available target materials at differ-ent pressures. (a) Ti (b) U-8Mo (c) Zr (d) Al. The slope of the U-I curve determines the electricalresistance of the plasma. Figure (b) shows the typical evolution of plasma resistance for a glowdischarge: for low currents and voltages the number of free electrons and ions in the plasma is
small and the plasma resistance thus large. Higher voltages promote the generation of more freeelectrons and ions due to ionization and the plasma resistance gets smaller and smaller. The U-Icurves in the figures (a), (b) and (d) in general show the same evolution. Unexpected exceptionswere however some of the U-I curves in the low pressure range of 10−3 mbar and the low currentrange. The slope of these curves indicates sometimes even negative plasma resistance. The reasonfor this behavior is not understood yet. Most probably instabilities in the working gas pressureare responsible. It could also be possible however, that the slope illustrates a transition in the gasdischarge type, from the instable dark discharge, that can exist for pressures ≤10−3 mbar, to themagnetically enhanced glow discharge, that can exist for pressures ≥10−3 mbar.
characteristic, i.e. the ratio of plasma current I per applied voltage U, determines
the electrical resistance of the plasma. The slope of the U-I curve is a measure forthe effectivity of ionisation processes in the plasma and the electron confinement.
A small slope means efficient ionization, good electron confinement and the
possibility to operate the plasma even at low working pressures. Figures 3.14
and 3.15 show the resulting U-I characteristics for the tabletop respectively the
full size reactor recorded for different target materials at different pressures.
Plasma position and erosion area As mentioned in chapter 2.2.3, a magneti-
cally enhanced glow discharge works at much lower pressures than a normal
67
8/13/2019 Prediction of protein structural features by machine learning methods
Figure 3.15: U-I characteristics in the full size reactor for some available target materials at dif-ferent pressures. (a) Al (b) Zry-4 (c) Ti. Unlike the curves measured for the tabletop reactor, allof these curves show the typical evolution of plasma resistance for a glow discharge. This isprobably because the working gas pressure inside the full size reactor is adjusted automatically.
68
8/13/2019 Prediction of protein structural features by machine learning methods
glow discharge. Actually it is usually even operated at pressures, that would
not allow to sustain a normal glow discharge at all. This is only possible due
to the magnetical field that is applied to the sputtering diode by the magnetic
assembly. The position and geometry of this field determines the regions of electron confinement, and by that the regions where a glow discharge can be
operated. Outside of this electron confinement region the pressure is too low to
sustain a discharge without magnetic field. The magnetical field geometry thus
determines, where the glow discharge plasma will be positioned during reactor
operation and by that which areas of the target actually face ion bombardment
and sputter erosion.
Figure 3.16 left side shows the discharge plasma in the tabletop respectively the
full size reactor. The ring shape of the plasmas is clearly visible. The particular
magnetic flux densities are shown on the right side of the figure. It should be noted, that the plotted flux densities do not show a ring shape, as they
only illustrate the the absolute value of local magnetic field strength, but not
the direction of the field. The shape of the discharge plasma is however deter-
mined by the trajectories of the electrons gyrating around the magnetic field lines.
The position and density of the plasma determines, which areas of the sputtering
target will face ion bombardment and how intense the bombardment will be. As
a result, the sputter erosion trenches, that are typical for magnetron sputtering,
grow exactly according to the structure of the glow discharge plasma. They canactually be seen as projections of the plasma structure onto the target surface,
where the boundary of the erosion zone corresponds to the original outer
plasma dimensions, and the depth profile of the erosion zone illustrates the
density profile of the plasma. The figures 3.17 and 3.18 show the depth profile
of the erosion trenches and thus the plasma structure for the tabletop reactor
respectively for the full size reactor.
Material deposition The erosion trench in the sputtering target does not only
correspond to the position of the discharge plasma, but it also represents the
source of material ejection in the sputtering process. The depth profile of the
trench accordingly determines the local ejection rate. The material is ejected from
the target surface nearly into the complete half space normal to the surface. A
fraction of the ejected material directly reaches the substrate and gets deposited
there, another fraction reaches the substrate after reflection from the reactors
walls. The resulting deposition profile is dependent both from the plasma
geometry as well as from the reactor geometry. It is shown in figure 3.19 for
the tabletop reactor, in figure 3.20 for the full size reactor, and was gained by
69
8/13/2019 Prediction of protein structural features by machine learning methods
Figure 3.16: (a)Left: Plasma ring during operation of the tabletop reactor. It is generated by themagnetic field of the magnetron racetrack and causes an increased but inhomogeneous erosion of the target. Right: Side cut of the sputtering head with illustration of the absolute value of localmagnetic flux density in the field of the magnetic assembly (calculated by the program VIZIMAG3.18). The colors indicate the local flux density. The minimum (black) corresponds to values ≤ 1
Gs, the maximum (dark red) corresponds to 25500 Gs. (b)Left: Plasma ring during operation of the full size reactor. Right: Side cut of the sputtering electrode with illustration of the absolutevalue of local magnetic flux density in the field of the magnetic assembly. The minimum (black)corresponds to values ≤ 1 Gs, the maximum (dark red) corresponds to 19000 Gs.
70
8/13/2019 Prediction of protein structural features by machine learning methods
Figure 3.17: (a) The erosion trench in the sputtering target of the tabletop reactor was measured bythe optical profile measurement system ATOS at the TUM Institute for Forming and Founding.
The brightness indicates the depth of the erosion trench. Black color indicates the maximumdepth, while white color is minimum depth. The shades of gray in between correspond linearlyto the local depth. The local depth of the erosion trench in the target is also directly proportionalto the local intensity of ion bombardment and thus to the density of the glow discharge. Thefigure thus also shows the actual position and density of the plasma ring. (b) Picture of an actualsputtering target for the tabletop reactor with erosion trench.
71
8/13/2019 Prediction of protein structural features by machine learning methods
Figure 3.18: (a) The erosion trench in a sputtering target of the full size reactor measured by theATOS system at the TUM Institute for Forming and Founding. The brightness again indicates thedepth of the erosion trench. The arrangement of 13 single target elements to the complete full sizesputtering target is illustrated. It is clearly visible, that the plasma ring does not affect the positionof the screws that are needed to affix the target elements. (b) Picture of a sputtering target for thefull size reactor with erosion trench. The shown target plate does however not consist of 13 singleelements but is in this case just one massive plate.
thickness measurements of very thick sputtered copper deposits.
The amount of material that gets deposited per time is denoted as deposition rate.
It is continuously measured by a rate monitor at one point of the vacuum chamber
by an crystal monitor. The measurement principle is the change in oscillation
frequency of the crystal that goes along with the mass of material that is deposited
on the crystal surface. From the deposition rate at one particular position, that can
be measured absolutely, and the material deposition profile, that was measured
just relatively and normalized, it is possible to determine the absolute deposition
rate at any point of the substrate.
3.2.2 Target properties
The target properties affect the sputtering process itself as well as the properties
of the deposit. The target properties relevant for sputtering include target mate-
rial type, crystallographic structure, purity and homogeneity as well as surface
roughness and topography6.
6The heat conductivity is of course also an important target property, as the target has to be
cooled during operation to avoid melting or evaporation. It has however no direct influence on
72
8/13/2019 Prediction of protein structural features by machine learning methods
Figure 3.19: Normalized material deposition profile of the tabletop reactor with a substrate target
distance of 100 mm. It was gained by thickness measurements of very thick sputtered copperdeposits. Top: Isometric view. Bottom: Length and width profile.
73
8/13/2019 Prediction of protein structural features by machine learning methods
Figure 3.20: Normalized material deposition profile of the full size reactor with a substrate targetdistance of 100 mm. Top: Isometric view. Bottom: Length and width profile.
74
8/13/2019 Prediction of protein structural features by machine learning methods
Table 3.2: Surface binding energy and energy threshold for the available target materials calcu-lated by SRIM. In case of multicomponent materials, the surface binding energy is given for themost important constituents, and the energy threshold refers to the first constituent to be ejected.The last column lists the impurity content of the different target materials as given by the manu-facturers.
Binding energy and energy threshold The target material type and crystallo-
graphic structure primarily determine the binding energy of the target atoms re-
spectively the energy threshold necessary for an atom ejection (see previous chap-
ter). Both parameters were calculated for all target materials that were availableto us by the program SRIM (see appendix A1) and are listed in table 3.2.
The energy threshold defines the lower limit of needed ion energy to cause an
atom ejection, and by that the necessary acceleration voltage. As it can be seen,
it is around 30 eV for nearly all of the materials even though the surface binding
energies are all in the range of 5 eV. This is due to the fact, that only a minor part
of the energy of the bombarding ions is actually transfered to the ejected atoms,
while most of the energy is distributed onto the target bulk.
Impurities and homogeneity As mentioned in 2.1 impurities influence thegrowth of the deposited film. An absolutely pure target material would be
desirable, but usually cannot be achieved at all or only with huge effort and
costs. Thus a certain impurity has to be accounted and accepted. The impurity
content of the target materials available to us was given by the manufacturers of
the single targets and is listed in the last column of table 3.2. In case of multi-
component materials - especially alloys - it is sometimes difficult to distinguish
between actual impurity content and small amounts of desired additives. What
further complicates the situation is the fact, that for many multicomponent
sputtering.
75
8/13/2019 Prediction of protein structural features by machine learning methods
Zry-4 Zr (97.35-98.48), Sn (1.2-1.7), Fe (0.18-0.24), Cr (0.13-0.7), Hf (0.01)Al-6061 Al (95.85-98.46), Fe (0-0.7), Si (0.4-0.8), Cu (0.15-0.4), Mg (0.8-1.2),
Mn (0-0.15) , Cr (0.04-0.35), Zn (0-0.25), Ti (0-0.15)
AlFeNi Al (95.2-97.1), Fe (0.8-1.2), Ni (0.8-1.2), Mg (0.8-1.2),
Cr (0.2-0.5), Mn (0.2-0.6) , Zr (0.06-0.14)
Table 3.3: Composition of the available multicomponent target materials according to the manu-facturers. For most elements only a range of concentration is given. It is thus hardly possible todistinguish between necessary constituents and undesired impurities.
materials there is no uniform composition. Instead, only ranges for the most
important constituents are given (see table 3.3).
For multicomponent materials in general, the homogeneity should be considered
as well. The term homogeneity refers to the spatial distribution of the constituent
elements in the target material. An inhomogeneous distribution of these ele-
ments in the sputtering target results in a variation of ejected flux composition
during the sputtering process. By that, the single elements will get distributed
non-uniformly in the deposited film, which is usually undesired. To get a ho-mogeneous elemental distribution in the deposited film, the homogeneity of the
target material does however not have to be absolutely perfect. The effect of
small inhomogeneities should theoretically become blurred by sputter deposi-
tion. Only large inhomogeneities should thus cause a perturbing non-uniform
elemental distribution.
Surface roughness and topography The surface roughness and topography of
the sputtering target determine, under which angles the bombarding ions will
hit the target, how many atoms they will eject, and which angular and energetic
distribution the ejected atoms will have. Figure 3.21 shows a fresh sputtering
target as we use it in the tabletop sputtering reactor, including macroscopic
topography and microscopic roughness. A target for the full size reactor would
show a similar surface. As it can be seen, the target is macroscopically plain,
but microscopically very rough. The bombarding ions will thus face all kinds
of different angles of incidence, and the resulting macroscopic angular ejection
characteristic will be a mixture of the various different microscopic ejection
characteristics for different angles and different energies.
76
8/13/2019 Prediction of protein structural features by machine learning methods
Figure 3.21: Left: Fresh U-8Mo sputtering target for the tabletop reactor. It can be used as a target
element for the sputtering target of the full size reactor as well. The surface seems very plain andsmooth. Right, top: Target surface with a resolution in millimeter scale. First scratches becomevisible, but the surface still seems smooth. Right, bottom: Target surface with a resolution inmicrometer scale. The surface is not smooth any more but covered with massive scratches thatresult from fabrication.
77
8/13/2019 Prediction of protein structural features by machine learning methods
Figure 3.22: Trench profile of the erosion zone in a Cu target. If the erosion zone reaches the bottom side of the target, the sputtering process has to be stopped and the target has to be re-placed. Otherwise the suspension structures will be eroded. In our sputtering reactors and withour diode and target geometry, the sputter eroded material amounts about 20 - 25 % of the totaltarget mass for the tabletop reactor and about 30 - 35 % for the full size reactor. The remainingmaterial is not used in the process.
Surface roughness and topography do not stay constant during the sputtering
process, but change with the increasing erosion of the target surface. Figure 3.22
shows a sputtering target with the characteristic erosion trench that forms after
several hundred hours of sputter erosion. Again it can be noted, that a target for
the full size reactor would show a similar surface structure.
During sputtering the macroscopic topography of the target is continuously
changed from a plain surface to a curved surface by the evolution of the erosion
trench. The microscopic surface changes from the original roughness to a smooth
surface with micrometer-sized conical and pyramidal structures, that are typical
for the sputter erosion of polycrystalline materials (see figure 3.23). The chang-
ing topography affects the atom ejection characteristics of the target as well. On
microscopic level, the bombarding ions still face all different angles of incidence.
On macroscopic level, the flux distribution of ejected material will get ’narrower’
compared to the flux distribution at beginning of the target life time, meaning that
more material is ejected normal to the target surface and less material is ejected at
larger angles towards normal. The reason for this shift in ejection distribution are
the boundaries of the erosion trench, that have a shadowing effect for material
ejected under too large angles.
78
8/13/2019 Prediction of protein structural features by machine learning methods
Figure 3.23: Left: U-8Mo sputtering target after several hundred hours of sputter erosion. Thesurface of the erosion areas has changed from the original very rough and scratchy texture toa rather smooth one (right, top), that shows micrometer-sized conical and pyramidal structures(right, middle). The surface apart from the erosion areas is unaltered, but covered by a layerof apparently re-deposited material (bottom). The target material composition was measured inthe labelled regions. For the millimeter scale (right, top) no significant change of composition be-tween target center (1), erosion trench center (2) and target edge (3) was observed. On micrometerscale (right, middle) it was also not possible to resolve any difference in composition between theconical structures (1,2,3) and the plain regions in between (4,5). The layer found on the targetedges (bottom) however shows a significant difference between layer material (1) and target bulkmaterial (2), which indicates that the material was apparently redeposited.
79
8/13/2019 Prediction of protein structural features by machine learning methods
Redeposition Figure 3.23 also shows a layer of material, that has accumulated
on the target surface outside of the erosion area. This material most probably
consists of atoms, that get ejected from the target, are reflected from the surface
of the substrate respectively deposit, and are finally deposited again on the targetsurface. We measured the composition of this material and identified it as U-
Mo with an significantly increased content of Mo. This is in good accordance
to the simulations made in appendix A1, that predict a higher probability of Mo
reflection and a lower probability of U reflection from a U-Mo surface and thus
an enrichment of Mo in redeposited material.
Cross-magnetron effect A further effect concerning the plasma structure could
also be observed on our sputtering targets. In figure 3.24a it can be seen, that the
erosion zone at a used sputtering target is not homogeneous but shows areas of
increased erosion in the target corners. This effect was first described theoretically
by Shidoji [shi00] in 2000, and used by Lopp [lop02] and Fan [fan03] in 2002 and
2003 to explain the anomalous erosion in magnetron arrangements with strong
magnetic fields. The so-called cross-corner effect (CCE) or cross-magnetron effect
(CME) is basically caused by the used magnetic geometry [dep08]. We use in our
reactors a rectangular shaped magnetic racetrack (see figure 3.5 and 3.9), that cre-
ates a toroidally shaped magnetic field. For geometrical reasons, this magnetic
arrangement yields a distinctly smaller magnetic flux density in the curved sec-
tions than in the straight sections. The E× B electron current, that always appearsin a magnetically enhanced plasma due to the E × B drift, flows along the con-
ductive discharge plasma torus as a closed loop. By an inhomogeneous magnetic
flux density the E × B current is disturbed, and the electrons accumulate when
coming from a low flux region and entering a high flux region. This electron ac-
cumulation regions increase the local ionization efficiency drastically and cause
the zones of increased erosion.
Next to plasma geometry, CCE imposes a further source of asymmetric deposi-
tion behavior in the sputtering reactor. Means to reduce the asymmetry will be
shown in section 5.
3.2.3 Substrate properties
The properties of the substrate affect the growth and the properties of a deposited
film. The substrate properties relevant for sputtering include substrate material
type, crystallographic structure, surface roughness and topography as well as
surface pollution. The material type, crystallographic structure and surface pol-
lution of the substrate determine, where and how film growth starts and how
good the evolving film will adhere to the substrate. Once the substrate surface is
80
8/13/2019 Prediction of protein structural features by machine learning methods
Figure 3.24: (a) U-8Mo sputtering target after erosion. Areas with anomalous erosion behavior areclearly visible (see markings). (b) Scheme to visualize the inhomogeneous magnetic flux density
and the E × B electron current, that together cause the CCE. (c) Simulation of the anomalouserosion behavior caused by CCE (from [lop02]).
however completely covered with a closed film of several atomic layers thickness,
only the microscopic surface roughness and the surface topography will further
influence the film growth process.
Material and crystallographic structure The kind of application we want to
use sputter deposition for does not require a special material or crystallographic
structure of the substrate to improve film growth. In fact, the situation is even
reversed: a substrate of given material and given crystallographic structure has
to be coated without affecting its properties. For us it is thus important, that a
substrate will be covered completely, and that the growing films have a good
adhesion to their substrate. Thus we only have to consider surface roughness,
topography and pollution of the substrates.
Topography and surface roughness The topography of all substrates we used
was macroscopically flat. Curved substrates can in principle be used as well, but
shadowing effects resulting from the curvature have to be accounted. For such
substrates it might be necessary, to change their orientation towards the ejected
material flux during deposition to ensure that the whole surface is covered.
Microscopically rough surfaces will also lead to a shadowing effect, but on mi-
croscopic scale. This microscopic shadowing is similar to the grain shadowing
effect that is responsible for the formation of the zone 1 structure in the Thornton
81
8/13/2019 Prediction of protein structural features by machine learning methods
zone model (see chapter 2.1). An increasing surface roughness will thus increase
the total shadowing (consisting of grain and roughness shadowing) and thus pro-
mote the formation of film structures according to the Thornton zone 1 [tho77].
The degree of local microscopic surface roughness determines, how large the ad-ditional shadowing effect will actually be, and how much it will affect the local
film growth at a particular point of the substrate surface.
The Thornton zone model, as it was shown in figure 2.8, does not account for
the local influence of surface roughness on film morphology but only gives the
morphological development of the growing film in dependency of temperature
and pressure. Indeed it is hardly possible to extend the Thornton zone model
to a third ’roughness axis’, as the term ’surface roughness’ summarizes several
qualities of the surface topology, and each one is supposed to have an influence
on the microscopic shadowing. In general, it is thus only possible to state, that anincreasing surface roughness will promote the zone 1 structure, as it is the only
one affected by microscopic shadowing.
The microscopic surface of the substrates we used was either polished or grinded,
i.e. the surface had a roughness of << 1 µ m for the polished surfaces and < 5 µ m
for the grinded surfaces (see figure 4.9b). We can thus assume, that the grinded
samples could show a tendency towards an increased zone 1 structure, which
should be regarded in respect to film growth control (see next paragraph).
Pollution Surface pollution nearly always worsens film adhesion significantly.
The removal of surface pollution turned out to be the major challenge during
substrate preparation. The main pollutants we encountered were oxides as well
as organic and inorganic contaminations from substrate polishing and handling.
The contaminations can relatively easily and sufficiently be removed by chem-
ical cleaning with distilled water, isopropyl alcohol and acetone. The removal
of oxides is usually more complicated. Thick oxide layers (≥ 1 µ m, see figure
4.9a) were removed mechanically by grinding and polishing. Chemical treat-
ments were investigated as well, but we were neither able to identify appropriate
cleaning agents nor a satisfying cleaning procedure. Thin oxide layers (<< 1 µ m)
were only removed if required. We observed, that especially in the production of
experimental samples, thin oxide layers can often be accepted and sometimes not
even be avoided. In this cases, we did not remove the oxides but coated on the
oxidized substrates. If oxidation free surfaces were necessary however, we used
sputter erosion before the coating step to remove all remaining pollution (see next
chapter).
82
8/13/2019 Prediction of protein structural features by machine learning methods
The processing parameters are the most important factors during the operation
of a sputtering reactor, as their intention is to actively control the sputtering pro-cess. Not all of the process parameters listed in table 3.1 are however controllable
in our sputtering reactors.
Working gas pressure and composition The working gas pressure in the
tabletop reactor can be adjusted via two needle valves. These two valves allow
to use and mix two different gases to gain a suited working gas pressure and
to control the working gas composition. Each needle valve has an adjustable
flow rate of 0 - 5000 sccm
min . With the given turbomolecular pump, the working gaspressure can be adjusted between 10−4 - 10−1 mbar for continuous operation.
The standard working gas is Ar 5.0 with an impurity content ≤ 5 ppm. At a
working pressure of 10−3 mbar, this corresponds to an impurity partial pressure
of ≤ 10−8 mbar. As the base vacuum in the reactor is 10−6 mbar, the impurity
content of the Ar can be neglected compared to the leak rate of the vacuum
chamber. The leak rate itself causes however an impurity content of approx.
1000 ppm during the process. Therefore the working gas composition can be
controlled in the order of approx. 0.1 %.
In the full size reactor, the working gas pressure is adjusted by a mass flow
controller. The standard working gas is Ar 6.0. A manually controlled needle
valve allows to add additional gases to the working gas, before it is fed into the
processing chamber. The mass flow controller has an adjustable flow rate of 0
- 100 sccmmin , which allows in combination with the vacuum system to adjust the
working gas pressure between 10−5 - 10−1 mbar. The impurity content of the
used Ar is ≤ 0.1 ppm. The base vacuum in the full size reactor is also 10−6 mbar,
the impurity content due to leaks is however much smaller than in the tabletop
reactor, as the whole processing chamber is surrounded by inert atmosphere.
The impurity partial pressure during process should therefore be of the order of
10−9 mbar or 10−4 %.
Plasma voltage and current The plasma voltage and current can be controlled
by high voltage supplies. The ranges are 0 - 1 kV and 0 - 1.2 A for the tabletop
reactor respectively 0 - 800 V and 0 - 32 A for the full size reactor. The total dis-
charge power is limited to 1 kW respectively 15 kW. Plasma voltage and current
can however not be chosen freely, but are dependent on the electrical resistance
of the plasma and by that on the working gas pressure. The dependency is
described by the U-I-characteristics (see subsection 3.2.1). The plasma voltage
83
8/13/2019 Prediction of protein structural features by machine learning methods
on the other hand determines the maximum available acceleration voltage for
ions in the glow discharge, and therefore the maximum ion energy during
bombardment of the target and the total sputtering yield (see appendix A1). The
plasma current is a measure for the number of ions bombarding the target.
Substrate temperature The temperature of the substrate during sputtering
process is an equilibrium temperature determined by heat deposition and heat
removal. Sources of heat for the substrate are particle bombardment and radia-
tion from the glow discharge plasma as well as eventually integrated electricalheating elements in the substrate holder. Heat is on the other side removed from
the substrate primarily by the cooling water. The link between heat sources
and heat sink is thus the substrate, or more precisely the heat conduction of the
substrate. A good heat conduction will result in good heat removal, and thus in
a substrate temperature close to the cooling water level even when a high heat
load is applied to the substrate. If the heat conduction is however weak, the
substrate temperature might reach values far above the cooling water level even
for relatively small heat loads.
The cooling water temperature for the sputtering reactors can hardly be influ-enced, and the rate of heat removal can thus be seen as constant. The plasma
heating can also be seen as constant for a given sputtering process, as plasma
voltage and current are kept at constant values. Means for controlling the sub-
strate temperature are thus only heat conduction and artificial heating elements.
In case of the tabletop reactor, the heat conduction between the copper substrate
table and the water cooled copper table foot can be adjusted by inserting stainless
steel spacer disks. There is further a special table plate with an internal heater.
Both measures allow to adjust the substrate temperature in the range of 20 - 300C. Higher temperatures have not been tested to avoid damages to the setup, but
seem possible. If no spacer disks and no heater is used, the substrate temperature
will always be around 20 C during operation.
In the full size reactor it is also possible to insert a steel spacer plate between
the water cooled copper carrier electrode and the substrate as a simple mean to
worsen the heat conduction. Only by this measure we observed, that substrate
temperatures of several hundred C can be reached. It is also possible to insert
a secondary copper substrate plate with electrical heating element on top of
the carrier electrode. If no spacer and no heating plate is used, the substrate
temperature is usually around 20 C during operation.
84
8/13/2019 Prediction of protein structural features by machine learning methods
Substrate bias voltage, target temperature Both sputtering reactors do cur-
rently not have the possibility to apply a bias voltage to the substrate or to control
the target temperature. Both could also be realized if needed. Thus the substrate
bias is permanently 0 V in both setups. The target temperature is strongly de-pendent on the heat contact between target and target cooling and on the plasma
power. It covers the range from 100 C for good contact and/or low power up to
values > 1100 C for bad contact and/or high power.
3.3 Film growth control
As already shown in chapter 2.1, it is possible to control the film growth process
to produce a deposit with defined microstructure. But according to Thornton,not only the morphology but also the phases and some mechanical properties of
a sputter deposited film are mainly determined by working gas pressure and sub-
strate temperature [tho77]. To reach a certain film morphology, a certain phase or
a particular mechanical behavior in a coating of a given material, it is thus nec-
essary to conduct the coating process at a pressure and a substrate temperature
that allow the formation of this quality.
Morphology Figure 3.25 shows once again the Thornton zone model for sput-
ter deposited films. As previously shown, working gas pressure and substrate
temperature are processing parameters, that can be controlled in our sputtering
reactors within certain technical limits. In both of our reactors, we are able to
cover the complete pressure axis shown in the figure. We are however not able to
cover the complete temperature axis that is shown, especially for materials with
a high melting point. Thus not every morphology can currently be reached for
every material in our reactors.
Table 3.4 lists the melting points of all the target materials that were available to
us as well as the expected zone transition temperatures between the Thorntonzone structures 1, T, 2 and 3 at a working gas pressure of 3·10−3 mbar. We usually
conducted the sputter deposition at this pressure, as it seems us to be a good
compromise between the pressure requirement of the glow discharge (stable and
confined in a range between 1·10−3 - 5·10−2mbar), the attempt to reduce ejected
atom scattering in the gas phase (at lower pressures more material flux reaches
the substrate) and the aim to avoid the zone 1 structure for a deposition at room
temperature.
In the last column of table 3.4 it is listed, which zonal structure can be expected
85
8/13/2019 Prediction of protein structural features by machine learning methods
Figure 3.25: General Thornton zone model for the working gas Ar. At a pressure of 3·10−3 mbar(labeled blue) the homologous temperatures T/Tm for the zone transitions are given as follows:zone 1/T ≈ 0.12, zone T/2 ≈ 0.44, zone 2/3 ≈ 0.72. The according temperature values are listedin table 3.4.
material Tm zone 1/T zone T/2 zone 2/3 expected structure
[K] [C] [C] [C] @ room temperature
Zr 2130 -17 664 1261 T
Ti 1941 -40 581 1125 T
Nb 2750 57 937 1707 1
Bi 1837 -53 535 1050 T
Si 1683 -71 468 939 T
Al 933 -161 138 399 TZry-4 2123 -18 661 1256 T
U-8Mo 1408 -104 347 741 T
Al-6061 925 -162 134 393 T
AlFeNi 922 -162 133 391 T
Table 3.4: Melting temperatures and expected zone transition temperatures for all available coat-ing materials at a working gas pressure of 3·10−3 mbar Ar according to the Thornton zone model.For a deposition at room temperature one expects the zone T structure for nearly all listed mate-rials.
86
8/13/2019 Prediction of protein structural features by machine learning methods
Highly disordered, amorphous-like structures are expected, if adatom mobility
is negligible and the adatoms come to rest at the point of their impingement.
This is the case for very low homologous temperatures T/Tm
according to the
zone 1 structures. Higher values of T/Tm, that allow a certain adatom surface
mobility, promote the formation of equilibrium high temperature phases, which
corresponds to the zone T morphology. At more elevated substrate temperatures
adatom mobility will finally reach a level adequate to form the phases predicted
by the equilibrium phase diagram. This is the case for the zone 2 and 3 structures.
Table 4.2 lists the expected phases for a deposition at room temperature as well
as the phases that would be present if the materials were in thermodynamic
equilibrium at room temperature.
It should be noted, that a high temperature phase that is formed on a high
temperature substrate during sputter deposition may be lost by bulk diffusion
during a too slow cool down. A high temperature phase formed on a low
temperature substrate on the other side is relatively stable towards diffusion due
to low bulk diffusion rates.
7Zone T is characterized as a compact structure consisting of densely packed fibrous grains.8Zone 2 and 3 are characterized as a dense columnar respectively an equiaxed grain structure.
9Zone 1 consists of tapered columnar grains separated by pores or voids.
87
8/13/2019 Prediction of protein structural features by machine learning methods
Figure 3.26: Schematic illustration of the influence of the substrate temperature on the crystallo-graphic phase formation in a sputter deposited film (according to [tho77]).
material phase in thermodynamic expected phase forequilibrium @ room temperature deposition @ room temperature
Zr hcp fcc
Ti hcp fcc
Nb bcc unclear
Bi rhomboedric unclear
Si diamond cubic diamond cubic
Al fcc fcc
Zry-4 hcp fcc
U-8Mo orthorhombic bcc
Al-6061 fcc fcc
AlFeNi fcc fcc
Table 3.5: Comparison of the crystallographic phases of target materials at thermal equilibrium atroom temperature and of the expected phases in films that have been sputter deposited at roomtemperature. For allotropic materials that get deposited in zone T structure (like Zr, Ti, Zry-4and U-8Mo) one can expect the formation of the high temperature phases. For non-allotropicmaterials in zone T or zone 2 structure (like Si, Al, Al-6061 and AlFeNi) the equilibrium phasewill most probably be formed. For Nb and Bi it is not clear, which phase can be expected.
88
8/13/2019 Prediction of protein structural features by machine learning methods
Mechanical properties The morphology determines the hardness, strength and
ductility of a sputter deposited film. The zones 1 and T are characterized by
a high dislocation density, which is a result of the low adatom mobility during
formation. Accordingly, films in these structures tend to have a high hardnessand strength, but only small ductility. With increasing substrate temperature the
dislocation density decreases. Correspondingly this also decreases hardness and
strength, but increases the ductility of the film. The according morphologies are
the high zone T and the low zone 2 structure. Films in the high zone 2 or the
zone 3 structure finally show the hardness, strength and ductility values of fully
annealed bulk materials.
89
8/13/2019 Prediction of protein structural features by machine learning methods
We investigated the sputter deposition of U-Mo in detail at the example of U-8Mo
(see also [can11]). We analyzed the composition of a sputtering target of U-8Mo before and after the sputtering process as well as the composition of a deposit
produced during the sputtering process.
U-8Mo target erosion Figures 3.21 and 3.23 show a U-8Mo sputtering target
before and after the erosion process in the tabletop reactor. The target has been
operated at a plasma voltage of 240 V and a plasma current of 1 A. The maximum
ion energy was thus limited to 240 eV for single charged ions. The corresponding
total sputtering yield for this energy was calculated to be 0.57 atoms/ion for U
respectively 0.13 atoms/ion for Mo (see appendix A1).
As explained in chapter 2.1, the preferential sputtering effect will very quickly
create a surface layer of altered composition, that grows until an equilibrium is
reached. After that the target material will be ejected in its bulk composition.
The composition of the altered layer can be calculated from the assumption of
equilibrium: U atoms are ejected with a sputtering yield of SU , Mo atoms with
S Mo. Once the surface equilibrium is reached, the U atoms cover a fraction AU
of the surface, Mo atoms cover a fraction A Mo. The surface equilibrium can be
expressed in these terms as SU ·AU = S Mo·A Mo. From the simulated sputtering
yields (appendix A1) and the atomic radii of U and Mo we calculated, that thealtered layer should have a composition of 84.7 at% Mo and 15.3 at% U 2 . As the
bulk composition of the U-8Mo is around 20 at% Mo and 80 at% U, the altered
layer will face an enormous change in composition.
In EDX measurements of the erosion zone (see figure 4.1), we found a composi-
tion of 14 - 15 at% Mo and 85 - 86 at% U, which is close to the bulk composition
of 20 at% Mo and 80 at% U but completely different to the composition of the
altered layer. The EDX method however measures the average composition in a
volume element of 2 µ m depth and 1 µ m diameter, which covers the altered layer
as well as a large fraction of bulk material. Our measurements thus confirm, thatthe altered layer created by preferential sputtering has to be much thinner than
2 µ m, as otherwise the measured composition would be closer to the calculated
values. It further confirms, that at our target working temperatures there is no
target depletion effect of high yield materials due to diffusion. The deviation of
2This is value is only true for a monoenergetic ion bombardment with 240 eV ion energy. The
ion bombardment in the sputtering reactor has however an energetic distribution with 240 eV
as upper limit and 0 eV as lower limit. Thus the formula
SU (E)·AU dE =
S Mo(E)·A Mo dE has
to be solved to determine the real altered layer composition. For energies above 50 eV the ratio
S Mo/SU is however nearly constant (see figure 6.1), and the given value should hence be a good
approximation.
92
8/13/2019 Prediction of protein structural features by machine learning methods
Figure 4.1: (a) SEM picture of the erosion zone on the used sputtering target. The labels show,where the composition has been measured by EDX. (b) EDX spectra recorded at the labeled areas.
94
8/13/2019 Prediction of protein structural features by machine learning methods
Figure 4.2: Material, that was cut out of a fresh U-8Mo sputtering target. A section of 16 mm x8 mm has been mapped by 2D-PGAA. It is clearly visible, that the Mo is not distributed homo-geneously inside the material. The inhomogeneity is more than 1 wt% and results from targetmanufacturing (figures from [can10]).
Figure 4.3: Material, that was cut out of a used U-8Mo sputtering target. A section of 16 mm x 8mm has been mapped by 2D-PGAA. Again inhomogeneities are visible, this time however withnearly 3 wt% (figures from [can10]).
95
8/13/2019 Prediction of protein structural features by machine learning methods
the variation. We also do not have any evidence, that the total composition of
the whole target is different from U-8Mo. Indeed we have clear evidence, that
the Mo addition in the U-8Mo has generally a large spatial variation of at least 3
wt%, and that the local elemental composition can also significantly deviate fromthe expected composition.
Two dimensional PGAA also revealed the distribution of impurities in the U-
8Mo. In the fresh target material we found impurities of Fe, Cu, Pb and V (see
figure 4.4). The elements Fe, Pb and V seem to be arbitrarily distributed, while Cu
can be found in the whole map. We thus suspect Cu to be a sample contamina-
tion, in particular because the fresh target samples had been cut by a wire erosion
saw that used a brass wire. The observation of Hengstler [hen09] confirms this.
In the used target material, only the impurity elements Fe and V could be identi-
fied. These elements are however not spread across the sample, but cover a largefraction of the whole map. Moreover, the distribution of Fe and V seems quite
similar. Thus we suspect Fe and V to be contaminants in this sample. This would
also be in accordance with the fact, that the used sample had been cut by a wire
saw that used a diamond covered steel wire.
Film adhesion An aspect that has to be considered prior to U-Mo film depo-
sition is, whether the deposited film should be free standing, that means it can
easily be removed from the sputtering substrate, or if it should be tightly bond to
the substrate after the process. In both cases the adhesion of the film to the sub-strate is of major importance, as in the first case it should be as low as possible
and in the second case as high as possible.
As we wanted to have free standing U-8Mo deposits for our investigation, we
decided to worsen the substrate adhesion. We thus deposited the U-8Mo on a
Al substrate that had intentionally been covered with a thick oxide layer5. The
bad adhesion between Al substrate and oxide film allowed us to remove the de-
posited U-8Mo films easily and by that to gain free standing films.
U-8Mo film deposition Figure 4.6 shows SEM pictures of the deposited U-Mofilm. The surface is generally plain and homogeneous. At some points however
some film defects are visible. From their irregular shape, the larger ones can
be identified as particles, that dropped onto the film during sputter deposition
(see figure 4.6a). In larger magnification it is also possible to identify organic
contamination on the U-Mo film surface, that apparently had been applicated
after the film was removed from the sputtering reactor.
Figure 4.7a shows a SEM picture of the smallest defects found on the films. The
defect structures are quite symmetric and could result either from small dust
5This can easily be achieved if the Al is dipped into water.
96
8/13/2019 Prediction of protein structural features by machine learning methods
Figure 4.4: Impurities of Fe (a), Pb (b), Cu (c) and V (d), that had been found in the cross section of a U-8Mo target before sputtering (figures from [can10]). The shown concentration maps alwaysrefer to an area of measurement with the dimensions 16 mm x 8 mm. The concentrations are givenin counts. While Fe, Pb and V seem to be spread inside the material, Cu is present in nearly thewhole sample. This is easily explainable, as the samples for PGAA measurements were cut witha wire erosion saw that used a brass wire.
97
8/13/2019 Prediction of protein structural features by machine learning methods
Figure 4.5: Impurities of Fe (a) and V (b), that had been found in the cross section of a U-8Motarget after sputtering (figures from [can10]). The shown concentration maps refer to an area of measurement with the dimensions 16 mm x 8 mm, concentrations are given in counts. The samplehas been cut by a wire saw that used a diamond covered steel wire. We suppose measured Fe andV to be contaminations from this wire.
Figure 4.6: (a) SEM picture of a sputter deposited U-Mo film. Several minor defects are visi- ble, that have a size of 10 µ m or below. Most of them can be addressed to dust particles, thathave fallen onto the film during growth. (b) Larger magnification of the SEM picture. The blackstructures were identified to be organic substances, that have contaminated the U-Mo film afterremoval from the sputtering reactor. The object in the upper center of the picture is also somedust particle.
98
8/13/2019 Prediction of protein structural features by machine learning methods
Figure 4.7: (a) SEM picture of the smallest visible defects found on the U-Mo film. These struc-tures could either result from dust particles or from nodular defects. (b) SEM picture of a breaking
edge of the U-Mo film. The densely packed fibrous grains, that are expected from the Thorntonzone T, are clearly visible.
particles as well, but might also be nodular defects that evolved during film
growth. These defects are not expected at a homologous temperature of 0.20
during the growth process, but could appear due to local surface roughness of
the substrate. The structure of Thorntons zone T, that we expected for the U-8Mo
deposit, can clearly be seen in figures 4.7a and b. Figure 4.7a gives a top view,
figure 4.7b a side view of the densely packed fibrous grains the film is consistingof.
For comparison with the target material, we investigated the composition of
the deposited U-Mo film as well. We used EDX for surface measurements, two
dimensional PGAA for compositional mapping as well as XRD to determine the
crystal structure of the deposit. The EDX measurement gave us a Mo content
of 7.52±0.08 wt% at the film surface. This is identical to the composition of the
U-8Mo target within the accuracy of measurement.
We wanted to use two dimensional PGAA to get a composition map of the U-Mo
film. A complete deposit of 100 mm x 100 mm size was however too large for the
PGAA facility, hence we decided to use only one piece of the film sized 50 mm
x 50 mm. Two PGAA line scans were conducted in the middle of the film, one
in horizontal, one in vertical direction (see figure 4.8). The area of measurement
was each time 50 mm x 2 mm. The measurement gave the unexpected result,
that for both horizontal and vertical scan, the Mo concentration seems to show
a minimum in the middle of the scan region and a maximum at the edges. For
the vertical scan, the Mo concentration was determined to 8.2 - 10.1 wt%, for
the horizontal scan, we measured 7.4 - 9.8 wt%. If the position of the measured
piece of film during deposition is regarded, it seems possible, that this might
99
8/13/2019 Prediction of protein structural features by machine learning methods
Figure 4.8: A 100 mm x 100 mm Zr substrate was coated with 50 µ m of U-8Mo and cut intofour pieces of 50 mm x 50 mm size. One of these pieces was measured by two dimensionalPGAA in horizontal and in vertical direction. It turned out, that the concentration of Mo reaches
a minimum in the middle for both scan directions. This indicates a ring shaped area of increasedU concentration, that possibly has been caused by different ejection characteristics of U and Moin connection with the ring geometry of the plasma.
indicate a difference in the ejection distribution of U and Mo during sputtering.
As the plasma configuration used for sputtering shows a ring shape, it can be
assumed, that different ejection characteristics of U and Mo would also result in
ring shaped areas of different U and Mo composition on the whole deposited
film. A line scan conducted on a quarter piece of such film would measure a
quarter of these ring structrues, and should thus be symmetric in horizontal andvertical direction. The similarity in the Mo concentration distribution recorded
for the horizontal and vertical scan direction suggests such ring structure, or,
more precisely, a ring area of significantly increased U content.
To investigate the phase of the U-Mo film, we conducted several XRD measure-
ments [hen08]. We found, that the deposited film has a bcc crystal structure (space
group Im-3m), which could be identified as theγ -phase of U-Mo that we expected
to gain at room temperature (see also appendix A3). The Rietveld analysis also
confirmed a strong preferred orientation in the [110] direction, which of course
100
8/13/2019 Prediction of protein structural features by machine learning methods
results from the Thornton zone T fibrous grain structure in the film.
4.1.2 Surface cleaningSputter erosion can be used to remove any type and thickness of surface pollution
from U-Mo. We investigated the surface cleaning effect at the example of oxidized
monolithic U-10Mo foils. Their surface was analyzed before and after sputter
erosion.
U-Mo surface pollution For U-Mo the surface cleaning is more difficult than
for most other materials, as U has a very high affinity to oxygen and thus a high
rate of oxidation under air. Moreover U-Mo does not form a protective oxide
barrier like many other metals, which means, that the thickness of the oxide layer
increases continuously over time. Figure 4.9a shows the SEM picture of a U-10Mo
substrate before cleaning. The substrate is covered with an oxide layer of about
10 µ m thickness.
The sputter erosion cleaning of an oxide layer like this would take several ten
hours in our sputtering reactors6. In practice, it is therefore much faster and
more convenient to perform a rough cleaning step with chemical or mechanical
aids prior to the actual sputter erosion cleaning. In this combination the sput-
ter erosion acts as a final in-depth cleaning. By mechanical grinding or chemical
baths, it is possible to remove more than 99% of the oxide layer in several minutes(see figure 4.9b). The thin oxide film remaining on the surface has a thickness in
the nanometer scale, but is still perturbing for bonding purposes and a possible
source of bonding problems. Moreover chemical baths can leave residues on the
fuel foil surface, that are generally undesired as they impose the danger of local
corrosion to fuel and cladding. Films in the nanometer scale consisting of oxides
and chemical residues can however be removed quickly and efficiently from the
surface by sputter erosion.
U-10Mo surface cleaning We prepared three monolithic U-10Mo foil samples,that all had a surface that was completely oxidized (see figure 4.9a). Each foil
had to be roughly cleaned by grinding (see figure 4.9b) before we started with
6Actually, the sputter erosion process in our sputtering reactors is much slower than the sput-
ter deposition process, as the sputter erosion uses the substrate as sputtering cathode and the
target as sputtering anode. The sample table respectively the carrier electrode are however not
equipped with a magnetic assembly, and there is no magnetical electron confinement to support
the glow discharge plasma. Thus the substrate erosion process can only be operated in a normal
glow discharge mode. This operational mode has the disadvantage, that it has much lower ero-
sion rates than the magnetically enhanced mode, but also the advantage, that the erosion will be
homogeneous on the whole substrate surface.
101
8/13/2019 Prediction of protein structural features by machine learning methods
Figure 4.9: (a) SEM picture of surface and cutting edge of a U-10Mo foil sample before cleaning.
The substrate is covered with an oxide layer of about 10 µ m thickness. (b) SEM picture of surfaceafter mechanical cleaning (grinding and polishing). The scratches of the cleaning process areclearly visible, the oxide layer has nearly completely been removed.
Figure 4.10: (a) SEM picture of the surface of a U-10Mo foil sample that was mechanically grinded.The surface is covered with scratches and remaining oxide clusters (white). (b) SEM picture of thesurface of a U-10Mo foil sample after grinding and 10 minutes of sputter erosion at 100 W. Thescratches are still visible, but the oxide clusters have mainly disappeared. (c) SEM picture of thesurface of a U-10Mo foil sample after grinding and one hour of sputter erosion at 100 W. There ishardly any visible difference from the situation in picture (b).
our cleaning experiments. The grinding was done in air and without chemical
aids. After grinding, the foils were inserted and stored in Ar atmosphere to avoid
further oxidation before the sputter erosion cleaning.
The cleaning process was conducted in the full size sputtering reactor. The polar-
ity of the sputtering diode was switched before, so that the carrier electrode was
the cathode. In this configuration, the plasma in the reactor is slightly unstable
and shows the tendency of arcing. It could be ignited at a working gas pressure
of 6·10−3 mbar and was operated at 100 - 300 W (see figure 4.16b). We however
avoided going to much higher plasma powers, as this would both increase the
tendency of arcing and also make the appearing arcs more powerful. We oper-
ated the reversed sputtering process for time scales from several minutes up to
more than one hour.
102
8/13/2019 Prediction of protein structural features by machine learning methods
Figure 4.10a shows the resulting surface after mechanical grinding. The surface
is dominated by scratches from the grinding and oxide clusters that have not
been removed. Figures 4.10b and c show pieces of the same foil that were sputter
erosion cleaned after the grinding. Even 10 minutes of cleaning at only 100 Wsignificantly reduces the amount of oxides remaining on the surface. One hour
of sputter erosion has the same effect on surface cleanliness, but apparently no
additional gain.
4.1.3 Coating
The application of coatings by sputter deposition is the most common use of sput-
tering in industry. There are many different kinds of coatings for various pur-poses presented in literature. We investigated the surface coating of monolithic
U-10Mo foils as well as the most crucial property of the coating, the substrate
adhesion.
U-10Mo surface coating In principle the coating of a U-Mo surface is only a
film formation process as it was described in 4.1.1, with the only difference that
U-Mo is now the substrate and other materials are used as target. We deposited
coatings of several different materials onto monolithic U-10Mo foil samples
using the tabletop as well as the full size reactor. In both setups we conductedthe sputter deposition process at pressures in the range of 3·10−3 mbar at plasma
powers of 240 W respectively 2 kW. Each foil sample had been roughly cleaned
by grinding and afterwards cleaned by sputter erosion. The sputtering process
was operated over time scales of 1 - 10 h, and coatings in a thickness range of
2 - 25 µ m were realized. Figure 4.11 shows two examples of coated U-Mo with
different coating materials in different thicknesses.
In contrary to the previous case, where free standing films were of interest and
the substrate to film adhesion was intentionally worsened, it is demanded for acoating to show a good substrate to film adhesion. We investigated the quality of
adhesion by tensile tests.
Coating adhesion We conducted tensile tests to investigate the adhesion of dif-
ferent coatings on U-Mo substrates respectively of U-Mo films on different sub-
strates. Details on the basics of tensile tests are described in appendix A4.
We tried to eliminate all disturbing factors in the tensile tests by choosing our
sample geometry to feature a planar interface between the different materials.
Moreover we wanted to test the adhesion of only two materials to each other
103
8/13/2019 Prediction of protein structural features by machine learning methods
Figure 4.11: (a) Cross section of a U-10Mo foil sample coated with 5 µ m of Ti. (b) Cross section of a U-10Mo foil sample coated with 9 µ m of Zr on both sides.
at a time7. Figure 4.12a shows the principle setup of our tensile test samples.
Each sample consists of two layers, the substrate and the deposited film, that
are bonded to each other only by the film growth process. The substrates with
a thickness of 100 - 400 µ m are polished respectively grinded foil samples, ac-
cording to the surface quality that is supposed to be investigated. The films to
be tested are sputter deposited on these blank sheet pieces in a thickness of 15 -
20 µ m. The two layer sample created in this way is glued between two sampleholders with a special adhesive. After hardening of the adhesive, the sample is
ready for a tensile test (see figure 4.12b).
We produced a series of different tensile test samples in the described method
[dir10] [jur11]. Table 4.1 shows the material combinations that have been realized.
Each one was mounted into a tensile test machine and an increasing tensile force
normal to the interface of the two sample materials was applied until a fracture
occurred. It turned out, that the breaking of the samples did not always occur
due to a layer separation of the tested materials. In most cases the used adhe-
sive lost contact and separated either from the sample or from the sample holder.Because of that, all tensile test samples were investigated after the tensile test
and classified into different breaking classes. Dirndorfer [dir10] distinguished
between three classes: the separation of the sputter deposited layers, the separa-
tion of the adhesive from one of the contacted surfaces and the breaking of the
adhesive in itself. From the first one of these breaking classes an actual breaking
strength value of the deposited samples could be deducted, the second and third
class only gives a lower limit of the breaking strength. Table 4.2 lists the results
7We did not consider three layer systems, as these systems present two interfaces and therefore
two different adhesion values.
104
8/13/2019 Prediction of protein structural features by machine learning methods
Figure 4.12: (a) Basic setup of the used tensile test samples. A substrate that was sputter coatedwith another material is glued between two sample holders with a special adhesive. After thatthe tensile test sample is enclosed into a shrinking hose, that retains radioactive particles that mayeventually appear during the sample fracture. (b) Picture of an actual tensile test sample, that wascompletely mounted and is ready for testing (middle), as well as two of the sample holders used(left and right) (from [dir10]).
substrate U-8Mo Ti Zr Zry-4 Nb
U-10Mo 15 15 15 15
Ti 15Zr 15
Zry-4 15
Nb 15
Ta 15
Al 15-20 15 15 15 15
Table 4.1: Material combinations of coating and film adhesion tests. The left column lists thedifferent substrates that have been used, the first line lists the deposited material, the numberdenotes the thickness of the sputtered deposit in µ m.
105
8/13/2019 Prediction of protein structural features by machine learning methods
Figure 4.13: (a) Hot rolling assembly for monolithic U-Mo foil production (from [moo08]). Cast U-Mo coupons are laminated into a carbon steel picture-frame assembly. The assembly is ’canned’,
by welding of bottom and cover plates, and hot rolled after that. (b) After hot rolling the assemblyis decanned, and the rolled U-Mo foil sheared to the desired size (from [moo08]).
State of the art The only working U-Mo foil production process up to now is de-
scribed in [moo10]. Cast U-Mo coupons are laminated into a carbon steel picture-
frame assembly (see figure 4.13a).
Bottom and cover plates from carbon steel are applied and welded onto the as-
sembly. The whole process is conducted in Ar atmosphere. The resulting ’canned’
structure is heated and rolled several times, which can be performed in air as the
insulation canning protects the U-Mo from oxidation. The sequence of heatingand rolling is repeated until the desired assembly thickness is reached. After
rolling, the assemblies are annealed, mechanically decanned and sheared to the
desired size. The result is a U-Mo foil as shown in figure 4.13b.
The described procedure is mainly processed manually, and up to now only
suited for the production of smaller numbers of fuel foils [tec08]. Without a
higher degree of automation, an industrial production seems hardly feasible.
Sputter deposition Boni and Wieschalla suggested the fabrication of monolithic
U-Mo fuel foils by sputter deposition as an alternative fabrication technique. Ac-cording to their patent from 2006 [pat06], this method could be superior to the
currently existing production process. The suggested method was to use sputter
deposition to grow a massive U-Mo film, that is in material, microstructure and
dimension identical to a conventionally produced monolithic U-Mo fuel foil. The
idea seems promising, and basically it should be simple to realize in our sputter-
ing reactors.
Material and microstructure The exact composition of the U-Mo alloy used for
a monolithic fuel foil, that means the exact fraction of Mo in the U, is determined
107
8/13/2019 Prediction of protein structural features by machine learning methods
by metallurgical considerations and by the particular parameters of foil fabrica-
tion and processing. A necessary lower limit of the Mo fraction can be set at
about 4.5 wt%, as this value is needed to stabilize the U γ -phase (see appendix
A3). A necessary upper limit for the Mo content is 15.5 wt%. We chose the alloyU-8Mo for our sputter deposition experiments, as it seemed us to be a fair com-
promise between phase stability and U density. Several U-8Mo sputtering targets
as shown in figure 3.21 were thus purchased from AREVA-CERCA.
The desired crystallographic structure in a monolithic U-Mo fuel foil is the body-
centered cubic γ -phase, that shows an isotropic thermal expansion behavior (see
also appendix A3). When a fuel foil is produced by sputter deposition, there are
two ways to obtain the γ -phase (see figure 3.26): a deposition at low homologous
temperature to immediately receive a ’frozen’ γ -phase or a deposition at a high
homologous temperature and a quick cooling of the resulting film8
. We decidedto use the first option, as a fast film cooling in the full size reactor seemed us to
be much more difficult and risky.
Foil dimensions The required dimensions of a monolithic U-Mo fuel foil is de-
pendent on the reactor it will be used in. The ’Advanced Test Reactor’ (or: ATR)
at the Idaho National Laboratory would for example require monolithic U-Mo
foils in the size 600 mm x 60 mm x 360 µ m, the FRM II would require foil dimen-
sions of 700 mm x 62.4 mm x 425 µ m9.
In a test with Cu as surrogate material, we investigated how much effort would
be necessary to deposit a foil of such dimensions. In about 42 continuous hours
of sputtering at a power of 4 kW we were able to produce a free standing Cu film
with dimensions 700 mm x 62.4 mm x 1200 µ m in the full size sputtering reactor,
which easily meets the dimensional requirements mentioned before (see figure
4.14a). We were also able to deposit a Cu film with dimensions 700 mm x 62.4
mm x 425 µ m into an Al plate with a machined pocket (figure 4.14b). The pocket
design was considered an alternative to a free standing deposit.
Our surrogate tests thus showed, that also the sputter deposition of a U-Mo film
in the dimensions required for a fuel foil should be feasible in the full size reactor.Subsequently we were supposed to continue our experiments with the deposi-
tion of a U-8Mo fuel foil in full size. Considerations about the principal material
efficiency of the sputter deposition process and the scientific insight, that could
be gained by the deposition of a full size fuel foil, however changed our further
approach.
8According to Tangri [tan61], a cooling rate of 10 C per second should be able to conserve the
γ -phase in U-8Mo.9Breitkreutz [bre11] determined a necessary thickness of approx. 425 µ m, if the fuel alloy U-
8Mo would be used.
108
8/13/2019 Prediction of protein structural features by machine learning methods
Figure 4.14: (a) Self sustaining Cu film with dimensions 700 mm x 62.4 mm x 1200 µ m. Thestructure was deposited onto a strongly oxidized Al surface and could therefore be removed from
it. (b) Cu deposit with dimensions 700 mm x 62.4 mm x 425 µ
m deposited into an Al plate witha machined pocket. The adhesion between Cu and Al is excellent, and causes a slight curvatureof the plate due to the bimetal effect (see also chapter 2.1.6). During deposition the Al plate wascovered by a pattern that shielded the machined pocket. Thus there was only material depositioninto the pocket.
Efficiency During our experiments it soon became clear, that the sputter de-
position process as we use it in our reactors has only a low degree of material
utilization. This results both from our plasma geometry as well as from the reac-
tor geometry.
The ring shaped plasma geometry, that we use in our sputtering reactors, has theadvantage to increase deposition speed significantly and to allow the operation
of a glow discharge plasma at much lower pressures as it would normally be pos-
sible. However it has also the disadvantage, that deposition in the reactor is not
homogeneously any more, and that sputter erosion takes place only at defined
erosion zones (see figure 3.23). One effect of our plasma geometry is hence, that
the used sputtering targets are not totally consumed during the erosion process,
but only to a certain fraction. For the brick-shaped target elements that we use in
both our sputtering reactors, we determined a target utilization of only 20 - 25 %
for the tabletop reactor and 30 - 35 % for the full size reactor, which means that
only this weight fraction of the target material is sputtered and ejected from the
target, while the remaining target material mass stays unused10. Moreover will
most of the material, that is sputtered and ejected from the target, be deposited
to the walls of the reactor and not onto the substrate. This effect results from
the reactor geometry, i.e. more precisely from the shape of sputtering target and
substrate and their assembly, and further lowers the efficiency of the process. In
our reactors, we determined that only about 15 - 25 % of the ejected material is
deposited onto the substrates, depending on the size of the substrate.
10Values like that are common for magnetron sputtering reactors [fre87].
109
8/13/2019 Prediction of protein structural features by machine learning methods
Both factors, the target utilization and the fraction of correctly deposited material,
set the degree of material utilization in our sputtering reactors to 3 - 6 % for the
tabletop reactor and to 4 - 9 % for the full size reactor. In case of a cheap target
material like Al, the material utilization factor can be ignored, and only the effortin time and energy of the sputter deposition process has to be considered. In case
of an expensive target material like U-Mo, a low utilization factor is however a
major disadvantage and fatal for efficiency and competitiveness of the process.
In comparison with the currently used process of U-Mo foil fabrication, that has
a degree of material utilization of around 76 % (see section 4.2.4), the processing
of U-Mo by sputter deposition is thus inefficient and not competitive.
In the particular case of depositing a monolithic U-8Mo foil in full size we esti-
mated the effort as follows: an U-8Mo target for the full size reactor consists of
13 single U-8Mo target bricks, that have a total mass of 14.8 kg. Assuming thementioned material utilization of 4 - 9 % for the full size reactor, about 3 - 7 full
sized monolithic U-8Mo foils could thus be produced from these 13 U-Mo target
bricks, and at least about 13.5 kg of U-8Mo scrap would remain. In the view of
these numbers, and considering the expensive U-8Mo target material11, we re-
garded the gain of scientific information by a foil production like this as limited
and dispensable. Nevertheless we conducted a series of experiments to investi-
gate the deposition behavior of U-8Mo in our tabletop reactor.
Deposition of monolithic U-8Mo We deposited U-8Mo films of various dimen-sions and thicknesses on various substrates (see figure 4.15). We reached thick-
nesses of up to 120 µ m, but usually stayed below 50 µ m to save material. The
substrate size was limited to 100 mm x 100 mm in the maximum, as larger sub-
strates could not be placed inside the tabletop reactor. The deposition was usually
conducted at a plasma power of 240 W, a working gas pressure of 3·10−3 mbar
and a substrate temperature of 15C. As expected, the material was always found
to be in the γ -phase.
Conclusion We could demonstrate, that the idea of sputter depositing a com-plete U-Mo fuel foil is in principally feasible. The process is however time- and
energy-intensive, as several ten or even hundred hours of sputtering at plasma
powers in the kW range would be necessary to reach the necessary thicknesses.
The material utilization in our full size sputtering reactor was moreover only in
the range of 4 - 9 %, which is fatal, when an expensive material like U-Mo has
to be processed. Even if this utilization rate could be increased it is questionable,
whether the sputter deposition of U-Mo fuel foils would in general be competi-
11One single U-8Mo target brick from DU with a mass of approx. 1.1 kg costs approx. 5000
euro. A comparable U-Mo target from LEU or HEU is assumed to cost significantly more.
110
8/13/2019 Prediction of protein structural features by machine learning methods
Figure 4.15: U-8Mo deposits produced in the tabletop sputtering reactor. (a) Deposit of dimension100 mm x 90 mm x 50 µ m on a 50 µ m tantalum foil. The substrate adhesion was excellent andthe film showed no sign of delamination. (b) Free standing deposit with a dimension of 60 mmx 20 mm x 10 µ m. (c) Deposit of dimension 100 mm x 90 mm x 50 µ m on a 50 µ m graphite foil.The substrate had too less mechanical stability to withstand the stresses imposed by the U-8Mofilm and was thus deformed already during deposition. The substrate adhesion was good, but by mechanical force it was possible to remove the film from the surface as the substrate could notresist. (d) Deposit of 60 mm diameter and 25 µ m thickness on glass. The substrate adhesion wasperfect if the surface was prepared properly.
111
8/13/2019 Prediction of protein structural features by machine learning methods
The application of functional coatings for nuclear fuels is investigated since
decades, mostly to apply neutron poisons to the fuel itself [pat86][pat91] or to
increase the wear resistance of the cladding [pat93]. In the case of U-Mo fuels,
the application of functional coatings is however still in its early stage. Currently,
the only purpose in discussion why functional coatings should be applied to U-
Mo fuels, is as a barrier to prevent an IDL formation between fuel and cladding.
We therefore concentrated on these diffusion preventive coatings. Other possible
uses seem evident12, but have not been studied up to now.
Diffusion prevention IDL formation is caused by a radiation enhanced thermal
diffusion process (see next section). Two approaches to prevent or slow down
IDL formation involving fuel coatings are possible. The first approach tries to
immobilize the reacting atoms. The fuel coating in this case is very thin (sub-
micrometer), and has the purpose to localize appropriate reactive materials at the
interface between U-Mo and Al. During reactor operation, this kind of coating is
supposed to be consumed by interaction with U-Mo or Al. The immobile com-
pound that forms on the U-Mo/Al interface in this interaction then blocks further
diffusion and prevents IDL formation. The second approach tries to stop the fis-sion products before they can actually reach the Al. To guarantee that, the applied
coating has to be thicker than the maximum range of the fission products emitted
from the U-Mo, that means typically about 10 - 20 µ m. The coating thus avoids,
that the area that would allow radiation enhanced thermal diffusion reaches the
Al, and by that prevents an IDL formation between U-Mo and Al. Instead, the
coating will be in the area of radiation enhanced thermal diffusion, and the coat-
ing material has of course to be chosen appropriately.
We performed a material pre-selection, that identified UO2, Zr, Ti, Nb and Ta as
suitable materials for a diffusion preventive coating [jar09]. Coatings and addi-tions of Si [per09] and ZrN [bir06] [bir09] have also proven to reduce IDL forma-
tion and are therefore of relevance to us.
State of the art The currently used technique for the coating of monolithic U-
Mo fuel is colamination [moo08] (see also chapter 1). Colamination means, that
the U-Mo coupons used in the foil fabrication procedure (see section 4.2.1) are
12Coatings of appropriate materials could avoid oxidation of the fuel surface during fabrication,
could simplify the bonding process of fuel and cladding or provide wear resistance during fuel
handling. Moreover could neutron poisons be placed close to the fuel to retain surplus reactivity.
112
8/13/2019 Prediction of protein structural features by machine learning methods
1 full size foil (Agent Z) 600 x 60 Zry-41 full size foil (INL 4 - 2A) 600 x 60 Ti
Table 4.3: U-10Mo minifoils and full size foils that have been coated by sputter deposition.
sandwiched with Zr blank sheets prior to the lamination into the carbon steel
picture-frame assembly. The following hot rolling sequence will thus not only
reduce the thickness of the U-Mo coupon, but also bond it to the Zr. The result is
a U-Mo foil coated with Zr.
As the foil production and the coating are done in one single process step, the
colamination technique suffers from the same weaknesses as the foil production.
Again sputter deposition seems to be a promising alternative, as it is widely used
to apply coatings in different fields.
U-10Mo fuel coating Full size U-10Mo foils were provided to us by courtesy of
Y-12 National Security Complex. Each foil was approximately 600 mm x 60 mm
in size and 360 µ m in thickness (see figure 4.16a). One of the foils was cut into
smaller pieces with a size of approximately 60 mm x 30 mm each. These pieces
will be denoted as minifoils.
The surface of each foil respectively minifoil had to be roughly cleaned by grind-
ing before we started with our experiments. After grinding, the foils were in-
serted into the full size reactor. As next processing step, we used sputter ero-
sion to achieve an in-depth cleaning of the surface of the U-Mo foils (see figure
4.16b). This cleaning process was maintained for approximately 10 - 15 minutes
at a sputtering power of 100 W. After this cleaning step, the coating of the foils
started (see figure 4.16c). The coating process was maintained for several hours
at a plasma power of 1 kW until the desired layer thickness had been reached.By the described process, the configurations listed in table 4.3 have been realized.
Minifoil coatings with Zr and Zry-4 were performed prior to the full size coatings,
to clarify whether a stable coating upon a grinded surface can successfully be
achieved. This was not self-evident, as all coating tests before had used polished
substrates, but the resulting coatings turned out to be stable indeed. After that
we coated one full size foil with Zry-4 and another one with Ti. All sputter coated
foils and minifoils listed in table 4.3 optically appeared excellent and don´t show
any signs of delaminating (see figure 4.11). The tensile tests described in the
previous section confirmed the excellent coating adhesion.
113
8/13/2019 Prediction of protein structural features by machine learning methods
Figure 4.16: (a) The full size foil ’Agent X’ was cut into several minifoils, which were used for thefirst coating tests. (b) The full size foil ’Agent Z’ during the sputter cleaning and (c) during thesputter coating process. The ripples in the foil do not result from cleaning or sputtering, but werealready present in the foil when delivered. (d) ’Agent Z’ after the coating with Zry-4 and AlFeNi.
114
8/13/2019 Prediction of protein structural features by machine learning methods
Conclusion We demonstrated, that small and full size U-Mo fuel foils can easily
be coated with the diffusion preventive materials Zr respectively Zry-4 and Ti in a
thickness of 1 - 25 µ m within several hours of sputter deposition at plasma pow-
ers in the kW range. The adhesion of these coatings is according to tensile testexperiments comparable to coatings produced by conventional techniques and
usually above 30 MPa [dir10]. We expect similar results for other diffusion pre-
ventive materials like Nb and Si, as the deposition of these materials has already
been successfully demonstrated at small samples for irradiation tests (see section
4.3). The sputter coating technique thus seems to be ideally suited to apply dif-
fusion preventive materials onto monolithic U-Mo fuel. The combination of the
sputter erosion cleaning of U-Mo foil surfaces with the sputter coating of these
foils provides a quality of surface preparation that cannot be reached by the tech-
niques currently used in U-Mo fuel fabrication. For this type of application thesputtering technique can thus be considered as clearly superior. An integration
into the currently fuel fabrication process seems to be advisable and feasible.
4.2.3 Cladding
The last step in monolithic fuel plate assembly is the application of cladding to
the fuel. The bonding of fuel to cladding is a crucial point during plate assembly
as a fuel plate can only be used, if an appropriate bonding is assured.
State of the art To assemble a monolithic fuel plate a U-Mo fuel foil and two
Al cladding plates are needed. A ’sandwich’ of Al bottom cladding plate, fuel
foil surrounded by Al frame and Al cover cladding plate is assembled by the
well-known picture-frame technique (see figure 4.17). The sandwich is bonded
in a so-called ’friction bonding’ (or: FB) process using a rotating pin tool that
is pressed onto the sandwich with force [moo08]. As alternative techniques to
FB the so-called ’hot isostatic pressing’ (or: HIP) technique and the hot rolling
technique are also investigated, where the sandwich is pressed for several hours
at constant pressure and at elevated temperatures respectively rolled at elevatedtemperatures. The result in all three cases is a complete fuel plate.
Boni and Wieschalla also proposed sputter deposition as an alternative technique
for this application [pat06]. The idea is promising, and was thus investigated by
us.
Cladding The application of cladding to a monolithic U-Mo fuel foil is quite
similar to the application of a functional coating discussed in the previous sub-
section. The relevant cladding materials are Al and Al alloys, usually AlFeNi and
Al-6061. Only the thickness of the cladding layer is in the range of several hun-
115
8/13/2019 Prediction of protein structural features by machine learning methods
Figure 4.17: Sandwich assembly of a fuel plate. The meat core is framed by a border of Alcladding. A top and bottom Al cladding plate are applied, then the cladding has to be bonded.
dred micrometers and therefore much larger than the thickness of a functional
coating.We conducted several sputter deposition tests to clad full size Fe and Cu surro-
gate foils with the mentioned materials. Chemical cleaning and sputter erosion
cleaning were used before the deposition process to ensure the necessary surface
cleanliness of the foils. After that, the foils were cladded with different layer
thicknesses from 1 - 100 µ m. Figure 4.18 shows a Fe and a Cu surrogate foil, that
have been cladded with AlFeNi respectively Al.
Again, the cladding procedure was simple and the resulting cladding showed no
signs of delamination. Several ten hours of sputter coating were however nec-
essary for each foil to reach the mentioned thicknesses. We did not conduct any
experiment to go beyond 100 µ m cladding thickness, as this value did not seem
reasonable to us (see following section).
As already mentioned, the fuel foil in a monolithic fuel plate for FRM II is sup-
posed to have dimensions of 700 mm x 62.4 mm x 425 µ m [bre11]. The complete
fuel plate is fixed to the outer dimensions of 720 mm x 76 mm and a thickness of
1360 µ m. The AlFeNi cladding thus has to have a thickness of approx. 470 µ m
on each side of the fuel foil. Moreover is has to be in total 20 mm longer and 13.6
mm wider than the fuel foil itself.
A cladding thickness value of approx. 470µ m can be reached by several ten hours
of sputter deposition, which makes this technique comparatively slow compared
116
8/13/2019 Prediction of protein structural features by machine learning methods
Figure 4.18: (a) Fe surrogate foil cladded by 100 µ m of AlFeNi. (b) Cu surrogate foil cladded by50 µ m of Al.
to the picture-frame technique. A huge advantage of a sputter deposited cladding
is however the excellent adhesion between fuel substrate and cladding film. Whatcannot be satisfyingly reached by sputter deposition is the length and width of
the cladding, as it is not possible to deposit a cladding layer that is in width and
length larger as the underlying fuel foil without creating an undesired step pro-
file in the total thickness of the resulting fuel plate. This is a general problem of
any deposition technique in this situation.
An alternative technique is of course the sputter deposition of U-Mo into a ma-
chined pocket (as previously discussed and demonstrated with Cu in figure
4.14b), and the sealing of this structure by the sputter deposition of a cladding
cover layer. This method however suffers from the previously discussed general
disadvantages when a U-Mo fuel kernel should be sputter deposited. A mixed
solution, that means a conventionally produced U-Mo kernel that is placed in-
side a cladding plate with machined pocket and sealed by sputter deposition of a
cover layer from cladding material, is also inefficient, as it would require an addi-
tional processing step to bond the U-Mo kernel to the cladding and thus provide
no benefit to the currently used technique.
Pre-cladding A possible use for a sputter deposited cladding could be the
’pre-cladding’ concept. A thin layer of the actual cladding material with several
117
8/13/2019 Prediction of protein structural features by machine learning methods
Figure 4.19: (a) Cladding application by sputter deposition. A problem occurs at the foil edges: itis not possible to deposit a cladding layer that is in width and length larger as the fuel foil withoutcreating an undesired step profile in the total thickness of the resulting fuel plate. (b) Pre-claddingconcept: a thin layer of cladding material with several micrometers thickness is applied to the fuelfoil by sputter deposition. This ’pre-cladding’ simplifies bonding to the actual cladding. The pre-
cladded fuel foil is laminated into a massive cladding plate with machined pocket, and can easily be roll bonded afterward.
number and description size [mm x mm] coated with cladded with
2 U-10Mo minifoils 28 x 30 Zry-4 AlFeNi
6 U-10Mo minifoils 60 x 30 Zry-4 AlFeNi
1 U-10Mo full size foil 600 x 60 Zry-4 AlFeNi
1 U-10Mo full size foil 600 x 60 Ti Al
Table 4.4: U-10Mo minifoils and full size foils that have been coated so far by sputtering.
micrometers thickness is applied to a U-Mo fuel foil by sputter deposition,
which takes only a few hours. The fuel foil is then fully cladded by a so-called
’pre-cladding’, which has an excellent adhesion to the fuel foil and no step
profile. The pre-cladded fuel foil is then laminated into a massive cladding
plate with machined pocket and sandwiched with a cladding cover plate. This
sandwich can easily be roll bonded afterwards, as the bonding process itself has
only to bond cladding material with cladding material.
The pre-cladding concept could thus avoid the disadvantages of solely sputter
deposited cladding but conserve its advantages.
U-10Mo foil pre-cladding The pre-cladding concept seemed more promising to
us as the complete sputter cladding concept. Thus we decided to apply only pre-
cladding layers during our U-Mo foil coating experiments. We used the U-10Mo
foils listed in table 4.3, that had already been coated with diffusion preventive
materials, and applied pre-cladding layers of Al and AlFeNi to them. Table 4.4
lists, which pre-cladding was applied to each sample.
118
8/13/2019 Prediction of protein structural features by machine learning methods
Figure 4.20: (a) Cross section of a U-10Mo foil sample sputter coated with Zry-4 as diffusion barrier and AlFeNi as pre-cladding. (b) The diffusion barrier layer has a thickness of approx. 9µ m, the pre-cladding layer approx. 7 µ m.
The applied pre-cladding thickness was between 5 - 10 µ m for all U-10Mo foils
and minifoils. Figure 4.20 shows a cross section of a foil coated in this way.
Conclusion We demonstrated, that small and full size U-Mo fuel foils can eas-
ily be cladded with the materials Al and AlFeNi in a thickness of 1 - 100 µ m. The
deposition of cladding layers in the thickness required for fuel plates is howeverquite time- and energy-intensive: several ten hours of sputtering would be nec-
essary at plasma powers in the kW range. Sputter deposition will to our opin-
ion thus never be able to compete with the material throughput provided by
the picture-frame cladding technique. The use of sputter deposition is however
promising for surface preparation prior to the picture-frame cladding application.
4.2.4 Prospect
The fabrication process for fuel plates containing monolithic U-Mo fuel can bedivided into three stages:
• foil fabrication, which encloses the alloying and casting of the U-Mo,
rolling of the cast ingots to foils and shearing the foils to proper size
• foil preparation, which encloses the cleaning and coating of the fabricated
U-Mo foils
• plate fabrication, which encloses the application of cladding to the coated
fuel foils and the thickness finish
119
8/13/2019 Prediction of protein structural features by machine learning methods
Techniques to realize each of these stages have been developed with great effort
in the last years. These techniques currently allow a small scale production
of monolithic fuel plates but are still in development. A first industrial scale
production of fuel plates and fully assembled elements is supposed to be realizedin the US within the next years [tec08].
The efficiencies for the different fabrication stages can be measured in terms of
a yield factor, that denotes the material utilization in a certain process step. For
the three stages listed above, the yield factors were estimated in [tec08] and are
given as follows:
• foil fabrication: 76 %
• foil preparation: 85 %
• plate fabrication: 90 %
The total process yield is the product of these yields and thus estimated as 58 %,
meaning that 58 % of the U-Mo allocated for fuel plate fabrication will actually
end up as fuel plates while 42 % will be lost as scrap, chemical waste, casting
losses, etc. Sputter processing can in principle be applied in all three stages of
this fabrication process, but with varying effectiveness:
In the first stage, foil fabrication, sputter deposition could be used to replace theextensive ingot casting, ingot rolling and foil shearing procedures of the U-Mo
material. Sputter deposition requires however the additional effort of fabricat-
ing the sputtering targets, which will also be produced by ingot casting and in-
got milling13. Effectively the sputter processing thus only avoids the rolling and
shearing step, as the casting step is necessary for both methods. Considering
the times that are necessary for ingot rolling and foil shearing (approx. 8 h per
foil, see [moo08]) on the one side and for the sputter deposition of monolithic
foils (several ten to over one hundred h per foil, see section 4.2.1) on the other
side, sputter processing is clearly not competitive to the conventional techniques.Considering the material utilization of rolling and shearing (84 %, see [tec08]) on
the one side and for sputter deposition (4 - 9 %, see section 4.2.1) on the other side,
sputter processing is again clearly not competitive. To our opinion it is therefore
questionable, if sputter processing can ever be competitive to the currently used
techniques for U-Mo foil fabrication, even if the material utilization in the sput-
ter deposition process would be massively improved by the techniques shown in
section 5.4.
In the second stage, foil preparation, sputter erosion could be used to assist or
13The presently used U-8Mo sputtering targets were fabricated in this way
120
8/13/2019 Prediction of protein structural features by machine learning methods
replace the cleaning process of U-Mo foils. The times for mechanical and chem-
ical cleaning of U-Mo foils are given as several minutes per pass and repetition,
until a sufficient surface quality is reached [moo08]. Sputter erosion cleaning re-
quires several hours if it is used as the only cleaning method in the fabricationprocess, but also only several minutes if it is used in combination with either
mechanical or chemical cleaning (see section 4.1.2). A comparison of the qual-
ity of surface cleanliness is unfortunately not possible for chemical cleaning and
sputter cleaning, as the microscopic surface structure of the chemically cleaned
surface is not known. A comparison of mechanically cleaned and sputter cleaned
surface (see figure 4.10) indicates however, that sputter cleaned surfaces always
show a higher degree of cleanliness compared to the conventional techniques. A
combination of the currently used cleaning techniques as pre-cleaning steps and
the sputter erosion cleaning technique as cleaning finish thus seems us to be a beneficial advancement of the foil preparation process.
The most promising use of sputter processing in the second stage could however
be foil coating by sputter deposition. The major yield losses during foil prepara-
tion are attributed to foil rejections due to unacceptable coating results of the cur-
rently used coating techniques [tec08]. Our experiments with the sputter coating
of previously sputter cleaned monolithic U-Mo foils however clearly show, that
sputter processing allows to standardly produce a coating quality that is supe-
rior to the standard quality of the conventional coating techniques co-rolling and
thermal spraying (compare section 4.2.2 to [moo08]). The times required to ap-
ply these coatings (several hours for coating thicknesses of 1 - 25 µ m, see section
4.2.2) is however relatively long compared to the conventional techniques (co-
rolling requires no time, as it is part of the foil fabrication, thermal spraying takes
several minutes, see [moo08]). Sputter processing could thus reduce the number
of unacceptable coating results significantly, but would increase the duration of
the second stage by several hours. We estimate, that the yield factor of the second
fabrication stage, that is currently estimated as 85 %, could be increased to at least
90 - 95 % by the use of sputter processing, which would rise the total process yield
to 62 - 65 % and justify the increase of processing time. To our opinion, the foil
coating by sputter deposition could therefore also be a beneficial advancement of the foil preparation process.
In the third stage, plate fabrication, sputter processing could be used for cladding
application and replace the two currently investigated bonding processes HIP
and FB. The yield factor of the conventional process is estimated with 90 % and
results from plate rejections due to incomplete bonding of fuel foil to cladding.
Sputter deposited cladding is supposed to show a smaller percentage of incom-
pletely bonded plates and could allow to reach a yield factor of 90 - 95 %, but
would require several ten to over one hundered hours of fabrication time per foil
(see section 4.2.1). Compared to the necessary processing times of the conven-
121
8/13/2019 Prediction of protein structural features by machine learning methods
tional techniques (HIP and FB each require several hours per plate, see [tec08]),
sputter processing would thus increase processing times significantly but the
yield factor only marginally. To our opinion it is therefore questionable, if sput-
ter processing is competitive to the conventional techniques in the phase of platefabrication.
In summary, the application sputter processing in fuel plate fabrication seems
reasonable only in the stage of foil preparation.
4.3 Application II: Scientific samples
In the process of developing a U-Mo based high density nuclear fuel it is manda-
tory, to study and understand the properties and behavior U-Mo alloys. Allaccordant experimental investigations require however, that appropriate U-Mo
samples are available to the experimenters. We investigated sputter deposition
in this context, as it allows to produce scientific samples that can be tailored to
individual experimental requirements.
We produced sputter deposited samples for two different types of experiments:
• for irradiation experiments, that allow to study IDL formation
• for thermal diffusion experiments, that allow to study solid state reactions
in U-Mo
The irradiation experiments were conducted by our group, the thermal diffusion
tests were performed by Leenaers from SCK/CEN.
4.3.1 Irradiation experiments
A major activity in the fuel conversion research program at FRM II is the in-
vestigation of irradiation induced reactions in the interface regions of fuel and
cladding. The interface regions are of particular interest, as the IDL formationduring irradiation starts here. IDL have proven to be the key for phenomena like
breakaway swelling, delamination or the appearance of hot spots (see chapter
1.2.4). Therefore it is essential to understand the occurrence, growth behavior
and the properties of IDL to control them and to avoid those undesired phenom-
ena during reactor operation.
Heavy ion irradiation The classical way to investigate radiation damage and
radiation induced reactions is to irradiate test samples and test plates with the
material combinations of interest inside a reactor core (’in-pile’) under conditions
122
8/13/2019 Prediction of protein structural features by machine learning methods
that are as close as possible to the original fuel conditions simulating the complete
nuclear burnup. After in-pile irradiation, the radioactivity of such test samples
is in the range of 1011Bq/gU [cle05], which prevents their near-term examination
and makes a storage for months or years necessary to let the gross of activity wearoff. The examination in hot cell facilities can start after that.
As this classical way of investigating radiation damage is quite time consuming
and cost intensive, a quicker and cheaper alternative was looked for. Irradia-
tion with heavy ion beams from particle accelerators is long known as an ef-
fective technique to simulate the structural modifications of in-pile irradiation.
Wieschalla [wie06],[pal06],[jun10] could show, that an IDL quite similar to those
produced in-pile in dispersed U-Mo/Al can also be produced ’out of pile’, if dis-
persed fuel samples are irradiated with heavy ions that are in type and energy
similar to typical nuclear fission products. This observation is not surprising, asthe IDL produced by in-pile irradiation is mainly caused by the fast and heavy
fission fragments generated in the fuel during fission, which are nothing else than
fast heavy ions in matter.
MAFIA Our group uses the ’Munich Advanced Fuel Irradiation Apparatus’
(or: ’MAFIA’) that is shown in figure 4.21 for heavy ion irradiation (or: ’HII’)
[jun11]. MAFIA allows the defined HII of small material samples to simulate the
radiation damages created by fission products. The advantage of this kind of irradiation is, that the samples will not be activated during HII and that several
hours of irradiation time are sufficient to simulate the damages of several months
of in-pile time.
By examination of irradiated samples via surface electron microscopy (SEM), x-
ray diffraction (XRD) and optical microscopy (OM) before and after irradiation it
is possible to study the modifications and damages induced in the sample mate-
rial.
The first irradiation samples for MAFIA were provided by courtesy of AREVA-
CERCA. A continuous supply with fuel samples on demand could however not
be provided by AREVA-CERCA, as every sample had to be produced in Romans
(France) and to be shipped to the FRM II site, which is a time consuming and ex-
pensive procedure. The advantage of MAFIA, which is the possibility of a quick
and easy sample irradiation and examination, can however only be fully utilized,
if an adequate supply of irradiation samples is secured. This source of supply
should be able to provide samples at least as quickly as they can be irradiated
and as many as can be irradiated. It should further allow to be flexible in the
exact sample composition and ideally be on site to avoid cumbersome sample
shipment. It was thus nearby to test, whether sputter deposited samples fabri-
123
8/13/2019 Prediction of protein structural features by machine learning methods
Figure 4.21: (a) Cut of the MAFIA setup for heavy ion irradiation experiments. The sample cham- ber is attached to the +10° beam line at the tandem accelerator of the Maier-Leibnitz Laboratory(or: MLL) in Garching. If the beam line is active, the heavy ion beam crosses the chamber alongits middle axis. Several irradiation samples can be mounted into the sample changer, that auto-matically places them in the focus of the beam. Only one sample is irradiated at a time, and if theirradiation is finished the sample changer automatically switches the next one into the beam. Thesample changer is temperature controlled, that means the irradiation samples can be irradiatedat defined temperatures. The ion flux reaching the sample is monitored via a Faraday-cup, thatis inserted into the beam at regular intervals. (b) View into the MAFIA sample chamber (picture
from [jun11]).
124
8/13/2019 Prediction of protein structural features by machine learning methods
cated in our tabletop reactor could as well be used for HII.
Deposited samples Three types of sputter deposited samples could be of relevance in HII (see figure 4.22). First, a free standing monolayer system could
allow to investigate the change of properties in a material due to irradiation
damages. The thermal conductivity of U-Mo and its change during irradiation
could possibly be measured in this way. Second, a two layer system should
illustrate the irradiation behavior at the interface of two materials in contact with
each other, especially the IDL formation in the fuel/cladding system. This might
open the possibility to systematically test the compatibility of different materials
with each other at in-pile conditions. Third, a three layer system might be used
to test and develop barrier layers between fuel and cladding that reduce or avoidIDL formation. HII could allow to conduct a systematic screening procedure
to determine the most efficient barrier material and an optimum barrier thickness.
The thickness of the sputter deposited layers for HII is determined by the aver-
age range λ of the heavy ion beam in matter, and thus by the ion kinetic energy.
As the ions are used to simulate fission products, typical ion energies will be of
the order of 80 MeV14, which corresponds to an average range λ of the order of
several micrometers for all solid materials. In the case that the ion beam should
completely be stopped inside the layer, the layer thickness has to be greater than
the average range of ions. In the case that radiation induced interactions between
different layers are of interest, the layer thickness has to be small enough, so that
most ions can reach both layers.
In two or three layer systems the order of layers is given by the trajectory of
the fission products. In actual fuel plates, the ions respectively fission products
will be emitted from the fuel and be stopped inside the cladding. Therefore the
sample top layer facing the ion beam should be U-Mo and the bottom layer (re-
spectively substrate) should be a cladding material.
The necessary coating thicknesses for one, two and three layer systems can be
determined by simulations with the program SRIM (see appendix A1). The sam-ples in MAFIA are usually irradiated with the isotope 127 I at an energy of about
80 MeV (see subsequent paragraph). With SRIM it is possible to calculate the
mean ion ranges in the desired layer systems for this energy and ion type (see
for example table 4.5), and thus to estimate the optimum layer thicknesses. The
coatings can then be applied to the substrate surfaces in the tabletop sputtering
reactor.
14A single fission reaction of 235U releases about 200 MeV. From this energy a fraction of roughly
160 MeV is distributed to the heavy fission products, that have, dependent on their mass, an
average energy of around 80 MeV each.
125
8/13/2019 Prediction of protein structural features by machine learning methods
Figure 4.22: Sputtered geometries for HII samples: (a) Free standing monolayer to investigate
a change of material properties during irradiation. The thickness d of the layer has to be largerthan the range λ of the heavy ions to stop all ions inside the material. (b) System with one layersputtered on a substrate to investigate the interaction between two materials during irradiation.The thickness d of the sputtered layer has to be smaller than λ, so that the heavy ions can actuallyreach the substrate and enable an interaction. The thicknesses of sputtered layer d and substrateD have to be larger than λ to stop all ions. (c) System with two different layers sputtered ona substrate to test the quality of barrier structures. The thicknesses d1 and d2 of the sputteredlayers have to be smaller than λ so that the heavy ions can reach the substrate. The thicknessesd1, d2 and D have to be larger than λ to stop all ions.
material mean ion range [in µ m]
U-8Mo 5.01Ti 8.64
Zr 8.17
Zry-4 8.18
Bi 8.84
Al 12.8
Table 4.5: Ranges of 127I ions with an energy of 80 MeV in different materials (calculated bySRIM). The calculated values allow to estimate, how thick the layers in one, two and three layersystems have to be.
126
8/13/2019 Prediction of protein structural features by machine learning methods
Sample production For our first test of sputter deposited samples for HII we
decided to irradiate two layer systems of U-Mo and Al, as they are well com-
parable to the already known dispersed U-Mo/Al systems. Layers from U-Mo
provide only a relatively small ion range of about 5 µ m (see table 4.5). To allowthe ions to pass the U-Mo top layer and to reach the Al bottom layer, the thickness
of the U-8Mo had therefore to be smaller than 5 µ m. We decided to use a U-8Mo
thickness of 2 - 3 µ m for our samples.
The heavy ion beam spot in MAFIA has dimensions of about 2 mm x 6 mm,
which is therefore the minimum required size for an irradiation sample to utilize
the beam completely. It turned out during our experiments, that a size of 10 mm
x 10 mm is convenient for sample handling. We therefore used pieces of pure Al
(99.9995% purity) respectively Al-6061 in these size with a thickness of approxi-
mately 200 µ m as sputtering substrates for sample production. They were highlypolished on one side on a polishing disc with a diamond polishing liquid (dia-
mond grain size 1 µ m) to create a clean and flat surface with a roughness of ≤ 1
µ m.
The Al substrates were coated in the tabletop reactor with U-8Mo, as it was the
only U-Mo alloy available as sputtering target. The processing parameters were
kept constant for all samples to have comparable results. The plasma power was
chosen to be 300 W. According to the U-I-characteristics, the plasma voltage at
this power was about 300 V, the plasma current was about 1 A. The sample table
temperature was kept at about 15 C. The Ar pressure was 3·10−3 mbar. Accord-
ing to the Thornton zone model, the growing layers should all be of T structure.
Irradiation We conducted a first HII at the tandem accelerator of the Maier-
Leibnitz Laboratory (or: MLL) in Garching [jur10]. We primarily wanted to test,
if the deposited samples would survive HII, and if an IDL would actually form.
We were also interested in basic questions like, whether the substrate topography
would have an influence on IDL formation.
The choice of the heavy ion type used for HII was a compromise between the
necessity of a typical fission fragment isotope and technical feasibility. The twomaxima of the statistical fission fragment distribution curve for U fission are
located between the atomic mass numbers 90 to 100 and between 135 to 145
[sta07], therefore heavy ions with a mass in this range would be preferable for
HII from the physical point of view. Unfortunately this mass ranges cannot be
covered completely by the available types of ions at the tandem accelerator 15.
In the lower mass range between 90 to 100 only ion beams of the elements Zr,
Nb, Mo and Ru can be provided, in the higher mass region between 135 to 145
15Primarily the electrochemical behavior, but also other aspects determine, if an element can be
ionized and accelerated in the tandem accelerator and hence if it is available for HII.
127
8/13/2019 Prediction of protein structural features by machine learning methods
Figure 4.23: (a) SEM-BSD picture of a sputtered two-layer system with U-8Mo on Al (from [jur10])(b) SEM-BSD picture of a U-8Mo/Al sample irradiated at 200°C (from [jur10]). The IDL thatformed at the interface between U-Mo and Al is clearly visible. The Al substrate was not polishedand the IDL was thus clearly thicker as in the case when the Al substrate was polished.
Apparently sputter deposited U-Mo/Al systems show the same IDL formation
during HII as dispersed U-Mo/Al samples. A comparison of samples 1 and 2,
both with polished substrates, that were irradiated at 100°C respectively 200°C
gives evidence, that the process of IDL formation is not only dependent on ir-
radiation conditions but also on temperature. A threshold temperature value
between 100°C and 200°C might exist. A comparison of sample 2 and sample 3,
one with polished and the other one with unpolished substrate, gives evidence,
that the substrate topography affects IDL formation. Rougher substrate topog-
raphy means increased IDL formation. This behavior could be expected, as the
substrate topography directly determines the interface area between the differentmaterials.
Conclusion We could show, that sputter deposited samples are suited for HII,
and that IDL formation can clearly be observed. We also found clear evidence for
the expected influence of substrate topography and temperature on IDL forma-
tion.
129
8/13/2019 Prediction of protein structural features by machine learning methods
An effect of major importance in U-Mo fuels is the IDL formation during in-pile
conditions. As mentioned, IDL formation is the result of a radiation enhancedthermal atomic migration effect and caused by a solid state reaction of U and Al.
The application of an appropriate third material like Si in between U-Mo fuel and
Al cladding could prevent IDL formation, if the U gets immobilized by forming
a compound with the Si. A method to study such solid state reactions between
U-Mo and other materials are thermal diffusion experiments.
Diffusion experiments The efficiency of Si addition for IDL prevention can be
estimated from the reaction kinetics of Si. Generally, the kinetics of a thermally
activated chemical process can be described by the well-known Arrhenius equa-tion:
k = A · ex p−Ea/k BT
with k being the growth rate coefficient, A the reaction coefficient, Ea the activa-
tion energy and T the temperature. The value of Ea in this equation is an inherent
characteristic of a particular chemical reaction. From the knowledge of E a for dif-
ferent Si reactions it is thus possible to estimate the Si reaction kinetics at a certain
temperature T.
For a solid state reaction Ea is usually determined by measuring the time that
is needed at a fixed temperature to initiate the reaction. As Leenears states, analternative method is the use of ramp annealing to determine the formation tem-
perature of a reaction product [lee10]. In this method, the samples are heated with
different fixed heating rates and the sample crystal structure is monitored online
by X-ray diffraction. Figure 4.24 shows exemplary the XRD results for a ramp
annealing of a sample consisting of a 500 nm U-8Mo layer with a Si substrate at
a heating rate of 0.2 °C/s. It is clearly visible, that at approximately 560°C the U
reacts with the Si forming USi2 and USi3. The ramp heating rate determines the
integrated thermal budget to which the sample has been exposed prior to reach-
ing a certain temperature. The integrated thermal budget will be much higherfor small heating rates than for large ones, as the sample will spend longer time
at each temperature. As a result, the value of formation temperature will depend
on the ramp heating rate.
According to [lee10], it is possible to determine Ea by using the so-called Kissinger
equation:
ln(ddt T
T f ) = −
Ea
k BT f + const.
and by determining the formation temperature T f from the maximum peak in-
tensity of the XRD measurement.
130
8/13/2019 Prediction of protein structural features by machine learning methods
Figure 4.24: Figures from [lee10]: In-situ XRD results for ramp anneal of a Si substrate coveredwith a 500 nm U-Mo layer and a 30 nm Si layer (both produced by sputter deposition) at a rate of
0.2 °C/s. The transit between U-Mo and USi X at about 570 °C is clearly visible.
Study of the U/Si solid state reaction We prepared samples consisting of
U-8Mo sputter deposited on Si wafers. The wafers were first coated with a layer
o f 0 . 1 - 1µ m U-8Mo and then covered with several ten nanometers Si respectively
Zr coating for oxidation prevention. Leenears from the Belgian Nuclear Research
Center (SCK/CEN) performed ramp annealing and XRD measurements on these
samples to investigate the solid state reaction between U and Si [lee10]. She used
different ramp heating rates from 0.2 - 3.0 °C/s, and recorded the XRD plots
shown in figure 4.25.
The growth of an USi2 and an USi3 phase could be observed for all prepared sam-
ples. Complementary experiments of a Si layer deposited onto a U-Mo substrate
led to the formation of U3Si and U3Si2. Leenears used Kissinger analysis on the
XRD plots to determine the activation energy of the silicide formation. She de-
termined Ea values of 3.5±0.5 eV for USi2 and 4.4±0.6 eV for USi3, respectively
3.1±0.3 eV for U3Si2 and 5.1±0.8 eV for U3Si.
Conclusion The most important solid state reactions between U-Mo and Si
could be examined by thermal diffusion experiments with sputter deposited sam-
ples, and the according activation energies Ea could be determined. These factors
are necessary to estimate the reaction kinetics of Si and U-Mo at a given temper-
ature. This kind of measurement is only possible, because the sputter deposition
process allows the application of thin layers ≤ 1 µ m of different materials, that
can be penetrated by XRD measurement. Other relevant solid state reactions con-
cerning U-Mo could be studied in the same manner.
131
8/13/2019 Prediction of protein structural features by machine learning methods
Figure 4.25: Figures from [lee10]: In-situ XRD results for ramp anneal of a Si substrate coveredwith a 500 nm U-Mo layer and a 30 nm Si layer (both produced by sputter deposition) at a rate of
(a) 0.2 °C/s (b) 0.5 °C/s (c) 1.0 °C/s (d) 3.0 °C/s. The red markers indicate the growth of a USi 2phase while the green markers point out the formation of a USi3 phase.
132
8/13/2019 Prediction of protein structural features by machine learning methods
The combination of sample production in the tabletop sputtering reactor and
the HII of these samples in MAFIA is from our experience an effective way toquickly emulate the in-pile behavior of material systems containing U-Mo.
As mentioned, sputter deposition allows to form very plain and homogeneous
layers of arbitrary materials on arbitrary substrates. Conductive elements can be
processed by DC or RF sputtering, non-conductive elements by RF sputtering.
Alloys can be prepared by co-sputtering17 of pure elements, compounds by
reactive sputtering. Therefore systems of all possible combinations of U-Mo and
cladding alloys, barrier materials and additives can be realized easily. MAFIA
on the other side allows to produce irradiation damages in these samples that
are similar to those induced by nuclear fission and thus to simulate the effectof nuclear burnup for various temperatures and heat fluxes. Three types of
experiments based on HII of sputtered samples seem promising:
• screening of additive materials
• optimization of diffusion barriers
• thermal conductivity measurement
Co-sputtering allows to produce U-Mo+X/Al+Y systems with defined additivesX / Y both in U-Mo and Al. HII of such samples opens the possibility to sys-
tematically screen additives according to material and concentration in order to
determine the most effective material in the most effective concentration to pre-
vent IDL formation. In a similar way can multilayer systems of the structure U-
Mo/X/Al with a barrier material X be produced either by DC or RF sputtering.
For samples of this type, HII allows to screen the IDL preventive effect of layers
from different materials X in different thicknesses and also the determination of
the most efficient barrier material and an optimum barrier thickness [sch11].
A question of some interest that has hardly been investigated up to now is the
thermal conductivity of U-Mo fuel and its change during reactor operation. The
change of U-Mo thermal conductivity during reactor operation is expected to re-
sult from damages in the fuel material created by the fission reactions respectively
by the resulting fission products. HII generates damages in U-Mo that are similar
to those generated by in-pile irradiation. We thus expect, that the change in U-
Mo thermal conductivity induced by HII could also be similar to the the change
induced by in-pile irradiation. HII could thus allow to measure the evolution of
17Co-sputtering denotes the parallel use of several different sputtering targets with different
materials and one substrate. It allows to mix the different ejected atom fluxes to deposit a film of
mixed material.
133
8/13/2019 Prediction of protein structural features by machine learning methods
U-Mo thermal conductivity without the disadvantage of activating the fuel sam-
ples. Even an online measurement seems to be easily feasible with HII.
Hengstler tried to show the feasibility of the mentioned concept for cast mono-
lithic U-8Mo fuel samples [hen08]. Her samples had a thickness of 200 µ m, theirradiated surface layer had however a thickness of only 5 µ m, and the change
of heat conductivity in the irradiated zone was apparently too small to resolve
the effect. Hengstler identified the too large sample thickness, the too small sam-
ple size and the small number of available samples as the major problems of her
measurement and suggested to use thin monolithic foil samples of maximum 5 -
10 µ m thickness and a minimum size of 10mm x 10mm. As samples of that kind
could not be produced conventionally Hengstler was not able to pursue her mea-
surements.
By sputtering it is now possible to produce self-supporting monolithic U-Mo foilof the kind Hengstler suggests. A measurement of the HII induced change in
thermal conductivity thus seems feasible.
134
8/13/2019 Prediction of protein structural features by machine learning methods
Profile smoothing methods As a first method we considered a movement of plasma position. The static geometry and the static position of the discharge
plasma apparently have the biggest impact on the deposition profile and thus on
the formation of gradients. It is thus nearby to use a dynamic plasma geometry
or a variable plasma position to receive a blurring effect that can reduce gradi-
ents. The plasma geometry and position are both determined by the geometry
and position of the magnetic assembly. A dynamic geometry of the magnetic
assembly would thus lead to a dynamic plasma geometry. There are examples
in literature, where a dynamic geometry of the magnetic assembly has been
realized by a continuous rearrangement of the single elements of the magneticassembly, for example in [fre87]. It is however also possible to completely replace
the permanent magnetic assembly by a system of magnetic coils, that allow a
complete control of the position, direction and strength of the magnetic field and
thus of the plasma. We however considered all options for a dynamic plasma
geometry as technically too extensive to realize, as a continuous motion of a
static magnetic assembly and thus a variable plasma position seemed us much
easier feasible.
As a second method we considered an installation of masks into the sputtering
diode, that lead to a partial shadowing of defined substrate areas from the
material flux coming from the target. The mask is effectively a massive material
plate with a defined opening, that is located between target and substrate and
prevents ejected material from certain solid angles to reach the substrate surface.
The form and aperture of the opening will blind out certain areas of the target
or directions of deposition and by that influence the deposition profile on the
substrate1.
The third method is denoted as ’inactivation’ of target areas, which means that
defined areas of the sputtering target can intentionally be excluded from ion
bombardment. These inactivated areas thus will not face sputter erosion any
more, and no material will be ejected from their surface towards the substrate.Inactivation is based on the effect, that for both DC and RF sputtering a negative
voltage has to be applied to the sputtering target to generate an ion bombard-
ment. If the voltage is however not applied to the whole target but only to certain
parts of it, the ion bombardment will be limited to these particular areas. In a
DC sputtering reactor this can easily be achieved, if parts of the electrically con-
ductive sputtering target are replaced or covered by electrically non-conductive
materials. If an electrical field is used to induce an ion bombardment on the
1It has to be mentioned, that the blinding out of directions of deposition will of course also
influence the film growth process to a certain extent and thus influence film properties.
136
8/13/2019 Prediction of protein structural features by machine learning methods
Figure 5.1: Principal approach to gain the macroscopic angular distribution of ejected material:first we assume a random but reasonable macroscopic ejection distribution. With SPUSI it is pos-sible to simulate the deposition profile that would result from this particular distribution. Thenecessary pattern of active sputtering areas can be gained by measuring an actually used sput-tering target. The deposition profile gained by simulation can now be compared to an actuallymeasured deposition profile. If it matches, the assumed macroscopic ejection distribution is veri-fied. Otherwise it has to be modified, and the procedure starts again.
surface of these non-conductors, the ion charge will accumulate and build up a
reversed electrical field, that prevents further ion bombardment. A similar effect
occurs in an RF sputtering reactor, if parts of the target are covered by groundedshields.
To our opinion one of these methods or a combination of them could reduce both
thickness and compositional gradients effectively. As each of these measures re-
quires however some effort to be realized in experiment, we decided to evaluate
their individual effectivity by using a computer simulation.
Simulation of static configuration We tried to reproduce the experimentally
measured deposition profiles of the tabletop reactor and the full size reactor withthe program SPUSI as accurately as possible. SPUSI was developed by our group
to simulate the sputtering process on a macroscopic scale. Its function is de-
scribed in detail in the appendix A2.
We varied the macroscopic angular distribution via the matching coefficient x
and calculated by that various deposition profiles. By a comparison between
simulated and real deposition profiles, we were able to identify values of x, that
sufficiently reproduce the measured profiles (see figure 5.1).
For the processes in both sputtering reactors we determined a value of x ≈
5.5±0.1 (see figure 5.2 respectively figure 5.3). The resolution r in this simula-
137
8/13/2019 Prediction of protein structural features by machine learning methods
Figure 5.2: (a) Experimentally measured deposition profile in length (left) and width (right) of thetabletop reactor. (b) Simulated deposition profile in length (left) and width (right) of the tabletopreactor. The profile calculated by SPUSI is in good agreement to the measured profile, although
SPUSI completely ignores the physical processes and just considers the geometry of the problem.Apparently the geometry is the main factor that is responsible for the macroscopic depositionprofile of a sputtering target.
tion was 1 mm, the distance between target and substrate assumed to be 100
mm. As figure 5.2 shows, the deposition profile simulated by SPUSI is in good
accordance to the measured one. This leads to the assumption, that the geometry
and position of the discharge plasma is probably the most important factor that
is responsible for the macroscopic deposition profile of a sputtering target, and
that the microscopic physical ejection pattern only has a minor contribution. The
simulated profile in figure 5.3 is still in accordance to the measurement, but thedeviations are larger. The small contribution of the microscopic ejection processes
apparently gets more pronounced in the larger geometry. SPUSI thus allows
to simulate the macroscopic deposition characteristic in a static target/substrate
configuration and the accordant gradients (see figure 5.4). The accuracy of the
simulations is sufficient to use SPUSI as a tool to test the efficiency of measures to
reduce gradients and smoothen the deposition profile.
Simulation of profile smoothing methods We tested the mentioned methods
movement, shadowing and inactivation independently and in combination only
138
8/13/2019 Prediction of protein structural features by machine learning methods
Figure 5.3: (a) Experimentally measured deposition profile in length (left) and width (right) of thefull size reactor. (b) Simulated deposition profile in length (left) and width (right) of the full sizereactor. The profile calculated by SPUSI is still in agreement to the measured profile in the centralarea, but deviations are bigger.
139
8/13/2019 Prediction of protein structural features by machine learning methods
Figure 5.4: (a) Thickness gradient map for a deposit of size 125 mm x 135 mm produced in thetabletop reactor measured (left) and calculated by SPUSI (right). The calculated gradients are ingood agreement to the measured ones. (b) Thickness gradient map for a deposit of size 702 mm
x 60 mm produced in the full size reactor measured (top) and calculated by SPUSI (bottom). Thecalculated gradients still show a fair agreement to the measured ones.
140
8/13/2019 Prediction of protein structural features by machine learning methods
Figure 5.5: (a) Simplified cut view of the processing chamber in the full size sputtering reactor.The figure illustrates the position of the sputtering target and the space that is available aroundthis target for installations and reconstruction. The full size reactor provides about 90 mm ineach direction at the maximum. (b) Simplified cut view with static deposition profile beneath thesputtering target. The highlighted area sized 600 mm x 60 mm illustrates the projected positionof the U-Mo fuel foil on the substrate carrier, where the thickness gradients should mainly bereduced.
for the geometry of the full size reactor. The vacuum chamber of the tabletop
reactor was considered as too small to actually allow a realization of any of the
methods.
Our aim was to reduce the thickness gradient in an area of 600 mm x 60 mm
size (dimension of the available U-10Mo foils) in the centre of the substrate as
far as possible (see figure 5.5b). The limiting factors were primarily the the inner
dimensions of the processing chamber (see figure 5.5a).
We used the procedure illustrated in figure 5.6 to test the various procedures.
In our simulations we observed, that relative motion of the elements target,
plasma and substrate to each other in general produces a blurring effect as it
was expected. The impact of this blurring on the evolution of gradients on the
substrate is however strongly dependent on the particular path and speed of
motion and can decrease but also increase the resulting gradients.
Mask structures generally seem to be an inappropriate mean to reduce overall
thickness gradients in a sputtered deposit. They have the effect of blinding
141
8/13/2019 Prediction of protein structural features by machine learning methods
Figure 5.7: From the shape of the thickness gradients in width (top) and length (bottom) in thestatic deposition profile we obtained the shape of the speed profile for the relative motion in widthand length. We identified speed profiles of these shapes to be the most efficient ones for thicknessprofile smoothing.
In the given geometry, that means with a target of 702 mm x 122 mm in size, a pro-
cessing chamber with 90 mm free space in each direction and a substrate centralregion of 600 mm x 60 mm, we were able to reduce the width thickness gradient
to a value of minimumthicknessmaximumthickness > 0.99 with the shown method. The length thickness
gradient could be reduced to minimumthicknessmaximumthickness > 0.65 in the length of 600 mm and
to > 0.99 in a length of 350 mm. A further reduction could not be reached in
the given geometry, but would be feasible if the geometry of the setup could be
changed.
Conclusion By simulations with the program SPUSI we identified a relative
motion of either magnetic assembly, target or substrate towards the other com-
ponents as most effective and simplest method to reduce thickness gradients in
sputter deposited films. We gained the best results for a two dimensional motion
with a variation in speed in each dimension. If the speed profiles and the relation
of speed in length and width are chosen adequately, the thickness profile in the
central area of the substrate can nearly be completely suppressed. The space lim-
itation given by the size of the processing chamber makes it however impossible,
to reach a nearly gradient free deposition zone of 600 mm x 60 mm in the full size
reactor with the given setup geometry. Only a gradient free deposition zone of
350 mm x 60 mm could be reached.
143
8/13/2019 Prediction of protein structural features by machine learning methods
Figure 5.8: Thickness profile for a relative motion in width with a speed profile according to 5.7.The thickness gradient in width has nearly disappeared, the gradient in length is unchanged.
Figure 5.9: The speed profiles gained by the method shown in 5.7 can be used to smoothen a twodimensional thickness profile by superposition of a motion along the length axis with a motionalong the width axis. To get a sufficient homogeneity over the whole area, one of these motionsshould moreover be much faster than the other one. The size of the processing chamber limits the
dimension of the motion path.
144
8/13/2019 Prediction of protein structural features by machine learning methods
Figure 5.10: Thickness profile for a relative motion in width and length with speed profiles ac-cording to figure 5.7 and a motion path according to figure 5.9. The thickness gradients in widthand length have nearly disappeared in the central region of the deposit. The central region ishowever much smaller than the 600 mm x 60 mm size we wanted to smoothen, as the size of theprocessing chamber does not allow more extended motion paths.
5.2 Film pollution
Current status
During film deposition we observed the occasional occurrence of pollution and
growth defects in the sputtered deposits, even when the substrates had been pre-
pared carefully before. Primarily films that were produced in the tabletop reactor
were frequently subject to this kind of effect and showed flaking as well as macro-
scopic particles, that had been embedded into the sputtered film. As reason for
the pollution and the flaking we determined macroscopic particles, that trickled
onto the substrate surface during the deposition process (see figure 5.11). These
particles polluted the samples already during manufacturing, and locally caused
the growth of flake structures or nodular defects.
As origin of the particles we could identify the walls of the vacuum chamber.
Material, that had been deposited to the walls of the sputtering reactor in present
and previous deposition runs, accumulates over time and forms a thick porous
layer covering the walls of the vessel. It turned out, that this layer is subject to
increased oxidation due to air contact as long as the vacuum vessel is open. The
vibration of the vacuum pumps during the sputtering process then leads to a
steady release of small oxide and other material particles from the walls.
145
8/13/2019 Prediction of protein structural features by machine learning methods
Figure 5.11: (a) Spherical Zry-4 particle, that apparently dropped onto the sputtered film afterthe deposition of the Zry-4 layer and prior to the deposition of the U-Mo layer. The particle wasembedded into the sputtered U-Mo film and caused a nodular growth defect. (b) A U-Mo flakethat has dropped onto a Al-6061 substrate prior to Zry-4 and U-Mo deposition. The flake wascompletely covered by a layer of Zry-4 and U-Mo.
Concept for improvement
We tried to avoid the wall pollution by a regular mechanical cleaning of the cham-
ber walls. By this mean we could significantly reduce the particle dropping, but
not completely avoid it, as every deposition run generates a new layer. The effect
could however easily be avoided, if the deposition setup would be turned by 90°or 180°, so that the particles can not any longer fall onto the substrates but would
fall away from the substrates. This simple mean was unfortunately not applica-
ble to the tabletop reactor, due to a lack of space in the fume hood it is installed
in. It can however be considered for a future reactor improvement.
5.3 Target material spectrum
Current status
For all applications shown in this thesis we operated our sputtering reactors only
in DC mode and used a pure physical sputtering reaction. This is sufficient to pro-
cess most of the relevant materials in the field of U-Mo fuel fabrication, which are
mainly metals (Al, Zr, Ti, Ni, Ta, Bi, Cd), alloys (U-Mo, AlFeNi, Al-6061, Zry-4) or
semiconductors (Si), that means electrically conductive materials. Advanced fuel
designs require however the processing of non-conductive compounds like ZrN,
which could be an effective diffusion preventive coating material [izh09], or B4C,
which could be used as potent neutron poison [kei11]. The processing of these
materials is neither possible by pure physical sputtering nor by DC sputtering.
146
8/13/2019 Prediction of protein structural features by machine learning methods
Two different methods can be used to deposit a chemical compound onto a sub-
strate: first, a sputtering target of that particular compound can be used in a diodesputtering setup to deposit a film. If the compound is conductive, a DC diode is
in principle sufficient for that purpose. Non-conductive target materials on the
other side can be processed, if the diode is operated in OF mode. Second, the
compound can be formed during the sputtering process. One or more elements
of the compound are provided as ejected material flux from the sputtering target,
the remaining ones are added with the working gas. The compound film on the
substrate forms as a result of a chemical reaction of the different components.
In practice, usually both methods are used together. RF sputtering on the one
side allows to use any material as a sputtering target, regardless if it is electri-cally conductive or not. Basically any solid material can be sputter eroded in a
RF diode and thus any elemental composite of a solid target can be provided as
sputtered particle flux. The working gas on the other side is prepared from re-
active and non-reactive gaseous composites to provide elements that cannot be
used as target materials, gases for example. The chemical reactions on the target
surface, in the plasma state and on the substrate surface will then determine, how
the sputtered deposit will be composed.
RF sputtering It has been mentioned already in section 2.2, that the DC diode
shown in figure 2.11 can only be operated with conductive target materials.
The surface of a non-conductive target would immediately accumulate positive
charge due to the bombarding ions and by that build up an electric field, that
would stop any further surface ion bombardment and also extinguish the glow
discharge. A permanent inversion in the diode polarity can however prevent
this, if the frequency of the pole reversal is high enough to avoid a surface charge
accumulation. A frequency of about 50 - 100 kHz is usually sufficient to achieve
that [ros90]. The diode has thus to be operated in OF mode to process both con-
ductive and non-conductive materials. Usually a frequency of 13.56 MHz is used
for the OF sputtering (in this case also called radio frequency or RF sputtering),as this frequency is officially assigned for this type of applications.
The process of ion bombardment in RF sputtering is different from DC sputtering.
Both electrodes, target and substrate, will alternately be subject to ion bombard-
ment in RF mode, but the intensity will be massively reduced compared to the
DC case. This is because for pole reversal frequencies in the MHz range, the ions
in the discharge plasma can hardly follow the electric field oscillations and there-
fore hardly move at all, as their electrical mobility2 is very small. The electrons
2The electrical mobility µ is defined as the ability of a charged particle to move through a
medium in response to an electric field E. The formal equation is µ = vE = qmν , where v is the
147
8/13/2019 Prediction of protein structural features by machine learning methods
on the other side have a comparably high mobility and follow the field easily. As
the ion current at the cathode has however to be identical to the electron current
at the anode, the low ion mobility reduces the electron as well as the ion bom-
bardment of both electrodes.To achieve an efficient target ion bombardment in RF operation, the DC diode
setup has to be modified as shown in figure 5.12a [ros90]. The central insight in
this respect is, that the discharge plasma together with the two electrodes can be
seen as a serial connection of two capacitors Ctarget and Csubstrate (see figure 5.12b).
For symmetric area electrodes, as in the DC case, Ctarget equals Csubstrate and the
same voltage U builds up at each of the electrodes leading to a small and alternat-
ing electron and ion bombardment. If the electrodes are however asymmetric in
area, Ctarget and Csubstrate are different and therefore different voltages Utarget and
Usubstrate will build up at the two electrodes, a behavior which is denoted as self biasing. The ratio between voltages and capacitors is given as
U target
U substrate= Csubstrate
Ctarget,
so a higher negative voltage will build up at the smaller electrode while the larger
one will generate a higher positive voltage (see figure 5.12c). If an additional cou-
pling capacitor is inserted into the circuit, that prevents a reversal of current di-
rection, the self bias effect will make the smaller electrode to a negatively charged
’RF cathode’, while the larger electrode will become a positively charged ’RF an-
ode’. A small target electrode will thus be the RF cathode and by that face an
intense ion bombardment and sputter erosion, while a large substrate electrode
will be the RF anode and face a strongly reduced ion bombardment (and sputtererosion).
By choosing the capacitors Ctarget and Csubstrate adequately, it is even possible to
completely avoid the sputter erosion of the substrate electrode. The necessary
condition is q ·U substrate < sputtering energy threshold, where q is the charge of
the bombarding ions.
Reactive sputtering Reactive sputtering is possible both in a DC or a RF oper-
ated sputtering diode and allows to deposit a multitude of chemical compounds.
The available elements for the chemical reactions in the reactive sputteringprocess are constituted by the used target material and by the working gas com-
position. The process behavior and chemistry is however primarily determined
by the processing parameters, especially by the flow of reactive working gas
[dep08].
Figures 5.13a and b illustrate schematically the characteristic process behavior of
a reactive sputtering process with a metallic target in dependency of the working
gas flow. As it can be seen, both the sputter erosion rate (figure 5.13a) and the
drift velocity, m is the particle mass, q is the particle charge and ν is the collision frequency with
particles of the medium.
148
8/13/2019 Prediction of protein structural features by machine learning methods
Figure 5.12: (a) Basic assembly of a diode sputtering setup for OF operation. The setup is nearlyidentical to the one shown in figure 2.11. The electrodes are however asymmetrically in size anda coupling capacitor has been added to the circuit. During OF operation this setup generates anegative self bias voltage at the target electrode. (b) Simplified circuit diagram of the OF setup.The discharge plasma together with the two electrodes can be seen as a serial connection of two
capacitors Ctarget and Csubstrate. The ratio between capacitor and the voltage at each capacitor is
given as U target
U substrate= Csubstrate
Ctarget. (c) The applied voltage from the OF generator is supposed to be
of sine shape. If both electrodes would be identical in size, each would face the same ion andelectron bombardments and by that be alternately sputter eroded or coated. If the sizes of theelectrodes are not identical however, the different mobilities of electrons and ions cause a self biasing. The smaller electrode is preferentially bombarded by ions while the larger electrode willpreferentially be bombarded by electrons. Thus in the OF case the relative size of the electrodedetermines, whether it is the sputtering target or substrate. If the substrate capacitance Csubstrate islarge enough, the ions bombarding the substrate surface will have energies below the sputteringenergy threshold and the substrate electrode won´t be subject to sputter erosion any more.
149
8/13/2019 Prediction of protein structural features by machine learning methods
reactive working gas pressure (figure 5.13b) show a hysteresis behavior if the gas
flow is increased or decreased. The hysteresis separates two different phases of
process behavior, that are sometimes denoted as ’metallic’ phase and ’poisoned’
phase [dep08], but are typical for most reactive sputtering processes also whennon-metallic targets are used.
For low reactive gas flows (up to the position A in the two figures), the sputtering
of target material will dominate reactive process behavior. Sputter erosion and
deposition rates in this phase are relatively high compared to the latter one. The
reactive gas flow is nearly completely consumed by chemical reactions at the
substrate surface, in the plasma and at the target surface and the reactive gas
partial pressure is thus low. The deposited films are usually under-stoichiometric
in this phase, as the amount of target material flux exceeds the reactive gas
supply. The target surface will continuously get partially covered by chemicalcompounds produced in the reactions, but sputter erosion will always remove
these compounds and keep the surface mainly metallic. The sputtering diode
can thus be operated both in DC or RF mode without problem. Increasing the
reactive gas flow in this situation will lead to an increasing number of chemical
reactions in the process.
A critical condition is reached (position A in the two figures), when the whole
target surface is completely covered (or: ’poisoned’) by a compound layer. As
the sputtering yields of target material and compound material are usually
very different, the sputter erosion, target material flux and deposition rates
decrease drastically at this condition. Due to the reduced target material flux,
the number of chemical reactions in the plasma and at the substrate surface
also drops immediately, and not the whole amount of supplied reactive gas is
consumed any more. As a consequence the reactive gas partial pressure rises
quickly (position B in the two figures), and the excessive reactive gas supply
usually leads to the deposition of over-stoichiometric films. A poisoned target
can moreover only be operated in DC mode, if the compound layer on the target
surface is electrically conductive. Otherwise it can only be operated in RF mode,
as the DC operation would stop as soon as the target is poisoned.
The way back from a poisoned to a metallic target surface requires a reductionof reactive gas flow below the position B and continuous ion bombardment to
remove the poisoned layer from the target surface (position C in the two figures,
but reversed direction). Once the surface is substantially metallic (position D in
the two figures), the starting state has been reached again.
The hysteresis effect limits the spectrum of achievable compositions of chemical
compounds in a reactive sputtering process [scl11]. The film stoichiometries that
are reached for those processing conditions, at which the hysteresis effect occurs,
are usually hard to realize. It is however possible to shift the ’position’ of the
150
8/13/2019 Prediction of protein structural features by machine learning methods
Figure 5.13: Figures from [dep08]: (a) Schematic sputter erosion rate of a metallic target in de-pendency of the reactive gas flow. (b) Schematic reactive gas partial pressure in dependency of the reactive gas flow. Both figures show the characteristic hysteresis behavior that is typical forreactive sputtering.
151
8/13/2019 Prediction of protein structural features by machine learning methods
Table 5.1: Target material, working gas composition and processing parameters for the successfuldeposition of ZrN (from [re03]) and B4C (from [pas98]).
hysteresis loop, that means to control the range of reactive gas flow at which the
hysteresis effect appears, simply by adjusting the working gas pumping speed.
A higher pumping speed allows to feed larger amounts of reactive gas into the
sputtering process without poisoning the target.
In summary it can be stated, that the deposition of a particular chemical com-
pound by reactive sputtering is unfortunately much more complex than in
non-reactive sputtering, as not only target material and working gas composition
have to be specified, but also the appropriate processing parameters have to be
identified to actually deposit a compound with desired stoichiometry.
Compounds for fuel fabrication Currently two chemical compounds are rele-
vant for U-Mo fuel processing, ZrN [izh09] and B4C [kei11]. The deposition of
both materials by sputter deposition has been studied for applications in micro-
electronics as well as for hard coatings. ZrN is usually produced by reactive sput-
tering using a Zr target and Ar/N2 working gas in a sputtering diode operated
either in DC or RF mode. B4C is usually produced by non-reactive RF sputtering
using a B4C target and Ar working gas. Table 5.1 lists processing parameters,
that have been reported to successfully produce the two deposits. The reactive
gas flux is however not given, as it is dependent on the used pumping speed and
thus on the design of the sputtering reactor.
152
8/13/2019 Prediction of protein structural features by machine learning methods
The efficiency of the sputter processing in our reactors could be improved signifi-
cantly, if the material utilization of the target would be increased. For the current
setups it was determined to be around 20 - 25 % for the tabletop reactor respec-
tively 30 - 35 % for the full size reactor, literature describes however sputtering
techniques that allow a degree of utilization of more than 95 % [ang03].
Concept for improvement
Our sputtering reactors use a static assembly of sputtering target and magnets(schematically shown in figure 5.14a). Dependent on the size of this assembly,
it is possible to eject up to 30 - 35 % of the total target mass until the sputtering
target has to be replaced (see chapter 3.2.2). By the following methods it would
however be possible to increase this percentage:
• The magnetic assembly, that defines the position of the discharge plasma
ring, can be moved periodically and relatively to the target (see figure
5.14b). For an appropriate motion path this leads to a uniform target ion
bombardment and erosion and thus to a high material utilization of >80 %
[fre87]. This method has however the disadvantage, that suspension struc-tures as the target mounting screws, will be eroded as well. To avoid this,
these structures could be made from non-conductive materials (for DC op-
eration) or grounded (for RF operation). The most common method is how-
ever a target suspension from the back side.
• The shape of the magnetic assembly can be changed to homogenize the
magnetic field along the racetrack (see figure 5.14c). This measure (often
referred to as ’magnetron balancing’) is primarily intended to avoid the
CCE, but it also increases material utilization moderately to up to 30 - 40
% [mat02].
• An extension of the field closing plates, as shown in figure 5.14d, allows
to generate a magnetic field with field lines that are nearly parallel to the
target surface. The resulting discharge plasma volume is adapted to the
space between the field closing plates and thus leads to an erosion zone that
can be adapted to the target geometry. This allows a material utilization of
> 80 % [may97].
• The glow discharge can be operated at elevated pressures and without the
magnetic assembly as a normal glow discharge (see figure 5.14e). This leads
153
8/13/2019 Prediction of protein structural features by machine learning methods
Figure 5.14: Different schematic target assemblies to improve target material utilization. (a) Setupwith static magnetic assembly as it is currently used in our sputtering reactors. The degree of ma-terial utilization is 20 - 25 %. (b) Target setup with dynamic magnetic assembly that allows amaterial utilization of > 80 %. (c) Target setup with optimized magnetic geometry that avoidsCCE and also increases material utilization moderately to 30 - 40 %. (d) Target setup with ex-tended field closing plates that allow a material utilization of > 80 %. (e) Target setup operatedwith a normal glow discharge without magnetic enhancement. The degree of material utiliza-tion can be increased to > 80 %. The deposition rate is however decreased significantly and lowpressure growth conditions are not available. (f) A plasma beam is used for a controlled erosionof the target surface and allows to reach a material utilization of > 98 %. (g) Target setup thatis nearly idential to (a) but with a sputtering target consisting of a pool of liquid target material.This design allows to reach a material utilization of > 99 % but has the disadvantage, that materialwill continuously evaporate from the pool and produce a mixed flux of evaporated and sputtered
material.
155
8/13/2019 Prediction of protein structural features by machine learning methods
This final chapter completes the presented thesis. The work that has been con-
ducted is briefly summarized and conclusions are made.
6.1 Summary
The following engineering and scientific works have been performed in the con-
text of this thesis:
• A tabletop sputtering reactor has been designed and constructed to conduct basic deposition experiments and to produce samples. It was installed into
a fume hood in a radioisotope lab, and is in regular operation since several
years now. It allows to quickly produce tailored samples for U-Mo metal-
lurgy and irradiation experiments with little effort.
• A full size sputtering reactor has been designed and constructed to conduct
sputter processing on U-Mo full sized foils. It was mounted in a glove box
and installed into a hot lab facility. After an extensive technical inspection
by the TUV1, the reactor was officially approved and received the operating
license by the BStMUGV2
as a permanent technical installation in the hotlab. It is in regular operation since one year.
• Both sputtering reactors have been studied and characterized in terms of
process parameters as well as reactor, target and substrate properties. The
sputtering process in these reactors is now well enough understood to al-
low the processing of U-Mo fuel foils and the fabrication of experimental
We constructed a sputtering reactor, that is suited to conduct sputter process-
ing on U-Mo full sized foils. In experiments with this reactor we could show,
that sputtering is a superior process for foil surface cleaning and functional layer
application. Moreover sputtering allows to produce tailored samples for exper-imental studies making it a valuable tool in nuclear fuel research. Both applica-
tions are novel and promising, and will certainly find their place in U-Mo fabri-
cation and research.
159
8/13/2019 Prediction of protein structural features by machine learning methods
The program SRIM (’Stopping and Range of Ions in Matter’), that was developed
by Ziegler et al. [zie84], allows to simulate the interactions of ions with matter.
We used the program to simulate the microscopic sputtering process, as well as to
estimate the behavior of sputtered samples in heavy ion irradiation experiments.
A1.1: Program
SRIM is based on a Monte Carlo method and simulates the interaction of incident
ions with the atoms of a plane and homogeneous material layer. Parameters like
ion type, energy and angle of incidence as well as the type, density and thicknessof material can be freely chosen as starting parameters. The program simulates
a chosen number of ions including their trajectories, collisions and subsequent
collision cascades in detail, and, based on that, calculates a multitude of output
parameters including sputtering rate and energy distribution of sputtered parti-
cles. SRIM can therefore be used to simulate the microscopic sputtering process
and to gain information on some of its essential parameters.
There are however several aspects that should be considered when using SRIM.
First it should be mentioned, that SRIM uses the the binary collision approxima-
tion, which means that the influence of neighboring atoms on a single collision
event is neglected. This means for sputtering in general, that only reactions in
the single-collision and the linear cascade regime should be calculated by SRIM
to get reasonable results. This is however not a drawback in our case, as we
wanted to restrict our studies on this reactions (see chapter 2.1). Secondly, crys-
tal structures and topological structures in general are neglected in the program.
The bombarded material in the simulation is always a homogeneous, amorphous
and flat material layer without any detailed surface or volume structure. Thus
only the basic sputtering process for an ideal amorphous target will be calculated
properly, the results for a target deviating from that may differ. A third aspect is,
that SRIM does not account for dynamic effects such as composition changes or
161
8/13/2019 Prediction of protein structural features by machine learning methods
Figure 6.1: (a) Total sputtering yield per ion energy for the relevant materials calculated by SRIM.
(b) Mean energy of ejected atoms for normal ion incidence depending on the ion energy. (c) Totalsputtering yield per angle of incidence for different ion energies for Al. (d) Mean energy of ejectedatoms per angle of incidence for different ion energies for Al.
evolution of radiation damages. A simulation of long-time effects is therefore not
possible.
In summary, SRIM allows us to simulate and study the fundamental sputtering
event itself within some limitations, and therefore it is a valuable tool. However
it does not allow to simulate the complete sputtering process.
A1.2: Sputtering yield and mean energy
We used SRIM to calculate the total sputtering yield S per ion as a function of
energy for normal ion incidence for all materials listed in table 3.4. We assumed
a bombardment with single charged Ar ions and an acceleration voltage of 0 - 1
kV. Figure 6.1a shows the results. Apparently, the total sputtering yields for all
materials stay between 0 - 2.5 atoms per ion for the given energy range. Figure
6.1b shows the mean energy of the ejected atoms, that are in the range of 5 - 50 eV.
162
8/13/2019 Prediction of protein structural features by machine learning methods
We know from the previous chapter, that both the sputtering yield and the ejec-
tion energy are dependent from the angle of ion incidence. The principal behavior
can be seen in figures 6.1c and d at the example of Al. It is clearly visible, that
the maximum sputtering yield can be expected for angles between 70 - 75° to thesurface normal. This range apparently represents an optimum between the size
of the collision cascade and its proximity to the surface. A similar behavior can
be expected for the other materials.
With the calculated sputtering yields S, it is in principle possible to calculate the
ejection rates R in our reactors by the following equation:
R =
U ·q·e 0
90 0
S(E,θ ) · I (E,θ )dθ dE
where U is the plasma voltage, q the maximum appearing charge state of bom-
barding ions, e the elementary charge, S(E,θ ) the sputtering yield in dependence
of ion energy and angle of ion incidence θ , and I (E,θ ) the number of ions with a
certain energy and a certain direction. The energetic and angular distribution I
(E,θ ) of the bombarding ions is usually hard to determine however. Thus we will
be content by giving a rough estimate on R.
Assuming the conditions of the example for sputtering U-Mo, a plasma current
of 1 A and single charged ions, we can roughly estimate that about 6.24 ·1018 ions
(the equivalent of 1 C) bombard the target per second. From the calculated com-
position of the altered layer and from the total sputtering yields of U and Mo,
an average sputtering yield of 0.20 atoms per ion can be calculated. This gives a
number of 1.25·1018 atoms, that are ejected per second at 240 W, with a composi-
tion of 80% U and 20% Mo. This is equivalent to a mass of 0.44 mg U-8Mo, that
gets eroded every second from the target and is ejected into the sputtering reac-
tor. This is in good accordance to the experimentally determined average target
mass loss of approximately 0.5 mg/s.
A1.3: Ion backscatteringAs mentioned before, the substrate and the deposited film are subject to an en-
ergetic particle bombardment during sputtering. The bombarding particles are
target atoms ejected during the sputtering process as well as energetic neutrals,
that are generated during ion bombardment by neutralization and reflection of
ions from the sputtering target. The rate of bombardment can be estimated by
SRIM.
The number of target atoms that bombard the deposited film is equivalent to the
just calculated ejection rate R times the fraction of target atoms, that actually reach
the deposited film. This fraction is strongly dependent on the size of the film and
163
8/13/2019 Prediction of protein structural features by machine learning methods
Table 6.1: Ar ion reflection probabilities for the materials listed in 3.4.
on the solid angle it covers seen from the target. This can be measured quite
easily. For our reactors, we measured that about 15 - 25 % of the ejected atoms
reach the deposited substrates (see chapter 4.2.1). Thus the rate of substrate bom-
bardment should be in the range of 1.9 - 3.1·1017 target atoms per second for the
U-8Mo example.
The number of neutrals, that bombard the sputtered film, is hard to determine.
Basically every bombarding ion, that gets reflected from the target surface, can become a bombarding neutral, if it is neutralized during collision. The probabil-
ity of neutralization is however not known to us. The number of reflected ions
can however be seen as an upper maximum of the number of bombarding neu-
trals. We thus calculated the reflection probability for all our target materials by
SRIM (see table 6.1).
As SRIM uses the binary collision approximation, the reflection probability is in-
dependent of the collision energy. For our U-8Mo example, the reflection prob-
ability accounts 0.27, meaning that 27 % of all bombarding Ar ions are reflected
from the target3
. If all of this ions would be neutralized during collision, thesputter deposited film would face a bombardment of 2.5 - 4.2 ·1017 neutrals per
second.
A1.4: Atom reflection
The reflection of atoms from the surface of a solid appears, if the mass of the
surface atoms is larger than the mass of the impinging atoms. For sputtering
substrates, this effect usually states no problem at all, as the substrate surface
3This reflection is already accounted in the sputtering yield S.
164
8/13/2019 Prediction of protein structural features by machine learning methods
Table 6.2: Reflection probabilities for the atoms of the most important constituents for the multi-component target materials listed in table 3.3.
gets quickly covered by a film and does not play a role any more for reflection4.
For mono-component films this effect is also not of importance, as basically no
reflection occurs if an atom of one certain element is impinging onto a film of the
same element. Atom reflection thus only plays a role for the deposition of multi-component materials.
We calculated the reflection probability for all multicomponent materials listed in
table 3.3 by SRIM (see table 6.2).
Only in the case of the Mo constituent in U-8Mo a significant amount of atom
reflection can be seen. According to the simulation, a fraction of 13 % of all
Mo atoms reaching the U-8Mo film surface get reflected from it. This leads to
a systematically lowered Mo content in a sputtered deposit. A U-8Mo target thus
produces a U-7Mo film during sputter deposition. This shift in composition is
however constant and not dependent on processing parameters, and can there-fore be accounted already during target selection. The deposition of an U-8Mo
film by sputtering would hence require an U-9.2Mo sputtering target.
4The deposition rates in our sputtering reactors have been measured to be in the range of ˚ A/s,
thus the substrate surface will completely be covered by a film within several seconds.
165
8/13/2019 Prediction of protein structural features by machine learning methods
Figure 6.3: The raw target matrix is multiplied with a profile matrix of the actual erosion zone,which can be gained by a depth profile measurement. The result is an active target matrix. Differ-ent erosion rates at different positions are comprised within this active target as weighting factorsof the single lattice elements (here symbolized by different colors).
To account for the plasma position and the resulting erosion areas on the actual
sputtering target in stationary configuration, the raw target matrix is multiplied
with a profile matrix pi, j ∈ [0,1]. It represents the three dimensional depth profile
of the erosion trench. This profile matrix can easily be gained from a profile mea-
surement, conducted for example with the ATOS system at the TUM Institute forForming and Founding (see figures 3.17 and 3.18). The size of the matrix is deter-
mined by the size of the target in units of r. The matrix values are the normalized
local depth values, where 1 is the maximum depth and 0 is the minimum depth.
The value of each profile matrix element thus determines, how much erosion is
visible in this element and, by that, how much material must have been ejected
from that element. The result of this multiplication is the active target, that has
active sputtering areas similar to an actual target (see figure 6.3). The correspond-
ing matrix is defined as:
tacti, j := t i, j · pi, j
In a next step the deposition process itself is modeled. We assume, that every
single active target element continously ejects material with a certain angular
distribution. This macroscopic angular distribution is determined by various mi-
croscopic effects and should not be mistaken with the microscopic angular distri-
butions shown in figures 2.2 and 2.3. It results from the superposition of all mi-
croscopic ejection reactions inside the active target element, and thus contains all
energetic, topographic and material influences listed in chapter 2.1. The macro-
scopic angular distribution function is not known, but has to be measured for
each element, each target geometry and each energy. We also expect this distri-
167
8/13/2019 Prediction of protein structural features by machine learning methods
bution function to change during operation, as the target geometry changes. As a
working assumption we started with a macroscopic angular distribution function
cosx(α ), whereα is the angle between the target surface normal and the direction
of atom ejection, and x is a matching coefficient.The angular distribution function defines, which fraction of the total amount of
sputtered atoms is emitted in a certain direction. By applying it to a matrix el-
ement of the active target, one gains a rough model of the macroscopic sputter
emission profile of this single target element. It is formally given by
temii, j (α ) := tact
i, j · cosx(α ), α ∈ [0, π
2].
To gain the resulting deposition profile of this target element on the substrate, theprojection of temii, j (α ) on all substrate elements sk ,l is calculated by the relation
sk ,l =
i
j
temii, j (α (k , l))
with
α (k , l) = arctan
(itarget − k substrate)2 + ( jtarget − lsubstrate)2
d
where d is the vertical distance between target and substrate in units of r, and
(it − k s)2 + ( jt − ls)2 is the horizontal distance between the target element ti, j
and the substrate element sk ,l in units of r (see figure 6.4).
The principal method is illustrated in figure 6.5.
A2.2: Implementation of movement
A possible way to reduce gradients that appear in the static configuration of
SPUSI is the implementation of movement. It is possible to move either target orsubstrate or just the magnetic assembly (and thus the plasma itself). Every move-
ment can however be described as an relative movement of the discharge plasma
(material source) against the substrate. This relative movement was implemented
into the basic SPUSI program by using the superposition of static sources and
renormalizing.
The movement data is provided to the program as a list of target respectively
substrate positions at certain5 points of time (x(ti),y(ti)) = (xi,yi),i∈ N, that can
5Because intermediate coordinates are linearly interpolated it is reasonable to choose the given
points accordingly.
168
8/13/2019 Prediction of protein structural features by machine learning methods
Figure 6.4: The deposition at the substrate matrix element sk ,l is the sum of the emission of all
active target elements temii, j directed at the particular substrate matrix element sk ,l . The angular
distribution function defines, which fraction of the total amount of sputtered atoms is emitted ina certain direction.
Figure 6.5: SPUSI needs the active target areas defined by the plasma as well as the angulardistribution of the sputtered atoms to calculate the resulting deposition profile.
169
8/13/2019 Prediction of protein structural features by machine learning methods
easily be created by a standard spreadsheet program. This given coordinates de-
fine a total approximate6 path length D, along which the target/substrate will be
moved:
D =n−1i=1
(xi − xi+1)2 + ( yi − yi+1)2
The number n of discrete positions during this calculation is determined by the
resolution in x- and y-direction, rx and r y:
n =
D r2
x + r2 y
The elements of the active target matrix tacti, j , which represent the active sputteringareas in a stationary configuration, are shifted according to the listed positions
and superponed with each other. The intermediate result is an effective active
target matrix
tact,eff,movedi, j =
nν =1 tact,eff
i(ν ), j(ν )
n
as it is shown in figure 6.6, that is static but contains the movement in its
structure. The deposition can hereafter be modeled like a stationary deposition
process in the basic SPUSI program.
A2.3: Implementation of masks
As another option to reduce gradients we considered the use of a mask between
target and substrate. The mask was implemented into SPUSI as a mask matrix
mq,r that has the same size and resolution as t i, j. The distance d between target
and substrate is divided into two parts by the mask:
d = dtarget→mask + dmask →substrate
The mask matrix mq,r defines the permeability for the linear particle trajecto-
ries starting at the target. All elements of mq,r have either the numerical value
0 (meaning no transmission) or 1 (meaning full transmission). The mask is im-
plemented into the sputtering process via a factor δ(q,r). We define:
δ(q, r) =
0, if α target/mask = α target/substrate
1, else
6Again, this is owed to the fact that the path is interpolated linearly.
170
8/13/2019 Prediction of protein structural features by machine learning methods
Figure 6.6: SPUSI displays the dynamic deposition process as a static process. In experiment thesputtering target (left side) should be moved according to the elliptic path. SPUSI shifts the activetarget area according to the path and superposes the resulting images to gain an effective activetarget area (right side). This static target contains the complete movement information but can be
treated like in stationary deposition.
171
8/13/2019 Prediction of protein structural features by machine learning methods
Figure 6.8: Figures from [jun11]: (a)The orthorhombic Uα -phase is stable up to 667
C. Due to itsvery large anisotropic thermal expansion behavior it is not possible to use U based fuel materialscontaining this phase, as the fuel might possibly undergo massive deformation during reactoroperation. (b) The tetragonal U β-phase is stable in the temperature range 667 - 775 C. It alsoshows anisotropic thermal expansion behavior, which also disqualifies it for utilization. (c) The body-centered cubic U γ -phase is stable above 775 C and shows an isotropic thermal expansion behavior. It is thus the desired phase for U based fuel materials.
range, a larger Mo content stabilizes the γ -phase also for elevated temperatures
(see figure 6.9), while a smaller Mo content increases the U density of the U-Mo
alloy. In practice, the exact composition of a U-Mo alloy has to be adapted to
the particular requirements and applications it will be used for. If the alloyundergoes a thermal treatment during fabrication - for example if hot rolling
techniques are used - the Mo content has to be chosen adequately to allow the
γ -phase to withstand the treatment.
The phase stability and transformation behavior of a particular U-Mo alloy is
illustrated by the Time-Temperature-Transformation (TTT) diagrams (see figure
6.10). It should be noted, that the TTT diagrams only cover thermal phase trans-
formations, not irradiation induced ones. This is of special importance, as during
in-pile irradiation α -phase U-Mo and U2Mo is known to transform into γ -phaseU-Mo regardless of temperature [jun11].
174
8/13/2019 Prediction of protein structural features by machine learning methods
Figure 6.9: Phase diagram of the U-Mo system. Only the alloys with a Mo content of 4.5 - 15.5wt% (red zone) stabilize the U γ -phase and are thus relevant as fuel meterials.
Figure 6.10: Time-Temperature-Transformation (TTT) diagram for the alloy U-10wt%Mo, that il-lustrates the decomposition kinetics of the γ -phase (from [jun11]). The critical temperature of U-10Mo is 580C. Above this temperature the γ -phase is permanently stable, below it is onlymetastable, that means it decomposes into other phases over time. The decomposition mecha-
nisms are usually complex and involve several distorted phases (as γ ’).
175
8/13/2019 Prediction of protein structural features by machine learning methods
Figure 6.11: (a) Schematic of a typical stress-strain curve for a ductile tensile test sample. In thefirst region of elastic deformation, the stress rises proportional to the strain. This is called the’Hook area’. When the yield strength is reached, the sample is deformed inelastically. A smallrise in stress causes the strain to increase over proportional. The maximum stress value that can be applied is called the ’ultimate tensile strength’. After this value has exceeded, the samplecan be further deformed by application of an even decreasing value stress until the breakingstrength is reached and a fracture occurs. (b) Schematic of a typical stress-strain curve for a non-ductile tensile test sample. The test stays always in the region of elastic deformation. Fractureoccurs, if the point for inelastic deformation is reached. For the samples we use for our adhesionmeasurements the behavior is quite similar. Fracture can however occur even far before inelasticdeformation will start.
A4: Tensile tests
Tensile tests are usually prepared on wires, strips or machined samples of a mate-
rial to measure its tensile strength. The samples are screwed into jaws or gripped
in them, and stretched by moving the grips apart at a constant rate while measur-
ing the applied load and the grip separation. The tensile strength is the stress at
which the material breaks or deforms permanently. Three different types of ten-
sile strength are usually distinguished: yield strength, ultimate tensile strength
and breaking strength (see figure 6.11a).
The yield strength denotes the tensile strength value, at which the elastic defor-
mation behavior switches to a plastic deformation. The ultimate tensile strength
denotes the tensile strength value, at which the maximum stress value on the
stress-strain curve appears. The breaking strength is finally the tensile strength
value at the point of fracture.
A tensile test to measure the adhesion of different materials to each other is a
special case of the described general tensile test. The sample geometry has to
be adequate to actually measure the adhesion of the materials, not their particu-
lar tensile strength. Usually the materials to test have a planar interface to each
other and the tensile force is applied perpendicular to this interface. The adhesion
176
8/13/2019 Prediction of protein structural features by machine learning methods
of the different materials in such a sample is generally equal or smaller than the
breaking strength of the weakest material involved. Usually the adhesion is how-
ever even below the yield strength of the weakest material, as the beginning of
plastic deformation in one part of the sample often causes the materials to loosethe adhesion to each other. Tensile test samples to investigate the adhesion of
different materials thus show very often the tensile behavior of non-ductile ma-
terials (see figure 6.11b). The breaking strength in this case can be identified with
the strength of the material adhesion.
177
8/13/2019 Prediction of protein structural features by machine learning methods
facility in Germany, Journal of Nuclear Materials, Volumes 108-109, Pages 10-
20, Garching, 1982
[boe98] K. Boning, Richtfest - Neue Forschungsneutronenquelle Garching, Informa-tional booklet, Technische Universitat Munchen, Munich, 1998
[boe02] K. Boning, Use of highly enriched uranium at the FRM II , 6th International
Topical Meeting on Research Reactor Fuel Management, Ghent, 2002
[boe04] K. Boning, W. Petry, A. Rohrmoser, Chr. Morkel, Conversion of the FRM
II , 8th International Topical Meeting on Research Reactor Fuel Management,
Munich, 2004
[bre11] H. Breitkreutz, Neutronics and thermal hydraulics of high density cores atFRM II , Doctoral thesis, Technische Universitat Munchen, Munich, 2011
[bun94] Bunshah, Handbook of deposition technologies for films and coatings (Second
edition), ISBN 0-8155-1337-2, 1994
[cah94] R.W. Cahn, P. Haasen, E.J. Kramer, Nuclear materials part I , Materials sci-
ence and technology: a comprehensive treatment Vol. 10 A, VHC Verlagsge-
sellschaft, Weinheim, 1994
[can10] L. Canella, Optimization of the PGAA instrument at FRM II for lowbackground and 2D measurement, Doctoral thesis, Technische Universitat
Munchen, Munich, 2010
[can11] L. Canella, Wolfgang Schmid, Winfried Petry, Andreas Turler, Composi-
tion analysis of U-Mo sputtering targets and magnetron sputtered U-Mo films by
two dimensional PGAA, Paper submitted to the Journal of Nuclear Materials,
[dep08] D. Depla, S. Mahieu Reactive sputter deposition, Springer-Verlag Berlin
Heidelberg, Gent, 2008
[dir10] S. Dirndorfer, Tensile tests on monolithic two metal layer systems for researchreactor fuels, Diploma thesis, Technical University Munich, Garching, 2010
[dub06] S. Dubois, H. Palancher, F. Mazaudier, P. Martin, C. Sabathier, M. Ripert,
P. Lemoine, C. Jarousse, M. Grasse, N. Wieschalla, W. Petry, Development of
UMo/Al dispersion fuel: an oxide layer as a protective barrier around the UMo
particles, 28th International Meeting on Reduced Enrichment for Research
and Test Reactors (RERTR), Cape Town, 2006
[edi02] T.A. Edison, Process of coating phonograph records, United states patent
Nr.713863, Llewellyn Park, 1902
[fan03] Q.H. Fan, L.Q. Zhou, J.J. Gracio, A cross-corner effect in a rectangular sput-
tering magnetron, Journal of Physics D: Applied Physics 36, p. 244, 2003
[for09] Forschung mit Neutronen - Methoden entwickeln, Natur befragen, Antworten
[fre87] H. Frey, G. Kienel D ¨ unnschichttechnologie, VDI Verlag GmbH, Dusseldorf,
1987
[fue57] Various authors, Fuel elements conference, Book 1, Paris, 1957
[gla99] W. Glaser, Plans for the utilization of the new research reactor FRM II , Techni-
cal University Munich, Garching, 1999
[ham05] J.M. Hamy, P. Lemoine, F. Huet, C. Jarousse, J.L. Emin, The french U-
Mo group contribution to new LEU fuel development, 9th International Topical
Meeting on Research Reactor Fuel Management, Budapest, 2005
[han96] N.A. Hanan, S.C. Mo, R.S. Smith, J.E. Matos, An alternative LEU design forthe FRM II , 18th International Meeting on Reduced Enrichment for Research
and Test Reactors (RERTR), Seoul, 1996
[har04] G. Harbonnier, P. Colomb, JP. Durand, B. Duban, Y. Lavastre, Success story
of FRM-II fuel element manufacturing, 8th International Topical Meeting on
Research Reactor Fuel Management, Munich, 2004
[hen08] R. M. Hengstler, Thermal and electric conductivity of a monolithic uranium-
molybdenum alloy for research reactor fuels, Diploma thesis, Technical Univer-
sity Munich, Garching, 2008
181
8/13/2019 Prediction of protein structural features by machine learning methods
[ohr02] M. Ohring, Materials science of thin films: deposition and structure, Second
Edition, Academic Press, New Jersey, 2002
[pal06] H. Palancher, P. Martin, C. Sabathier, S. Dubois, C. Valot, N. Wieschalla,A. Rohrmoser, W. Petry, C. Jarousse, Heavy ion irradiation as a method to dis-
criminate research reactor fuels, 10th International Topical Meeting on Research
Reactor Fuel Management, Sofia, 2006
[par05] J.M. Park, H.J. Ryu, G.G. Lee, H.S. Kim, Y.S. Lee, C.K. Kim, Y.S. Kim, G.L.
Hofman, Phase stability and diffusion characteristics of U-Mo-X (X=Si, Al, Zr)
alloys, 27th International Meeting on Reduced Enrichment for Research and
Test Reactors (RERTR), Boston, 2005
[pas04] E.E. Pasqualini, M. Lopez, Increasing the performance of U-Mo fuels, 26thInternational Meeting on Reduced Enrichment for Research and Test Reac-
tors (RERTR), Vienna, 2004
[pas98] E. Pascual, E. Martınez, J. Esteve, A. Lousa, Boron carbide thin films de-
posited by tuned-substrate RF magnetron sputtering, Diamond and Related Ma-
terials 8 (1999), p.402-405, 1999
[pat86] K. C. Radford, Coating a nuclear fuel with a burnable poison, United States
Patent 4587088, 1986
[pat91] W.J. Bryan, N. Fuhrman, D.C. Jones, Element with burnable poison coating,
United States Patent 4990303, 1991
[pat93] W.J. Bryan, D.C. Jones, Wear resistant coating for fuel cladding, United States
Patent 5268946, 1993
[pat06] P. Boni, N. Wieschalla, Method for producing a fuel element for a nuclear re-
actor, International patent WO/2007/059851 2006
[per09] E. Perez, B. Yao, Y.H. Sohn, D.D. Keiser Jr., Interdiffusion in Diffusion Cou- ples: U-Mo vs. Al and Al-Si, 31st International Meeting on Reduced Enrich-
ment for Research and Test Reactors (RERTR), Beijing, 2009
[pri10] Private communication with Walter Carli, chief operator of the tandem
accelerator at the Maier-Leibnitz Laboratory in Garching, Garching, 2010
[que98] Y. Quere, Physics of materials, Overseas publishers association, Amster-
dam, 1998
[rai91] Y.P. Raizer, Gas discharge physics, Springer Verlag, Heidelberg, 1991
185
8/13/2019 Prediction of protein structural features by machine learning methods
[rap09] Rapport transparence et s´ ecurit´ e nucl´ eaire 2009, Reacteur Haut Flux - Institut
Laue Langevin, Grenoble, 2009
[re03] M. Del Re, R. Gouttebaron, J.-P. Dauchot, P. Leclere, G. Terwagne, M.Hecq, Study of ZrN layers deposited by reactive magnetron sputtering, Surface
and Coatings Technology 174-175, p. 240-245 2003
[rertr] Homepage of the RERTR program, www.rertr.anl.gov
[rob09] A. B. Robinson, G. S. Chang, D. D. Keiser Jr., D. M. Wachs, D. L. Porter,
Irradiation performance of U-Mo alloy based ’monolithic’ plate-type fuel - design
selection Idaho National Laboratory, Idaho Falls, 2009
[rob10] A.B. Robinson, D.M. Wachs, G.S. Chang, M.A. Lillo, Summary of ’AFIP’
full sized plate irradiations in the advanced test reactor, 14th International TopicalMeeting on Research Reactor Fuel Management, Marrakech, 2010
[roe05] A. Rohrmoser, W. Petry, N. Wieschalla, Reduced enrichment program for
the FRM-II, Status 2004/05, 9th International Topical Meeting on Research