Commons Attribution License, which permits unrestricted use, distribution, and reproduction in
any medium, provided the original work is properly cited.
Abstract
It is known that traffic congestion problems had occurred more frequently and
had become much worse nowadays, not only in big cities but also in smaller cities.
Therefore, we are required to find a tool to help us developing an analytical model
that can be used to govern a public policy regarding traffic management. In the
process of building the system there are several issues that have to be addressed.
One of those issues is mostly related with how to determine the public
transportation routes, how to determine the type of public transportation, and how
to determine the optimal amount of public transportation needed for each route. In
this research, we limit our study of public transportation system only in Bandung
City area. The problem of determining the route of public transportation system
can be solved in several ways, for example, by determining the required amount
of public transportation based on the estimation of its occupancy in each route. In
this research, we use ordinary kriging method based on spatial analysis, to predict
occupancy of the public transportation. We conducted daily observations on
weekdays and weekend, to collect the traffic data. The result of our research is a
94 Sri Suryani Prasetiyowati et al.
prediction of occupancy of public transportation for each crowd spots area. On the
weekdays Gaussian theoretical semivariogram is chosen, whereas on the weekend
is spherical. Based on the distribution pattern of the occupancy of public
transportation as represented in contour-display figure, we conclude that the
average occupancy of public transportation in Bandung City is not optimal.
Amount of public transportation mode in Bandung exceed standard of
transportation public requirement.
Keywords: public transportation, occupancy, semivariogram, kriging, spatial
1 Introduction
A decent, adequate public transportation can be measured at least by its
capacity to cope with the urban area and by its proportion to the number of
passengers. If the public transportation cannot reach certain locations in the city,
then more citizens will use their private vehicle to reach those locations. The
optimum number of public transportation must also be calculated and determined
carefully for each route. If the number is too low, the cost to maintain the public
transportation will also be lowered, but it will not be able to serve many
passengers due to its limited capacity, in other words, the ratio of mode will be
very high. On the other hand, if the number of public transportation is too high,
then the ratio of mode will be very low, which will increase the maintenance cost
of public transportation and in turn, it will cause a significant loss for the business
companies who provide the public transportation service.
It is not easy to build a decent public transportation in order to solve the traffic
congestion problem. One way is to develop an effective routing system for public
transportation. There are several issues that must be taken into our consideration:
how to determine terminal points of public transportation, how to determine the
type and capacity of public transportation, and how to estimate the distribution of
passengers in all routes.
In this research, we propose a public transportation routing system based on the
following inputs: terminal nodes of public transportation, road capacity,
geographic data of distribution of city population, and geographic data of crowd
spots area (supermarket, schools, offices, hospital, mall buildings, etc.). The
output of this system is a number of suggested routes and the optimum number of
public transportation for each route. The best route and the optimum number of
public transportation are measured by the level of its scope (reach capacity) over
the whole city area, the total of cost which is calculated from the minimum
eligibility standards for the ratio of mode, and the average cost for a passenger to
travel from one location to other location.
Our main contribution is to suggest a method to manage public transportation
system more efficiently, with which we can reduce not only the traffic congestion
itself, but we can also diminish other problems such as air pollution, cost
transportation, and the public-policy making in transportation.
Prediction of public transportation occupation… 95
2 Literature Review
There are several studies on the prediction system for transportation in
Indonesia, mostly conducted by researchers from civil engineering area. In a
research on the prediction of the number of passengers in flight routes, [8] used
linear regression analysis to analyze several factors in their consideration. [10]
used trend analysis model to predict the growth pattern of the passengers and
baggage. Trend analysis can be done using one of these methods: linear regression,
exponential regression, and polynomial regression. Other researchers also
generally include a regression model in their works.
Based on those previous studies, the prediction of the number of passengers
and their mobility using public transportation system is still conducted using
regression model without considering the characteristic of spatial data. On the
other hand, the number of passengers in some locations depend on the
characteristic of its location, including the location of settlement, office buildings
area, industrial area, schools and colleges area, etc., which will have a significant
impact on the distribution of number of passengers and their mobility. The points
or nodes in which we observe the mobility of passengers in public transportation
must be considered as data spatial. Furthermore, the distribution of number of
passengers and their mobility can be predicted using kriging method with the use
of semivariogram models that are common in geostatistical analysis.
In other countries, the use of spatial model to solve such problems in
transportation had been done quite intensively. However, the information from
spatial data has not yet been utilized to make a prediction on the number of
passengers. Chatterjee and Venigalla used spatial data of trips to design urban
transportation planning. [3, 7] conducted a research to examine the influence or
impact of a spatial information on people’s decision regarding transportation
planning and modeling. In their research on spatial modeling in transportation, [1]
proposed Full Spatial Model in a competition between railway transportation
(train) versus water transportation (ship). This model considered following factors:
the location of the passenger of the ships, the geography of the transportation
network, and the type of options available for travelers.
3. Methodology
Research methodology can be seen as the techniques used to collected and
analyze data. In this research, we used the data of occupancy of passengers in
public transportation in each route, which we observed at several crowd spots area
on the weekdays and weekend. We limited our observation to 10 routes of public
transportation in Bandung. The data is analyzed and processed using spatial
analysis software: ArcMap and Google Earth Pro (to obtain Bandung city map).
Below is the process of estimating the weighted route:
96 Sri Suryani Prasetiyowati et al.
Figure 1: Design of spatial analysis system for estimation weighted route and
occupancy
3.1 Preparation of Maps Layer
The layer setting must be performed so that the map resulted from estimation
process is well-conformed with the original city map. The steps are as follow:
- Data setting (in meters) and data adjustment in Bandung city map.
- Opening file of Bandung city map (with extension shp)
- Opening data occupancy of public transportation which has been adjusted
with its coordinate latitude and longitude in Bandung city map
3.2 Spatial Analysis Estimation Weighted Route and Occupancy
Crowd area spots are spatial data that can be defined as data containing
information about location [5]. This spatial data will be the input for the
prediction public transportation occupancy in Bandung City. Given si, for i = 1, …,
n, a location with coordinate (xi,yi). Thus, isZ measures the level of occupancy
Z in a location si. Spatial data is considered to be a dependent data model, because
the spatial data is retrieved from different spatial locations which indicate a
dependency of Z on its location.
Semivariogram Experimental
Semivariogram experimental can be defined as a half fraction of the average
value of the sum square of the variance between two or more points with distance
vector of h unit [11]. The value of semivariogram experimental can be derived
using formula:
Prediction of public transportation occupation… 97
Where )(* h is semivariogram experimental, h is distance between two
points, s is location of the sample, Z(si ) is a measured value of data in location
si., N(h) is a number of pairs (si , si + h ) which has distance of h. The plotting of
semivariogram γ*(h) over distance h gives a semivariogram experimental plotting.
The chart of semivariogram experimental can be used as a basis to find theoretical
semivariogram model which will be needed in estimating phase.
Theoretical Semivariogram Model
To make a prediction or estimation, a theoretical semivariogram model is
required. The pattern of the graphical plot of semivariogram experimental
retrieved from data is usually non-uniform (non-regular), making it hard to be
interpreted and cannot be used directly in the forecasting process. Thus we need to
analyse the semivariogram experimental chart and develop a theoretical
semivariogram model from it.
Here we describe several models which will be used in the fitting model of the
theoretical semivariogram [2]:
a. Spherical Model
The general form of spherical model is: (2)
b. Exponential Model
The general form of exponential model is:
c. Gaussian Model
The general form of Gaussian model is:
where a is range, γ(h) is theoretical semivariogram, c is sill, h is distance
between two points.
3.3 Ordinary Kriging Method
We will estimate s0 using a number of n sample of the value of the neighboring
sa and linearly combine it with a weight = [2].
)(
1
2*
)(2
1)(
hN
i
ii sZhsZhN
h (1)
ahforc
ahfora
h
a
hc
h
,
)2(,2
1
2
3
)(
3
)3(exp1)(
a
hch
(3)
)4(exp1)(2
2
a
hch
98 Sri Suryani Prasetiyowati et al.
)5(ˆ
1
n
OKo sZsZ
Where osZ is estimated value in 0s , OK is weighted value of data (from
the Ordinary Kriging system), sZ is the value contained in minerals at the
sample point, n is the number of sample used in the estimation process.
The variance of this estimation is:
)6(0
1
2
n
OKOKOK
where 2OK is variance of estimation, OK is lagrange parameter (from
Ordinary Kriging system), 0 is theoretical semivariogram of the estimated
point of sample α (from Ordinary Kriging system).
Ordinary Kriging is an exact interpolator in which if we have to be identical
with the data location, then the estimation value will be also identical with the
data value on that point.
)7(0*
sZsZ
if s0 = sα
3.5 Validation Model
The prediction result is validated and verified using Root Mean Square Error
(RMSE) analysis [9]. To validate the theoritical semivariogram model, we obtain
the value of RMSE by calculating the mean square-root of the difference between
theoretical semivariogram value and experimental semivariogram value. To
validate the prediction of weight and occupancy, we used the variance of kriging
method.
3.6 Interpolation of the Contour Map
The prediction result of occupancy of public transportation in crowd spots area
(whether it is observed or not), is interpolated to a contour map with weights
obtained from prediction result. We use different setting color for different
interval of occupancy level, from low to high.
3.7 Mapping the Weight Prediction on Map The contour map produced by ordinary kriging method can be displayed in the
layer, by making some necessary settings of its location, display, and extent, so
that the contour map will be well-matched with the city map (shp). After the
contour map is matched with the city map, the next step is to open the file of
Bandung city map which already has streets’ name and marks of crowd spots
produced using Google Earth Pro.
Prediction of public transportation occupation… 99
4. Results and Discussion
The data of this research is data of public transportation occupancy in Bandung
City. The data sample is retrieved from several crowd spots area. The observation
is carried out on weekdays and weekend, in 10 routes and means are 10 crowd
spots area of each route.
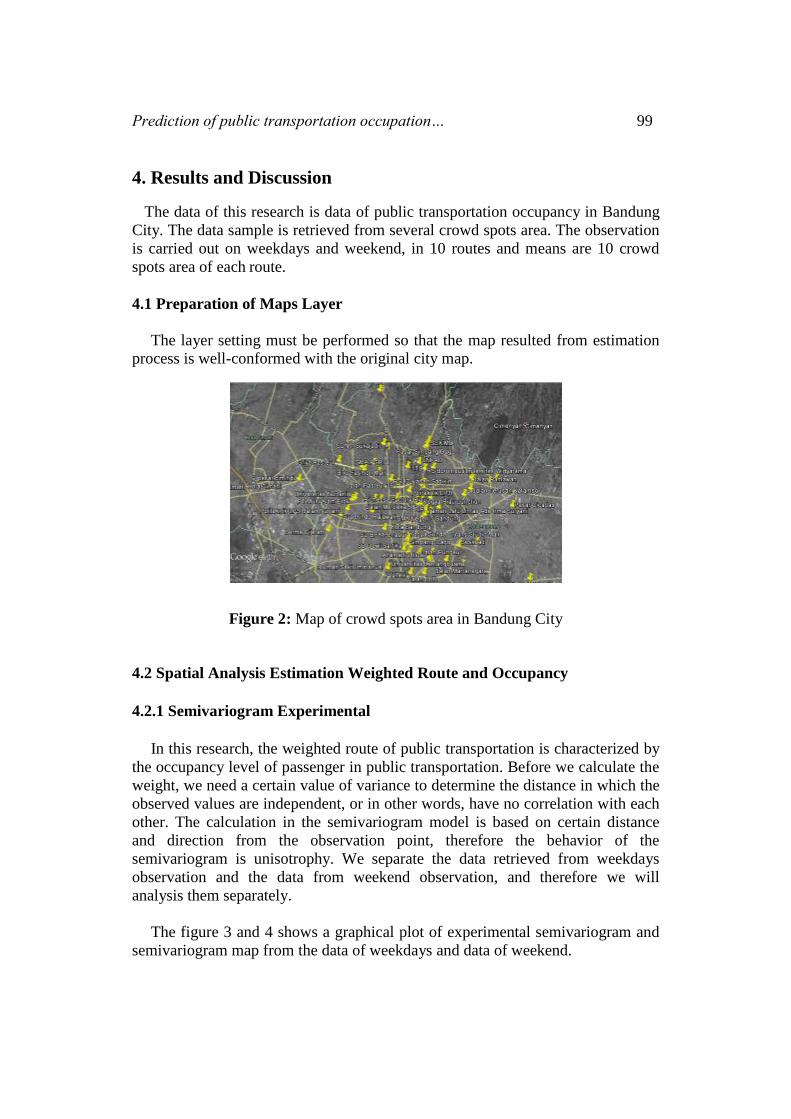
4.1 Preparation of Maps Layer
The layer setting must be performed so that the map resulted from estimation
process is well-conformed with the original city map.
Figure 2: Map of crowd spots area in Bandung City
4.2 Spatial Analysis Estimation Weighted Route and Occupancy
4.2.1 Semivariogram Experimental
In this research, the weighted route of public transportation is characterized by
the occupancy level of passenger in public transportation. Before we calculate the
weight, we need a certain value of variance to determine the distance in which the
observed values are independent, or in other words, have no correlation with each
other. The calculation in the semivariogram model is based on certain distance
and direction from the observation point, therefore the behavior of the
semivariogram is unisotrophy. We separate the data retrieved from weekdays
observation and the data from weekend observation, and therefore we will
analysis them separately.
The figure 3 and 4 shows a graphical plot of experimental semivariogram and
semivariogram map from the data of weekdays and data of weekend.
100 Sri Suryani Prasetiyowati et al.
Figure 3: Semivariogram experimental map of weekdays data
Figure 4: Semivariogram experimental map of weekend data
From the figure 3 and 4, we see that the data on weekdays and weekend is
unisotrophy, and its behavior tend towards North east – Sourth west.
4.2.2 Theoretical Semivariogram Model
The table below shows the result of our cross-validation of the selected
theoretical semivariogram model, which will be used in the prediction of weighted
route and occupancy of passenger in public transportation using ordinary kriging
method.
Prediction of public transportation occupation… 101
Table 1: Parameters of theoretical semivariogram models
Weekend Nugget Major
Range
Minor
Range
Partial
Sill Nlag RMSE
Circular 0,830 7126,84 3812,82 1,348 12 1,179
Spherical 0,798 7126,84 4000,76 1,328 12 1,175
Exponential 0,719 7126,84 3767,23 1,319 12 1,189
Gaussian 0,983 7126,84 3526,06 1,209 12 1,176
Weekdays Nugget Major
Range
Minor
Range
Partial
Sill Nlag RMSE
Circular 0,881 3577,03 1487,26 0,750 12 1,023
Spherical 0,846 3577,03 1558,33 0,774 12 1,023
Exponential 0,703 3577,03 1487,26 0,921 12 1,028
Gaussian 0,939 3577,03 1199,86 0,687 12 1,020
The best theoretical semivariogram for weekdays observation is Gaussian
model with value of RMSE is 1,02, while the best theoretical semivariogram for
weekend is Spherical model, with value of RMSE is 1,175, as shown in the table
1.
4.2.3 Occupancy Prediction Result Using Ordinary Kriging Method
The best semivariogram model from both data (weekdays and weekend) will
be used as an input for the prediction process using Ordinary Kriging method. We
use Ordinary Kriging method because the data of public transportation occupancy
is stationary, and the mean value can be obtained. Due to the data being
anisotrophy, when we input the range value in Kriging process, we must consider
the location of crowd spots area which will become a supporting data to calculate
the prediction process for other points. Those supporting data is chosen with the
use of ellipse of the semivariogram in the figure above, in which we put the point
in the prediction process to be its central point. Table 2 shows our occupancy
prediction result in weekday and weekend in some locations.
Table 2: Occupation Prediction in weekdays and Weekend
X Y OCCUPANCY WEEKDAYS
X Y OCCUPANCY
WEEKEND
788225.1 9236447 4.20 788225.1 9236447 4.31
791096.0 9236212 2.84 793142.5 9235388 3.60
785340.1 9235814 4.68 784558.4 9235047 5.44
790456.4 9233554 3.20 782540.3 9236681 2.99
784629.5 9235047 5.25 784501.6 9237576 4.19
793156.7 9235402 3.18 790470.6 9233597 1.94
787813 9235757 5.04 789248.4 9237179 3.80
784217.3 9234805 5.31 792360.8 9236667 2.92
787898.2 9233938 2.28 790271.7 9234876 2.01
102 Sri Suryani Prasetiyowati et al.
4.3 Distribution Pattern of Occupancy in Bandung City
Distribution pattern of the prediction of weighted route is displayed in three
colored maps below, which depict the interval of weight within the crowd spots
area. Color gradation begin with dark blue for lowest value of occupancy,
followed by light blue, yellow, orange, brown, and dark red for highest value of
occupancy. Our prediction result of weighted route on weekdays and weekend are
shown in the figures 5 and 6
Figure5: Mapping distribution pattern of public transportation occupation in
Bandung city at weekdays
Figure6: Mapping distribution pattern of public transportation occupation in
Bandung city at weekend
In the figure of contour map on weekdays, the eastern and southern areas of
Bandung City are mostly colored in dark blue to light brown, thus we can
conclude its average occupancy is less than 3,29. On the other hand, the western,
middle, and northern areas of Bandung are mostly colored in dark brown to dark
red, thus we conclude its average occupancy of public transportation is more than 3,8. On the weekend, the eastern, northern, and western areas of Bandung are mostly
Prediction of public transportation occupation… 103
colored in dark blue to yellow which means the average occupancy is less than 3;
whereas in the middle and southern areas are mostly colored in light red to dark
red which means the average occupancy is more than 4. So, of the results of the
above analysis it can be said that the occupancy of public transportation for all
routes in the city of Bandung is not maximized. This is supported by a small
weight value of each route, caused by the weight of each the crowd spots area
require the support of many neighbors that are likely located far apart. So that the
support from locations around the crowd spots area is not too could support the
increase in occupancy value of each route.
5. Conclusion
The prediction of weighted route can be depicted by the prediction of
occupancy of public transportation per each crowd spots area. Our result of the
spatial analysis prediction of weighted route of public transportation in Bandung
City for the weekdays is a chosen Gaussian theoretical semivariogram, and for the
weekend is a chosen spherical theoretical semivariogram; both are using Ordinary
Kriging method. Based on distribution pattern of occupancy of public
transportation displayed in the contour maps, it can be concluded that the mid-part
of Bandung City has the highest average occupancy of public transportation,
which is more than 4; whereas the average occupancy of public transportation in
the northern, southern, western, and eastern part of Bandung is less than 3. So, of
the results of the above analysis it can be said that the occupancy of public
transportation for all routes in the city of Bandung is not optimal. There are too
many transportation mode in Bandung exceed standard requirement of society in
transportation. Many motorcycles and private cars is strongly suspected to be the
cause of declining interest of people in using public transportation.
Acknowledgements. The authors would like to thank to Research Division of
Telkom University and DIKTI for supporting this research.
References
[1] Simon P. Anderson, Wesley W. Wilson, Spatial Modeling in Transportation,
Chapter in Handbook of Transportation Policy and Administration, CRC