Page 1
PREDICTION OF SWELLING BEHAVIOR OF EXPANSIVE SOILS USING
MODIFIED FREE SWELL INDEX, METHYLENE BLUE AND SWELL
OEDOMETER TESTS
A THESIS SUBMITTED TO
THE GRADUATE SCHOOL OF NATURAL AND APPLIED SCIENCES
OF
MIDDLE EAST TECHNICAL UNIVERSITY
BY
AMIR JALEH FOROUZAN
IN PARTIAL FULFILLMENT OF THE REQUIREMENTS
FOR
THE DEGREE OF MASTER OF SCIENCE
IN
CIVIL ENGINEERING
FEBRUARY 2016
Page 3
Approval of the thesis:
PREDICTION OF SWELLING BEHAVIOR OF EXPANSIVE SOILS USING
MODIFIED FREE SWELL INDEX, METHYLENE BLUE AND SWELL
OEDOMETER TESTS
Submitted by AMIR JALEH FOROUZAN in partial fulfillment of the
requirements for the degree of Master of Science in Civil Engineering
Department, Middle East Technical University by,
Prof. Dr. Gülbin Dural Ünver
Dean, Graduate School of Natural and Applied Sciences
Prof. Dr. İsmail Özgür Yaman
Head of Department, Civil Engineering
Prof. Dr. Erdal Çokça
Supervisor, Civil Engineering Dept., METU
Examining Committee Members
Asst. Prof. Dr. Nabi Kartal Toker
Civil Engineering Dept., METU
Prof. Dr. Erdal Çokça
Civil Engineering Dept., METU
Asst. Prof. Dr. Nejan Huvaj Sarıhan
Civil Engineering Dept., METU
Asst. Prof. Dr. Onur Pekcan
Civil Engineering Dept., METU
Associate Prof. Dr. Cem Akgüner
Civil Engineering Dept., TED University
Date: 02 /02/2016
Page 4
iv
I hereby declare that all information in this document has been obtained and
presented in accordance with academic rules and ethical conduct. I also declare
that, as required by these rules and conduct, I have fully cited and referenced
all material and results that are not original to this work.
Name, Last Name: AMIR JALEH FOROUZAN
Signature :
Page 5
v
ABSTRACT
PREDICTION OF SWELLING BEHAVIOR OF EXPANSIVE SOILS USING
MODIFIED FREE SWELL INDEX, METHYLENE BLUE AND SWELL
OEDOMETER TESTS
Jaleh Forouzan, Amir
M.S. Department of Civil Engineering
Supervisor : Prof. Dr. Erdal Çokca
February 2016,135 pages
Expansive soils are recognized as problematic soils that impose several challenges
for civil engineers. Such soils undergo significant volume change in case water
penetrates into them, and they shrink as they lose moisture. Lightly-loaded
engineering structures such as pavements, single story buildings, railways and
walkways may experience severe damages when they are founded on such soils.
Determination of expansive soils and quantifying their swelling potential and
pressure caused by their expansion are essential in geotechnical engineering.
Therefore it is necessary to develop models to predict swelling pressure and swelling
potential of expansive soils.
This research presents an experimental investigation of swelling behavior (swelling
pressure and swelling potential) of expansive soils. The expansive soil specimens
were prepared in the laboratory by mixing kaolinite and bentonite at different
percentages. Atterberg limits, Grain size distribution, , Optimum water content,
Maximum water content , Swelling pressure, Methylene blue value (MBV),
Page 6
vi
Modified Free swell index (MFSI) and swell potential of the mixtures were assessed.
The correlations between the swelling behavior of test samples and fundamental
properties of test samples were studied. Additionally, the correlations between
swelling behavior and MBV, MFSI and some of the index properties of test samples
were investigated. These tests were repeated on the natural expansive soil samples
and the results were evaluated.
As final conclusion of this research, the values of swell pressure and swell potential
of the test samples from the experimental investigation are compared with the
predictive values of the same based on currently proposed and other suggested
models.
Key Words: Expansive Soil, Swelling Potential, Methylene Blue Test, Modified
Free Swell Index Test, Swelling Pressure Test, Swell Percent Test
Page 7
vii
ÖZ
MODİFİYE SERBEST ŞİŞME ENDEKSİ, METİLEN MAVİSİ VE ÖDOMETRE
ŞİŞME TESTLERİNİ KULLANARAK ŞİŞEN ZEMİNİN ŞİŞME
DAVRANIŞININ TAHMINI
Jaleh Forouzan, Amir
Yüksek Lisans, İnşaat Mühendisliği Bölümü
Tez Yöneticisi: Prof. Dr. Erdal Çokca
Şubat 2016,135 sayfa
Şişen zeminler problemli zeminler olarak kabul edilip inşaat mühendisleri için çeşitli
sorunlar yaratmaktadır. Bu tür zeminler suya maruz bırakıldıklarında, önemli hacim
değişikliğe uğrayıp, kurutulduklarında büzüşürler. Geçmişteki tecrübelere göre
kaldırımlar, tek katlı binalar, demiryolları ve yürüyüş yolları gibi hafif yüklü
mühendislik yapıları böyle zeminler üzerinde kurulduğunda ciddi zararlar
görmüşlerdir. Bu yüzden şişen zeminlerin belirlenmesi, onların şişme potansiyeli ve
şişme basıncın hesaplanması, jeoteknik mühendisliğinde esastır. Şişen zeminlerin
şişme basıncı ve şişme potansiyelini tahmin etmek amacıyla model geliştirmek
gerekmektedir.
Bu araştırmada şişen zeminlerin şişme davranışı (şişme potansiyeli ve şişme basıncı)
deneysel olarak incelenmiştir. Bu çalışma kapsamında şişen zeminler hazırlanması,
laboratuvar ortamında, farklı oranlarda kaolin ve bentonit karıştırarak
gerçekleştirilmiştir. Tane boyu dağılımı, Kıvam limitleri, Gs, maksimum kuru
yoğunluk, optimum su içeriği, şişme basıncı, metilen mavisi değeri, modifiye serbest
şişme değeri ve karışımların şişme potansiyeli belirlenmiştir. Test örneklerinin şişme
Page 8
viii
davranışı ve temel özelliklerinin arasındaki ilişki incelenmiştir. Ayrıca, test
örneklerinin şişme davranışı, MBV, MFSI ve endeks özelliklerinden bazıları
arasındaki ilişkiler incelenmiştir. Bu testler, bozulmamış doğal şişen zemin örnekleri
üzerinde tekrarlanmış ve sonuçlar değerlendirilmiştir.
Bu çalışmanın sonucu olarak, test örneklerinin şişme potansiyeli ve şişme basıncı
değerleri, aynı bazda olan, yeni önerilen ve daha önce önerilmiş olan diğer
modellerin değerleri ile karşılaştırılmıştır.
Anahtar Kelimeler: Şişen zemin, Şişme potansiyeli, Metilen mavisi deneyi,
Modifiye serbest şişme indisi deneyi, şişme basıncı deneyi, şişme yüzdesi deneyi
Page 9
ix
ACKNOWLEDGMENTS
I would like to express my grateful thanks to my academic supervisor, Prof. Dr.
Erdal Çokça. His concern and educational support were invaluable throughout my
studies and in the completion of this thesis at the Middle East Technical University. I
also wish to thank Prof. Dr M. Yener Özkan for first giving me the opportunity to
study at this university.
Thanks are also to all soil mechanics laboratory staff and all people for all the help
they gave during my experiments. In particular, I would like to express my sincer
thanks to Ali Bal, Mr. Ulaş Nacar, Mr. Kamber Bilgen, for their valuable support and
friendship. Also, I am thankful to Mr. İlyas Özkan for his suggestions and friendly
approach throughout the laboratory works.
I thank to Civil Engineering Department of Middle East Technical University for
supporting me with teaching and technical facility. I would also like to give heartful
respect to Dr. Noasrat Taheri for his endless help.
I am also thankful to Farzin Golzar and Farhad Hanifepoursardroud for their
friendship, advice and continuous support and encouragement, which created such a
motivating environment for research and enjoyable life.
In addition I would like to express my gratitude to Ataollah Khanlari, Farnoud
Khakzad, Nasrin Mehmandoost and Yosef Badali for their help, toleration and
encouragements.
Also, I would like to give credit to my colleagues Behzad sedghi Saray and Ali
Zarifi at URUM SPOTA Company for their friendship and motivation. I am grateful
for their help and being my friends for almost decade.
Last but not least, I express my sincere thanks to my father Rahim Jaleh Forouzan, to
my mother Hamideh Parnia and my brother Saeid Jaleh Forouzan for their boundless
inspiration, encouragement, sacrifice and blessings. This thesis is dedicated to them
Page 10
x
without their support, love, patience and belief in me I would never have
accomplished this.
Page 11
xi
TABLE OF CONTENTS
ABSTRACT ................................................................................................................. v
ÖZ …………………………………………………………………………………..vii
ACKNOWLEDGMENTS .......................................................................................... ix
TABLE OF CONTENTS ............................................................................................ xi
LIST OF FIGURES ................................................................................................. xvii
LIST OF ABBREVIATIONS .................................................................................. xxii
CHAPTERS ................................................................................................................ 1
1. INTRODUCTION ................................................................................................... 1
1.1 Background ........................................................................................................ 1
1.2 Research Hypotheses ......................................................................................... 5
1.3 Research Scope .................................................................................................. 6
1.4 Outline of Thesis ............................................................................................... 6
2. LITERATURE REVIEW......................................................................................... 9
2.1 Introduction ........................................................................................................ 9
2.2 Clay Particle and Clay Mineralogy .................................................................. 10
2.2.1 Kaolinite Group ......................................................................................... 14
2.2.2 Illite Group ................................................................................................. 16
2.2.3 Montmorillonite Group .............................................................................. 17
2.3 Clay Structure ................................................................................................... 18
2.4 Diffuse Double Layer ....................................................................................... 19
2.5 Cation Exchange Capacity ............................................................................... 21
2.6 Mechanism of Swelling .................................................................................... 23
2.7 Factors Affecting Swelling Behavior of Soil ................................................... 24
2.7.1 Soil Properties Influencing Swell Potential ............................................... 24
2.7.1.1 Clay Mineralogy.................................................................................. 24
Page 12
xii
2.7.1.2 Soil Water Chemistry .......................................................................... 24
2.7.1.3 Plasticity .............................................................................................. 25
2.7.1.4 Soil Structure and Fabric ..................................................................... 25
2.7.1.5 Dry Density ......................................................................................... 25
2.7.2 Environmental Factors Affecting Swell Potential ..................................... 25
2.7.2.1 Initial Moisture Content ...................................................................... 25
2.7.2.2 Moisture Variations ............................................................................. 26
2.7.2.2.1 Active Zone Depth........................................................................ 26
2.7.2.3 Climate ................................................................................................ 29
2.7.2.4 Groundwater ........................................................................................ 29
2.7.2.5 Drainage .............................................................................................. 30
2.7.2.6 Vegetation ........................................................................................... 30
2.7.2.7 Permeability ........................................................................................ 30
2.7.2.8 Temperature ........................................................................................ 30
2.7.3 Stress Conditions Affecting Swell Potential .............................................. 30
2.7.3.1 Stress History ...................................................................................... 31
2.7.3.1.1 Cyclic Swelling Shrinkage Behavior ............................................ 31
2.7.3.2 In-situ Conditions ................................................................................ 32
2.7.3.3 Loading ................................................................................................ 32
2.7.3.4 Soil Profile ........................................................................................... 32
2.7.3.5 Soil Suction ......................................................................................... 33
2.8 Common Soil Swelling Determinative Tests ................................................... 33
2.8.1 Free Swell Test .......................................................................................... 36
2.8.2 Free Swell Index Tests ............................................................................... 37
2.8.3 MBV Test ................................................................................................... 39
2.8.4 Swelling Pressure Test ............................................................................... 41
2.10 Empirical Correlation ..................................................................................... 47
3. EXPERIMENTAL STUDY ................................................................................... 49
3.1 Purpose ............................................................................................................. 49
Page 13
xiii
3.2 Material Selection ............................................................................................. 50
3.3 Properties of Soil .............................................................................................. 52
3.3.1 Soil Index Properties Test .......................................................................... 53
3.3.1.1 Grain Size Distribution ....................................................................... 53
3.3.1.2 Consistency Limits .............................................................................. 55
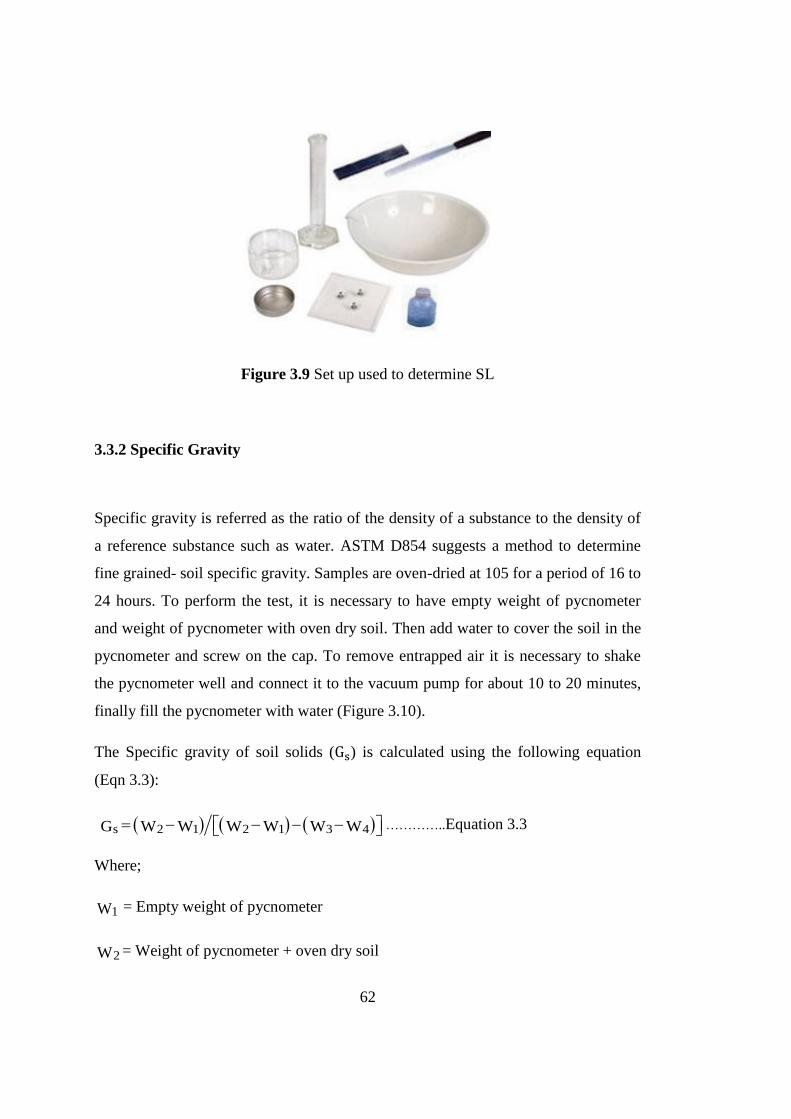
3.3.2 Specific Gravity ......................................................................................... 62
3.3.3 Harvard Miniature Compaction ................................................................. 63
3.4 Free Swell Test, Experimental Procedure and Modified Experimental
Equipment .............................................................................................................. 67
3.4.1 Modified Experimental Equipment ........................................................... 67
3.4.2 Experimental Procedure ............................................................................. 70
3.4.3 Friction of Molds ....................................................................................... 73
3.5 Free Swell Index Test, Experimental Procedures and Equipment ................... 74
3.6 Methylene Blue (MB) Test, Experimental Procedures and Equipment ........... 77
3.7 Swelling Pressure Test, Experimental Procedure and Equipment ................... 79
3.8 Test Results ...................................................................................................... 81
4. ANALYSIS OF RESULTS AND DISCUSSION ................................................. 89
4.1 Introduction ...................................................................................................... 89
4.2 Analysis and Discussion of the Fundamental Properties of the Test samples . 90
4.3 Analysis and Discussion of the Free Swelling Test Results ............................ 94
4.3.1 Validation of the Swell Potential (Sp) Models ......................................... 102
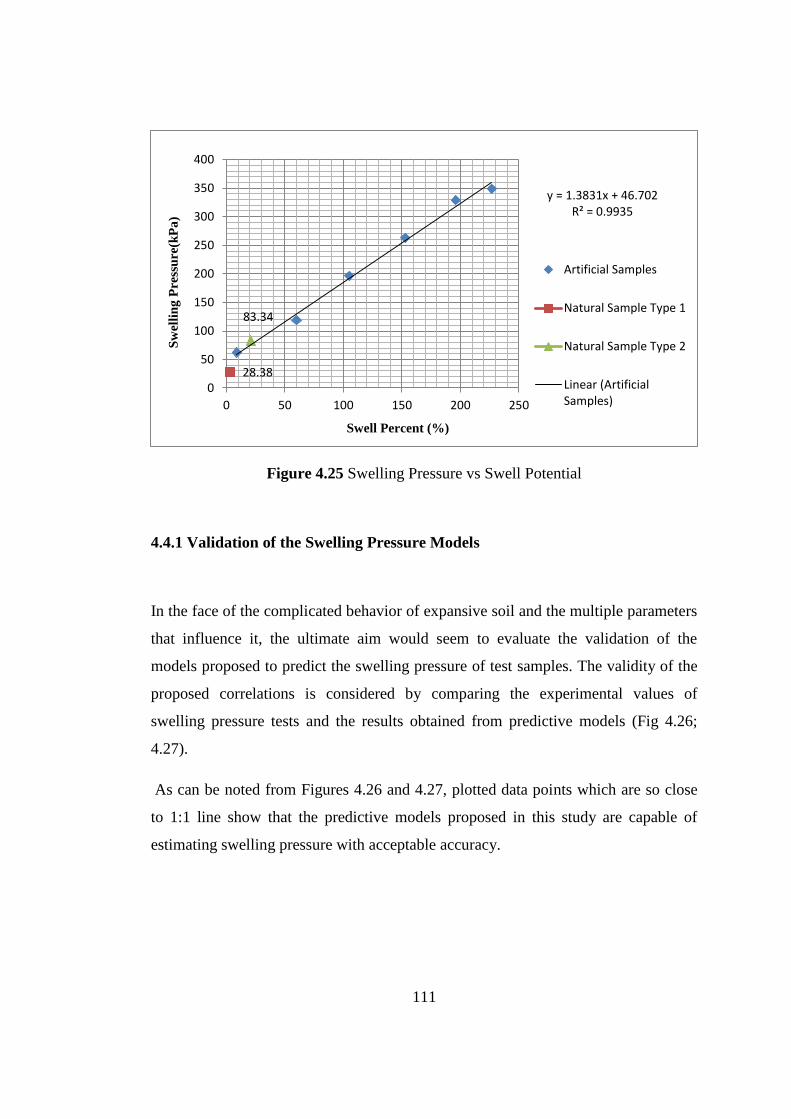
4.4 Analysis and Discussion of the Swelling Pressure (P) Test Results .............. 105
4.4.1 Validation of the Swelling Pressure Models............................................ 111
5. CONCLUSIONS AND RECOMMENDATIONS .............................................. 115
5.1 Summary of Research and Contribution ........................................................ 115
5.2 Conclusions .................................................................................................... 116
5.3 Recommendations for Future Study ............................................................... 117
REFERENCES ......................................................................................................... 119
Page 14
xiv
APPENDICES
A . ANKARA POTABLE WATER AND ANKARA CLAY PROPERTIES.……127
B. EXPERMENTAL TEST RESULTS .................................................................. 131
Page 15
xv
LIST OF TABLES
TABLES
Table 2.1 Characteristics of some clay minerals (Nelson and Milner, 1992) ........... 13
Table 2.2 Cation exchange capacity with respect to clay minerals (Lambe and
Whitman, 1968).......................................................................................................... 22
Table 2.3 Typical active –zones depth in some U.S. cities (O’Neil and Poormoayed,
1980) .......................................................................................................................... 28
Table 2.4 Proposed expansive soil classification based on plasticity index properties
(Neil and Poormaayed, 1980) .................................................................................... 34
Table 2.5 Proposed expansive soil classification based on liquid limit (Chen,
1975).... .................................................................................................................... ..34
Table 2.6 Proposed expansive soil classification based on plasticity index (Chen,
1975; Holtz and Gibbs, 1956 ; IS 1498) .................................................................... 35
Table 2.7 Proposed expansive soil classification based on other measures (Holtz and
Gibbs, 1956; Seed H. B. and Woodward R.J, 1962) .................................................. 35
Table 2.8 Proposed expansive soil classification based on oedometer percent
expansion (A.Sridharan and K.Prakash, 2000) .......................................................... 37
Table 2.9 Typical values of the expansion index and potential parameter (ASTM D,
4829-11) ..................................................................................................................... 37
Table 2.10 Expansive soil classification based on MFSI (Sridharan et al, 1986) ..... 39
Table 2.11 Empirical correlations for predicting the swelling behavior of expansive
soils by various researchers. ....................................................................................... 48
Table 3.1 Test soil samples and their symbols .......................................................... 52
Table 3.2 Test samples expansivity classification based on swell potential according
to criteria proposed by Holtz and Gibbs .................................................................... 87
Table 3.3 Correlation Matrix A ................................................................................. 88
Page 16
xvi
Table 3.4 Correlation Matrix B ................................................................................. 88
Table 4.1 Empirical correlations for predicting the swelling potential by various
researchers. ................................................................................................................. 95
Table 4.2 Intercepts, coefficients and regression statistics of correlation equations . 96
Table 4.3 Intercepts, coefficients and regression statistics of correlation
equations…………………………………………………………………………..107
Table A.1 Ankara potable tap water chemical characteristics ................................. 127
Table A.2 Summary of semi-quantitative whole-soil mineralogy of the samples from
Ankara clay with carbonate concretions based on XRD .......................................... 128
Table A.3 Intercepts, coefficients and regression statistics of correlation equation 128
Page 17
xvii
LIST OF FIGURES
FIGURES
Figure 1.1 Extent of clay mineral deposits in United States (Olive, 1989)................. 2
Figure 1.2 Damage on a masonry wall due to the shrinkage in Soil ........................... 3
Figure 1.3 A view of road undergoing swelling.......................................................... 4
Figure 2.1 Particle size range in soil ......................................................................... 11
Figure 2.2 Basic structural units in the Silica sheet (Murthy, 2002) ......................... 12
Figure 2.3 Basic structural units in the Octahedral sheet (Murthy, 2002) ................ 13
Figure 2.4 Structure of Kaolinite layer (Murthy, 2002) ............................................ 15
Figure 2.5 SEM of Kaolinite (Source: www.claymin.geoscienceworld.org) ........... 15
Figure 2.6.a Structure of Illite layer (Murthy, 2002) ................................................ 16
Figure 2.6.b SEM of Illite (www.ssokinc.com) ........................................................ 17
Figure 2.7 Structure of Montmorillonite layer (Murthy, 2002) ................................ 18
Figure 2.8 (a) Flocculated structure (b) Dispersed structure (Lambe and Withman,
1969) .......................................................................................................................... 19
Figure 2.9 Distribution of cations and anions adjacent to a clay particle surface
according to the diffuse double layer theory (Keijzer, 2000). ................................... 20
Figure 2.10 Different types of exchange sites on clay particles, Surface and absorbed
ion interlayer sites ...................................................................................................... 22
Figure 2.11 Mechanism of swelling (Popescu, 1986) ............................................... 23
Figure 2.12 Definition of active zone (Kraynski, 1967) ........................................... 27
Figure 2.13 Interconnected shrinkage cracks extend from the ground surface into the
active zone (Petry, 2000)............................................................................................ 28
Figure 2.14 Approximate determination of active zone depth (Das, 1999; Güngör,
2002) .......................................................................................................................... 29
Page 18
xviii
Figure2.15 Time-swell curve (ASTM D (2013). Standard test method for expansion
index of soils. Annual Book of ASTM Standards, PA 4546) .................................... 44
Figure 3.1.a Views of bentonite and kaolinite used in this study ............................. 51
Figure 3.1.b Views of natural samples used in this study ......................................... 52
Figure 3.2a Determination of grain size distribution via Hydrometer test ............... 54
Figure 3.2b Determination of size distribution of test samples ................................ 54
Figure 3.3 Fine-grained Soils States Boundaries According to water content and
Atterberg Limits ......................................................................................................... 56
Figure 3.4 Casagrande liquid limit test ..................................................................... 57
Figure 3.5 Casagrande liquid limit test results .......................................................... 58
Figure 3.6.a A view of fall cone apparatus ............................................................... 58
Figure 3.6.b A view of fall cone test ......................................................................... 59
Figure 3.7 Soil crumbles through plastic limit .......................................................... 60
Figure 3.8 Fall cone masses and cones used to determine LL and PL ...................... 60
Figure 3.9 Set up used to determine SL .................................................................... 62
Figure 3.10 A view from soil specific gravity test .................................................... 63
Figure 3.11 Maximum dry unit weight and optimum water content determination
through proctor test .................................................................................................... 65
Fig 3.12 Characteristics of standard and modified proctor tests apparatuses ............ 65
Figure 3.13 Harvard miniature compaction apparatus .............................................. 66
Figure 3.14 Simple oedometer setup ......................................................................... 67
Figure 3.15 The base with ring-shaped porous disk .................................................. 68
Figure 3.16 The rigid mold used through the study .................................................. 69
Figure 3.17 A view of axial load applying device with attached porous stone and
extra weights .............................................................................................................. 69
Figure 3.18 Porous disks used through the study ...................................................... 70
Page 19
xix
Figure 3.19 Hydraulic jack used to compact samples for free swell test and prepared
test sample .................................................................................................................. 72
Figure 3.20 Spacers used to compact samples .......................................................... 72
Figure 3.21 A view of free swelling test ................................................................... 73
Figure 3.22 A view of test samples after swell completion ...................................... 73
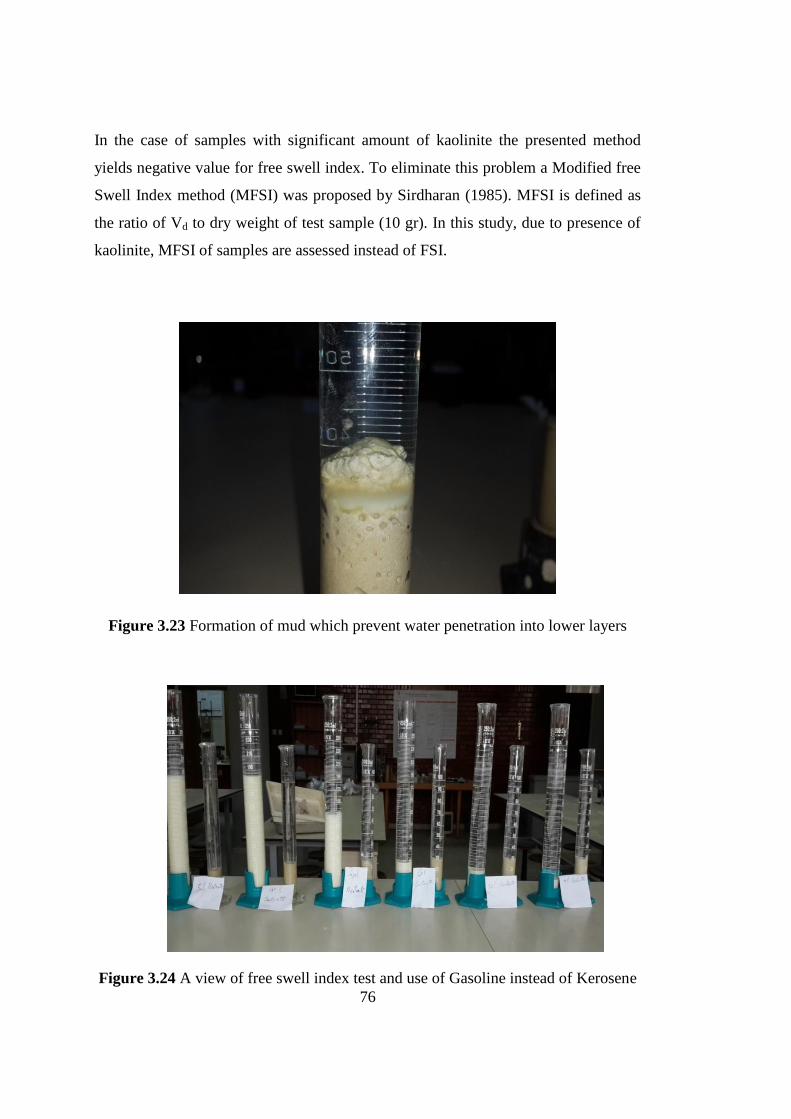
Figure 3.23 Formation of mud which prevent water penetration into lower layers .. 76
Figure 3.24 A view of free swell index test and use of Gasoline instead of
Kerosene… ................................................................................................................. 76
Figure 3.25 Methylene blue test setup ...................................................................... 78
Figure 3.26 Methylene blue stain test flow diagram (Türköz and Tosun, 2011) ...... 78
Figure 3.27 A view of conventional consolidometer setup ....................................... 80
Figure 3.28 A View of Static Compaction with the Hydraulic Jack ......................... 80
Figure 3.29 Clay Content vs Bentonite Content ....................................................... 81
Figure 3.30 Liquid limit vs Sample types ................................................................. 82
Figure 3.31 Plastic limit vs Sample types ................................................................. 82
Figure 3.32 Shrinkage limit vs Sample types ............................................................ 83
Figure 3.33 Plasticity index vs Sample types ............................................................ 83
Figure 3.34 Maximum dry density vs Sample types ................................................. 84
Figure 3.35 Optimum water content vs Sample types .............................................. 84
Figure 3.36 Specific gravity vs Sample types ........................................................... 85
Figure 3.37 Swell Potential vs Sample types ............................................................ 85
Figure 3.38 MFSI vs Sample types ........................................................................... 86
Figure 3.39 M.B.V Sample types .............................................................................. 86
Figure 3.40 Swelling pressure vs Sample types ........................................................ 87
Figure 4.1 Clay Content vs Bentonite Content ......................................................... 91
Page 20
xx
Figure 4.2 Liquid Limit vs Test Samples .................................................................. 91
Figure 4.3 Plasticity Index vs Test Samples .............................................................. 92
Figure 4.4 Activity vs Test Samples ......................................................................... 92
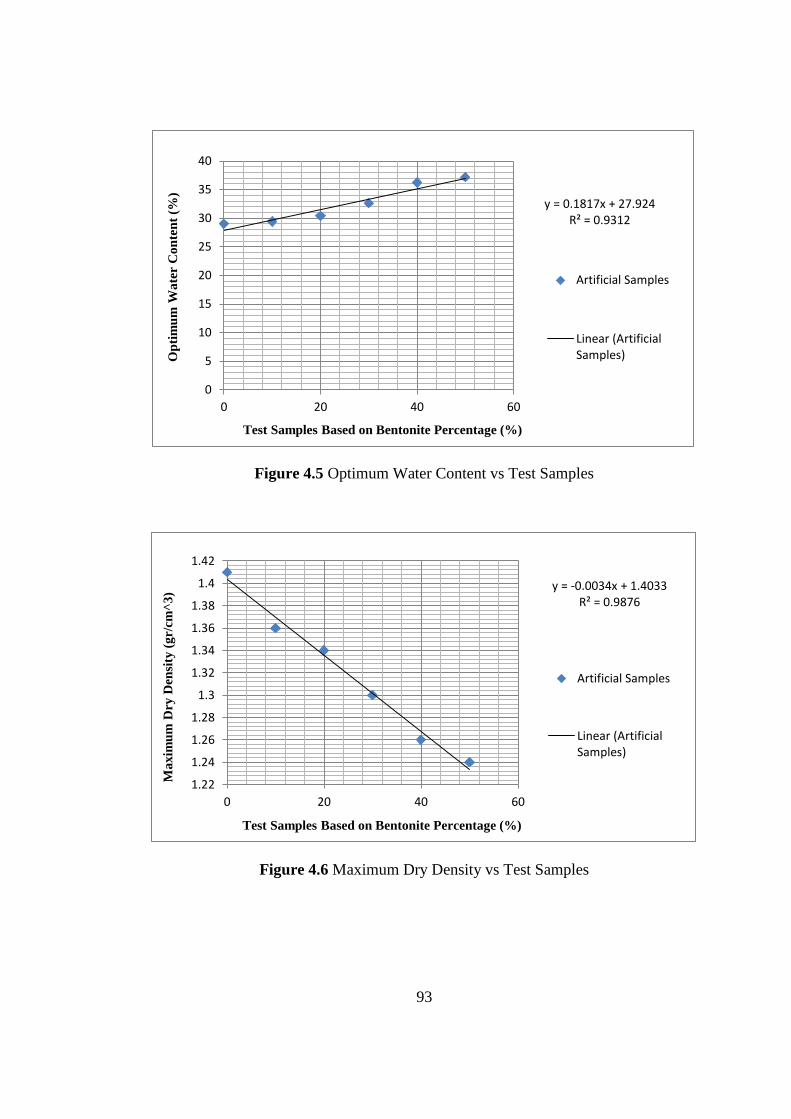
Figure 4.5 Optimum Water Content vs Test Samples ............................................... 93
Figure 4.6 Maximum Dry Density vs Test Samples ................................................. 93
Figure 4.7 Optimum Water Content vs Maximum Dry Density ............................... 94
Figure 4.8 Swell Potential vs Bentonite Content ...................................................... 98
Figure 4.9 Swell Potential vs Activity ....................................................................... 98
Figure 4.10 Swell Potential vs Maximum Dry Density ............................................ 99
Figure 4.11 Swell Potential vs Initial Water Content ................................................ 99
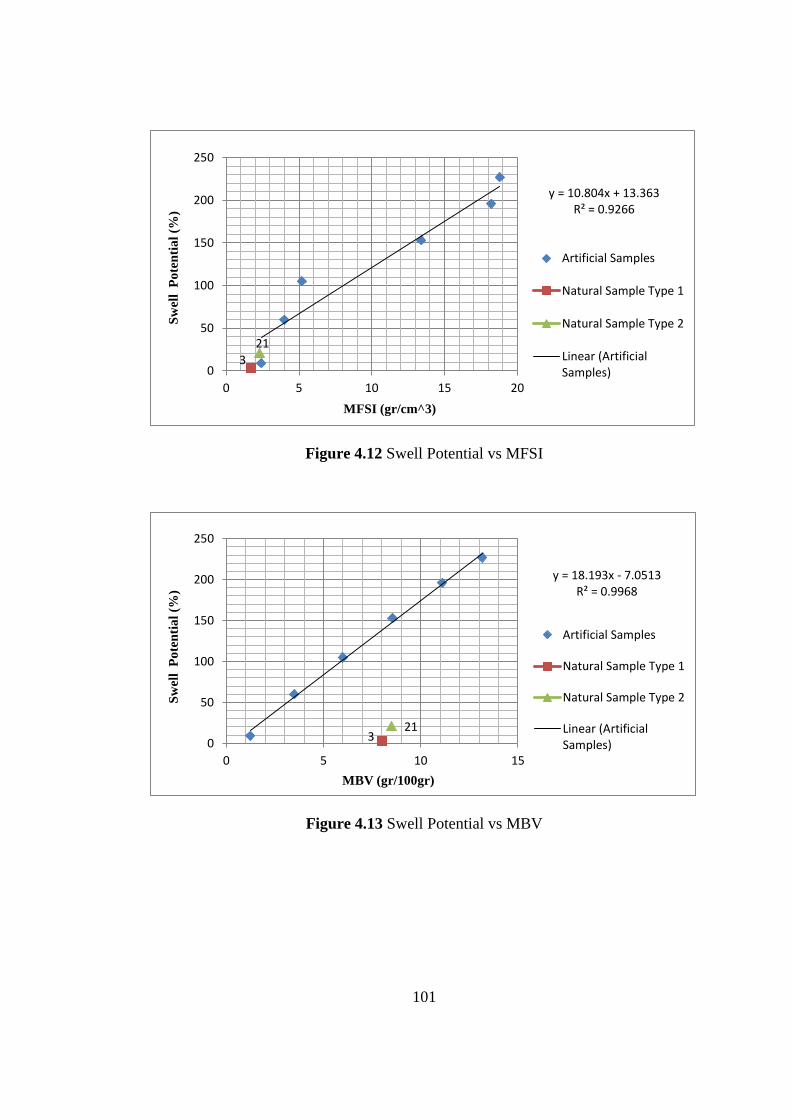
Figure 4.12 Swell Potential vs MFSI ...................................................................... 101
Figure 4.13 Swell Potential vs MBV....................................................................... 101
Figure 4.14 Swell Potential vs Swelling Pressure ................................................... 102
Figure 4.15 Comparison between experimental and predicted values of swell
potential from model 1 ............................................................................................. 103
Figure 4.16 Comparison between experimental and predicted values of swell
potential from model 2 ............................................................................................. 103
Figure 4.17 Comparisons of experimental and predicted values of swell potential
from various models ................................................................................................. 104
Figure 4.18 Comparisons of experimental and predicted values of swell potential
from both currently proposed models ...................................................................... 105
Figure 4.19 Swelling Pressure vs Bentonite Content .............................................. 108
Figure 4.20 Swell Pressure vs Activity ................................................................... 108
Figure 4.21 Swelling Pressure vs Maximum Dry Density ...................................... 109
Figure 4.22 Swelling Pressure vs Initial Water Content ......................................... 109
Figure 4.23 Swelling Pressure vs MFSI .................................................................. 110
Page 21
xxi
Figure 4.24 Swelling Pressure VS MBV ................................................................ 110
Figure 4.25 Swelling Pressure vs Swell Potential ................................................... 111
Figure 4.26 Comparison between experimental and predicted values of swelling
pressure from model 3 .............................................................................................. 112
Figure 4.27 Comparison between experimental and predicted values of swelling
pressure from model 4 .............................................................................................. 112
Figure 4.28 Comparisons of experimental and predicted values of swelling pressure
from various models ................................................................................................. 113
Figure 4.29 Comparisons of experimental and predicted values of swelling pressure
from both proposed models ...................................................................................... 114
Figure A.1 Comparison between experimental and predicted values of swelling
pressure from model A.1 .......................................................................................... 129
Figure A.2 Comparison between experimental and predicted values of swell
potential from model A.2 ......................................................................................... 129
Figure B.1 S.S.A vs Test Samples .......................................................................... 131
Figure B.2 S.S.A vs Swell Potential ....................................................................... 132
Figure B.3 S.S.A vs Swelling Pressure ................................................................... 132
Figure B.4 S.S.A vs Activity ................................................................................... 133
Figure B.5 C.E.C vs Test Samples .......................................................................... 133
Figure B.6 C.E.C vs Swell Potential ....................................................................... 134
Figure B.7 C.E.C vs Swelling Pressure ................................................................... 134
Figure B.8 C.E.C vs Activity .................................................................................. 135
Page 22
xxii
LIST OF ABBREVIATIONS
ASTM: American Society for Testing and Materials
ANFOR: Association French Normalization Organization Regulation
Ac: Activity
Cc: Clay Content
CST: Constant Swell Test
CEC: Cation exchange capacity
CVT: Constant Volume Test
DDL: Diffuse double layer
DOT: Double Oedometer Test
DGR: Deep Geological Repository
FS: Free Swell
FSI: Free Swell Index
FSM: Free Swell Method
FST: Free Swell Test
Gs: Specific Gravity
Hi = Initial height of the sample
Hf = Final height of the sample
LBT: Load-Back Test
LI: Liquidity Index
LL: Liquid limit
M0: Dry Soil Mass
MBT: Methylene Blue Test
MBV: Methylene Blue Value
METU: Middle East Technical University
MFSI: Modified Free Swell Index
N: Number of Blows
P: Swelling Pressure
PI: Plasticity index
Page 23
xxiii
PL: Plastic limit
R2: R square
RST: Restrained Swell Method
S: Standard Error
Sp: Swell Potential
SEM: Scanning Electron Microscope
SI: Shrinkage Index
SL: Shrinkage Limit
SSA: Specific Surface Area
TOT: Tetrahedron-Octahedron-Tetrahedron
TS: Turkish Standard
USC: Unsaturated Swelling Clay
V: Sediment volume of 10 gr of oven dried soil passing sieve NO.40 placed a 100 ml
graduated measuring jar containing distilled water
V0: Volume of dry soil
Vk: Sediment volume of 10 gr of oven dried soil passing sieve NO.40 placed a 100 ml
graduated measuring jar containing kerosene.
USCS: Unified Soil Classification System
W1 = Empty Mass of Pycnometer
W2 = Mass of Pycnometer + Oven Dry Soil
W3 = Mass of Pycnometer + Oven Dry Soil + Water
W4 = Mass of Pycnometer + Water full
: Moisture Content of Soil
: Initial Water Content:
ZST: Zero Swell Test
∆H = ( - )
d: Maximum Dry Density
w: Density of Water
Page 25
1
CHAPTER 1
INTRODUCTION
1.1 Background
Expansive soils, known as swelling soils or reactive soils, composed predominantly
of high percentage of fine-grained clay particles. Also high plastic clays are defined
as fine-grained clays with a plasticity index greater than 35% (Holtz and Kovacs,
1981). This soil type is prone to remarkable volumetric changes due to changes in
moisture content. The main causes of volume change behavior are the increase and
decrease in soil moisture content which results in swelling and shrinkage phenomena
respectively. Other factors affecting soil volume change behavior include soil
structure, particle interactions (mineralogy), stress history and specific surface (Scott,
1963; Chen, 1975; Nelson and Miller, 1992; Pusch and Yong, 2006; Murray, 2007).
The swelling soil deposit can be found in many areas especially in semi-arid regions
located in the tropical and temperate climate zones worldwide (Chen, 1988).
Figure 1.1 indicates regions of swelling clays in the USA. The region shown with red
color demonstrates the areas with high amount of expansive clays with high
expansion potential and the region shown with blue color displays the areas of less
than 50% expansive clays but have high swelling potential. The areas with deposits
of less than 50% swelling clays and with temperate swelling potential are specified
with orange color (There are different criteria such as MBV, FSI and swell potential
to classify swelling soils).
Page 26
2
Figure 1.1 Extent of clay mineral deposits in United States (Olive, 1989)
Due to swelling and shrinking behavior of highly plastic clays (expansive soils)
considerable damages to physical infrastructures are reported (Jones and Holtz,
1973). Unlike natural clays with low plasticity, when swelling occurs in high plastic
clays it exerts tremendous amount of pressure often causing distress to substructures,
such as light weight structures (Fig 1.2), shallow foundations, pavements (Fig 1.3),
embankments, and dams.
The mitigation of the effects of expansive soil on engineering structures becomes
quite a challenge to the designer of substructures upon this type of soil. Therefore the
swelling and shrinking characteristics of the soil on which engineering structures are
designed must be considered. The annual damage caused by expansive soils costs
about $1 billion in the USA, ₤150 million in the United Kingdom and billions of
pounds all over the world (Das, 2009). Also it was shown by Das (2009) that much
Page 27
3
of the damage caused by swelling clays is not because of the lack of proper
engineering solutions but to the failure to recognize the presence of swelling soils
and quantifying their potential expansivity in geotechnical site investigation.
“In Turkey, presence of swelling soils in many regions such as West Anatolia region,
some parts of the Central Anatolia region, Southeast Anatolia region and Eastern
Anatolia are reported” (Çokça, 1991). Ankara, the capital of Turkey and located in
semiarid region, is famous for its swelling clay. This clay is categorized between
soils with medium to highly plastic swelling characteristics because of its swelling
mineralogy. Annually several cases of damage to buried utilities such as water pipes,
garden walls and small buildings are reported due to the expansion caused by Ankara
clay. Characterization of the swelling behavior of Ankara clay is a study of
considerable importance in the southwestern regions of Ankara (Erguler and Ulusay,
2003).
Despite disadvantages of swelling soil, there is also a positive side of expansive
soil. The high sensitivity of expansive clay due to moisture content changes provides
a self-sealing ability (through swelling) and a low hydraulic conductivity which is
beneficial for clay-based sealing materials such as geosynthetic clay liners (Koerner,
1998). Also the usefulness of swelling soil is attributed as a protective barrier
material to surround nuclear fuel waste containers in the deep geological repository
(DGR) concept (AECL, 1994; Graham et al, 1997).
Figure 1.2 Damage on a masonry wall due to the shrinkage in Soil
(www.basementsystems.com, 2016)
Page 28
4
Figure 1.3 A view of road undergoing swelling
As it was stated before, determination of swelling soils and evaluation of their
swelling potential is necessary in geotechnical land use and project planning. Hence,
geotechnical engineers encounter the challenge of characterizing unsaturated
swelling clays (USC) behavior. There are field and laboratory methods to determine
swelling soil and classify their behavior such as strength, permeability, swelling
pressure, shrinkage and swelling potential. Various methods and interpretations are
utilized by geotechnical engineers to determine and classify expansive soils.
Expansive soils can be classified according to swelling degree of non-expansive to
highly-expansive soils according to their physical properties, chemical composition
and mineral content. For instance, Chen (1975) evaluated swelling behavior of soil in
terms of the probability of volume changes for expansive soil (Chen, 1975) and
Pusch and Yong (2006) mentioned soils swelling phenomena in terms of the
thickness of interlayer hydrates (Pusch and Yong, 2006). Recently two general
approaches are developed to consider studies on the swell potential of soil: the
Macro-scale and Micro-scale approaches. Traditionally, macro-scale tests include
direct and indirect swelling potential measurements. A number of common direct
approaches are used in different forms. The most common techniques used to assess
soils swelling parameters are Free Swell (FS) test, the Load-Back (LB) test and the
Constant Volume (CV) test. In general, Swelling properties of soils are measured by
Page 29
5
use of an odometer type device. Also modified triaxial experiments are performed to
assess expansive soil properties. Micro-scale tests, such as Methylene blue test,
include methods used to determine mineralogy of soil samples.
In spite of the variety of swell pressure measurement tests, one dimensional
consolidometer technique is the most applicable and practical technique for
geotechnical designers to study swelling pressure and swelling potential of highly-
plastic clays (Attom and Barakat, 2000). The Free Swell Index test, referred as Free
Swell or Differential Free Swell, is another method of estimating swelling pressure
(Holtz and Gibbs, 1956). Methylene Blue Test is another approach which is used to
detect soil properties consisting swell index, cation exchange capacity (CEC),
specific surface area (SSA) and swell potential. For example, Methylene blue test
was used by Taylor and Çokça to study the soil cation exchange capacity (Taylor,
1985; Çokça and Birand, 1993b). Also swell potential of soil by use of Methylene
blue was studied by Çokça (Çokça, 1991, 2001; Çokça and Birand, 1993a).
Preliminary site investigation can be evaluated by development of correlation
between index properties and Methylene Blue Value (MBV). On the other hand, the
indirect approaches make use of index properties and other variables of the soil in
correlations which submits expansion behavior of such soils. Generally macro-scale
methods are more common than micro-scale techniques.
Nowadays, it is clear that there is a need to explore a relation between most common
experimental methods used to investigate the soil swelling potential and soil
fundamental properties to present a correlation between them.
1.2 Research Hypotheses
The main goal of this study is to develop a correlation between the swelling
behaviors of test samples, swell potential and swelling pressure, and fundamental
properties of test samples. Also, the relations between swelling behavior and MBV,
MFSI and some of the index properties of test samples are studied.
Page 30
6
1.3 Research Scope
The overall focus of the present thesis is to develop a correlation between common
tests performed to assess the swelling behavior of expansive soil, MBT, Modified
Free Swell Index Test, Free Swelling Test, Swelling Pressure Test and some of the
index properties of swelling soils. Also the focus of this study is towards the
development of correlation between the index properties of test samples and their
swelling behavior, swell potential and swelling pressure.
Steps taken to achieve this overall objective include:
1) To investigate the index properties of samples
2) To investigate samples swelling potential and swelling pressure
experimentally by common methods such as Free Swell Test, Modified Free
Swell Index Test, Methylene Blue Test and Swelling Pressure Test
3) To investigate the correlation between index properties of test samples and
techniques used to assess swelling behavior, swell potential and swelling
pressure, of test samples
4) To investigate the correlation between methods utilized to recognize the
swelling behavior of test samples
1.4 Outline of Thesis
This dissertation is organized into 6 chapters: Introduction; Literature
Review; Experimental Methods and Materials; Test Results and Discussion;
Conclusion and Recommendations for future works and References.
Chapter 1: The requirement for the research study, the objectives, the scope of
the study and the outline of the thesis are presented in this chapter.
Chapter 2: Chapter 2 presents a literature study of the current knowledge in
expansive clays. The literature review provides a fundamental basis for the
concepts and work presented in the thesis. It reviews existing works related to
Page 31
7
this research and is concluded by outlining the uniqueness of this research
to justify the significance of this research.
Chapter 3: Proposed experimental methods and materials are provided in details
in this chapter. This chapter covers preparation of materials used in this research.
Also experimental procedures and modified techniques are explained in this
chapter. In addition, equipment used through this study and their physical
properties are presented in this part.
Chapter 4: This part includes the experimental results obtained through this study
and provides a shed of light on the correlation between index properties and
swelling behavior of test samples, swell potential and swelling pressure. Also the
correlations between results of the swell determination tests are discussed.
Chapter 5: This part of the thesis presents the summary of the research,
conclusions and contribution of the study. The unique contributions provided by
this thesis are summarized in this chapter. Additionally this chapter suggests
some recommendations for future study.
Page 33
9
CHAPTER 2
LITERATURE REVIEW
2.1 Introduction
Clays are raw materials that exist all around the world abundantly. Clays are well-
known for their variety of uses and special properties that belong to their minerals
and compositions (Murray, 2007). Within clay, mineral structures are arranged in
such a way that they react with water and result in soil volumetric swell or shrinkage
with adsorption and desorption of water respectively. Expansive clays, also known as
swelling clays exist especially in regions with arid and semi-arid climate. They cause
problems for light substructures due to their swelling potential and shrinkage
behavior happen in wet season and dry season of year respectively (Mishra et al,
2008).
Many countries encounter challenges related to swelling soil in the world. Quarter of
the USA is covered with this type of soil and loss of more than nine billion dollars is
reported annually (Lin and Cerato, 2012). Although this problem is mentioned by
engineers in many countries and several swell determinative tests are performed to
explore subsoil swelling behavior, in underdeveloped countries much of expansive
soil problems are not recorded. By determination of this problem in these countries
number of countries prone to this problem will increase (Chen, 1988).
As it was acknowledged in the introductory part of this research, determination and
quantifying of soil swelling potential is required in geotechnical project planning.
Page 34
10
Generally, various laboratory techniques are used to survey expansive soil behavior.
Also, interpretations used to classify and determine swelling soil behavior based on
experimental results are not unique.
Hence, it is required to detect a relation between the most common experimental
methods used to investigate the soil swelling behavior and soil fundamental
properties to present a correlation between them. The main aim of this thesis is to
provide the essential experimental survey and theoretical basis to gain this goal.
This chapter summarizes a brief review of the methodologies, techniques, and
observations of some of the previous studies to provide useful knowledge on clay
mineralogy, soil structure and swell investigation tests in order to provide
comprehensive review of the existing research results.
2.2 Clay Particle and Clay Mineralogy
As Scott (1963) states, the soil mineral types affect the engineering properties and
behavior of the soil. Increase in mineral effects on soil behavior is obvious by
decrease in soil particle size which results in excess interparticle forces. Influence of
smaller soil particles, types of minerals and interparticle forces, it is likely that clay
triggers changes in soil behavior and properties. Whereas soil science researchers
and agricultural engineers concern about types of clay minerals and clay structures,
civil engineers are more focused on water seepage through soil and its effect on soil
mechanical behavior. Macroscale and microscale researches simplify the
comprehension of clay swelling phenomenon because they clarify fundamental
properties of expansive soils. Since it is evident that mineralogy is the basic
parameter dominating the size, shape and properties of soil particles, possible ranges
of chemical and physical properties of any given soil can be determined by soil
mineralogical structure. Also, type of soil mineral has a key role in determination of
soil expansion degree. That is why there is a need for mineralogical classification of
Page 35
11
clays. Commonly defined particle size ranges are shown in Figure 2.1. There is an
arbitrary division between soil groups based on their size. In general clay is defined
by considering particle size. Constituents of soil particles smaller than specific size,
0.002 mm (2 µm), are known as clay particles in engineering assortment. As mineral
term (Mitchell, 2005), clays express special minerals that can be recognized by:
(a) Small particle size
(b) A net negative electrical charge
(c) Plasticity when mixed with water
(d) High weathering resistance
Considering that clay minerals are primarily hydrous aluminum silicates and it is
possible to find nonclay soil particles smaller than 2 µm and clay particles coarser
than 2 µm, to avoid confusion it is useful to use the terms Clay Size Content and
Clay Mineral Content. Nevertheless, the amount of material finer than 2 µm is a
common reference to determine the portion of clay mineral in a soil profile. Also,
Particle shape is referred as an important parameter to differentiate clay from nonclay
minerals. Mostly the clay particles minerals possess platy shape, and in a few cases
they take tubular or needle shape; whereas, the nonclays are composed primarily of
bulky particles.
Figure 2.1 Particle size range in soil
Page 36
12
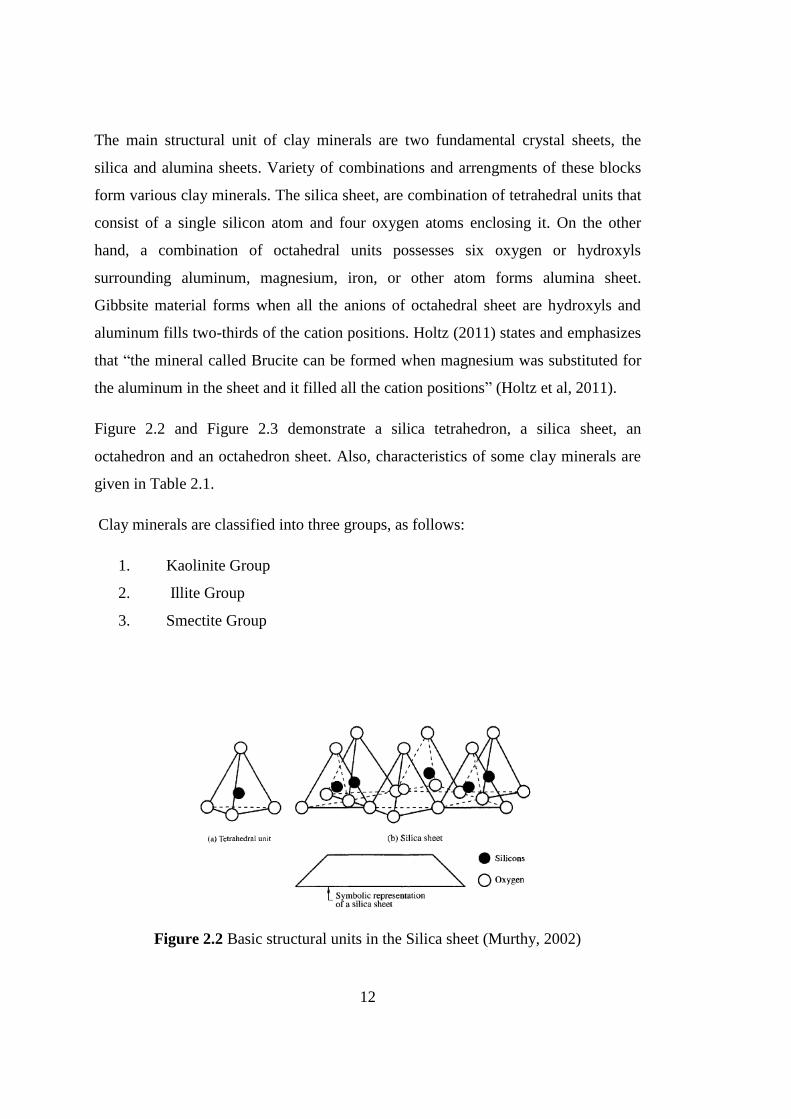
The main structural unit of clay minerals are two fundamental crystal sheets, the
silica and alumina sheets. Variety of combinations and arrengments of these blocks
form various clay minerals. The silica sheet, are combination of tetrahedral units that
consist of a single silicon atom and four oxygen atoms enclosing it. On the other
hand, a combination of octahedral units possesses six oxygen or hydroxyls
surrounding aluminum, magnesium, iron, or other atom forms alumina sheet.
Gibbsite material forms when all the anions of octahedral sheet are hydroxyls and
aluminum fills two-thirds of the cation positions. Holtz (2011) states and emphasizes
that “the mineral called Brucite can be formed when magnesium was substituted for
the aluminum in the sheet and it filled all the cation positions” (Holtz et al, 2011).
Figure 2.2 and Figure 2.3 demonstrate a silica tetrahedron, a silica sheet, an
octahedron and an octahedron sheet. Also, characteristics of some clay minerals are
given in Table 2.1.
Clay minerals are classified into three groups, as follows:
1. Kaolinite Group
2. Illite Group
3. Smectite Group
Figure 2.2 Basic structural units in the Silica sheet (Murthy, 2002)
Page 37
13
Figure 2.3 Basic structural units in the Octahedral sheet (Murthy, 2002)
Table 2.1 Characteristics of some clay minerals (Nelson and Milner, 1992)
All three of clay mineral groups have layered crystal form. Physical arrangement of
different layers and types of the bond between individual structural units are the main
source of differences between mineralogy of clay mineral groups. Layers are
connected through basic bonds known as hydrogen bonds, potassium bonds and van
der Waals bonds.
“The total area of the surface of the grain expressed in square centimeters per gram
or per cubic centimeter of the dispersed phase is defined as Specific Surface Area
(SSA)”. This parameter increases from kaolinite mineral to montmorillonite mineral.
Reactivity with water directly depends on SSA. In geotechnical engineering
Page 38
14
Atterberg limits are referred to characterize soil reactivity with water. Also, Liquid
limit, plastic limit and shrinkage limit, known as Atterberbeg limits, are utilized by
geotechnical engineers to classify clay minerals. According to previous studies
highest values of the liquid limit and plastic limit belong to montmorillonite group,
on the other hand, this group possesses lowest shrinkage limit in the clay minerals
(White, 1949).
The other parameter which is commonly used to classify clay minerals is activity.
Plasticity index and percentage of clay particle in soils are referred to determine the
activity value of clay minerals. The swelling potential for soil is related to its
activity. As activity increases, the swell potential increases.
2.2.1 Kaolinite Group
Kaolinite, soft, earthy and usually white mineral, with the chemical composition
2SiO2Al2O32H2O generated through the chemical weathering from aluminum silicate
minerals like feldspar. Kaolin or china clay is a type of rock that is rich in kaolinite
(Pohl, 2011).
Some clay minerals consist of repeating layers of two-layer sheets; kaolin is the most
important clay of this type. Deer (1992) stated that a” layered silicate mineral, with
one tetrahedral sheet which is linked through oxygen atoms to one octahedral sheet
of alumina octahedral is known as Kaolin”. The repeating layers are hold together
through hydrogen bonding and secondary valence forces (Das, 2008) (Fig.2.4, 2.5).
There is no or little swelling in the presence of water because of sufficient bonding
between layers which results in no interlayer swelling (Mitchell and Soga, 2005).
“When kaolinite sheets are stacked on each other, the hydroxyl of octahedron sheets
are drawn to the oxygen of the silica tetrahedron sheet by means of oxygen bonds.”
Cleavage occurs because such ionic and covalent bonds are not strong enough in
comparison of the primary bonds. Development of structural sheets in two directions
Page 39
15
results in crystals of 70 to 100 layers thick (Oweis, 1998). Hydraulic conductivity of
10-6 cm/s or higher is result of low expansion possibility (Oweis & Khera, 1998).
Figure 2.4 Structure of Kaolinite layer (Murthy, 2002)
Figure 2.5 SEM of Kaolinite (Source: www.claymin.geoscienceworld.org)
Page 40
16
2.2.2 Illite Group
When micas, with the major parent of muscovite, begins to weather it often leads to
Illite, which has chemical formula (K, H3O) (Al, Mg, Fe)2 (Si, Al)4O10 [(OH)2,
(H2O)]. Although, its main structural unit is similar to that of montmorillonite, it has
less swelling potential than montmorillonite mineral. Main structure of illite is
layered alumino-silicate, also known as phyllosilicate. The repetition of tetrahedron –
octahedron – tetrahedron (TOT) layers constitutes its structural basis (Fig 2.6.a,
2.6.b). When some of the silica atoms are replaced by aluminum atoms charge
deficiency balance occurs by potassium ions, which exist between layers of the unit.
The reason for the lower swelling potential of illite is the bonds with the
nonexchangeable K+ ions. In comparison with hydrogen bonds, these bonds are
weaker (Murthy 2002). The high stability of illite is responsible for its abundance
and persistence in soils and sediments.
Figure 2.6.a Structure of Illite layer (Murthy, 2002)
Page 41
17
Figure 2.6.b SEM of Illite (www.ssokinc.com)
2.2.3 Montmorillonite Group
When magnesium-rich rocks weather under humid, moderately drained conditions
montmorillonite forms which is very soft phyllosilicate group of minerals. As stated
above, montmorillonite and illite have same constitutive structure. The main
constituent of Bentonite, derived by weathering of volcanic ash, is montmorillonite.
Montmorillonite is a 2:1clay, which means 2 tetrahedral sheets sandwiching a central
octahedral sheet. Montmorillonite, the most useful member of the smectite group,
has plate-shaped particles with an average diameter around 1 μm.
In the central octahedral sheet, magnesium substitutes aluminum partially. “The
water molecules and exchangeable cations other than potassium occupy the space
between the combined sheets”. There is a weak bond between the connected sheets
because of the existent ions (Craig, 2004). Montmorillonite can expand when it
comes into contact with water because of the weak bonds which are prone to break
when any polar cationic fluids such as water penetrates between structural sheets.
The water penetration is easily found out through the layers swelling considerably
Page 42
18
and bearing much smaller particles with a very large SSA (Oweis and Khera, 1998).
The soils with high amount of montmorillonite minerals consists high swelling
potential and it exhibits shrinkage characteristic when it is dried out. This member of
the smectite group is distinctive for its highest swelling potential, activity and liquid
limit in clay soils. In comparison with sodium montmorillonite, montmorillonite
including calcium has lower swelling potential and cation exchange capacity.
Bentonite, which is a type of montmorillonite, includes both sodium bentonite and
calcium bentonite. It is reported by Oweis (1998) that, the amount of sodium
bentonite is higher than the amount of calcium bentonite. Bentonite is mainly used
for drilling mud, binder, and as a groundwater barrier (Hosterman, J.W. and S.H.
Patterson, 1992). Structure of montmorillonite is given in Figure 2.7.
Figure 2.7 Structure of Montmorillonite layer (Murthy, 2002)
2.3 Clay Structure
Soil particles interactions can be influenced by the spacing between the particles and
the orientation of the soil particles. Clay elementary structure is divided into two
basic structures Dispersed and Flocculated structures (Figure 2.8). Dispersed
Page 43
19
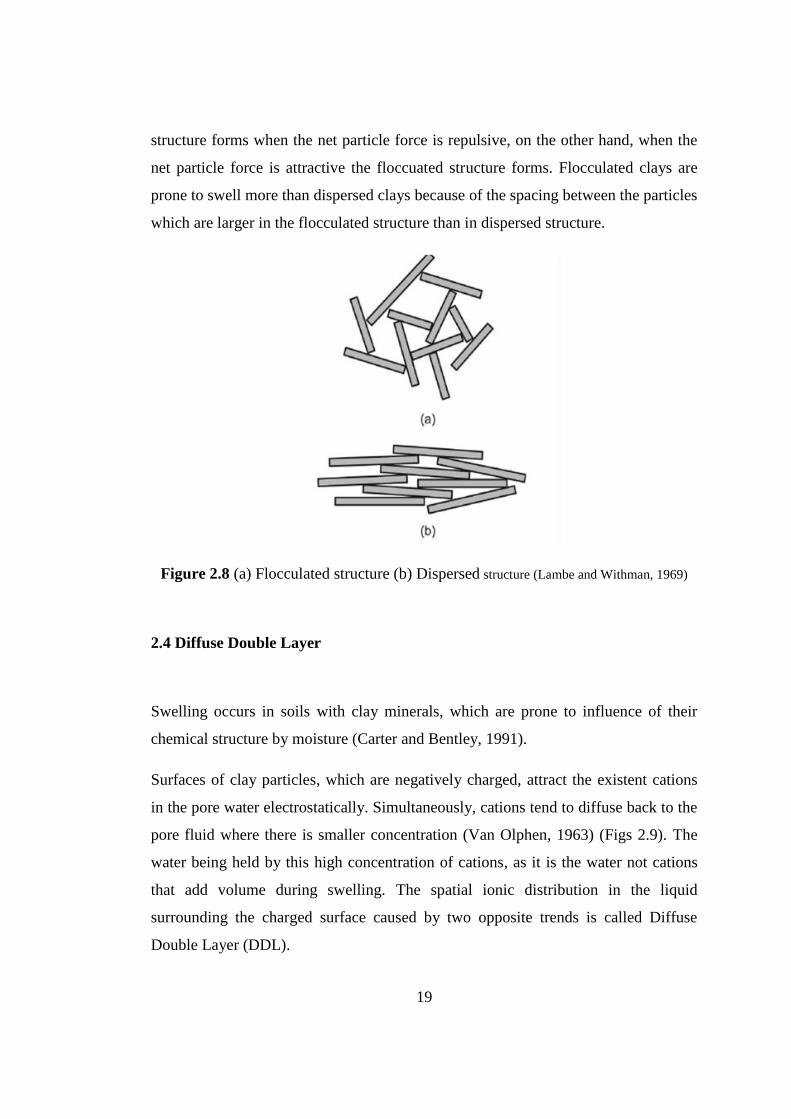
structure forms when the net particle force is repulsive, on the other hand, when the
net particle force is attractive the floccuated structure forms. Flocculated clays are
prone to swell more than dispersed clays because of the spacing between the particles
which are larger in the flocculated structure than in dispersed structure.
Figure 2.8 (a) Flocculated structure (b) Dispersed structure (Lambe and Withman, 1969)
2.4 Diffuse Double Layer
Swelling occurs in soils with clay minerals, which are prone to influence of their
chemical structure by moisture (Carter and Bentley, 1991).
Surfaces of clay particles, which are negatively charged, attract the existent cations
in the pore water electrostatically. Simultaneously, cations tend to diffuse back to the
pore fluid where there is smaller concentration (Van Olphen, 1963) (Figs 2.9). The
water being held by this high concentration of cations, as it is the water not cations
that add volume during swelling. The spatial ionic distribution in the liquid
surrounding the charged surface caused by two opposite trends is called Diffuse
Double Layer (DDL).
Page 44
20
The main factors which affect the thickness of diffuse double layer are valence and
concentration of cations. Smaller thickness of the double layer can be caused by
cations with higher ionic valence. On the other hand, bigger thickness of DDL can be
caused by the cations that has lower valence. For instance, in comparison to smectite
with smectite with Na+ has higher expansion potential.
Mitchell (2005) stated that, increase in DDL and swelling can be caused due to lower
concentration of cations. Cations which are highly concentrated near the surface of
clay particle form the repulsive force between DDL systems. Temperature is the
other parameter that influences the thickness of DDL. Increase in temperature
increases the thickness of DDL.
Figure 2.9 Distribution of cations and anions adjacent to a clay particle surface
according to the diffuse double layer theory (Keijzer, 2000).
Page 45
21
2.5 Cation Exchange Capacity
“Cations held on the clay and organic matter particles in soils can be replaced by
other cations, thus, they are exchangeable”. For instance, potassium can be replaced
by cations such as calcium or hydrogen, and vice versa. “The total number of cations
a soil can hold, or its total negative charge, is known as the soil's Cation Exchange
Capacity”. In other words, the term CEC is referred to as the quantity of
exchangeable cations required to balance the charge deficiency on the surface of the
clay particles. Higher CEC, means higher surface activity and consequently higher
water absorption potential. Clays with larger specific surface area experience higher
water adsorption. Also, Oweis (1998) defined CEC of soil as “the number of cations
in miliequivalents that neutralize one hundred grams of dry clay (meq/100 g)”. One
miliequivalents is defined as one miligram of hydrogen or any ion that will combine
with one milligram of hydrogen or displace it (Oweis, 1998). Table 2.2 illustrates the
different value of the CEC with respect to types of the clay minerals.
CEC is referred to as a significant parameter to determine clay mineral properties.
Two fundamental properties of clays, surface area and charges on this surface area,
can be measured by CEC. As presented in Figure 2.10 clay surface includes two
parts, external surface and internal surface.
Number of bonding sites of cations on the external surfaces shows the external
exchange capacity. The external CEC is a direct function of the crystal size, for a
specific volume or mass.
The bigger the external surfaces, the smaller the crystal size. Therefore it is possible
to get information on mean crystal sizes according to the measurement of the
external CEC. The overall charge imbalance on the layer structure and clay
absorption capacity can be determined by the internal exchange capacity.
Page 46
22
Table 2.2 Cation exchange capacity with respect to clay minerals (Lambe and
Whitman, 1968)
Mineral CEC (meq/100 g)
Kaolinite 3-15
Illite 10-40
Montmorillonite 80-150
Figure 2.10 Different types of exchange sites on clay particles, Surface and absorbed
ion interlayer sites
Page 47
23
2.6 Mechanism of Swelling
Fundamentally, clay’s swelling consists of two main mechanisms. The first one is the
expansion that happens between soil particles. Through this mechanism, seen in all
clay minerals, the capillary gap between clay crystals in clay accumulations holds
these clay crystals together by its water vacuum force. The clay unit swells when it is
subject to moisture, resulting in the release of this tensile force. The second swelling
mechanism is generally seen in montmorillonite group clays. When the clay is
exposed to water, it percolates through clay crystals as well as weak-bonded singular
surfaces that form crystals. Consequently, due to water adsorption volumetric
increase, known as clay swell, occurs (Popescu, 1986) (Fig 2.11).
Figure 2.11 Mechanism of swelling (Popescu, 1986)
Page 48
24
2.7 Factors Affecting Swelling Behavior of Soil
Factors influencing the swelling behavior of soils are classified into three groups
(Nelson & Miller, 1992):
Soil properties influencing swell potential
Environmental factors affecting swell potential
Stress conditions affecting swell potential
Affecting factors are summarized below in section 2.7.1, 2.7.2 and 2.7.3.
2.7.1 Soil Properties Influencing Swell Potential
2.7.1.1 Clay Mineralogy
Kaolinite, illite and montmorillonite are three groups of clay. Montmorillonite
mineral possesses highest swelling potential. Also, montmorillonite mixture with
other soils at low percentage causes expansion. Although, kaolinites and illites
minerals are usually known as nonexpansive soils, they can cause volume change if
their particle sizes are extremely fine.
2.7.1.2 Soil Water Chemistry
Increase in cation concentration and cation valence yield decrease in clay swelling.
For instance, Mg2+
cations (which have thinner DDL and flocculated structure) in the
soil water would causes less swelling than Na+ (which have thicker DDL and
dispersed structure)
Page 49
25
2.7.1.3 Plasticity
Actually, soil swelling potential can be demonstrated through its plasticity. In
general, soils with greater potential of swelling and shrinkage have higher plasticity
index and higher liquid limit.
2.7.1.4 Soil Structure and Fabric
Expansion occurs in flocculated clays more than dispersed clays. Cemented particles
are able to reduce swelling. Fabric and structure of clay change because of
compaction at high water content or remolding. Kneading compaction has been
illustrated to cause dispersed structures with lower swelling potential than soils
which are compacted statically with lower water contents.
2.7.1.5 Dry Density
Higher densities affiliated with closer particle spacing which means greater repulsive
forces between particles, which bring about higher tendency for expansion.
2.7.2 Environmental Factors Affecting Swell Potential
2.7.2.1 Initial Moisture Content
Naturally expansive soils with low or no moisture content have higher tendency for
water than the soil profile with more water content. Conversely, water lose occurs
Page 50
26
swiftly in a soil profile at higher water content on exposure to drying effects and
shrink more than a relatively desiccated profile.
2.7.2.2 Moisture Variations
When the soil profile experiences changes in its water content in the active zone near
the upper part of the profile, swelling occurs. The largest variation in moisture
content and volume changes of expansive soils occurs in those layers.
2.7.2.2.1 Active Zone Depth
A fundamental criterion of evaluating the swelling surface challenge is the active
zone depth (Fig 2.12). The depth in a soil to which periodic changes of moisture
occurs (Coduto, 2005). Since moisture content below the active zone depth can be
accepted as constant, heaving would not occur in layers beneath active zone depth.
Depending on the location of the site, the depth of the active zone varies. Some
typical active zone depths for American cities are suggested in Table 2.3. Shrinkage
cracks can extend deep into the active zone. Figure 2.13 shows interconnected
shrinkage cracks extending from the ground surface into the active zone in expansive
clay.
To determine the active zone depth of a field it is necessary to plot the liquidity
index against the depth of the soil profile over several seasons (Das, 1999; Güngör,
2002).
nLI PL PIW …………………….Equation 2.1
Where
LI: Liquidity index of the soil
Page 51
27
nW : Moisture content of the soil
PL: Plastic limit of the soil
PI: Plasticity index of the soil
After the calculation of LI from specified formulation above (Eqn 2.1), active zone
depth can be estimated from Fig 2.14 (There is no moisture change in regions with
constant LI).
Figure 2.12 Definition of active zone (Kraynski, 1967)
Page 52
28
Table 2.3 Typical active –zones depth in some U.S. cities (O’Neil and Poormoayed,
1980)
City Depth of active zone (m)
Houston 1.5 t0 3
Dallas 2.1 to 4.6
San Antonio 3 to 9
Denver 3 to 4.6
Figure 2.13 Interconnected shrinkage cracks extend from the ground surface into the
active zone (Petry, 2000)
Page 53
29
Figure 2.14 Approximate determination of active zone depth (Das, 1999; Güngör,
2002)
2.7.2.3 Climate
The soil moisture availability and depth of seasonal moisture variation are
considerably affected by the amount and variation of rainfall and evapotranspiration.
The most seasonal heave is seen in semiarid and arid climates which have short wet
periods.
2.7.2.4 Groundwater
Occasionally, swelling occurs due to shallow water tables and fluctuating water
tables which contribute to moisture.
Page 54
30
2.7.2.5 Drainage
Poor surface drainage around a house foundation, poor roof drainage and garden next
to shallow foundation result in creation of small body of water, which provides soil
access to water in greater depth beneath foundation. Increase in water content causes
expansion of swelling soils.
2.7.2.6 Vegetation
The moisture evaporates because of transpiration through trees, grasses and shrubs
which cause differential wetting of soil.
2.7.2.7 Permeability
Higher permeability of soil mass, due to cracks and fissures in the field, leads to
higher migration of water and accelerate the rates of swell.
2.7.2.8 Temperature
As the temperature increases moisture diffuses towards cooler areas, especially under
buildings and pavements.
Page 55
31
2.7.3 Stress Conditions Affecting Swell Potential
2.7.3.1 Stress History
An over-consolidated soil is prone to expansion more than the same soil which is
consolidated normally at the same void ratio. The pressure caused through soil
swelling increases in aging of compacted clays, but swelling degree is not affected
under light loading by aging. Swelling reduces through repeated wetting and drying
process in laboratory specimens, but after certain number of wetting-drying cycles,
no changes in swelling is detected.
2.7.3.1.1 Cyclic Swelling Shrinkage Behavior
Unexpected displacements and cracks in the structure can be caused via up and down
movement of foundations constructed on soil with high expansion potential due to
swelling-shrinkage cycles. The studies on wetting–drying cycles show greater
influence of this process on swelling potential of swelled surfaces (Tripathy and
Subba Rao, 2009). On the other hand, different outcomes are reported by researchers
(Türköz, 2009). Researchers exploring this issue evaluate the cyclic swelling-
shrinkage behavior in different manner. Some researchers states that when the clay
sample repeatedly experiences swelling and shrinkage, the sample will exhibit
fatigue phenomenon and consequently less swelling occurs. However other scholars
express that in the case of that sample is exposed to water content which is below the
limit of sample’s shrinkage, swelling potential increases by the amount of wetting
and drying cycles. Studying on that issue shows that after the certain cycle of
swelling-shrinkage swelling reaches to balance. Türköz (2009) reported that through
increase in number of cycle’s amount, swelling capability of surface with high
Page 56
32
expansion potential decreases regarding increasing particle size when cycling effect
on swelling potential of surfaces is assessed.
2.7.3.2 In-situ Conditions
To assess the probable consequence of loading the soil mass and/or changing the
moisture environment therein, it is required to estimate the initial stress state in a
soil. In order to determine the initial effective stress over consolidation ratio
geotechnical engineers can take sample from the field and perform tests on it in a
laboratory. Also making in situ measurements expresses acceptable data base about
soil behavior.
2.7.3.3 Loading
The magnitude of surcharge load specifies the quantity of volume change that will
occur for special moisture content and density. Exerted external load acts to reduce
expansion and balance interparticle repulsive forces.
2.7.3.4 Soil Profile
Potential volume changes of expansive layers are considerably affected by the
thickness and location of potentially swelling layers in profile. Under circumstances
where high potentially expansive clays extending from the profile surface to depths
below the active zone the greatest movement occurs. When expansive soil layer is
overlain by nonexpansive material or overlies bedrock at shallow depth, less
movements will be detected.
Page 57
33
2.7.3.5 Soil Suction
Soil suction is an influent parameter which is an independent effective stress
variable. In unsaturated soils, soil suction is represented by the negative pore
pressure. Gravity, surface tension, pore size and shape, saturation, electrical and
chemical characteristics of the soil particles and moisture affect the soil suction.
2.8 Common Soil Swelling Determinative Tests
As it was stated before considerable studies have been done in an attempt to evaluate
the swelling behavior of plastic clays. Researchers have given greater attention to
empirical investigations of the swelling behavior of compacted and natural soils
(Holtz and Gibbs, 1956). In general numerous experimental techniques have been
suggested to determine and classify swelling characteristics of expansive soils.
Interpretations used to qualify expansive clays are not only dissimilar but also based
either on soil index properties or results given directly from swelling determination
tests.
Many criteria have been proposed to identify and characterize expansive soil, such
as liquid limit (Table 2.4, 2.5), plasticity index (Table2.6), shrinkages limit (Table
2.7), free swell index (Table 2.7), percent free swell (Table 2.7, 2.8) and modified
free swell index.
Chen (1975) reported that there was no observation to confirm the correlation
between shrinkage limit and swelling potential. Sridharan and Prakash (1970)
observed that the mechanism governing the clay swelling and shrinkage are different,
so it is not useful to use shrinkage limit to predict the swell potential. Holtz and
Gibbs (1956) suggested the percent free swell test to assess soils swell potential. It
was discussed by Sridharan and Prakash (2000) that it is not possible to make a
satisfactory prediction on soil expansivity upon index properties such as liquid limit,
Page 58
34
plasticity index and related parameters, as they do not consider the effect of clay
mineralogy. On the other hand, the free swell ratio predicts soil swelling properties
more realistically and satisfactorily. Additionally, this test presents additional
information about the nature of the clay mineralogy of soils (Table 2.8).
Table 2.4 Proposed expansive soil classification based on plasticity index properties
(Neil and Poormaayed, 1980)
Liquid
limit
Plasticity
index
Potential
Swell (%)
Potential swell
classification
<50 <25 <0.5 Low
50-60 25-35 0.5-1.5 Marginal
>60 >35 >1.5 High
Potential swell = vertical swell under a pressure equal to
overburden pressure
Table 2.5 Proposed expansive soil classification based on liquid limit (Chen, 1975)
Degree of
expansion
WL: %
Chen
IS 1498
Low <30 20-35
Medium 30-40 35-50
High 40-60 50-70
Very high >60 70-90
Page 59
35
Table 2.6 Proposed expansive soil classification based on plasticity index (Chen,
1975; Holtz and Gibbs, 1956 ; IS 1498)
Degree of
expansion
Ip: %
Holtz and Gibbs
Chen
IS 1498
Low <20 0-15 <12
Medium 12-34 10-35 12-23
High 23-45 20-55 23-32
Very high >32 >35 >32
Table 2.7 Proposed expansive soil classification based on other measures (Holtz and
Gibbs, 1956; Seed H. B. and Woodward R.J, 1962)
Degree of
expansion
Colloid
content:
% minus
0-
.001mm
Shrinka
ge limit:
%
Shrinkage
index: %
Free
swell
index: %
Percent
expansion
in
oedometer*
as per holtz
and Gibbs
Percent
expansion
in
oedometer* as per
Seed et al
Low
<17
>13
<15
<50
<10
0-1.5
Medium
12-27
8-18
15-30
50-100
10-20
1.5-5.0
High
18-37
6-12
30-60
100-200
20-30
5-25
Very high
>27
<10
>60
>200
>30
>25
*From dry to saturated condition under a surcharge of 7 kPa.
Note: Shrinkage index = (plastic limit-shrinkage limit).
Page 60
36
2.8.1 Free Swell Test
The most common and supported methods of identifying the swelling potential and
swelling pressure of plastic clay are direct measurement methods. One of the direct
measurements used to assess the swelling soil behavior is use of conventional one-
dimensional consolidometer, which is referred as Free Swell Test or One
Dimensional Swelling Test (Chen 1975).
Methods for one- dimensional swell test and settlement potential of cohesive soil are
explained in standard test ASTM D 4546-08. Three alternative experimental
techniques are covered to measure the magnitude of one-dimensional wetting-
induced expansion or collapse of unsaturated soils. Additionally, one method to
measure the load-induced compression subsequent to wetting induced deformation is
presented. Achieved results play a key role in design of floor slabs on grade and
assessment of their performance. Since lateral swell and lateral confining pressure
are not simulated through this experiment, swelling parameters determined from
these experimental methods in order to estimate in situ heave of foundation and
compacted soil may not be representative of field conditions. The combination of
climatic conditions and the swelling characteristics of the soil play a key role in the
quantity of free swell percentage (Nelson and Miller, 1992). For instance, free swell
values between1200% to 2000% was reported by testing commercial bentonite.
Dawson (1953) stated that in Texas clay free swell value of 50% was observed,
which was mentioned as considerable expansion value. Table 2.8 was suggested by
Sridharan and K.Prakash (2000) to classify expansive soils due to percent expansion
in the oedometer. ASTM D 4829-11 proposed other criteria to determine and classify
expansive soil due to expansion index (Table 2.9).
Page 61
37
Table 2.8 Proposed expansive soil classification based on oedometer percent
expansion (A.Sridharan and K.Prakash, 2000)
Oedometer per
cent expansion*
Free swell
ratio Clay type
Soil
expansivity
<1
<1.0
Non-swelling
Negligible
1-5
1.0-1.5
Mixture of swelling and
non-swelling
Low
5-15
1.5-2.0
Swelling
Moderate
15-25
2.0-4.0
Swelling
High
>25
>4.0
Swelling
Very high
* From air dry to saturated condition under a surcharge of 7 kPa
Table 2.9 Typical values of the expansion index and potential parameter (ASTM D,
4829-11)
Expansion Index EI Potential Expansion
0-20 Very Low
21-50 Low
51-90 Medium
91-130 High
>130 Very High
2.8.2 Free Swell Index Tests
The free swell or differential free swell, also termed as free swell index, is one of the
commonly used simple experiments performed by geotechnical engineers for getting
estimates of soils expansion potential (Holtz and Gibbs,1956).
Page 62
38
Free swell index test is nothing just increases in volume of soil without any external
constraint when subjected to submergence in water. The procedure of this method
consists of pouring 10 cm3 of oven dried soil (passing sieve no.40) into 100 cm
3
measuring jar filled with distilled water and let the sample to rest. Then, the free
swell is defined as the increase in the volume of the soil expressed as the percentage
of initial volume (Eqn 2.2). The disadvantage of this method is that the measure of
10 cm3 is not easy and the personal judgment which can be accompanied with error
is one of the effecting parameters. It is acceptable to quantify 10 cm3 as the volume
engrossed by 10 gr of soil and it doesn’t account for changes of density.
IS 1498 states a criterion to predict the swell potential of soil. This approach is based
on the free swell ratio, defined as ratio of the sediment volume of soil in distilled
water to that in kerosene or carbon tetrachloride (Eqn 2.3). In some cases, for
kaolinite-rich soil, these method results negative free swell indices, subsequently this
technique may underestimate the swell potential of monmorillonitic soil if the soils
include high amount of kaolinite clay material.
To work out this problem modified free swell index (MFSI) was proposed by
Sridharan (1985). This method is based on the ratio of the equilibrium soil volume to
the dry weight of the soil. To ready the sediment 10gr soil sample must be oven dried
and mixed thoroughly with the distilled water in a 100 ml measuring jar then allow
settling (Eqn 2.4).
It was observed that, the alluvium volume occupied with specific weight of the dry
soil sample together with in kerosene provides acceptable information about the soil
expansivity and constitution of soil type- expansive/non-expansive/ combination of
both (Table 2.10).
0 0FS V 100V V …………………………….. Equation 2.2
k kFSI V 100V V …………………………… Equation 2.3
MFSI = V/10………………………………………... Equation 2.4
Page 63
39
V: Sediment volume of 10 gr of oven dried soil passing sieve NO.40 placed a 100
ml graduated measuring jar containing distilled water
kV : Sediment volume of 10 gr of oven dried soil passing sieve NO.40 placed a 100
ml graduated measuring jar containing kerosene.
0V : Volume of dry soil
Table 2.10 Expansive soil classification based on MFSI (Sridharan et al, 1986)
MFSI:
cm3/g
Sediment volume
in carbon
tetrachloride:
cm3/g
Clay type Soil
expansivity
<1.5 1.10-3.00 Non-swelling
Negligible
1.5-2.0 >1.1 and <MFSI
Mixture of swelling
and
non-swelling
Low
1.5-2 <1.1
Swelling
Moderate
2.0-4.0 <1.1
Swelling
High
>4.0
<1.1 Swelling Very High
2.8.3 MBV Test
Initially the application of Methylene Blue test was developed in France to determine
the suitability of granular material in manufacturing concrete while detecting clay
content of granular material. Methylene blue powder, C16H18N3SCl, behave like a
cationic dye when mixed with water. In the case of mixing with soil suspension its
chloride ions change place with cation in clay minerals to be adsorbed on the surface
of clay minerals. According to the clay type and the amount of clay minerals,
specific surface area of clay per unit mass and cation exchange capacity the amount
of blue methylene solution adsorbed by a given mass of clay changes. Since
Page 64
40
Methylene blue molecules have high propensity to be adsorbed onto the negatively
charged surface which might otherwise attract cations, evaluation with methylene
blue can also be mentioned to give a relative measure of the cation exchange
capacity of a clay soil (Çokca and Birand, 1993). Methylene blue test has become a
popular method because it does not require specialized expensive test setup and it is
easily applicable. This method is a reliable and simple measurement on the existence
and characteristics of clay minerals in soil sample, especially in the first stage of
exploration (Verhoef, 1992). In general, there are two test methods that have been
used in practice, A) Turbidimetric method and B) Spot method. The spot method is
more common and kind of a simplified titration technique. To calculate MBV
(methylene blue value) a definite amount of methylene blue solution is added in
certain volumes to a suspension of fine grained soil, then clay particles of the
suspension adsorb methylene blue and the total amount of adsorbed methylene blue
is used to obtain MBV (Nevins and Weintritt, 1967; Taylor, 1985; Hills and Pettifer,
1985; Verhoef, 1992). It is useful to provide a correlation between soil index
properties (liquid limit, plasticity index, etc.) and MBV to make preliminary
evaluations of soil profile. Methylene blue test enables engineers to assess specific
surface area (Chiappone et al., 2004; Yukselen and Kaya, 2008), cation exchange
capacity (Taylor, 1985; Çokça and Birand, 1993b), swell potential (Çokça, 1991,
2002; Çokça and Birand, 1993a) and fine fraction determination in loose material
(Pantet et al., 2007).
Determination of ion adsorption capacity of the soil is possible through methylene
blue stain test. This goal can be obtained by verifying the amount of methylene blue
needed to cover the entire surface area of clay particles in the soil.
The basis of this method is on titration caused by chemical reaction between free
cations of methylene blue acquired by dissolving methylene blue in water and
interchangeable clay cations. The biggest capacity for cation exchange belongs to
clay particles with the largest specific surface area and the highest negative
electrical charge. Increase in specific surface area and electrical charge of the clay
particle results in increased adsorption capacity. A number of studies have been
Page 65
41
carried out by Chiappone (Chiappone et al, 2004), to compare practicality and
evaluation of methylene blue test used in laboratories to identify clay minerals as
stated in standards. According to ANFOR NF P 94-068 analysis, it is suggested to
take soil test sample with 30 to 60 gr in clayey or excessively clayey soils and 120 gr
in less clayey soil. On the other hand, ASTM standard which follows same test
procedure as ANFOR standard suggests to use 2 gr of soil test sample and acidic
milieu (pH ranges between 2.5 and 3.8) is recommended as solvent. Chiappone
(2004) stated that for homogenous fine-grained soil test samples it is suggested to use
ASTM standard (solely verifying the clay content), whilst ANFOR standard defined
test method submits reliable results which presents entire soil test samples, thus is
recommended for heterogeneous samples.
2.8.4 Swelling Pressure Test
During the swelling process, the expansion tendency may be fully or partly restrained
depending upon the engineering structure in contact of the soil. The pressure exerted
from soil under confined condition can uplift the above layers. Several studies have
been done to assess the swelling pressure both qualitatively and quantitatively. Also
numerous investigation have attempted to identify the various factors affecting
the expansion and the pressure caused by it.
The conventional oedometer (consolidation apparatus) was adopted to assess the
swelling pressure of expansive soil by Holtz and Gibbs (1954) and Jenning and
Knight (1957) for first time. The pressure which must be applied to the soil such that
it prevents the expansive soil specimen from any further swelling through wetting
process is called swelling pressure. This experiment is also termed as Zero Swell
Test (ZST) (Basma et al, 1995; Fattom and Barakat, 2000). On the other hand,
Consolidation Swell Test (CST) consists of opposite procedures. Through the CST
the soil specimen is allowed to completely heave under a specific applied load by the
setting process, then application of gradual load recompresses the soil specimen to its
Page 66
42
original volume. Therefore, the value of the final applied pressure that prevents the
swelling process is termed as swelling pressure.
The Double Oedometer Test (DOT) was proposed by Knight (1957). The settlement
rate or total heave can be predicted through this technique .The philosophy of the
double oedometer test is based on the void ratio vs applied effective pressure of two
normally consolidated and similar samples.
Shanker (1982) reported a comparison between the swelling pressures caused by
undisturbed soil and remolded specimen of the same soil (Shanker et al, 1982).
Constant Volume Method (CVM) (same as ZST), and Free Swell Method (FSM)
were used to evaluate the swelling pressure at the same initial circumstance.
Undisturbed samples have higher swelling potential than the remolded samples.
Also, FSM method yields greater swelling pressure than the CVM method for both
kinds of soils. It was demonstrated that for the given soil the pressure caused through
swelling is proportional to dry unit weight and clay content percentage directly; on
the other hand, initial water content and initial applied pressure affect the swelling
pressure inversely (Yevnin and Zaslavsky, 1970; El-Sohby and El-Sayed, 1981;
Basma et al, 1995). The ZST, CST, DOT and RST techniques were used to obtain
the previous observation. Restrained Swelling Test (RST) was performed by Basma
et al (1995). Through this method a sample is compacted under incremental pressure
until it attained equilibrium deformation, then the specimen is subjected to
submergence in water until it approaches the full swelling. The swelling potential of
the soil is defined as the ratio of the maximum expansion to initial height. The
pressure which prevents expansion is expressed as swelling pressure.
The swelling pressure aspect of the soil expansive behavior was explored by Shuani
(1996) through standard and modified oedometer tests. To simulate the experimental
results a theoretical model was suggested. Since measuring lateral swelling pressure
by oedometer setup had difficulties, the study was limited to one-dimensional
framework. However, it was discussed that, it is necessary to mention the coefficient
of permeability as one of the important parameters required for theoretical
simulation.
Page 67
43
A reliable inexpensive and cost-effective computer system was designed by
Thompson (2006) in order to exert more precise control over the increments of
applied pressure during constant volume swelling pressure tests on samples obtained
from several field sites. The comparison of the results obtained from these tests with
Load-Back Swelling Test (LBST is similar to CST) results clarified that the swelling
pressures observed from the LBSTs overestimated the uplift skin friction. Moreover,
the swelling pressures obtained from tests reported in literature were comparable
with those resulted from constant volume swelling pressure tests.
ASTM D 4546 provides three alternative test methods for evaluating the swell
pressure. All the three following techniques require that a soil specimen be confined
laterally while loaded axially in oedometer apparatus with access to free water.
Method A) The sample is submerged in water and allowed to undergo vertical
volume change at the seating pressure, 1kPa, exerted by the load of top porous stone
and load plate. There is no loading until the primary swell is complete. Then
additional load is applied until its initial void ratio/height is obtained.
Method B) A vertical pressure, usually equivalent to the in situ vertical overburden
pressure or structural loading, is applied to the specimen or both before the specimen
is given access to water. Later, the sample is allowed to be submerged with water.
The amount of expansion or settlement can be measured at the applied load after
movement is negligible. The final applied load which is added to keep the specimen
at the initial height is referred as swelling pressure.
Method C) This procedure includes keeping the specimen at constant height by
adjustment in vertical load after the specimen is given the access to free water. The
pressure that keeps the volume constant is interpreted as swelling pressure.
Page 68
44
Figure2.15 Time-swell curve (ASTM D (2013). Standard test method for expansion
index of soils. Annual Book of ASTM Standards, PA 4546)
2.9 Treatment of Expansive Soils
Recently, due to the increase in population and subsequent increase in urbanization,
construction on soils with high expansion potential is unavoidable. Therefore, it is
required to utilize some techniques in order to mitigate the damages caused by
swelling soils. The appropriate treatment options before and after construction of
engineering structures depends on the environmental conditions and soil, and the
degree of risk the owner is willing to assume (Nelson and Miller, 1992).
Since the objective of this study is not improving or stabilization of expansive soils,
the treatment options are listed below with brief discussion.
Page 69
45
Chemical additive
This technique involves application of chemical admixtures to improve the behavior
of expansive soil. Chemical stabilization used to stabilize the soil can be found in the
form of lime and cement materials and a combination of them. Additionally, the
waste materials such as phosphogypsum, ground granulated blast furnace slag and
fly ash are utilized to stabilize expansive soil. Chemical additives are used to reduce
the permeability of the soil, improve the shear strength, increase bearing capacity,
and reduce the settlement and expediting the construction.
Prewetting
The aim of this method is to allow desiccated foundation soils to heave before the
construction. One of the most common wetting techniques are ponding or
submerging of an area in water. However, it takes long time even years for wetting
the foundation subsoil by ponding to increase the water content to the required
depths due to the clay chemical structures. It is possible to decrease the time required
to arrange the soil moisture content at point where maximum heave will occur to few
months by prewetting with the grid of vertical wells (Stavridakis, 2006). Whereas the
bearing capacity of the soil reduces because of saturation this method is the most
economic method.
Compaction
Actually, the expansive soil with a low dry density may have less expansive potential
with respect to soil with a higher dry density, so by reducing the dry density of this
Page 70
46
soil the swelling potential of expansive soil can be decreased. In other words, Holtz
(1959) stated that “compaction of expansive soil, which is compacted at lower
density and at water content above the optimum moisture content produces less swell
potential than compaction of this soil, which is compacted at high density and low
moisture content”. This method is not useful for all types of expansive soils because
some kind of swelling soils have such a high potential for volume change that
compaction control cannot reduce swell potential significantly (Nelson and Miller,
1992).
Soil removal replacement
The process of soil removal and replacement with non-expansive soils is one of the
common methods to stabilize the expansive soil. The main reason is that, non-
expansive soil compacted at higher density exhibits high bearing capacity than
expansive clay. In this method expansive soil should be removed and replaced by
non-expansive soil fill to a depth necessary to prevent excessive swell. Chen (1988)
proposed that non-expansive soil fill should be at least 1 to 1.3 m. This method is
preferable by engineers, since removal and replacement require less delay to
construction than some other techniques such as prewetting (Nelson and Miller,
1992).
Surcharge loading
In the case of low swell pressure, such as in a secondary highway system, surcharge
loading can be effective. Before applying the surcharge load it is required to
determine the depth of the active zone and the maximum swell pressures with soil
Page 71
47
testing program. In addition, drainage control can be done during surcharge process
(Nelson and Miller, 1992).
Thermal methods
Little studies have been done in the United States to apply thermal treatment method
to expansive soil. By heating clays to approximately 200°C significant reduce in the
potential of volume change occurs. However, economical and applicable methods
have not yet been developed (Nelson and Miller, 1992).
2.10 Empirical Correlation
Many empirical correlations have been developed by researchers to predict the
swelling properties, swell potential and swell pressure, of natural and compacted
soils on the basis of physical and index properties such as consistency limits, clay
content, initial moisture content and density. Proposed correlations include some
limitation. Since the models are developed based purely on the results of the
experimental investigation conducted on particular number of test samples, the
results proposed by thee models for other soils are not satisfactory. Additionally,
there is no theoretical basis to support the validity of the predictive models.
Various correlations between fundamental properties of soils and their swelling
characteristics have been proposed in the past for a variety of expansive soils, some
of which are presented in Table 2.11.
Page 72
48
Table 2.11 Empirical correlations for predicting the swelling behavior of expansive
soils by various researchers.
A(PI)Sp(%) Be Chen (1975)
Sp(%) 7.518 0.323(C) Muntohar (2000)
2.44Sp(%) 60K(PI) Holtz et al (1956)
iSp(%) 1.92A 0.68 7.55w J. Israr et al (2014)
3.442.44Sp(%) k( )( )CA Seed et al (1962)
2.44Sp(%) (k)(M)(PI) Seed et al (1962)
2.67Sp(%) m(SI) Ranganatham (1965)
idLog(P) 2.132 0.0208(LL) 0.000665( ) 0.0269( )w Komornic and David
(1969)
1.12 22 2iP (3.5817 ) 3.7912(PI)10 C w
N. V. Nayak (1971)
idLog(P) 4.812 0.01405PI 2.394 0.0163w Yusuf Erzin et al
(2004)
LdLog(P) 5.197 0.01457PI 2.408 0.0163I Yusuf Erzin et al
(2004)
A: Activity
PI: Plasticity Index
C: Clay Fraction
: Initial water Content
SL: Shrinkage Index (Liquid Limit – Shrinkage Limit)
LL: Liquid Limit
: Dry Density
B, m, k and M: Empirical Constant
Page 73
49
CHAPTER 3
EXPERIMENTAL STUDY
3.1 Purpose
As revealed before macro-scale methods are more common to verify swelling
behavior of highly plastic clays. The necessity of studying the relation between these
macro-scale methods is obvious. The focus of the present experimental study is to
investigate the swelling behavior of expansive soils via common swelling
determination techniques such as Methylene Blue Test, Free Swell Index Test, Swell
Percent Test and Swelling Pressure Test. In addition, the relation between the stated
experiments is studied to develop a correlation between them. Also, the correlations
between the index properties of the soil samples and Methylene Blue Test, Free
Swell Index Test, Swell Percent Tests and Swelling Pressure Test are evaluated. The
expansive soil samples are prepared artificially in the laboratory by mixing kaolinite
and bentonite at different percentages. Moreover, these tests are repeated on the
natural expansive soil samples to assess the results. In order to accomplish these
objectives, correlation matrices are obtained, which includes fundamental properties
of test samples and results of swell determination tests. These matrices are presented
in table 3.4. Furthermore, the values of swell potential and swelling pressure based
on currently proposed and previous models are submitted in table 3.3.
In this chapter, the selection of materials, the determination of soil index properties
and soil preparation for further experiments are explained. Afterward, the testing
procedures used through each experiment to assess soils expansive behavior are
Page 74
50
addressed in detail in subsections. Also, each subsection describes apparatus used in
this research; modified procedure and equipment are discussed, if there is any.
3.2 Material Selection
Considering the main purpose of this research, the appropriate materials proportions
(bentonite and kaolinite) are selected based on their moderate to high expansive
potential to create test samples with different expansivity with a view to simulate the
field conditions. The swell potential of the investigated test samples are required to
be low to high in order to ensure that the test samples include necessary clay
minerals to qualify for the research.
In that consideration, Bentonite and Kaolinite have been selected to prepare artificial
expansive test samples in the laboratory by mixing them at different percentages.
Also, two natural expansive soil samples undergo the same experiments.
Kaolinite: Gravel sized Kaolinite were taken from Kaolin Industrial Minerals
Company. They were crushed and passed through # 40 sieve after being oven dried
at 105 °C for 24 hours (Figure 3.1.a).
Bentonite: Bentonite is production of Karakaya Bentonit Sanayi ve Ticaret A.Ş
which is located in Esenboğa/ Ankara. Bentonite was oven dried at 105 °C for 24
hour. Then it was sieved through # 40 sieve before usage (Figure 3.1.b).
Six sets of soil mixtures were prepared by mixing kaolinite and bentonite in
different percentages. Soil mixture samples were sieved through # 40 sieve for two
times after blending with glass stirrers in order to obtain more homogenous samples.
Ceramic containers were used to keep mixtures. Since, clay losses its
electromagnetic qualities through contact with metal, it should never be stored in a
metal container or stirred with a metal spoon. The only materials that should be used
in preparation or storage are wooden spoons or glass stirrers, and either glass or
Page 75
51
ceramic containers. The first sample, named A, is 100% Kaolinite. Sample B is
mixture of 90% kaolinite and 10% bentonite. By adding more 10% bentonite and
reducing same amount of kaolinite from the previous test sample on each step, the
next test samples are prepared. The most expansive test sample, and the last soil
mixture proportion consists of 50% Kaolinite and 50% Bentonite (Table 3.1).
Two natural expansive soil samples were taken from Ankara (from Konya Yolu and
Bilkent regions), known as Ankara clay. Similar to the artificial test samples, they
are crushed and passed through # 40 sieve after being oven dried at 105 °C for 24
hour. (Figure 3.1.c, Figure 3.1.d)
Figure 3.1.a Views of bentonite and kaolinite used in this study
Page 76
52
Figure 3.1.b Views of natural samples used in this study
Table 3.1 Test soil samples and their symbols
3.3 Properties of Soil
In order to classify the test samples and assess the existing correlations between their
swelling properties and their material characteristics, a series of tests are conducted.
The tests that evaluate the soil properties on which their classification and
identification are based listed below;
Tests Soil Samples Character
100% Kaolonite A
90% Kaolonite+10% Bentonite B
80% Kaolonite+20% Bentonite C
70% Kaolonite+30% Bentonite D
60% Kaolonite+40% Bentonite E
50% Kaolonite+50% Bentonite F
Ankara Clay Type 1 G
Ankara Clay Type 2 H
Page 77
53
Soils Index Properties Tests (Grain Size Distribution including Sieve
Analysis and Hydrometer test, Consistency Limits, Plasticity Index)
Specific Gravity Tests
Harvard Miniature Compaction
3.3.1 Soil Index Properties Test
The soil properties on which their identification and classification are based are
referred as index properties. The index properties which are used are: A) Grain Size
Distribution B) Consistency Limits C) Plasticity Index.
3.3.1.1 Grain Size Distribution
Grain size analyses, known as soil gradation test, are performed on essentially all
geotechnical particulate materials ranging from clay to boulders. This fundamental
experiment refers to discerning the percentage of particles (by dry mass) within a
specified particle size range across all the sizes represented for the soil samples. Soil
gradation is determined by analyzing the results of a sieve analysis, or a hydrometer
analysis for soils containing appreciable quantities of fine fraction (less than 75µm).
The properties of the soil are dominantly influenced by the amount of clay and other
fractions. Sedimentation methods, hydrometer analysis of fine grained soils,
describes the process of particles falling through a fluid, and is used to separate the
particles by size in space and time.
Since all test samples are fine grade soils, hydrometer tests were performed to
determine grain size distribution of test samples according to ASTM D422 (2007).
(Figure 3.2a, Figure 3.2b)
Page 78
54
Figure 3.2a Determination of grain size distribution via Hydrometer test
Figure 3.2b Determination of size distribution of test samples
In addition to hydrometer test, there are numerous methods to determine particle size
distribution. Laser light scatter, LD is commonly used to determine size distribution
of soil particles. In this method, the particle size distribution is determined by
intensity of light scattered by a particle and angle of the diffracted laser beam. The
soil particle size is directly proportional to the intensity of the scattered light, on the
Page 79
55
other hand there is an inverse relation between angle of diffracted laser beam and soil
particle size.
3.3.1.2 Consistency Limits
The term Consistency of Soil, specifically used for fine grained soils, is referred as
the physical state of soil with respect to moisture content present at that time. Also it
can be defined as” the resistance to deformation caused by mechanical stress or
firmness of fine-grained soils at various moisture contents”
Atterberg observed that the consistency of fine-grained soils are greatly affected by
the amount of moisture content present in these soils, therefore, the moisture content
at which the soil changes from one state to another state is defined Consistency
Limits or Atterberg Limits (Murthy, 2002). Depends on water content, fine-grained
soil can exist in any of four states. A) Solid State B) Semi Solid State C) Plastic State
D) Liquid State (Figure 3.3)
When a dry soil is subject to water a film of adsorbed water covers each particle.
When more water is added the thickness of the water film on a particle increases.
Increasing the thickness of the water films enables the particles to slide past one
another more easily. According to this fact, the behavior of the soil is related to the
amount of water in the system. The boundaries of stated four states are called as
"limits" as follows:
Liquid limit: The boundary between the liquid and plastic states;
Plastic limit: The boundary between the plastic and semi-solid states;
Shrinkage limit: The boundary between the semi-solid and solid states.
The Atterberg limits can be used to distinguish between silt and clay, and it can
distinguish between different types of silts and clays.
Page 80
56
Figure 3.3 Fine-grained Soils States Boundaries According to water content and
Atterberg Limits
The moisture content above which the soil-water mixture passes to liquid state is
defined as Liquid Limit. At this state the soil-water mixture has such a small shear
strength that it behaves like a viscous fluid under its own weight. Any change in
water content either side of the liquid limit results in volume change of the soil.
There are two common methods to define the liquid limit in laboratory:
Casagrande Liquid Limit Test; According to this method LL is defined as “
the moisture content at which two sides of a groove come closer together for
a distance of 12.7 mm under the impact of 25 number of blows” ( Figure 3.4,
Figure 3.5). Since it is time consuming and difficult to obtain a test with
exactly 25 numbers of blows, the procedure is performed multiple times with
a range of water contents and the results are interpolated
Fall cone test method; this method defines Liquid limit as “the moisture
content at which a standard cone, starting at soil surface, penetrates with in
the soil for 20 mm when it sinks freely for 5 seconds. Since it is time
Page 81
57
consuming and difficult to obtain a test with exactly 20 mm penetration, the
procedure is performed multiple times with a range of water contents and the
results are interpolated. The Fall Cone has the advantage over the Casagrande
apparatus. The operation of the apparatus is not influenced by the operator, so
the results are comparable independent of the operator. While utilizing the
Fall Cone Apparatus, the operator should be aware of the state of the cone,
since a worn cone can affect the fall depth, and thereby the results of the
Liquid Limit. The soil should be compacted carefully because air pockets
trapped in the soil around the point of impact can also affect the measured fall
depth. Fall cone test method was conducted according to BS 1377 (2010)
(Figure 3.6.a, Figure 3.6.b).
Figure 3.4 Casagrande liquid limit test
Page 82
58
Figure 3.5 Casagrande liquid limit test results
Figure 3.6.a A view of fall cone apparatus
Page 83
59
Figure 3.6.b A view of fall cone test
Plastic limit, is defined as moisture content above which the soil-moisture mixture is
in plastic state. At this state the mixture undergoes deformations to any shape under
any small pressure. By reducing the water content the mixture passes to semi-solid
state. Any change in water content at either side of PL causes volume changes of the
soil. A small increase in moisture above the plastic limit destroys cohesion of the
soil. Two common methods are used to determine plastic limit, the first one is based
on ASTM D-4318. In this method, PL is defined as the moisture content (%) at
which the soil begins to crumble when rolled up into a thread of 3.2mm (1/8 in) in
diameter (Figure 3.7).The alternative method is Fall cone method (as used to
determine the liquid limit) which is more accurate which is independent of the
operator.
While performing Fall cone method it must be considered that, a cone with a mass of
80 gr and an apex angle of 30° is used to determine the LL, While a cone of similar
geometry but with a mass of 240 gr is used to determine the plastic limit (Das 2008)
(Figure 3.8).
Page 84
60
Figure 3.7 Soil crumbles through plastic limit
Figure 3.8 Fall cone masses and cones used to determine LL and PL
Page 85
61
The maximum moisture content at which the decrease in water content cause no
reduction in total volume of soil but the increase in moisture content results in an
increase in moisture content is called Shrinkage Limit (SL). Above this moisture
content the soil-water mixture passes to semi-solid state. On the other hand, below
this water content the mixer has solid state. Any increase in water content is
associated with volume change but no change happens in soil volume as the water
content decreases. SL is also expressed as “the lowest water content at which the
soil-water mixture is still completely saturated. Determination of volumetric
shrinkage limit is carried out according to ASTM D-427. The procedure involves the
measurement of initial wet soil mass, dry soil mass and water content of the soil as a
percentage of dry mass (Figure 3.9), Finally shrinkage limit is calculated as water
content of the soil as a percentage of the dry mass as (Eqn 3.1):
00 0SL W V 100V M ……………………….Equation 3.1
Where;
SL: Shrinkage limit
W: Initial water content of the soil
V: Volume of the mercury held in the shrinkage dish through test procedure,
according to ASTM D-427
0V : Volume of the mercury displaced into the evaporating dish through test
procedure, according to ASTM D-427
0 : Density of water equal to 1.0 gr / 3cm at 20 c temperature (62.4 lb / 3ft )
0M : Dry soil mas
Plasticity Index, denoted by PI = LL – PL (Eqn 3.2), is expressed as the range of
water content over which a soil behaves plastically. It is referred as the range of
consistency with in which the soil exhibit plastic properties.
Page 86
62
Figure 3.9 Set up used to determine SL
3.3.2 Specific Gravity
Specific gravity is referred as the ratio of the density of a substance to the density of
a reference substance such as water. ASTM D854 suggests a method to determine
fine grained- soil specific gravity. Samples are oven-dried at 105 for a period of 16 to
24 hours. To perform the test, it is necessary to have empty weight of pycnometer
and weight of pycnometer with oven dry soil. Then add water to cover the soil in the
pycnometer and screw on the cap. To remove entrapped air it is necessary to shake
the pycnometer well and connect it to the vacuum pump for about 10 to 20 minutes,
finally fill the pycnometer with water (Figure 3.10).
The Specific gravity of soil solids ( ) is calculated using the following equation
(Eqn 3.3):
s 2 1 2 1 3 4G W W W W W W …………..Equation 3.3
Where;
1W = Empty weight of pycnometer
2W = Weight of pycnometer + oven dry soil
Page 87
63
3W = Weight of pycnometer + oven dry soil + filled water
4W = Weight of pycnometer + filled with water only
Figure 3.10 A view from soil specific gravity test
3.3.3 Harvard Miniature Compaction
To improve loose soils in construction of highway, earth dams and many other
engineering structures, it is necessary to compact them in order to strengthen them by
increasing their unit weight. Compaction is defined as densification, rearrangement
of soil particles, of soil by removing air voids using mechanical equipment such as
highway compaction machines. Soil dry unit weight is reference parameter to
measure the degree of compaction. Increasing the bearing capacity of foundation,
decreasing the undesirable settlement of engineering structures, control undesirable
volume changes, reduction in hydraulic conductivity and increasing the stability of
slopes are the main objectives of compaction. It must be considered that through
Page 88
64
compaction densification there is no fluid flow; on the other hand consolidation
(other kind of densification) involves pore water flow under load.
Degree of compaction is influenced by four control factors:
A) Compaction effort
B) Soil type and gradation
C) Moisture content
D) Dry unit weight (dry density)
Moisture content of the test soil sample affect compaction under constant compaction
effort. During compaction added water acts as softening agent on the soil particle and
the dry unit weight increases as the moisture content increases to a point. Beyond a
certain moisture content sample dry unit weight reduces by adding water. The
moisture content at which maximum dry unit weight is attained under constant
mechanical effort is referred as Optimum Water Content. (Figure 3.11)
Generally through soil compaction process mechanical effort is constant and the
critical point is to determine the optimum water content to obtain maximum dry
density. ASTM D698 proposed a standard to simulate field compaction in lab. Two
types of tests are suggested to evaluate the optimum water content, A) Standard
proctor test and B) Modified standard proctor test. The differences between these
methods are based on the compaction effort and layers of compaction (reteg). (Figure
3.12)
Page 89
65
Figure 3.11 Maximum dry unit weight and optimum water content determination
through proctor test
Fig 3.12 Characteristics of standard and modified proctor tests apparatuses
In this study, due to insufficient test sample Harvard Miniature Compaction
apparatus is used to determine the optimum water content and maximum dry density.
Page 90
66
Harvard miniature compaction apparatus duplicates the kneading action of e
sheepsfoot roller type of compaction. The apparatus is furnished with a specimen
ejector, collar remover with spacer plate, mold holder, mold and collar, compaction
tamper with 20 lbs. (9.07kg) or 40 lbs. (18.2kg) spring (Figure 3.13). Test samples
were compacted in three layers after curing for 24 hours using 25 well disturbed
pushes with the compaction tamper. Finally, similar to standard compaction
procedures proposed in ASTM698, optimum water content and maximum dry
density is calculated.
Figure 3.13 Harvard miniature compaction apparatus
Page 91
67
3.4 Free Swell Test, Experimental Procedure and Modified Experimental
Equipment
Generally, the laboratory test methods to measure the magnitude of One-
Dimensional wetting-induced free swell of unsaturated compacted soils are
conducted by simple Oedometer test apparatus according to ASTM D4546 (Fig
3.14).
Figure 3.14 Simple oedometer setup
3.4.1 Modified Experimental Equipment
Since the test samples used through this study have high swell potential, it is required
to utilize modified setup with similar performance and properties. The utilized setup
is comprised of following three parts:
The base with a ring-shape porous stone
Rigid circular mold
Axial load applying device with attached porous stone
Page 92
68
The Base With a Ring-Shaped Porous Stone-The setup base, on which the
specimen is placed, is stiff enough to prevent lateral and vertical deformation due to
swelling. The material of the setup base is noncorrosive in relation to the soil or pore
fluid. The air dried porous stone is infixed in the base so that the compacted soil
sample stays on it. Considering that the soil sample should be subjected to water
from both upper and lower porous boundaries, some grooves and holes are
improvised at the bottom of the base. Inner surface of the base around wall has
threads that match the outer tracks of the mold (Fig 3.15).
Figure 3.15 The base with ring-shaped porous disk
Rigid Circular Mold -The compaction mold is made of a material with sufficient
rigidity to tolerate lateral soil expansion without experiencing changes in its inner
diameter more than 0.04% of the diameter under load. Similar to base material, the
Page 93
69
mold is noncorrosive in contact with soil or pore fluid. The mold has 80 mm height
and 50 mm inner diameter (Figure 3.16).
Figure 3.16 The rigid mold used through the study
Axial Load applying device with attached porous stone-According to ASTM
D4546 it is required to apply 1 kPa load before wetting the soil sample. This load is
applied via metal bar and attached pore stone weight. Some rings are improvised at
the top of the bar to hold additional weights if required while applying 1 kPa load.
The bar should be polished against corrosion when subjected to water contact (Figure
3.17).
Figure 3.17 A view of axial load applying device with attached porous stone and
extra weights
Page 94
70
Porous Disks- The porous discs should be of material that resist against corrosion.
Sufficient hydraulic conductivity and being fine enough are necessary for porous
discs to allow flow of water through specimen and prevent soil penetration into it
respectively. Ring-shaped porous disks are boiled in water for about 10 minutes and
then exposed to air. They should be completely air-dried before use because even a
small amount of water can cause initial soil to swell. To avoid extrusion of the soil
specimen while swelling, it is essential to fit porous disks close to soil surface
(Figure 3.18).
Figure 3.18 Porous disks used through the study
3.4.2 Experimental Procedure
The procedures used to perform free swell experiments are based on the procedures
proposed in ASTM D4546. Prior to soil specimen compaction, the inner surface of
the mold was coated with a low-friction material .All test specimens are compacted
with a maximum dry density at optimum water content, after 24 hours of curing. The
Page 95
71
compaction process was done by the help of a hydraulic jack (Figure 3.19) and three
spacers (compressor bars) in three stages (Figure 3.20). Final height of the
compacted specimen is 20 mm and its diameter was equal to that of mold, 50 mm.
After compaction, two porous discs with filter paper were used at the bottom and top
of the specimen. According to the procedure expressed in ASTM D4546, it is
required to apply 1 kPa load on compacted soil specimen. In order to exert 1kPa
pressure axial load applying device is utilized with additional weight. Eventually,
dial gage is adjusted to measure the vertical displacements. Subsequently the
cylinder containing the mold is filled with water to submerge the specimen. Test
water used to submerge soil specimen is Ankara potable tap water (Ankara potable
tap water chemical characteristics are presented in appendix A). The improvised
tracks at the bottom of the base enable the soil specimen to achieve water as if it gets
moisture from the upper level through top porous disc (Figure 3.21).
The soil specimen starts swelling and vertical displacements are recorded until the
expansion is completed and no vertical movement is observed (Fig 3.22). Eventually,
vertical displacements are plotted against time.
The free swell ratio, also known as swell percent is defined as follows (Eqn 3.4):
Swell percent = iH 100H ………………..Equation 3.4
Where ∆H is height difference which is between initial height and final height
f iH H H
iH = Initial height of the sample
fH = Final height of the sample
Page 96
72
Figure 3.20 Spacers used to compact samples
Figure 3.19 Hydraulic jack used to compact samples for free swell test and
prepared test sample
Page 97
73
Figure 3.21 A view of free swelling test
Figure 3.22 A view of test samples after swell completion
3.4.3 Friction of Molds
To determine the friction stress of the inner section of the molds, prior to soil
specimen compaction, the inner surface of the mold is coated with a low-friction
material then test specimens are compacted in three steps with a maximum dry
density at optimum water content, after 24 hours of curing. The specimen is loaded
gradually by use of triaxial shear set up, the load at which the sample begins to move
is recorded as friction force ( fF ). Friction stress is determined as the ratio of friction
Page 98
74
stress ( f ) to side area ( sA ) ( Eqn 3.5). For all test samples, the ratio of friction
stress to swell pressure is about than 12%.
f sf F A ………………..Equation 3.5
s 2 r tA ………………..Equation 3.6
Where;
f : Friction Stress
sA : Side area
fF : Friction Force
3.5 Free Swell Index Test, Experimental Procedures and Equipment
In 1959 a more convenient and quick method was suggested by Mohan and Goel
(1959) to assess the free swell behavior of expansive soil. According to Indian
standard (IS: 2720 ,Part XL, – 1977) this method consists of pouring 10 gr oven-dry
soil passing No.40 sieve separately into two glass graduate cylinders of 100 ml
capacity, one cylinder is filled with distilled water and the others containing kerosene
up to 100 ml. To remove entrapped air of suspension it is essential to shake or stir the
suspension gently with a glass rod. The final volume of the soil in each cylinder is
read out after they attain the state of equilibrium (for not less than 24hours)
Free swell or differential free swell, also termed as free swell index is expressed as
percentage as follows (Eqn 3.7):
Free swell index percent = d k k 100V V V ……………….Equation 3.7
Where;
dV = The volume of soil specimen read from the graduated cylinder containing
distilled water.
Page 99
75
kV = The volume of soil specimen read from the graduated cylinder containing
kerosene
Some precautions should be mentioned in case of highly expansive soils such as
Sodium bentonites. The sample can be 5 gr instead of 10 gr or alternatively 250 ml
capacity cylinders can be used for 10 gr of samples.
In this study some challenges are encountered through performance of experiments
according to highly expansive test samples. To work out these challenges some
changes were applied in the experimental procedures.
Inasmuch as, highly expansive soils exhibit quick reactions with water, a layer of
mud is formed while pouring water. This layer prevents water penetration to lower
part of the specimen, Water penetration blockage causes disturbance in the
completion of sample free swell (Fig 3.23).
To work out this problem a glass rod was utilized to stir the suspension to enable
lower levels of the specimen to access water in order to swell, because of the particle
adhesion to cylinder body and glass rod, and soil particle pallets this alternative was
not useful. The process used to provide water accessibility for all soil particles is
using 250 ml capacity cylinder and pouring 10 gr specimens in multiple stages. After
each soil pouring stage the cylinder was capped by small rubber stopper and the
solution was agitated by turning the cylinder upside down in back for few times.
Finally, allow the suspension to attain the state of equilibrium, which may takes
about few days.
In this study, due to lack of Kerosene, Gasoline was used. The molecular formulas of
Kerosene can range from C12H26 to C15H32, on the other hand Gasoline possesses
molecular formula of C8H18. The only difference between Kerosene and Gasoline is
the molecular weight of these chemical compounds. Since there is no reaction
between Gasoline and soil particle molecules, due to lack of Kerosene, Gasoline was
used instead of Kerosene to quantify the volume of dry soil during this study (Fig
3.24).
Page 100
76
In the case of samples with significant amount of kaolinite the presented method
yields negative value for free swell index. To eliminate this problem a Modified free
Swell Index method (MFSI) was proposed by Sirdharan (1985). MFSI is defined as
the ratio of Vd to dry weight of test sample (10 gr). In this study, due to presence of
kaolinite, MFSI of samples are assessed instead of FSI.
Figure 3.23 Formation of mud which prevent water penetration into lower layers
Figure 3.24 A view of free swell index test and use of Gasoline instead of Kerosene
Page 101
77
3.6 Methylene Blue (MB) Test, Experimental Procedures and Equipment
Methylene Blue test is conducted according to French standard NF P 94-068
(AFNOR, 1993). The setup used to perform MB test is given in Figure 3.25.
The Methylene blue used in this study is identified with the chemical formula:
C16H18N3SCl. Methylene blue adsorption (MBA) test is a simple and reliable
measure of the clay particle surface area, which is influenced by clay type and helps
to obtain information on the presence and properties of clay minerals in specimen.
Preparation of Methylene blue dye includes mixing 10±0.1 g of methylene blue in 1L
of distilled water in a beaker for 30 minutes. A total 30 gr of oven dried soil, sieved
through sieve No.40, in 200 ml distilled water is placed in a beaker and the
suspension in prepared by mixing soil-water mixture for 5 minutes at 700 rpm
(Çokça, 1991). After adjusting the mixer speed to 400 rpm, the next step is to add
5ml of methylene blue solution to the soil suspension and mix it for 1 minute at 400
rpm, a drop of the solution is taken using a pipette and dropped onto the filter paper
and subsequently occurrence of blue ring is checked. The filter paper should be
supported in such a way that the wetted surface does not touch any liquid or solid.
Systematically 5 ml methylene blue solution is added to the soil suspension with 1
minute interval until a halo of light blue dye surrounds the dark blue spot on the filter
paper. By detection of the light blue ring that surrounds the spot the solution should
be mixed for 5 minutes without adding any methylene blue to solution. At the end of
each minute a drop is taken from the solution to determine the stability of the light
blue halo. In the case of blue ring disappearance, 2 ml of methylene blue solution is
added to the soil-water-methylene blue mixture with 1 minute intervals to follow the
same procedure (Figure 3.26).
The equation 3.8 is used to calculate the methylene blue value for 100 gr of soil.
MBV (g /100g) = V/f …………….Equation 3.8
Page 102
78
Where,
V = volume of methylene blue solution injected to the soil solution (ml)
f = dry weight of the sample used (g)
Figure 3.25 Methylene blue test setup
Figure 3.26 Methylene blue stain test flow diagram (Türköz and Tosun, 2011)
Page 103
79
3.7 Swelling Pressure Test, Experimental Procedure and Equipment
The swelling pressure is defined as the maximum external load which should be
exerted to the soil to prevent expansive soil from any more deformation while
wetting.
In general, the conventional consolidometer setup is used by geotechnical engineers
in laboratories to evaluate and measure the magnitude of swelling pressure caused by
One-Dimensional wetting-induced expansion (Figure 3.27).
After 24 hour of curing specimens at optimum water content to have homogenous
samples, specimens were compacted with maximum dry density in holding ring via
hydraulic jack and metal spacers (Fig 3.28). The compacted specimen has 20 mm
height and 50 mm diameter. Porous stones, completely air-dried after being boiled
for 10 minutes, are embedded at the bottom and top of the specimen with ring-shaped
filter papers. The ring containing the compacted specimen is placed in circular fiber
glass-made cylinder. Before the submergence of the specimen in water, load
applicator bar is adjusted and dial gage is reset to zero in order to measure the
vertical displacement of compacted specimen by penetration of water. Finally,
Ankara potable tap water is used to soak the specimen. By the start of the vertical
deformation, pressure is added in small increments to prevent swelling. This process
continues until the specimen ceases to heave. Whenever no deformation (or less than
0.05 mm) is observed for few hours, the experiment is completed and the total
pressure applied to prevent sample expansion is referred as swelling pressure. As it
was acknowledged before, the test used to determine swelling pressure is termed as
Zero Swell Test (ZST) (Basma et al, 1995; and Fattom and Barakat, 2000).
Page 104
80
Figure 3.27 A view of conventional consolidometer setup
Figure 3.28 A View of Static Compaction with the Hydraulic Jack
Page 105
81
3.8 Test Results
In order to obtain exact results all experiments were performed at least three times.
Since all results were close, the outcomes of final experiments are submitted as final
results. This section includes figures presenting the correlation between sample types
and their index properties (Fig 3.29 to fig 3.40). In addition, the correlations between
test samples and Free swell percent, Modified free swell index, Methylene blue value
and swelling pressure are evaluated. The figures show the results of experiments for
artificial test samples.
Figure 3.29 Clay Content vs Bentonite Content
0
10
20
30
40
50
60
0 10 20 30 40 50
Cla
y S
ize
Fra
ctio
n (
%)
Test Samples Based on Bentonite Percentage (%)
Page 106
82
Figure 3.30 Liquid limit vs Sample types
Figure 3.31 Plastic limit vs Sample types
0
50
100
150
200
250
300
0 10 20 30 40 50
Liq
uid
Lim
it (
%)
Test Samples Based on Bentonite Percentage (%)
0
20
40
60
80
100
120
140
0 10 20 30 40 50
Pla
stic
Lim
it (
%)
Test Samples Based on Bentonite Percentage (%)
Page 107
83
Figure 3.32 Shrinkage limit vs Sample types
Figure 3.33 Plasticity index vs Sample types
0
5
10
15
20
25
30
35
0 10 20 30 40 50
Sh
rin
kage
Lim
it (
%)
Test Samples Based on Bentonite Percentage
0
20
40
60
80
100
120
140
0 10 20 30 40 50
Pla
stic
ity
In
dex
(%)
Test Samples Based on Bentonite Percentage (%)
Page 108
84
Figure 3.34 Maximum dry density vs Sample types
Figure 3.35 Optimum water content vs Sample types
1.15
1.2
1.25
1.3
1.35
1.4
1.45
0 10 20 30 40 50
Ma
xim
um
Dry
Den
sity
(g
r/cm
^3
)
Test Samples Based on Bentonite Percentage (%)
0
5
10
15
20
25
30
35
40
0 10 20 30 40 50
Op
tim
um
Wa
ter C
on
ten
t (%
)
Test Samples Based on Bentonite Percentage (%)
Page 109
85
Figure 3.36 Specific gravity vs Sample types
Figure 3.37 Swell Potential vs Sample types
2.35
2.4
2.45
2.5
2.55
2.6
2.65
2.7
2.75
2.8
0 10 20 30 40 50
Sp
ecif
ic G
ravit
y
Test Samples Based on Bentonite Percentage
0
50
100
150
200
250
0 10 20 30 40 50
Sw
ell
Po
ten
tia
l (%
)
Test Sample Based on Bentonite Percentage (% )
Page 110
86
Figure 3.38 MFSI vs Sample types
Figure 3.39 M.B.V Sample types
0
2
4
6
8
10
12
14
16
18
20
0 10 20 30 40 50
M.F
.S.I
(cm
^3/g
r)
Test Samples Based on Bentonite Percentage (%)
0
2
4
6
8
10
12
14
0 10 20 30 40 50
M.B
.V (
gr/
100gr)
Test Samples Based on Bentonite Percentage (%)
Page 111
87
Figure 3.40 Swelling pressure vs Sample types
Table 3.2 Test samples expansivity classification based on swell potential according
to criteria proposed by Holtz and Gibbs
Tests Soil Samples Soil
Expansivity
100% Kaolinite Low
90% Kaolinite+10%
Bentonite very high
80% Kaolinite+20%
Bentonite very high
70% Kaolinite+30%
Bentonite very high
60% Kaolinite+40%
Bentonite very high
50% Kaolinite+50%
Bentonite very high
Ankara Clay Type 1 Low
Ankara Clay Type 2 High
0
50
100
150
200
250
300
350
400
0 10 20 30 40 50
Sw
elli
ng
Pre
ssu
re (
kP
a)
Test Samples Base on Bentonite Percentage (%)
Page 112
88
Table 3.3 Correlation Matrix A
Sample
Type
Swell
Potential
According
to Free
Swell
Percent
(Sp) (%)
Modified
Free
swell
Index
(M.F.S.I)
(cm3/gr)
Methylene
Blue
Value
(M.B.V)
(g/100g)
Cation
Exchange
Capacity
(C.E.C) (meq/100
g)
Specific
Surface
Area
(S.S.A)
(m2/gr)
Swelling
Pressure
(P)
(kPa)
0%B+100%K 9 2,4 1,23 2,75 25,81 62,11
10%B+90%K 60 4 3,5 7,8 73,25 118,68
20%B+80%K 105 5,2 6 13,38 125,58 196,11
30%B+70%K 153 13,4 8,56 19,1 179,3 262,91
40%B+60%K 196 18,2 11,1 24,75 232,32 328,91
50%B+50%K 227 18,8 13,16 29,36 275,58 348,85
Natural Soil
Type 1 3 1,7 8 17,84 167,44 28,38
Natural Soil
Type 2 21 2,3 8,5 18,95 177,9 83,34
Table 3.4 Correlation Matrix B
Sam
ple
Typ
e
Sh
rin
kage
Lim
it (
SL
)
(%)
Liq
uid
Lim
it
(LL
) (%
)
Pla
stic
Lim
it
(PL
) (%
)
Pla
stic
ity
Ind
ex (
PI)
(%)
Cla
y S
ize
Fra
ctio
n (
CC
)
(%)
Act
ivit
y
Sp
ecif
ic
Gra
vit
y (
Gs)
Maxim
um
Dry
Den
sity
(cm
3/g
r)
Op
tim
um
Wate
r
Con
ten
t (%
)
0%B+100%K 31,61 45,64 44,45 1,19 37 0,03 2,74 1,41 29
10%B+90%K 27,28 72,86 58,22 14,64 39 0,38 2,70 1,36 29,4
20%B+80%K 21,34 112,76 78,82 33,94 44 0,77 2,65 1,34 30,4
30%B+70%K 16,56 158,64 101,22 57,42 47 1,22 2,60 1,3 32,6
40%B+60%K 16,34 198,76 115,46 83,30 49 1,70 2,56 1,26 36,2
50%B+50%K 16,25 249,51 127,62 121,89 55 2,22 2,50 1,24 37,2
Natural Soil
Type 1 9,60 64,43 56,18 8,25 57 0,14 2,68 1,38 33,8
Natural Soil
Type 2 10,93 86,51 70,32 16,19 53 0,31 2,74 1,4 32,5
Page 113
89
CHAPTER 4
1. ANALYSIS OF RESULTS AND DISCUSSION
4.1 Introduction
The aim of this chapter is to analyze and discuss the experimental results. The
correlations between soil fundamental properties, soil swell potential and soil swell
pressure are discussed in order to obtain a comprehensive appreciation of swelling
behavior of expansive soils. Additionally, the relations between results of common
soil swelling tests are evaluated to present a general understanding of soil swelling
behavior, swell potential and swelling pressure.
This chapter is organized into the following sub-sections:
Assessment and discussion of the fundamental properties of test samples.
Evaluation and discussion of the swelling behavior of test samples,
containing analysis of the relations between the test samples, mixtures of
bentonite and kaolinite in different percentages, and the results of the soils
expansion tests such as, Free swelling test, Modified free swell index test,
Methylene blue test and Swelling pressure test.
Develop the correlation between the swelling behavior of test samples (swell
potential and swelling pressure) and fundamental properties of test samples.
Additionally, the relations between swelling behavior and MBV, MFSI and
some of the index properties of test samples are investigated.
Page 114
90
4.2 Analysis and Discussion of the Fundamental Properties of the Test samples
As it was acknowledged before, soil index properties, such as liquid limit and
plasticity index, are affected by the type and amount of clay minerals and the
percentage of clay fraction. Also, swelling behavior of soils, swell potential and
swelling pressure, are influenced by index properties of soils. One of the common
methods to predict swelling properties of expansive soils is indirect method,
involving use of formulated correlations based on basic soil properties. In this study,
several laboratory experiments are conducted on the test samples to investigate their
index properties and the existent correlation between obtained results and swelling
characteristics of test samples are explored.
As expected, the clay content increases in samples with higher bentonite percentage
(Fig 4.1). Also the liquid limit and the plasticity index increase significantly with the
bentonite content (Fig 4.2; Fig 4.3). Subsequently the increase in the activity of test
samples with higher bentonite fraction is rational (Fig 4.4). Since bentonite has high
tendency to water retention, obtained results confirm the suitability of using
bentonite as an artificial tool to increase the Atterberg limit of test samples, except
maximum dry density.
The optimum water content increases as bentonite content of the test samples
increases (Fig 4.5). Test samples with higher bentonite fraction possess lower
maximum dry density (Fig 4.6) and optimum water content decreases as the
maximum dry density increases (Fig 4.7).
Page 115
91
Figure 4.1 Clay Content vs Bentonite Content
Figure 4.2 Liquid Limit vs Test Samples
y = 0.3514x + 36.381 R² = 0.9787
0
10
20
30
40
50
60
0 20 40 60
Cla
y S
ize
Fra
ctio
n (
%)
Test Samples Based on Bentonite Percentage (%)
Artificial Samples
Linear (ArtificialSamples)
y = 4.1227x + 36.629 R² = 0.9932
0
50
100
150
200
250
300
0 20 40 60
Liq
uid
Lim
it (
%)
Test Samples Based on Bentonite Percentage (%)
Artificial Samples
Linear (ArtificialSamples)
Page 116
92
Figure 4.3 Plasticity Index vs Test Samples
Figure 4.4 Activity vs Test Samples
y = 2.3799x - 7.4338 R² = 0.972
-20
0
20
40
60
80
100
120
140
0 20 40 60
Pla
stic
ity
In
dex
(%)
Test Samples Based on Bentonite Percentage (%)
Artificial Samples
Linear (ArtificialSamples)
y = 0.0438x - 0.0432 R² = 0.9949
-0.5
0
0.5
1
1.5
2
2.5
0 20 40 60
Act
ivit
y
Test Samples Based on Bentonite Percentage (%)
Artificial Samples
Linear (ArtificialSamples)
Page 117
93
Figure 4.5 Optimum Water Content vs Test Samples
Figure 4.6 Maximum Dry Density vs Test Samples
y = 0.1817x + 27.924 R² = 0.9312
0
5
10
15
20
25
30
35
40
0 20 40 60
Op
tim
um
Wa
ter C
on
ten
t (%
)
Test Samples Based on Bentonite Percentage (%)
Artificial Samples
Linear (ArtificialSamples)
y = -0.0034x + 1.4033 R² = 0.9876
1.22
1.24
1.26
1.28
1.3
1.32
1.34
1.36
1.38
1.4
1.42
0 20 40 60
Ma
xim
um
Dry
Den
sity
(g
r/cm
^3
)
Test Samples Based on Bentonite Percentage (%)
Artificial Samples
Linear (ArtificialSamples)
Page 118
94
Figure 4.7 Optimum Water Content vs Maximum Dry Density
4.3 Analysis and Discussion of the Free Swelling Test Results
Determination and quantifying of swelling potential of expansive soils possess high
degree of importance in the geotechnical engineering. As it was stated, the
assessment of swelling behavior of such soils includes both direct and indirect
measurements. The direct methods which submit more exact information about
swelling parameters of expansive soils involve the physical measurements of swell
potential and the pressure exerted by soil expansion. However, the formulated
correlations based on fundamental properties of expansive soils are proposed as
indirect methods to predict the swelling parameters of expansive soils including
swell potential and swell pressure.
A number of empirical models suggested to predict swell potential are presented in
table 4.1. These correlations are used to for the comparison of the equations
developed by this study.
33.8 32.5
y = -52.791x + 102.06 R² = 0.9199
0
5
10
15
20
25
30
35
40
1.2 1.25 1.3 1.35 1.4 1.45
Op
tim
um
Wa
ter C
on
ten
t (%
)
Maximum Dry Densit (gr/cm^3)
Artificial Samples
Natural Sample Type 1
Natural Sample Type 2
Linear (ArtificialSamples)
Page 119
95
Table 4.1 Empirical correlations for predicting the swelling potential by various
researchers.
Note:
(%)
Cc: Clay Content (%)
: Initial Water Content (%)
: Activity
There is special consideration in previous correlations to clay content and activity of
expansive soil, which have a key influence on soils demonstrating swelling behavior.
Multiple regressions were performed to obtain a predictive correlation between the
parameters considered through this study. Various mathematical functions were
employed to analyze the correlations. Statistically, the linear functions proved to be
the most precise among all and regression equations were established between index
properties and swelling potential and swelling pressure, also the regression between
swell potential and common swell determination techniques are assessed.
In this study, the presented prediction model (model 1) incorporates the maximum
dry density, optimum moisture content (as initial moisture content) and soil activity
as the key parameters which affect swelling potential of test samples (Eqn 4.1). Since
soil activity represents liquid limit, plastic limit and clay content of test samples, the
correlation model which incorporates this factor with optimum moisture content and
Predictive Model Author
Muntohar (2000)
Nayak and Christensen (1971)
Seed et al (1962)
7.518 + 0.323 (Cc)
= (2.29* ) ( ) (Cc/ ) + 6.38
= (3.6* ) ( )
Page 120
96
maximum dry density present a comprehensive prediction of swelling parameters
(swelling potential and swelling pressure) based on soil index properties.
Moreover, a relatively new approach of common swell determination tests has been
adopted and a correlated model (model 2) is proposed based on the results obtained
from the Modified free swell index test (MFSI), Methylene blue test (MBV),
Maximum dry density and optimum water content, as initial water content(Eqn 4.2).
The proposed correlations are established using Excel 2010 software at 95%
confidence level.
Both correlations were proved to be statistically acceptable.
cp 1 2 3 4 idS a a a a WA ……………………Equation 4.1 (Model 1)
p 1 2 3 4 5 idMFSI MBVS b b b b b W ...........Equation 4.2 (Model 2)
Where;
pS : Swell Potential (The ratio of the amount of swell to the original height of the test
sample expressed as a percentage) (%)
cA : Activity
d : Maximum Dry Density ( )
iW : Initial Water Content (Optimum water content) (%)
MFSI: Modified Free Swell Index ( /gr)
MBV: Methylene Blue Value (gr/100gr)
Table 4.2 Intercepts, coefficients and regression statistics of correlation equations
Note:
R2
: R Square
S: Standard Error
Equations Intercept
Equation 4.1 _ S=7.95
Equation 4.2 S=3.42
Coefficients Regression Statistics
=0.996
=0.999
=1404.476 =47.203 =-907.305
=598.009 =0.825 =15.731 =-335.768 =-4.714
Page 121
97
According to bentonite tendency for moisture retention, with increasing percentage
of bentonite a drastic increase was observed in the swell potential value of test
samples due to water adsorption and subsequent volume increase (Fig 4.8). The
correlations between swell potential and samples index properties such as activity,
maximum dry density and optimum water content, as initial moisture content, are
discussed below.
As the particle size decreases the specific surface area, the parameter controlling how
much wetting is required to transfer a soil from one phase to another such as across
the liquid limit or the plastic limit, increases which results in increase of attracted
water to the soil surface. On the basis of this reasoning the Activity, the ratio of
plasticity index to percent of clay-sized particle, is proposed as a parameter to
determine the volume changes of soils when wetted and dried.
In this study the test samples with higher percentage of bentonite have higher
fraction of the sizes smaller than 0.002 mm, the subsequent increased specific
surface area causes more moisture adsorption and resultant higher swell potential.
Hence high swell potential is expected as the activity of test samples increases (Fig
4.9). As it was stated before, the mixtures with higher bentonite percentages possess
lower maximum dry density, and higher swell potential (Fig. 4.10). Basma (1995)
and Rashid (2013) reported that decreasing water content of the test samples to an
optimized level enhances the swelling properties (swell potential and swelling
pressure) of all swelling soils. The results obtained through this study confirm the
presented consequence (Fig 4.11).
Page 122
98
Figure 4.8 Swell Potential vs Bentonite Content
Figure 4.9 Swell Potential vs Activity
y = 4.4171x + 14.571 R² = 0.9952
0
50
100
150
200
250
0 20 40 60
Sw
ell
Po
ten
tia
l (%
)
Test Sample Based on Bentonite Percentage (% )
Artificial Samples
Linear (ArtificialSamples)
3 21
y = 99.803x + 19.927 R² = 0.9815
0
50
100
150
200
250
300
0 0.5 1 1.5 2 2.5
Sw
ell
Po
ten
tia
l (%
)
Activity
Artificial Samples
Natural Sample Type 1
Natural Sample Type 2
Linear (ArtificialSamples)
Page 123
99
Figure 4.10 Swell Potential vs Maximum Dry Density
Figure 4.11 Swell Potential vs Initial Water Content
3 21
y = -1289.8x + 1825.4 R² = 0.9932
0
50
100
150
200
250
1.2 1.25 1.3 1.35 1.4 1.45
Sw
ell
Po
ten
tia
l (%
)
Maximum Dry Density (gr/cm^3)
Artificial Samples
Natural Sample Type 1
Natural Sample Type 2
Linear (Artificial Samples)
3
21
y = 22.471x - 604.56 R² = 0.9132
0
50
100
150
200
250
0 10 20 30 40
Sw
ell
Po
ten
tia
l (%
)
Initial Water Content (%)
Artificial Samples
Natural Sample Type 1
Natural Sample Type 2
Linear (Artificial Samples)
Page 124
100
In this part of the research, the correlations between swell percent and other common
swell determination tests are evaluated. The results of the performed experiments
exhibit that there are direct relationships between swell potential and MFSI, MBV
and swelling pressure.
As it was acknowledged in Chapter 2 Modified free swell index test is a method to
assess the swell potential of soils based on the reactions between water molecules
and soil particles without any external load. The increasing bentonite percentage in
test samples results in more volume change due to bentonite tendency to adsorb
water molecules. Thus the test samples with high percentage of bentonite possess
higher MFSI (Fig 4.12).
MBV of mixtures with higher percentage of bentonite is expected to increase
according to high cation exchange capacity of a bentonite. Hence, if MBV is plotted
versus swell potential an ascending slope is expected with increase in swell potential
due to presence of increasing bentonite percentage of test samples (Fig 4.13).
P, swelling pressure, is defined as the load per unit area needed to prevent increase in
height of the test sample upon water addition. So it can be inferred that the source of
exerted pressure due to volume change in test samples is water adsorption occurs via
soil particle. Bentonite tendency to react with water molecules is the main reason of
high swelling pressure caused by this clay. As expected Fig 4.14 demonstrates
increase in swell potential as swell pressure increases.
Page 125
101
Figure 4.12 Swell Potential vs MFSI
Figure 4.13 Swell Potential vs MBV
3
21
y = 10.804x + 13.363 R² = 0.9266
0
50
100
150
200
250
0 5 10 15 20
Sw
ell
Po
ten
tia
l (%
)
MFSI (gr/cm^3)
Artificial Samples
Natural Sample Type 1
Natural Sample Type 2
Linear (ArtificialSamples)
3 21
y = 18.193x - 7.0513 R² = 0.9968
0
50
100
150
200
250
0 5 10 15
Sw
ell
Po
ten
tia
l (%
)
MBV (gr/100gr)
Artificial Samples
Natural Sample Type 1
Natural Sample Type 2
Linear (ArtificialSamples)
Page 126
102
Figure 4.14 Swell Potential vs Swelling Pressure
4.3.1 Validation of the Swell Potential (Sp) Models
In this part of the study the validity of the presented correlations are considered.
Experimental results of swell potential of artificial test samples are plotted against
the predicted values of the same based on activity, maximum dry density and initial
water content (Fig 4.15). Also, the graphical comparison between experimental and
predicted results of swell potential base on MFSI, MBV, Maximum dry density and
Initial water content is made (Fig 4.16).
Graphical comparisons show that the scatter of result points largely follows the trend
of 1:1 line. For both models, a conservative prediction is revealed when the
predictive values are compared with the experimental values of the same.
Conclusively a good correlation between predictive and experimental results
acknowledges the suitability of linear correlation in the regression analysis for the
current test results. According to the predictive models the correlation is made based
upon one constant and three variables, whereas, the swelling behavior of test samples
3 21
y = 0.7183x - 32.728 R² = 0.9935
0
50
100
150
200
250
0 100 200 300 400
Sw
ell
Po
ten
tia
l (%
)
Swelling Pressure (kPa)
Artificial Samples
Natural Sample Type 1
Natural Sample Type 2
Linear (ArtificialSamples)
Page 127
103
are controlled by many variables in actual, accordingly, deviation of some of data
points from 1:1 line is justified.
Figure 4.15 Comparison between experimental and predicted values of swell
potential from model 1
Figure 4.16 Comparison between experimental and predicted values of swell
potential from model 2
20.722
15.490
y = 0.9963x + 0.4609 R² = 0.9963
0
50
100
150
200
250
0 50 100 150 200 250
Sp
By C
orr
elati
on
(%
)
Sp by Experiment (%)
Artificial Samples
Natural Sample Type 1
Natural Sample Type 2
Linear (ArtificialSamples)
102.566
110.340
y = 0.9997x + 0.0549 R² = 0.9997
0
50
100
150
200
250
0 50 100 150 200 250
Sp
By C
orr
elati
on
(%
)
Sp by Experiment (%)
Artificial Samples
Natural Sample Type 1
Natural Sample Type 2
Linear (ArtificialSamples)
Page 128
104
Figure 4.17 shows the comparison between the results of swell potential obtained
from currently proposed correlation and the results of swell potential from the
predictive models proposed by Seed et all (1962), Muntohar (2000) and Nayak and
Christesen (1970). Graphical comparisons demonstrate a better correlation between
experimental values and the predicted values of the model developed in this study
than those from the correlations proposed by other researchers. It can be determined
that the incorporation of maximum dry density, beside activity and initial moisture
content, as variables in currently proposed correlated model has increased the
precision of prediction. The scatter of the data points plotted based on other proposed
correlations proves that the previous models largely underestimate the swell
potential.
Additionally, the results of swell potential from the experimental investigation are
compared with the results of the both suggested correlations simultaneously in Figure
4.18.The scatter of the data points plotted by the both of currently proposed models,
not only shows a good correlation with the experimental values, but also, represents
so small discrepancies between themselves.
Figure 4.17 Comparisons of experimental and predicted values of swell potential
from various models
y = 0.9963x + 0.4609 R² = 0.9963
0
50
100
150
200
250
300
0 100 200 300
Sp
By C
orr
elati
on
s (%
)
Sp by Experiment (%)
Author
Seed et al1962
Muntohar2000
Nayak andChristesen1970Linear (Author)
Page 129
105
Figure 4.18 Comparisons of experimental and predicted values of swell
potential from both currently proposed models
4.4 Analysis and Discussion of the Swelling Pressure (P) Test Results
The tremendous amount of pressure exerted by high plastic clays while swelling is
source of damages to light weight engineering structure such as shallow foundations
and pavements. In swelling soil studies determination and quantifying of swelling
pressure are a challenge to geotechnical engineers who design substructure upon this
type of soil. Similar to evaluation of swell potential, there are direct and indirect
techniques to assess the pressure exerted by expansive soil in the case of access to
water.
In spite of few direct methods to measure swelling pressure, one dimensional
consolidometer method is the most common method. However, geotechnical
designers utilize a number of empirical models, as indirect method, to predict the
swelling pressure. Extensive experimental investigation by Komornik and David
(1969) prepared on a number of undisturbed natural soil samples to develop a
predictive model for swelling pressure based on statistical analysis (Eqn 4.3).
0
50
100
150
200
250
0 50 100 150 200 250
Sp
By C
orr
elati
on
(%
)
Sp by Experiment (%)
Sp from Model 1 for ArtificialSample
Sp from Model 1 for NaturalSample Tyep 1
Sp from Model 1 for NaturalSample Type 2
Sp from Model 2 for ArtificialSamples
Sp from Model 2 for NaturalSample Type 1
Sp from Model 2 for NaturalSample Type 2
Linear (Sp from Model 1 forArtificial Sample)
Page 130
106
Log (P) = 2.132 + 0.0208 (LL) + 0.000665 (d ) - 0.0269 ( iW )…….Equation 4.3
Note:
LL: Liquid Limit (%)
d : Dry Density of soil Samples (kg/ )
iW : Water Content (%)
As was stated earlier a number of parameters influence swelling behavior of
expansive soils. In this study several tests were conducted to investigate the
contribution of initial compaction degree, initial moisture content and clay activity to
the swelling pressure. In addition, the relation between swelling pressure and other
swell determination techniques are explored. Additionally, an empirical predictive
model (model 3) is proposed to predict the swelling pressure based on index
properties of soils, moreover, other predictive model is developed based on MFSI,
MBV, d and iW (model 4) (Eqn 4.4; Eqn 4.5).
c1 2 3 4 idLog(P) c c c c WA ……………………Equation 4.4 (Model 3)
1 2 3 4 5 idLog(P) MFSI MBVd d d d d W ...........Equation 4.5 (Model 4)
Where;
P: Swelling Pressure (The load per unit area needed to prevent increase in height of
the test sample upon water addition) (%)
cA : Activity
d : Maximum Dry Density (g/cm3)
iW : Initial Water Content (Optimum water content) (%)
MFSI: Modified Free Swell Index (cm3/gr)
Page 131
107
MBV: Methylene Blue Value (gr/100gr)
Table 4.3 Intercepts, coefficients and regression statistics of correlation equations
Note:
R2: R Square
S: Standard Error
The analysis of experimental results are presented in series of plots providing a
comprehensive understanding of the swelling pressure of the selected expansive test
samples in this research. The swelling pressure and its relationship to bentonite
percentage and index properties of test samples can be observed from Figure 4.19 to
Figure 4.22.
The importance of the bentonite content of test samples on the swelling pressure
exerted by test samples determined by zero swell test is shown in Figure 4.19. All
specimens are compacted with an initial water content equal to optimum water
content at maximum dry density. As it was expected, the swelling pressure increases
as the bentonite percentage of test samples increase due to water adsorption of the
bentonite particles which results in samples volume changes.
The effect of activity on swelling pressure is presented in figure 4.20. As it was
explained before, Activity is referred as a parameter to specify the volume changes
of soils in the case of moisture accessibility. The observation approves that the
swelling pressure increases with the increase in activity. Figure 4.21 depicts the
swelling pressure results for various maximum dry densities. In all cases, the
associated decrease in swelling pressure is observed with increase in maximum dry
densities of the different specimens with increasing bentonite content. Similar to
Equations Intercept
Equation 4.4 _ S=0.073
Equation 4.5 S=0.083
Coefficients Regression Statistics
=0.975
=0.984
=14.155 =0.021 =-7.469 -0.063
=9.425 =0.007 =0.062 =-3.718 =-0.085
Page 132
108
swelling potential, the swelling pressure shows a tendency to increase with
enhancement in initial water content of the different specimens with increasing
bentonite content, which is equal to maximum dry density (Fig 4.22).
Figure 4.19 Swelling Pressure vs Bentonite Content
Figure 4.20 Swell Pressure vs Activity
y = 608.91x + 67.367 R² = 0.9821
0
50
100
150
200
250
300
350
400
0% 20% 40% 60%
Sw
elli
ng
Pre
ssu
re(k
Pa
)
Test Sample Based on Bentonite Percentage (% )
Artificial Samples
Linear (ArtificialSamples)
28.38
83.34
y = 137.29x + 75.052 R² = 0.9645
0
50
100
150
200
250
300
350
400
0 0.5 1 1.5 2 2.5
Sw
elli
ng
Pre
ssu
re (
kP
a)
Activity
Artificial Samples
Natural Sample Type 1
Natural Sample Type 2
Linear (ArtificialSamples)
Page 133
109
Figure 4.21 Swelling Pressure vs Maximum Dry Density
Figure 4.22 Swelling Pressure vs Initial Water Content
Variations of swelling pressure according to MFSI, MBV and Sp are assessed in
Figures 4.23; 4.24 and 4.25 respectively. As can be noted in test samples with higher
bentonite percentage, there are direct correlations between swelling pressure and
28.38
83.34
y = -1779.3x + 2565.3 R² = 0.9815
0
50
100
150
200
250
300
350
400
1.2 1.25 1.3 1.35 1.4 1.45
Sw
elli
ng
Pre
ssu
re (
kP
a)
Maximum Dry Density (gr/cm^3)
Artificial Samples
Natural Sample Type 1
Natural Sample Type 2
Linear (ArtificialSamples)
28.38
83.34
y = 31.097x - 790.01 R² = 0.9082
0
50
100
150
200
250
300
350
400
0 10 20 30 40
Sw
elli
ng
Pre
ssu
re (
kP
a)
Initial Water Content (%)
Artificial Samples
Natural Sample Type 1
Natural Sample Type 2
Linear (ArtificialSamples)
Page 134
110
MFSI, MBV and Sp. Based on the earlier interpretation higher cation exchange
capacity and consequently more volume change can be observed in test samples with
increase in bentonite content. Reasonably, incremental slope is expected in the
graphical assessments of the correlations between swelling pressure and MFSI, MBV
and Sp.
Figure 4.23 Swelling Pressure vs MFSI
Figure 4.24 Swelling Pressure VS MBV
28.38
83.34
y = 15.039x + 64.193 R² = 0.9324
0
50
100
150
200
250
300
350
400
0 5 10 15 20
Sw
elli
ng
Pre
ssu
re (
kP
a)
MFSI (cm^3/gr)
Artificial Samples
Natural Sample Type 1
Natural Sample Type 2
Linear (ArtificialSamples)
28.38
83.34
y = 25.136x + 37.149 R² = 0.9882
0
50
100
150
200
250
300
350
400
0 5 10 15
Sw
elli
ng
Pre
ssu
re (
kP
a)
MBV (gr/100gr))
Artificial Samples
Natural Sample Type 1
Natural Sample Type 2
Linear (ArtificialSamples)
Page 135
111
Figure 4.25 Swelling Pressure vs Swell Potential
4.4.1 Validation of the Swelling Pressure Models
In the face of the complicated behavior of expansive soil and the multiple parameters
that influence it, the ultimate aim would seem to evaluate the validation of the
models proposed to predict the swelling pressure of test samples. The validity of the
proposed correlations is considered by comparing the experimental values of
swelling pressure tests and the results obtained from predictive models (Fig 4.26;
4.27).
As can be noted from Figures 4.26 and 4.27, plotted data points which are so close
to 1:1 line show that the predictive models proposed in this study are capable of
estimating swelling pressure with acceptable accuracy.
28.38
83.34
y = 1.3831x + 46.702 R² = 0.9935
0
50
100
150
200
250
300
350
400
0 50 100 150 200 250
Sw
elli
ng
Pre
ssu
re(k
Pa
)
Swell Percent (%)
Artificial Samples
Natural Sample Type 1
Natural Sample Type 2
Linear (ArtificialSamples)
Page 136
112
Figure 4.26 Comparison between experimental and predicted values of swelling
pressure from model 3
Figure 4.27 Comparison between experimental and predicted values of swelling
pressure from model 4
1.721
1.657
y = 0.9793x + 0.0589 R² = 0.9751
0
0.5
1
1.5
2
2.5
3
0 1 2 3
Log p
By C
orr
elati
on
(k
Pa)
Log p by Experiment(kPa)
Artificial Samples
Natural Sample Type 1
Natural Sample Type 2
Linear (ArtificialSamples)
1.929
2.000
y = 0.9836x + 0.0502 R² = 0.9836
0
0.5
1
1.5
2
2.5
3
0 1 2 3
Log p
By C
orr
elati
on
(k
Pa)
Log p by Experiment (kPa)
Artificial Samples
Natural Sample Type 1
Natural Sample Type 2
Linear (ArtificialSamples)
Page 137
113
Graphical comparisons between the predicted values of swell potential from the
correlation proposed in this study and the predictive model proposed by Komornik
and David (1969) depict that, there is a better correlation between experimental
swelling pressure results and those obtained from currently proposed predictive
model, unlike previously proposed model by Komornik and David (4.28). In
addition, the values obtained from both of the swelling pressure predictive models
are compared with each other. The scatter of the data points exhibits the results based
on currently proposed correlations are in a good coordination with small
discrepancies (4.29).
Figure 4.28 Comparisons of experimental and predicted values of swelling
pressure from various models
0
1
2
3
4
5
6
7
8
0 1 2 3
Log p
By C
orr
elati
on
s (k
Pa)
Log p by Experiment (kPa)
Author
Komornik and David1969
Page 138
114
Figure 4.29 Comparisons of experimental and predicted values of swelling pressure
from both proposed models
0
0.5
1
1.5
2
2.5
3
0 1 2 3
Log p
By C
orr
elati
on
(k
Pa)
Log p by Experiment (kPa)
P from Model 1 for ArtificialSampleP from Model 1 for NaturalSample Tyep 1P from Model 1 for NaturalSample Type 2P from Model 2 for ArtificialSamplesP from Model 2 for NaturalSample Type 1P from Model 2 for NaturalSample Type 2Linear (P from Model 1 forArtificial Sample)
Page 139
115
CHAPTER 5
CONCLUSIONS AND RECOMMENDATIONS
5.1 Summary of Research and Contribution
Aim of this research was to quantitatively investigate the swelling mechanism of
expansive soil. In particular, the swelling behavior of test samples was studied by
means of two measurements; swelling potential and swelling pressure. Two factors
had been controlled to explore the swelling pressure and swelling potential during
the current study, maximum dry density and optimum water content, as initial water
content, of test samples.
The experimental investigation in current research had two parts one part to measure
the fundamental characteristics of test samples and another part consisting a series of
techniques such as Methylene blue test, Modified free swell index test, One-
dimensional free swell test and swelling pressure test to assess swelling behavior,
swell potential and swelling pressure, of test samples respectively.
Moreover, the experimental results are analyzed and correlations are developed and
the obtained values based on experimental investigation and currently proposed
predictive models are compared with the same based on previously suggested
predictive models.
Page 140
116
5.2 Conclusions
Experimental results in current study indicate that in artificial test samples the
clay content, liquid limit and plastic limit increase in samples with higher
bentonite percentage. Subsequently, there is a significant increase in plasticity
index and activity of test samples with higher bentonite percentage.
Unlike optimum water content, maximum dry density of artificial test
samples decrease while adding bentonite to kaolinite. Experimentally
obtained results indicate decline in shrinkage values of test samples with
increase in bentonite percentage. The measured values of specific gravity
indicate that with increase in bentonite percentage of artificial test samples,
specific gravity values decrease.
The obtained experimental results indicate that as the bentonite percentages
of test samples increase, swell potential and swelling pressure of test samples
increase. As expected, it is observed that with the addition of bentonite in the
kaolinite-bentonite mixtures swelling potential ( ) and swelling pressure (P)
of mixtures increase significantly. Additionally, it is noted that MBV and
MFSI increase with bentonite percentage in artificial test samples.
As the main aim of the current study, formulated correlations are developed
based on artificial test samples as indirect methods to predict swelling
parameters of test samples including swell potential and swelling pressure.
The accuracy of the presented predictive models are considered by graphical
comparison between values obtained from experiments and those based on
currently proposed models and good correlations are observed between them.
It can be inferred that the incorporation of maximum dry density beside
activity and optimum water content as initial moisture content in developed
models has enhanced the precision of prediction.
Current study prove the key influence of particles mineralogy on their
fundamental properties such as Atterberg limits, maximum dry density,
optimum water content, clay content and activity. Additionally, mineralogy
Page 141
117
of tests samples, especially in natural test samples, has key role in
determination of their swelling behavior, swell potential and swelling
pressure. The currently developed predictive models based on artificial test
samples, with different mineralogy form natural test samples, does not predict
swelling behavior of natural test samples with high accuracy, which proves
influence of the samples mineralogy on swelling behavior of them.
5.3 Recommendations for Future Study
Some of subjects and suggestions that could be pursued in the future research:
It should be considered that the current study focused mainly on mixtures of
bentonite and kaolinite in different percentages. The equations developed
through this study cannot be used for all specimens. Since the values
according to which predictive models are developed pertain to artificial test
samples, it is suggested to use more natural test samples with different
degree of swell potential to develop other correlations which can predict
swelling behavior of natural soils, swell potential and swelling pressure, more
exactly.
In the current study, two predictive models are developed based on some of
the fundamental properties of test samples and the other two predictive
models are based on swell determination tests (MBT, MFSI and Free swell
percent) maximum dry density and initial water content. Observations depict
that to develop more precise correlations, especially for natural samples, it is
recommended to determine their mineralogy and develop predictive models
that incorporate mineralogical properties of test samples.
The experimental data obtained in this research can be used to obtain
parameters for future analytical or numerical modeling.
As final conclusion, four predictive models are developed (Models 1,2,3,4)
Page 142
118
cp 1 2 3 4 idS a a a a WA …………………… (Model 1)
p 1 2 3 4 5 idMFSI MBVS b b b b b W ............ (Model 2)
c1 2 3 4 idLog(P) c c c c WA
…………………… (Model 3)
1 2 3 4 5 idLog(P) MFSI MBVd d d d d W
........... (Model 4)
Page 143
119
REFERENCES
Aecl. Environmental impact statement on the concept for disposal of Canada’s
nuclear fuel waste. Atomic Energy of Canada Limited Report, AECL-10711, COG-
93-1. 1994.
AFNOR. Mesure de la quantité et de l’activité de la fraction argileuse (Norme
Française NF pp. 68-94). Association Française de Normalization (ANFOR), La
Défense, Paris, France. 1993.
AFNOR (L’Association Francaise De Normalisation), Essai au bleu de methylene.
18–592, AFNOR 80181, Paris La Defence. 1980.
Altmeyerw. T. Discussion on engineering properties of expansive soils. Transactions
of ASCE, 121. 1956.
ASTM, Standard Test Method for Expansion Index of Soils. Annual Book of ASTM
Standards, PA 4829: 4-8. 1988.
ASTM, Standard Test Method for Expansion Index of Soils. Annual Book of ASTM
Standards, PA 4546: 2013.
ASTM, Standard Test Method for Laboratory Compaction Characteristics of Soil
Using Standard Effort, Annual Book of ASTM Standards, D698 - 12, 2012.
ASTM, Standard Test Method for Linear Shrinkage of Preformed High-Temperature
Thermal Insulation Subjected to Soaking Heat, Annual Book of ASTM Standards,
C356-10, 2010.
ASTM, Standard Test Method for Liquid Limit, Plastic Limit and Plasticity Index of
Soils, Annual Book of ASTM Standards, D4318, 2010.
ASTM, Standard Test Method for Particle-Size Analysis of Soils, Annual Book of
ASTM Standards, D422, 2007.
ASTM, Standard Test Methods for One-Dimensional Swell or Settlement Potential of
Cohesive Soils, Annual Book of ASTM Standards, D4546 – 08, Vol. 04 -08, pp. 733-
738, 2008.
Attom, M. F., & Barakat, S. (2000, August).Investigation of three methods for
evaluating swelling pressure of soils. Environmental & Engineering Geoscience, pp.
293-299.
Page 144
120
Basma, A. A., Al-Homoud, A. S., and Malkawi, A. H. “Laboratory assessment of
swelling pressure of expansive soils,” Applied Clay Science, 9, 355-368. 1995.
Basma, A. A. Cyclic Swelling behavior of clays, Geotechnical Engineering Journal,
121-7, 562-565. 1995.
BS, Methods of Test for Civil Engineering Purposes Classification Tests, British
Standard Institution, BS1377, 2010.
Bureau of Iındıan standards; Indian Standard Classi cation and Identi cation of Soils
for General Engineering Purposes. BIS, NewDelhi, (Rearmed 1987), IS 1498. 1970
Carter M. and Bentley S.P., Correlations of Soil Properties, (London: Pentech Press,
UK). 1991.
Chen, F. H., Foundations on Expansive Soils, Elsevier Scientific Pub. Co.,
Amsterdam, 1975.
Chen, F. H., Development in Geotechnical Engineering 12: Foundations on
Expansive Soils. The Netherlands: Elsevier Scientific. 1975.
Chen, F. H., Foundation on swelling soils, Development on Geotechnical
Engineering 12. Elsevier Scientific Co, Amsterdam, 150-158. 1975.
Chiappone A, Marello S, Scavia C, Setti M., Clay mineral characterization through
the methylene blue test: comparison with other experimental techniques and
applications of the method. Can. Geotech. J., 41: 1168-1178. 2004.
Craig, R. F., Craig's Soil Mechanics, 7th Edition, Spon Press, London, 2004.
Çokca E., Birand AA. Determination of cation exchange capacity of clayey soils
by the methylene blue test. Geotech. Testing J., 16 (4): 518-524. (1993b).
Çokca E., Birand AA. Prediction of swelling potential of Ankara soils by methylene
blue test. Doğa-Turkish J. Eng. Environ. Sci., 17: 57-63. (1993a).
Çokça E., Swelling potential of expansive soils with a critical appraisal of the
identification of swelling of Ankara soils by methylene blue tests. PhD. Thesis,
Department of Civil Engineering, Middle East Technical University, Ankara,
Turkey, p. 246. 1991.
Çokça, E., Relationship between methylene blue value, initial soil suction and swell
percent of expansive soils. Turkish J. Eng. Environ. Sci., 26: 521-530. 2002.
Page 145
121
Çokça, E., and Birand, A., “Determination of Cation Exchange Capacity of Clayey
Soils by the Methylene Blue Test”, Geotechnical Testing Journal, GTJODJ, 16, 4,
518-524, 1993.
Çokça, E., Use of Class C Fly Ashes for the Stabilization of an Expansive Soil,
Journal of Geotechnical and Geoenvironmental Engineering, Vol. 127, No. 7, pp.
568-573, 2001.
Das, B. M., Principles of Geotechnical Engineering. Stamford, CT. Cengage
Learning. 2009.
Das, B. M., Advanced Soil Mechanics, 3rd Edition, CRC Press, New York, 2008.
Das, B. M., Principles of Foundation Engineering, 4th Edition, PWS Publishing,
1999.
Dawson, R. F., “Movement of small houses erected on an expansive clay soil,” Proc.
3 rd Int. Conf. Soil Mech. Found. Eng., 1:346-350. 1953.
Deer, W.A., Howie, R.A., Zussman, J., An introduction to the rock-forming minerals
(2 ed.). Harlow: Longman. 1992.
El-Sohby, M. A., and El-Sayed, A. R., “Some Factors Affecting Swelling Of Clayey
Soils,” Geotechnical Engineering, Vol. 12, 19-39. 1981.
Ergüler, Z.A. and Ulusay, R., A simple test and predictive models for assessing
swelling potential of Ankara (Turkey) Clay. Engineering Geology, 76, 331–352.
2003.
Fattom, M., and Barakat, S., “Investigation of Three methods for Evaluating
Swelling pressure of Soils,” Environmental & Engineering Geoscience, Vol. VI, No.
3, pp. 293-299. 2000.
Graham, J., Chandler, N. A., Dixon, D. A., Roach, P. J., To, T., & Wan, A. W. L.,
The Buffer/Container Experiment: Results, synthesis, issue. Report AECL-11746,
COG-97-46-1.Atomic Energy Canada Limited, Ontario. 1997.
Güngör, A. G., Bursa Yöresi Şişebilen Kil Zeminlerin Yol Dolgularında Kullanılması
Amacı ile Uçucu Kül ile Islahı, M.S Thesis, Gazi University, FBE, 2002.
Hills JF, Pettifer GS., The clay mineral content of various rock types compared with
the methylene blue value. J. Chem. Tech. Biotechnol., 35A: 168-180. 1985.
Holtz, R. D., & Kovacs, W. D., & Sheahan, T. C., An Introduction to Geotechnical
Engineering, 2nd Edition, Pearson Education, Michigan, 2011.
Page 146
122
Holtz, W. G. and Gıbbs H. J. Engineering properties of expansive clays.
Transactions of ASCE, 121, 641-663. 1956.
Holtz, W. G. and Gibbs, H. J., Engineering properties of expansive clays:
Transactions, ASCE 121, 641-677. 1956.
Holtz, W.G., & Kovacs, W. G., An Introduction to Geotechnical Engineering.
Englewood Cliffs, NJ: Prentice-Hall. 1981.
Hosterman, J.W. and S.H. Patterson., Bentonite and Fuller's earth resources of the
United States. U.S. Geological Survey Professional Paper 1522. United States
Government Printing Office, Washington D.C., USA. 1992.
http://geosurvey.state.co.us/hazards/Swelling%20Soils/Pages/Definition.aspx
[January, 2016]
http://www.basementsystems.ca/foundation-repair/wall-cracks-repair/settlement
[January, 2016]
Israr, J., Development of correlations between index properties and swelling
characteristics of swelling soils, M.Sc. Thesis, Department of Civil Engineering,
University of Engineering and Technology Lahore, Pakistan. 2012.
Jennings, J. E. B., and Knight, K., “The Predıctıon Of Total Heave From The Double
Oedomoter Test,” Proc. Symp. Expansive Clays (South Africa Inst. Of Civil
Engineers, Johannesburg), Vol. 7, No. 9, pp. 13-19. 1957.
Jones, D. E., & Holtz, W. G., Expansive Soils - The Hidden Disaster, National
Emergency Training Center, 1973.
Keijzer, T. J., Chemical Osmosis in Natural Clayey Materials, Faculty of Earth
Sciences, Utrecht, 2000.
Koerner, R. M., Designing with Geosynthetics. NJ: Prentice Hall. 1998.
Komine, H., and Ogata, N., “Experimental study on swelling characteristics of
compacted bentonite,” Can. Geotech. J, 31, 478-490. 1994.
Komornik, A. and David, D., Prediction of swelling pressure of clays: J. ASCE, Soil
Mechanics and Foundation Division, SM No. 1, pp. 209-225. 1969.
Lambe, T.W. & Withman R. V., Soil Mechanics, John Wiley, New York. 1969.
Page 147
123
Lin, B., & Cerato, A. B. Prediction of expansive soil swelling based on four micro-
scale properties. The Bulletin of Engineering Geology and the Environment, 71-78.
(2012).
Mishra. A. K., Dhawan S., Rao. S. M., Analysis of Swelling and Shrinkage Behavior
of Compacted Clays, Geotechnical and Geological Engineering. Vol.26. No. 3. pp.
289-298. 2008.
Mitchell, J. K., & Soga, K., Fundamentals of Soil Behavior, 3rd Edition, John Wiley
& Sons, New York, 2005.
Muntohar, A. S., 2Prediction and classification of swelling clay soil. (eds), Swelling
soils recent advances in characterization and treatment, London, 25-36. 2000.
Murat Türköz and Hasan Tosun., The use of methylene blue test for predicting swell
parameters of natural clay soils. Scientific Research and Essays Vol. 6 (8), pp. 1780-
1792. 2011.
Murray, H. H., Applied Clay Mineralogy. Netherlands: Elsevier. 2007.
Murray, H. H., “Applied Clay Mineralogy: Occurrences, Processing And Application
Of Kaolins, Bentonites, Palygorskite-Sepiolite, And Common Clays,” Elsevier. 2007.
Murthy, V. N. S., Geotechnical Engineering: Principles and Practices of Soil
Mechanics and Foundation Engineering, CRC Press, New York, 2002.
N. V. Nayak and R. W. Chrıstensen., Swelliıng Characteriıstics Of Compacted
Expansive Soils. Clays and Clay Minerals, 1971, Vol. 19, pp. 251-261. Pergamon
Press. Printed in Great Britain. 1970.
Nelson, J., & Miller, D. J., Expansive Soils: Problems and Practice in Foundation
and Pavement Engineering, John Wiley & Sons, New York, 1992.
Nevins MJ, Weintritt DJ., Determination of cation exchange capacity by methylene
blue adsorption. Ceramic Bull., 46 (6): 587-592. 1967.
O’neıll, M. W., and Poormoayed, N., “Methodology for Foundations on Expansive
Clays,” Journal of the Geotechnical Engineering Division, American Society of Civil
Engineers, Vol. 106, No. GT12, pp. 1345 –1367. 1980.
Oweis, I. S., & Khera, R. P., Geotechnology of Waste Management, 2nd Edition,
PWS Publishing, Boston, 1998.
Pantet, A., Parriaux, A., Thelin, P., New method for in situ characterization of loose
material for landslide mapping purpose. Engineering Geology 94, 166–179. 2007.
Page 148
124
Pohl, Walter L., Economic geology: principles and practice: metals, minerals, coal
and hydrocarbons–introduction to formation and sustainable exploitation of mineral
deposits. Chichester, West Sussex: Wiley-Blackwell. 2011.
Popescu, M. E., A Comparison between the Behavior of Swelling and of Collapsing
Soils, Engineering Geology, Vol. 23, pp. 145-163, 1986.
Pusch, R., and Yong, R. N. “Microstructure of Smectite Clays and Engineering
Performance,” Taylor & Francis. (2006).
Scott, R. Principles of Soil Mechanics, Addison-Wesley Publishing Company, Inc.
(1963).
Seed, H, B., Woodward, R., J., & Lungren, R., Prediction of Swelling Potential for
Compacted Clays, Journal of the Soil Mechanics and Foundations Division, Proc. Of
the ASCE, pp. 53-87, 1962.
Shanker, N. B., Rao, A. S., and Swamy, A. S. R. “Swelling Behaviour of
Undisturbed and Remoulded Samples of Black Cotton Clay,” Indian Geotechnical
Journal, vol. 12, 152-159. (1982).
Shuai, F, Simulation of Swelling Pressure Measurements on Expansive Soils,
Doctoral Thesis, University of Saskatchewan. 1996.
Sridharana. Prakashk. Mechanism controlling the shrinkage limit of soils.
Geotechnical Testing Journal, ASTM, 21, No. 3, 240-250. 1998.
Sridharana., Raos. M., Murthyn. S. A rapid method to identify clay type in soils by
the free-swell technique. Geotechnical Testing Journal, ASTM, 9, No. 4, 193-203.
1986
Stavridakis I.E., Stabilization of problematic soils using cement and lime, Expansive
Soils Recent Advances in Characterization and Treatment. Taylor & Francis Group.
London. UK. pp. 384-397. 2006.
Taylor, R. K., Cation exchange in clays and mudrocks by methylene blue. J. Chem.
Technol. Biotechnol., 35A:195-207. 1985.
Thomas P.J, Baker J.C, Zelazny L.W, Hatch D.R. (2000). Relationship of map unit
variability to shrink-swell indicators. Soil Sci. Soc. Am. J., 64: 262-268. 1985.
Taylor, R, K., Cation exchange in clays and mudrocks by methylene blue. J. Chem.
Technol. Biotechnol., 35A:195-207.
Page 149
125
Tripathy, S., & Subba, Rao., Cyclic Swell - Shrink Behavior of a Compacted
Expansive Soil, Geotech Geol Eng 27, pp. 89-103, 2009.
Türköz, M., Sıkıştırılmış Şişen Killerin Mikroyapısal Değişiminde Şişme-Büzülme
Çevrimin Etkisi, Eskişehir Osmangazi Üniversitesi Mühendislik Mimarlık Fakültesi
Dergisi Cilt: XXII, Sayı 1, 2009.
Van Olphen. H., An Introduction to Clay Colloidal Chemistry, 2nd. Edition, Wiley
Inter Science. 1977.
Van der Merwe, D., H., The prediction of heave from plasticity index and the
percentage clay fraction of the soils. The Civil Engineer, South African Institution of
Civil Engineers, 6, 103-107. 1984.
Verhoef, P.N.W., The methylene blue adsorption test applied to geomaterials,
Memoirs of the centre of Engineering Geology in the Netherlands. Deltf Uviversity
of Technology, Geomat. 101: 2- 70. 1992.
Villar, M. V., and Lloret, A., “Influence of dry density and water content on the
swelling of a compacted bentonite,” Applied Clay Science, 39, 38-49. 2008.
White, W. A., Atterberg plastic limits of clay minerals: Am. Mineral., vol. 34, pp.
508-512. 1949.
Yevnin, A., and Zaslavsky, D., “Some factors affecting compacted clay swelling,”
Canadian Geotechnical Journal, Vol. 7, Issue 1, 79-89. 1970.
Yükselen Y, Kaya A., Suitability of the methylene blue test for surface area, cation
exchange capacity and swell potential determination of clayey soils. Eng. Geol., 102:
38-45. 2008.
Page 151
127
APPENDIX A
ANKARA POTABLE WATER AND ANKARA CLAY
PROPERTIES
Table A.1 Ankara potable tap water chemical characteristics
Parameter Ankara potable tap water
quality
PH 7.4
Aluminum (g/l) 26.2
Ammonium (mg/l) <0.06
Magnesium (mg/l) 9.6
Copper (mg/l) <0.003
Calcium (mg/l) 30.8
Potassium (mg/l) 3.2
Sodium (mg/l) 18.05
Iron (g/l) <5
Page 152
128
Table A.2 Summary of semi-quantitative whole-soil mineralogy of the samples from
Ankara clay with carbonate concretions based on XRD
Clay and Nonclay Minerals (%) Clay Minerals (%)
Calcite Quartz Feldspar Clay Smectite Illite Kaolinite
4.0-33.0 8.3-18.0 1.7-6.7 52.6-84.0 38.3-60.2 4.7-27.8 7.7-16.7
(14.6) (11.8) (4.3) (69.9) (49.3) (10.1) (11.7)
Proposed empirical predictive models to predict the swelling pressure based and
swell potential based MFSI, d and iW are presented as follow (Eqn A.1, Eqn A.2)
1 2 3 4 idLog(P) MFSIa a a a W ……..Equation A.1 (Model A.1)
p 1 2 3 4 idMFSIS b b b b W …………..Equation A.2 (Model A.2)
Table A.3 Intercepts, coefficients and regression statistics of correlation equation
Equations Intercept
Equation A.1 S=0.07
Equation A.2 S=10.71
Coefficients Regression Statistics
=14.173 = -7.462 =0.004 =0.068 =0.97
=1830.101 =0.162 =-1287.35 =-0.296 =0.99
Page 153
129
Figure A.1 Comparison between experimental and predicted values of swelling
pressure from model A.1
Figure A.2 Comparison between experimental and predicted values of swell
potential from model A.2
1.682
1.624
y = 0.9756x + 0.0555 R² = 0.9756
0
0.5
1
1.5
2
2.5
3
0 0.5 1 1.5 2 2.5 3
Log p
By C
orr
elati
on
(k
Pa)
Log p by Experiment (kPa)
Artificial Samples
Natural Sample Type 1
Natural Sample Type 2
Linear (ArtificialSamples)
43.813
18.549
y = 0.9932x + 0.8469 R² = 0.9932
0
50
100
150
200
250
0 50 100 150 200 250
Sp
By
Corr
elati
on
(%
)
Sp by Experiment (%)
Artificial Samples
Natural Sample Type 1
Natural Sample Type 2
Linear (ArtificialSamples)
Page 155
131
APPENDIX B
EXPERIMENTAL TEST RESULTS
This section consists of the correlation between the values obtained from
experimental investigation and analytic evaluation.
Figure B.1 S.S.A vs Test Samples
y = 508.51x + 24.846 R² = 0.9991
0
50
100
150
200
250
300
0% 10% 20% 30% 40% 50% 60%
Sp
ecif
ic S
urf
ace
Are
a (
m^
2/g
)
Test Samples Based on Bentonite Percentage (%)
Artificial Samples
Linear (Artificial Samples)
Page 156
132
Figure B.2 S.S.A vs Swell Potential
Figure B.3 S.S.A vs Swelling Pressure
y = 1.1471x + 8.5841 R² = 0.9968
0
50
100
150
200
250
300
0 50 100 150 200 250
Sp
ecif
ic S
urf
ace
Are
a (
m^
2/g
)
Swell Potential (%)
Natural Sample Type 1
Artificial Sample
Natural Sample Type 2
Linear (ArtificialSample)
y = 0.823x - 28.757 R² = 0.9881
0
50
100
150
200
250
300
0 100 200 300 400
Sp
ecif
ic S
urf
ace
Are
a (
m^
2/g
)
Swelling Pressure (kPa)
Natural Sample Type 1
Artificial Sample
Natural Sample Type 2
Linear (ArtificialSample)
Page 157
133
Figure B.4 S.S.A vs Activity
Figure B.5 C.E.C vs Test Samples
y = 115.34x + 30.538 R² = 0.9931
0
50
100
150
200
250
300
350
0 0.5 1 1.5 2 2.5
Sp
ecif
ic S
urf
ace
Are
a (
m^
2/g
)
Activity
Natural Sample Type 1
Artificial Sample
Natural Sample Type 2
Linear (ArtificialSample)
y = 54.177x + 2.6457 R² = 0.9991
0
5
10
15
20
25
30
35
0% 20% 40% 60%
Ca
tio
n E
xch
an
ge
Ca
pa
city
(m
eq/1
00
gr)
Test Samples Based on Bentonite Percentage (%)
Artificial Samples
Linear (ArtificialSamples)
Page 158
134
Figure B.6 C.E.C vs Swell Potential
Figure B.7 C.E.C vs Swelling Pressure
y = 0.1222x + 0.9132 R² = 0.9968
0
5
10
15
20
25
30
35
0 50 100 150 200 250
Ca
tio
n E
xch
an
ge
Ca
pa
city
(m
eq/1
00
gr)
Swell Potential (%)
Natural Sample Type 1
Artificial Sample
Natural Sample Type 2
Linear (ArtificialSample)
y = 0.0877x - 3.0652 R² = 0.9881
0
5
10
15
20
25
30
35
0 100 200 300 400
Ca
tio
n E
xch
an
ge
Ca
pa
city
(m
eq/1
00
gr)
Swelling Pressure (kPa)
Natural Sample Type 1
Artificial Sample
Natural Sample Type 2
Linear (ArtificialSample)
Page 159
135
Figure B.8 C.E.C vs Activity
y = 12.289x + 3.2521 R² = 0.9931
0
5
10
15
20
25
30
35
0 0.5 1 1.5 2 2.5
Ca
tio
n E
xch
an
ge
Ca
pa
city
(m
eq/1
00
gr)
Activity
Natural Sample Type 1
Artificial Sample
Natural Sample Type 2
Linear (ArtificialSample)