JOURNAL OF THE OPTICAL SOCIETY OF AMERICA Prediction of the Color of Fiber Blends HUGH R. DAVIDSON Dasvidsonand Ilemmnendinger, Easton, Pennsylvania AND MARVIN TAYLOR Clhemstrand Company, Decatur, Alabana (Received 9 July 1964) Prediction of the formula for matching a given color standard by blending pre-dved fibers is of considerable importance to the textile industry. Stearns and Noechel and Friele have derived functions of reflectance which are approximately linear with fiber quantity in a blend. These may be used for the purpose of formula prediction. In both cases, however, numerical constants must be determined to fit the fiber system being used. Since these constants must be empirically fitted to the data, we propose a purely empirical approach and have developed a mixture function which fits a blend of black and white solution-dyed acrylic fibers. The accuracy of the function when applied to blends of different colors was determined by experiment. Ten blends of solution-dyed Acrilan were used as standards, and formulas for the color matches were obtained on a Colorant Mixture Computer using the new mixture function. The resultant colors differed from the standards by an average of about 5 MacAdam units. Computed adjustments to the first formulas produced much closer matches. INTRODUCTION IN the production of carpet yarn and certain other types of textile yarn, the fibers are first dyed to the desired color and then spun. Where large amounts of yarn of a particular color are to be made, the desired color is often produced by dyeing a number of batches to the approximate color, then dyeing additional batches to a color such that when all of the batches of fiber are blended together, the desired color is obtained. In this case, the batches to be blended are all of nearly the same color. In other production problems, fibers of widely different colors must be blended to produce a desired color. In both of these cases, it is important to be able to predict the amounts of differently colored fibers which are to be blended to produce a given shade. The purpose of this study was to determine the accuracy with which such predictions can be made. PREVIOUS ART A mixture function can often be found to provide a simple additive relationship between the color of a mixture and the amount of colorant used in the mixture.' This relationship will be valid at a specified wavelength and will take the form F(R) =aF(RA)+ bF(RB)±r * *J (RN). (1) Where R is reflectance or transmittance, the subscripts refer to the A colorant, the B colorant, etc., and a is the amount of A colorant in the mixture, b the amount of B colorant, etc., where a+b+ * * * II- t. (2) Tn (lie Eise of trinspareut solutions, the function to he usedl is _F(T) =log(l/T). (3) It. H. Park and E. I. Stearns, J. Opt. Soc. Am. 34, 112 (1944). In the case of opaque pigment mixtures in paints or plastics, or dyeings on textile fibers, the appropriate function is the well-known Kubelka-Munk relationship F(R) = [(1-R) 2 /2R. (4) There are many cases in which the simple relation expressed in Eq. (1) is not valid, for example, in pigment mixtures where the amount of white pigment is small. Here a two-constant approach is often more useful. In a very large majority of practical color-matching prob- lems, however, use of Eq. (1) and the appropriate func- tion F(R) is sufficiently accurate. In the case of fiber blending, two functions have been proposed. The first was published by Stearns and Noechel in 1944.2 F(R)= (1-R)/[M(R-0.01)+0.01], (5) where M is an empirical constant depending on the physical properties of the fibers to be blended. For wool, Stearns and Noechel found the value to be M=0.15. The second function was published in 1952 by Friele. 3 F(R) = exp[-S(1-R) 2 /2R], (6) where S is an empirical constant depending on fiber properties. Miller et al. 4 found S= 0.18 for viscose rayon fibers. It will be noted that both the Stearns-Noechel and the Friele formula require a constant which must be determined by experiment. Since this is the case, a completely empirical derivation of the function might be more accurate. In ordler to examine this possibility, the presenlt work was uindertaken. 2 E. I. Stearns and F. Noechel, Am. Dyestuff Reptr. 33, 1 (1944). L. F. C. Friele, J. Textile Inst. 43, 604 (1952). A. Miller, J. Moir, J. C. Guthrie, and W. H. Oliver, "A Computed Colour Catalogue of Fiber Blends and its use in Match Prediction," Soc. Dyers Colourists Symposium, September 1963. 96 VOLUM:E 55, NUMBER I JANUARY 1965
Transcript
JOURNAL OF THE OPTICAL SOCIETY OF AMERICA
Prediction of the Color of Fiber Blends
HUGH R. DAVIDSON
Dasvidson and Ilemmnendinger, Easton, Pennsylvania
AND
MARVIN TAYLOR
Clhemstrand Company, Decatur, Alabana(Received 9 July 1964)
Prediction of the formula for matching a given color standard by blending pre-dved fibers is of considerableimportance to the textile industry. Stearns and Noechel and Friele have derived functions of reflectancewhich are approximately linear with fiber quantity in a blend. These may be used for the purpose of formulaprediction. In both cases, however, numerical constants must be determined to fit the fiber system beingused. Since these constants must be empirically fitted to the data, we propose a purely empirical approachand have developed a mixture function which fits a blend of black and white solution-dyed acrylic fibers.The accuracy of the function when applied to blends of different colors was determined by experiment. Tenblends of solution-dyed Acrilan were used as standards, and formulas for the color matches were obtainedon a Colorant Mixture Computer using the new mixture function. The resultant colors differed from thestandards by an average of about 5 MacAdam units. Computed adjustments to the first formulas producedmuch closer matches.
INTRODUCTION
IN the production of carpet yarn and certain othertypes of textile yarn, the fibers are first dyed to the
desired color and then spun. Where large amounts ofyarn of a particular color are to be made, the desiredcolor is often produced by dyeing a number of batchesto the approximate color, then dyeing additional batchesto a color such that when all of the batches of fiber areblended together, the desired color is obtained. In thiscase, the batches to be blended are all of nearly the samecolor. In other production problems, fibers of widelydifferent colors must be blended to produce a desiredcolor. In both of these cases, it is important to be ableto predict the amounts of differently colored fibers whichare to be blended to produce a given shade. The purposeof this study was to determine the accuracy with whichsuch predictions can be made.
PREVIOUS ART
A mixture function can often be found to provide asimple additive relationship between the color of amixture and the amount of colorant used in the mixture.'This relationship will be valid at a specified wavelengthand will take the form
F(R) = aF(RA)+ bF(RB)±r * *J (RN). (1)
Where R is reflectance or transmittance, the subscriptsrefer to the A colorant, the B colorant, etc., and a isthe amount of A colorant in the mixture, b the amountof B colorant, etc., where
a+b+ * * * II- t. (2)
Tn (lie Eise of trinspareut solutions, the function to heusedl is
_F(T) =log(l/T). (3)
It. H. Park and E. I. Stearns, J. Opt. Soc. Am. 34, 112 (1944).
In the case of opaque pigment mixtures in paints orplastics, or dyeings on textile fibers, the appropriatefunction is the well-known Kubelka-Munk relationship
F(R) = [(1-R)2 /2R. (4)
There are many cases in which the simple relationexpressed in Eq. (1) is not valid, for example, in pigmentmixtures where the amount of white pigment is small.Here a two-constant approach is often more useful. Ina very large majority of practical color-matching prob-lems, however, use of Eq. (1) and the appropriate func-tion F(R) is sufficiently accurate.
In the case of fiber blending, two functions have beenproposed. The first was published by Stearns andNoechel in 1944.2
F(R)= (1-R)/[M(R-0.01)+0.01], (5)
where M is an empirical constant depending on thephysical properties of the fibers to be blended. For wool,Stearns and Noechel found the value to be M=0.15.The second function was published in 1952 by Friele.3
F(R) = exp[-S(1-R) 2 /2R], (6)
where S is an empirical constant depending on fiberproperties. Miller et al.4 found S= 0.18 for viscose rayonfibers.
It will be noted that both the Stearns-Noechel andthe Friele formula require a constant which must bedetermined by experiment. Since this is the case, acompletely empirical derivation of the function mightbe more accurate. In ordler to examine this possibility,the presenlt work was uindertaken.
2 E. I. Stearns and F. Noechel, Am. Dyestuff Reptr. 33, 1 (1944).L. F. C. Friele, J. Textile Inst. 43, 604 (1952).A. Miller, J. Moir, J. C. Guthrie, and W. H. Oliver, "A
Computed Colour Catalogue of Fiber Blends and its use in MatchPrediction," Soc. Dyers Colourists Symposium, September 1963.
96
VOLUM:E 55, NUMBER I JANUARY 1965
PREDICTION OF THE COLOR OF FIBER BLENDS
DEVELOPMENT OF A FIBER BLEND FUNCTION
Let us consider the relationships in a series of blendsof black and white fibers. Equation (1) then may bewritten
F (Rm) = wF (R 0) + bF (R b), (7)
where Rm, RU, and Rb are, respectively, the reflectancesof the fiber blend, the black fiber, and the white fiber,and w and b represent the proportions of white andblack fibers in the blend. In order to determine F(R)from this equation, we must arbitrarily assign values toF(RW) and F(Rb). For given values of w and b, we canthen compute F(R1 ,) and by measurement of the sampleblended for the given values of w and b, we can deter-mine the value of Rm. By varying the values of w andb, we can determine the relationship between F(Rrn)and Rm and therefore establish the desired function.Although, in principle, any values could be assigned toF(R,,) and F(Rb), we prefer to use a high value forF(R b) and a low one for F (R.,.) in order that the functionincrease with decreasing R as does the Kubelka-Munk
TABLE I. Comparison of several fiber blending functions withmeasurements of black-white blends of solution-dyed Acrilan.
Blend Predicted R at 550 mpcomposition R Stearns Stearns% % 550 Davidson Noechel Noechel Friele Friele
function. We might have chosen to let F(R6 ) = 1.0 andF (R) =0.0; however, various practical considerations5
led us to assign the values F(Rb)= 1.040 andF(R,,) = 0.005. Thus, Eq. (7) becomes
F (R) 0.005w+ 1.046.
FiG. 1. Spectrophotometric curves of mixtures of indicated per-centage of black Acrilan with white Acrilan fibers.
ing spectrophotometer equipped with a Davidson andHemmendinger tristimulus integrator.
The mixture function F(R) was computed from Eq.(8), and the values are plotted in Fig. 3 against logR.The function defined by the curve in this figure is theone used for subsequent calculations. A plot of theKubelka-Munk function, Eq. (4), is also shown forcomparison.
In order to test the validity of the mixture function,10 blends of solution-dyed acrylic fibers were prepared
20
18
16
14(8)
EXPERIMENTAL
Of immediate interest for our purposes was the blend-ing of solution-dyed acrylic fibers. For this reason wedeveloped the function on the basis of the series ofblends of black and white acrylic fibers described by thedata in Table I. Here the amounts of the two fibersin each blend and the reflectances at 550 mp are specified.The spectrophotometric curves of the black and whiteand the various blends are given in Figs. 1 and 2. Allmeasurements were made on a General Electric record-
' We used 0.005 rather than zero for the white fiber in orderthat zero could be used for 100% reflectance. The value of I wasoriginally chosen for the black fiber, but a smoothing of thecalculated values of F(R) plotted against logR (see Fig. 3) led tothe value 1.04.
't 12
zF 0Li
-J
Wa8
It
6
4
2
"400 450 500 550 600WAVELENGTH, MI
650 700
FIG. 2. Same caption as Fig. 1.
I I I I I
40%
607.
- - - - --
- s0%
-00%
t. . . . - .
January 1965
H8I. R. DAVIDSON AND M. TAYLOR
TABLE II. Colorimetric values for primaries andblends used as standards.
Sunflower yellow (7)Maize yellow (4)Cardinal red (9)Jockey red (6)Dolphin blue (5)Cadet grey (8)Antelope (1)Erin green (2)Midnight blue (3)BlackWhite
.20 -\ , B
I C
2 3 4 5 6 7 8910 20 30 40 50 t00%R G
FIG. 3. Values for color mixture functions. - - - F (R) = (1 -R)2/2R Inormalized to F(RI.9 ) = 1.0, - proposed fiber blend function. J
to be used as standards for matching. The componentsof these blends were chosen from a group of 11 commerci-ally available Acrilan colors. The calorimetric specifi-cations of both the primary Acrilan colors and the blendsare given in Table II. In Figs. 4-9, the spectrophoto-metric curves of blends and primaries are given. Thecomposition of each of the 10 blends is given in TableIII.
The reflectance values at 400, 420, 460, *-- 700 mufor each of the primaries and standard blends wereconverted to F(R) by means of Fig. 3. These valueswere then set into the Davidson and Hemmendinger
coiiic. In this case, the computer was used to solve16 equations of the form of Eq. (1) where the unknownsare the percentage compositions of each of the primariesa, b1, *- - n.6 The formulas obtained from the computerwere then used to prepare blends to match the stand-ards. In cases where these first matches were not suf-ficiently close, second approximations were obtained onthe computer and additional blends were prepared. The
6 For a complete description of the operation of this computer,see H. R. Davidson, H. Hemmendinger, and J. L. R. Landry, Jr.,J. Soc. Dyers Colourists 79, 577-589 (1963).
color differences in MacAdam units between the stand-ard blends and the matching blends were calculatedfrom the tristimulus measurements and were used as ameasure of the success of the method.
RESULTS
A comparison of predicted reflectances based on thenew mixture function and on those of Stearns andNoechel and Friele are given in Table I for the blends
20 I I I
la -
16 -
14 -
-1A12 -
10
2l -
,A ----
u400 450 500 550 600 650 700WAVELENGTH, My
FIG. 7. Spectrophotometric curves of blends of solution-dyedacrylic fibers. See Table III for composition.
FIG. 8. Spectrophotometric curves of blends of solution-dyedacrylic fibers. See Table III for composition.
of white and black. The new function, specified in Fig. 3,has been fitted to the measurements of these blendsand hence fits better than the others. Two sets of valuesfor each of the other functions are shown. The firstcolumn of data for the Stearns-Noechel formula is fromM=0.15 as specified by these authors' for wool blends,and the second column gives data for the function lettingM= 0.25. Some improvement in the fit at high-reflect-ance values is noted, but at the expense of a poorer fit
FIG. 9. Spectrophotometric curves of blends of solution-dyedacrylic fibers. See Table III for composition.
99January 1965
I
II
IiII
H. R. DAVIDSON AND M. TAYLOR
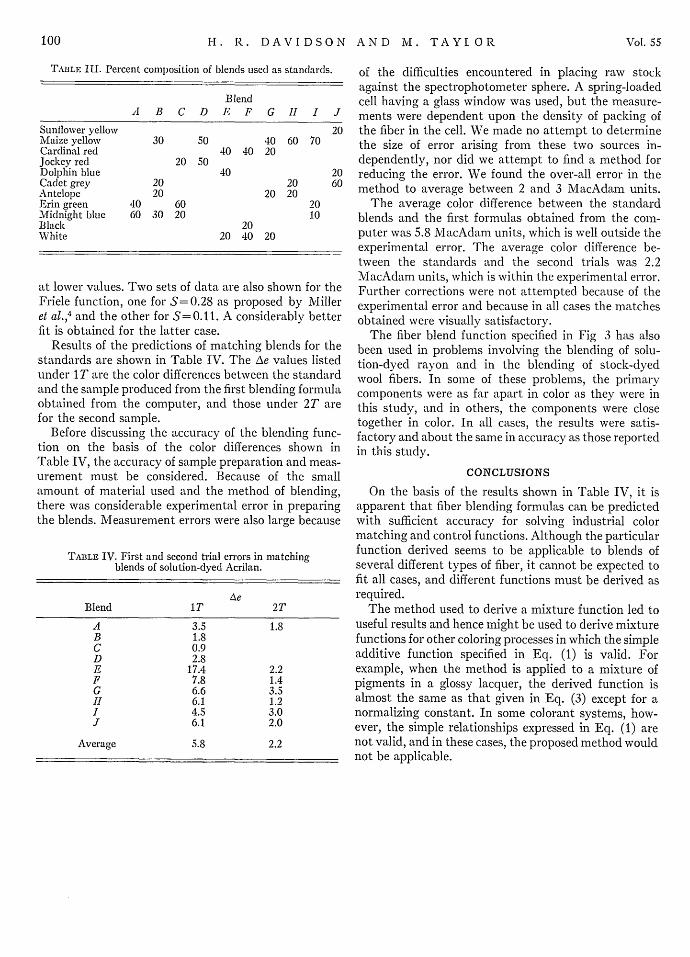
TABLE III. Percent composition of blends used as standards.
BlendA B C D E F G H I J
Sunflower yellow 20Maize yellow 30 50 40 60 70Cardinal red 40 40 20Jockey red 20 50Dolphin blue 40 20Cadet grey 20 20 60Antelope 20 20 20Erin green 40 60 20Midnight blue 60 30 20 10Black 20White 20 40 20
at lower values. Two sets of data are also shown for theFriele function, one for S=0.28 as proposed by Milleret al.,4 and the other for S=0.11. A considerably betterfit is obtained for the latter case.
Results of the predictions of matching blends for thestandards are shown in Table IV. The Ae values listedunder 1 T are the color differences between the standardand the sample produced from the first blending formulaobtained from the computer, and those under 2T arefor the second sample.
Before discussing the accuracy of the blending func-tion on the basis of the color differences shown inTable IV, the accuracy of sample preparation and meas-urement must be considered. Because of the smallamount of material used and the method of blending,there was considerable experimental error in preparingthe blends. Measurement errors were also large because
TABLE IV. First and second trial errors in matchingblends of solution-dyed Acrilan.
of the difficulties encountered in placing raw stockagainst the spectrophotometer sphere. A spring-loadedcell having a glass window was used, but the measure-ments were dependent upon the density of packing ofthe fiber in the cell. We made no attempt to determinethe size of error arising from these two sources in-dependently, nor did we attempt to find a method forreducing the error. We found the over-all error in themethod to average between 2 and 3 MacAdam units.
The average color difference between the standardblends and the first formulas obtained from the com-puter was 5.8 MacAdam units, which is well outside theexperimental error. The average color difference be-tween the standards and the second trials was 2.2XlacAdam units, which is within the experimental error.
Further corrections were not attempted because of theexperimental error and because in all cases the matchesobtained were visually satisfactory.
The fiber blend function specified in Fig 3 has alsobeen used in problems involving the blending of solu-tion-dyed rayon and in the blending of stock-dyedwool fibers. In some of these problems, the primarycomponents were as far apart in color as they were inthis study, and in others, the components were closetogether in color. In all cases, the results were satis-factory and about the same in accuracy as those reportedin this study.
CONCLUSIONS
On the basis of the results shown in Table IV, it isapparent that fiber blending formulas can be predictedwith sufficient accuracy for solving industrial colormatching and control functions. Although the particularfunction derived seems to be applicable to blends ofseveral different types of fiber, it cannot be expected tofit all cases, and different functions must be derived asrequired.
The method used to derive a mixture function led touseful results and hence might be used to derive mixturefunctions for other coloring processes in which the simpleadditive function specified in Eq. (1) is valid. Forexample, when the method is applied to a mixture ofpigments in a glossy lacquer, the derived function isalmost the same as that given in Eq. (3) except for anormalizing constant. In some colorant systems, how-ever, the simple relationships expressed in Eq. (1) arenot valid, and in these cases, the proposed method wouldnot be applicable.