Keywords: Natural gas; Thermodynamic property; Compressibility factor; Speeds of sound; Phase equilibrium; Equation of state
1. Introduction
Predicting the thermodynamic properties of naturalgas mixtures are important in gas industry—that is inproduction, processing, storage and transportation. Ac-curate values of natural gas compressibility factors andspeeds of sound data are crucial in custody transferoperations. Other thermodynamic properties, e.g.,
saturated liquid density of liquefied natural gas (LNG)mixtures, are used in the design of liquefaction pro-cesses and storage facilities; Joule–Thomson coeffi-cients are used in throttling processes and dew points areused in pipeline design.
There are accurate correlations/equations of state(EoSs) for calculating natural gas properties. McCarty(1982) reported an accurate extended correspondingstates (ECS) model for LNG systems. Using ECSmodels, Estela-Uribe and Trusler (2001) and Estela-Uribe et al. (2004) predicted the compressibility factors,
254 Kh. Nasrifar, O. Bolland / Journal of Petroleum Science and Engineering 51 (2006) 253–266
densities, speeds of sound and bubble point pressures ofnatural gas mixtures quite accurately. Accurate models,for instance, AGA NX-19 (1978) and MGERG-88(Jaeschke et al., 1989) are used in custody transfer forcalculating compressibility factors of natural gas mix-tures. The Benedict et al. (1940) (BWR) EoS, modifiedRedlich and Kwong (1949) (RK) EoS by Soave (1972)(RKS) and Peng and Robinson (1976) (PR) EoS areoften used in the gas industry for predicting natural gasequilibrium properties.
Except the RKS and PR EoSs, the other models areeither complex or require many pure componentconstants and/or binary parameters (Estela-Uribe et al.,2004). For instance, the BWR EoS has 8 constants. TheMGERG (Jaeschke et al., 1989) model is not suitable forthermal properties calculations. The ECS models ofEstela-Uribe and Trusler (2001) and Estela-Uribe et al.(2004) take the advantage of binary parameters, andtherefore cannot be extended to natural gas mixtureswith heavy fractions.
The RKS and PR EoSs are often used in the gasindustry as predictive tools. When these two EoSs arecompared with the mentioned models above, they arerather accurate. Moreover, both EoSs take the advantageof simplicity. They are reliable and predict thethermodynamic properties of natural gas mixtures withreasonable accuracy. In addition, these two EoSs can beused for predicting the properties of natural gas mixturescontaining heavy fractions (Nasrifar et al., 2005).
Natural gas mixtures comprise supercritical methaneas the major component. When the new findings insupercritical behavior of EoSs are taken into account(Mathias, 2003); an accurate EoS can be constructed for
Table 1Accuracy (%AAD) of the EoSs in predicting the vapor pressure of some natur
application in the gas industry. The objective of thiswork is to obtain a predictive two-constant EoS. ThisEoS should exhibit an accurate description of thermo-dynamic properties of natural gas mixtures whilepreserving the outstanding characteristics of the RKSand PR equations.
2. Model development
Natural gas mixtures comprise of many hydrocarbonand non-hydrocarbon constituents with methane as themajor component. Heavy hydrocarbons up to C40
sometimes exist in natural gas mixtures. Nitrogen,carbon dioxide and hydrogen sulfide are usually thenon-hydrocarbon components. While the gas phaseproperties of natural gas mixtures, to a large extent,result from the presence of methane, the equilibriumproperties are affected by the presence of heavierhydrocarbons (Nasrifar et al., 2005). Thus, the EoS ofnatural gas mixtures must be accurate at representingmethane and heavier hydrocarbon properties as limitingcases of the mixture true behavior. However, this is onlya necessary condition.
The pressure and temperature of most natural gasmixtures, at reservoir and surface conditions, can befound up to 150MPa and 500K, respectively. At theseconditions, nitrogen, methane and ethane are almostalways supercritical while the heavier hydrocarbons aresubcritical. In other words, to accurately describe theproperties of natural gas mixtures, the supercriticalbehavior of methane and to a less extent nitrogen andethane, and the subcritical behavior of heavy hydro-carbons should be accurately described. In an EoS, the
al gas constituents (experimental data from Daubert and Danner, 1992)
Fig. 1. Percent bias between experimental (Daubert and Danner, 1992) and predicted vapor pressure of some natural gas constituents from the triplepoint to the critical point. The predictions are from Eq. (6) and %Bias is defined by: %Bias=(100)(cald−exp l) / exp l.
Fig. 2. Percent absolute deviations between the IUPAC-recommendedvalues (Wagner and de Reuck, 1996) and predicted fugacities ofmethane as functions of temperature and pressure. The predictions arefrom Eq. (6) and %Dev is defined by: %Dev=(100)|cald−exp l| / exp l.
255Kh. Nasrifar, O. Bolland / Journal of Petroleum Science and Engineering 51 (2006) 253–266
subcritical and supercritical behavior of fluids not onlyattributes to the pressure–volume–temperature (PVT)relationship of the EoS but also to the temperaturedependency of the α function. A general two constantEoS may be defined by (Michelsen and Mollerup,2004):
P ¼ RTv� b
� aCaðTrÞðvþ d1bÞðvþ d2bÞ ð1Þ
with
b ¼ XbRTCPC
ð2Þ
aC ¼ XaR2T2
C
PCð3Þ
where P is the pressure, T is the temperature, v is thespecific volume, R is the gas constant, b is the molarcovolume, a is the attractive parameter, and Ωb and Ωa
are two coefficients which depend on the constants δ1and δ2. The subscripts r and C stand for the reduced andcritical properties. At the critical temperature, thesecond viral coefficient of Eq. (1) is expressed by:
B2;CPC
RTC¼ Xb � Xa ð4Þ
where B2,C is the second virial coefficient at the criticaltemperature. Mathias (2003) pointed out that thereduced second virial coefficient (B2,CPC /RTC) ofmost fluids at the critical point is nearly −0.34. Whenthis condition is applied to Eq. (4), one can obtain:
Xb � Xac� 0:34 ð5Þ
Eq. (5) would be the constraint for obtaining the EoS ofnatural gas mixtures.
Nasrifar and Bolland (2004) improved Soave's αfunction on the basis of the equality of the second virialcoefficient from the RKS EoS and the square-wellpotential. The obtained α function, in general, improvesthe accuracy of the RKS EoS in predicting the purecomponent compressibility factor and fugacity atsupercritical temperatures. Accurate fugacity of purecompounds is particularly important, as shown by Flöteret al. (1998), in calculating the fluid phase equilibria ofasymmetric hydrocarbon mixtures containing methane.However, the fugacity of fluids for an EoS is usually
Table 2Accuracy of the EoSs in predicting the fugacity of methane for wideranges of temperature and pressure
EOS %AADa
This work 2.29RKS 3.56RKSNB 2.55RKTCC 5.29PR 8.37PRGGPR 7.70MNM 8.183M 3.76HY 2.00BWRS 7.02a Experimental data from Wagner and de Reuck (1996); number of
points=142; 195≤T(K)≤600 and 1≤P(MPa)≤150.
256 Kh. Nasrifar, O. Bolland / Journal of Petroleum Science and Engineering 51 (2006) 253–266
fixed indirectly by correlating the EoS to the vaporpressure of pure compounds along the coexistencecurve. It is also worth noting that all two-constant EoSssimilar in form to Eq. (1) have a fixed value of fugacityat the critical point. The critical fugacity coefficient ofthe RKS EoS is equal to 0.6657 and 0.6457 for the PREoS (Michelsen and Mollerup, 2004). The reportedvalue for the fugacity coefficient of methane at thecritical point (Younglove and Ely, 1987) is 0.6640,however. If Eq. (1) is to be used to predict the ther-modynamic properties of methane (natural gas) insupercritical region, the starting point which is thecritical point, should also be predicted accurately. Itshould be noted that the accuracy of EoSs in engineeringis based on the adequacy of the critical point to predictthe subcritical and supercritical properties. As such, it isessential for the EoS of natural gas systems to predict thecritical fugacity of methane (as the major component)accurately. However, it is worth stressing that theaccurate prediction of fugacity of methane by the EoS ofnatural gas system is only a necessary condition. On thebasis of this premise and Eq. (5) as the constraint, weconcluded that δ1=δ2=1/
ffiffiffi3
pwould meet these require-
ments. Incorporating these values in Eq. (1), a new PVTrelationship is obtained:
P ¼ RTv� b
� aCaðTrÞvþ b=
ffiffiffi3
p� �2 ð6Þ
with
b ¼ 0:079246RTCPC
ð7Þ
aC ¼ 0:421875R2T2
C
PCð8Þ
At the critical point, the compressibility factor, secondvirial coefficient, and fugacity coefficient of Eq. (6) werefound to be 0.329, −0.342, and 0.6640, respectively.
For the α function, the modified Soave's α functionby Nasrifar and Bolland (2004) is used:
a Trð Þ ¼1þ m 1� ffiffiffiffiffi
Trp� �� �2
TrV1b1Tr
þ b2T2r
þ b3T3r
TrN1
8<: ð9Þ
with
b1 ¼ 0:25ð12� 11mþ m2Þ ð10Þ
b2 ¼ 0:5ð�6þ 9m� m2Þ ð11Þ
b3 ¼ 0:25ð4� 7mþ m2Þ ð12Þ
where the parameter m was determined by correlatingthe vapor pressure of pure substances from the triplepoint to the critical point temperature. These obtainedparameters were correlated in terms of acentric factor(ω). The final correlation is expressed by:
m ¼ 0:4857þ 1:6308x� 0:2089x2 ð13Þwhere ω ranges from −0.216 to 0.8764.
3. Extension to mixtures
The classical van der Waals mixing rules were usedto extend Eq. (6) to mixtures:
b ¼X
jxjbj ð14Þ
a ¼X
i
Xjxixjaij ð15Þ
with
aij ¼ ffiffiffiffiffiffiffiffiaiaj
p ð1� kijÞ ð16Þwhere x is the liquid/vapor mole fraction and kij is thebinary interaction parameter. In this work, kij=0,otherwise it is stated.
4. Results and discussion
A natural gas mixture is a system different from thepure components. Thence, the properties of natural gasmixtures are quite dependent on composition. Never-theless, if the EoS is accurate at representing purecomponent properties as limiting cases, the EoS mustalso be accurate at representing natural gas properties.
Table 3Liquefied natural gas mixture compositions and code names (experimental data from Haynes and Hiza, 1977; Hiza and Haynes, 1980; Haynes, 1982)
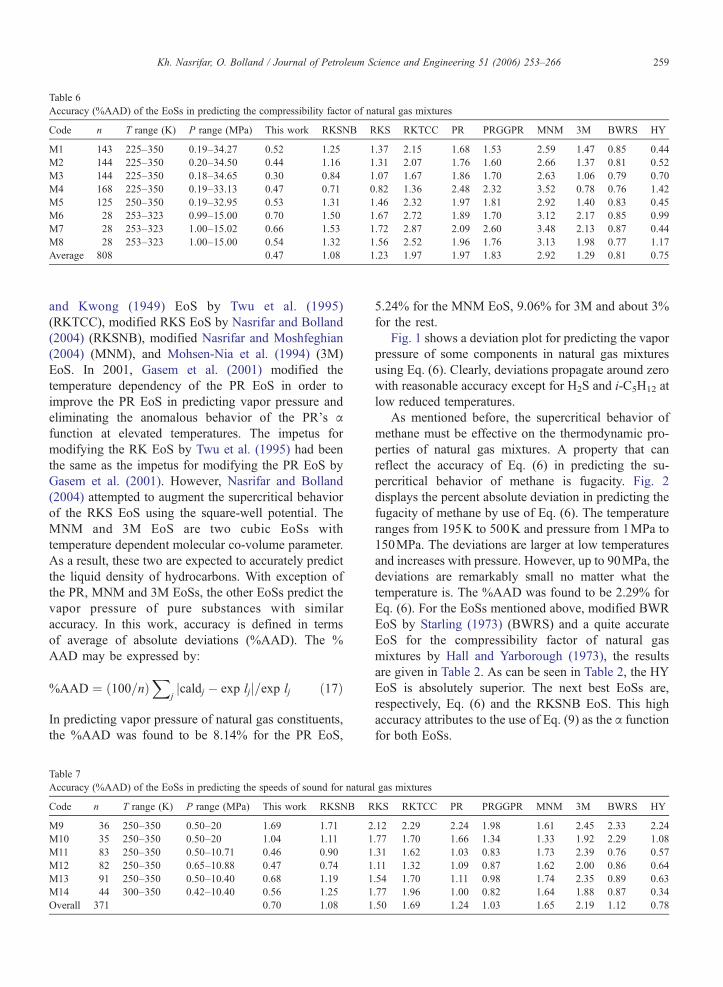
259Kh. Nasrifar, O. Bolland / Journal of Petroleum Science and Engineering 51 (2006) 253–266
and Kwong (1949) EoS by Twu et al. (1995)(RKTCC), modified RKS EoS by Nasrifar and Bolland(2004) (RKSNB), modified Nasrifar and Moshfeghian(2004) (MNM), and Mohsen-Nia et al. (1994) (3M)EoS. In 2001, Gasem et al. (2001) modified thetemperature dependency of the PR EoS in order toimprove the PR EoS in predicting vapor pressure andeliminating the anomalous behavior of the PR's αfunction at elevated temperatures. The impetus formodifying the RK EoS by Twu et al. (1995) had beenthe same as the impetus for modifying the PR EoS byGasem et al. (2001). However, Nasrifar and Bolland(2004) attempted to augment the supercritical behaviorof the RKS EoS using the square-well potential. TheMNM and 3M EoS are two cubic EoSs withtemperature dependent molecular co-volume parameter.As a result, these two are expected to accurately predictthe liquid density of hydrocarbons. With exception ofthe PR, MNM and 3M EoSs, the other EoSs predict thevapor pressure of pure substances with similaraccuracy. In this work, accuracy is defined in termsof average of absolute deviations (%AAD). The %AAD may be expressed by:
%AAD ¼ ð100=nÞX
jjcaldj � exp ljj=exp lj ð17Þ
In predicting vapor pressure of natural gas constituents,the %AAD was found to be 8.14% for the PR EoS,
Table 7Accuracy (%AAD) of the EoSs in predicting the speeds of sound for natura
Code n T range (K) P range (MPa) This work RKSNB R
5.24% for the MNM EoS, 9.06% for 3M and about 3%for the rest.
Fig. 1 shows a deviation plot for predicting the vaporpressure of some components in natural gas mixturesusing Eq. (6). Clearly, deviations propagate around zerowith reasonable accuracy except for H2S and i-C5H12 atlow reduced temperatures.
As mentioned before, the supercritical behavior ofmethane must be effective on the thermodynamic pro-perties of natural gas mixtures. A property that canreflect the accuracy of Eq. (6) in predicting the su-percritical behavior of methane is fugacity. Fig. 2displays the percent absolute deviation in predicting thefugacity of methane by use of Eq. (6). The temperatureranges from 195K to 500K and pressure from 1MPa to150MPa. The deviations are larger at low temperaturesand increases with pressure. However, up to 90MPa, thedeviations are remarkably small no matter what thetemperature is. The %AAD was found to be 2.29% forEq. (6). For the EoSs mentioned above, modified BWREoS by Starling (1973) (BWRS) and a quite accurateEoS for the compressibility factor of natural gasmixtures by Hall and Yarborough (1973), the resultsare given in Table 2. As can be seen in Table 2, the HYEoS is absolutely superior. The next best EoSs are,respectively, Eq. (6) and the RKSNB EoS. This highaccuracy attributes to the use of Eq. (9) as the α functionfor both EoSs.
l gas mixtures
KS RKTCC PR PRGGPR MNM 3M BWRS HY
.12 2.29 2.24 1.98 1.61 2.45 2.33 2.24
.77 1.70 1.66 1.34 1.33 1.92 2.29 1.08
.31 1.62 1.03 0.83 1.73 2.39 0.76 0.57
.11 1.32 1.09 0.87 1.62 2.00 0.86 0.64
.54 1.70 1.11 0.98 1.74 2.35 0.89 0.63
.77 1.96 1.00 0.82 1.64 1.88 0.87 0.34
.50 1.69 1.24 1.03 1.65 2.19 1.12 0.78
Table 8Natural gas mixtures compositions and code names for calculating isobaric heat capacity, Joule–Thomson coefficient and VLE calculations
Component M15 a M16 a M17b M18 b M19 c M20 d M21 e M22 f M23 g
a Ernst et al. (2001).b Barreau et al. (1996).c Yarborough and Vogel (1967).d Hoffmann et al. (1953).e Firoozabadi et al. (1978).f Avila et al. (2002a).g Avila et al. (2002b).h C7+ specification: SG (60/60)=0.7961, MW=138.78.i C7+ specification: SG (60 /60)=0.7740, MW=132.
260 Kh. Nasrifar, O. Bolland / Journal of Petroleum Science and Engineering 51 (2006) 253–266
Table 3 gives the composition and code names for 20LNG mixtures. On the basis of the components inmixtures, the LNG mixtures were coded. As indicated inTable 3, some mixtures have two or more compositionsbut the same components. The saturated liquid densityof these LNG mixtures were predicted by Eq. (6) andcompared with experimental data in Table 4. Also givenin Table 4 are the predictions from the other EoSs. It isworth considering that the RKS and RKSNB EoSspredict the saturated liquid density of LNG mixtureswith the same accuracy. In fact, at conditions where
Table 9Accuracy (%AAD) of the EoSs in predicting the isobaric heat capacity of n
Code n T range (K) P range (MPa) This work RKSNB R
these LNGmixtures were studied, methane is subcriticaland nitrogen is slightly supercritical. In other words, theRKSNB EoS reduces to the RKS EoS and hence bothhave the same accuracy. Clearly, the 3M and MNMEoSs predict the saturated liquid density of LNGmixtures with best accuracy. The %AAD was found tobe around 1.15% for both EoSs. This high accuracy isattributed to the temperature dependency of themolecular co-volume in both EoSs. The RKS,RKSNB and RKTCC EoSs predict the saturated liquiddensities with an average %AAD of 1.74%. The average
atural gas mixtures
KS RKTCC PR PRGGPR MNM 3M BWRS HY
.49 2.20 1.90 1.90 3.23 2.21 2.41 5.61
.98 1.41 1.55 1.54 3.15 1.16 1.99 7.03
.96 2.52 0.80 0.73 3.64 21.56 1.81 9.67
.07 3.87 0.99 1.04 2.56 0.94 2.97 8.06
.34 2.30 1.43 1.43 3.16 5.07 2.27 7.21
Fig. 3. Experimental (Ernst et al., 2001) and predicted Joule–Thomson coefficients for the natural gas mixture M16.
261Kh. Nasrifar, O. Bolland / Journal of Petroleum Science and Engineering 51 (2006) 253–266
%AAD for Eq. (6) is 4.66% and 10.76% and 10.95% forthe PR and PRGGPR EoSs, respectively. Table 4 alsoindicates that the accuracy of an EoS in predicting theliquid density of LNG mixtures is a consequence of thePVT relationship and nearly independent of the αfunction. Further, Table 4 indicates that the accuracy ofEq. (6) in predicting the saturated liquid densities ofLNG mixtures lies between the RK family and PRfamily EoSs.
Table 5 presents the compositions and code namesfor 14 natural gas mixtures used for predicting thecompressibility factor and speeds of sound data. InTables 6 and 7, the accuracy of the EoSs is compared forpredicting the compressibility factors and speeds ofsounds data, respectively. Clearly, with exception of theHY EoS, Eq. (6) is remarkably superior with respect tothe other EoSs for predicting these two properties. Theaverage %AAD was found to be 0.47% for predictingthe compressibility factors and 0.70% for the speeds ofsound. For predicting these two properties, however, theHY EoS is only a little inferior with respect to Eq. (6).
Table 10Accuracy of the EoSs in predicting Joule–Thomson coefficients forthe mixture M16
EOS %AADa
This work 5.03RKS 5.10RKSNB 4.50RKTCC 6.74PR 12.03PRGGPR 13.11MNM 9.143M 9.31HY 8.34BWRS 9.89
When the RKS and RKSNB EoSs are compared, it isseen that the use of Eq. (9) as the modified Soave's αfunction improves the accuracy of the RKS EoS inpredicting these two properties of natural gas mixtures.
Fig. 4. Experimental (Van der Kooi et al., 1995) and predicted phaseequilibria for the natural gas model mixture CH4+n-C20H42 at323.15K.
Fig. 5. Experimental (Van der Kooi et al., 1995), predicted andcorrelated phase equilibria for the natural gas model mixture CH4+n-C20H42 at 353.15K.
Fig. 6. Experimental (Yarborough and Vogel, 1967) and predictedequilibrium ratios for the natural gas mixture M19.
262 Kh. Nasrifar, O. Bolland / Journal of Petroleum Science and Engineering 51 (2006) 253–266
Table 8 gives the compositions and code names for 9other natural gas mixtures. These mixtures are used incalculating isobaric heat capacity, Joule–Thomsoncoefficient and vapor–liquid–equilibria (VLE) of natu-ral gas mixtures. In Table 9, the accuracy of Eq. (6) inpredicting the isobaric heat capacity of 4 natural gasmixtures is presented. The RKTCC and BWRS EoSspredict the isobaric heat capacity of the natural gasmixtures with an average %AAD of 2.3%, the HY EoSwith 7.2%, the MNM EoS with 3.16%, the 3M EoS with5.07% and the rest with an average %AAD of about1.40%. However, the RKS EoS with a %AAD of 1.34%,is slightly superior among the others. Eq. (6) is rankednumber 2 in this comparison.
Fig. 3 shows Joule–Thomson coefficient for thenatural gas mixture M16 as functions of pressure andtemperature. As can be seen, the agreement withexperimental data is quite good. The %AAD wasfound to be 5.03%. The same calculations wereperformed by the other EoSs with the %AAD given inTable 10. The RKSNB EoS with a %AAD of 4.5% is thebest among the others. Eq. (6) is the second among theothers.
Fig. 4 depicts experimental and predicted bubble anddew points for a model system comprised of methaneand n-eicosane at 323.15K. Among the EoSs used inthis study, the RKTCC EoS predicts the experimentalvalues more accurately than the others while the PR EoSpredicts with the worst accuracy. The other EoSsincluding Eq. (6) lie between these two extremes. Forclarity, only the predictions from Eq. (6) are illustrated.Nevertheless, because of large non-ideality for theseasymmetric mixtures, none of the EoSs is predictiveenough to agree with the experimental data. However,the VLE of binary asymmetric mixtures can easily becorrelated using a single binary interaction parameter,as shown in Fig. 5, for the same system at 353.15K.As such, a paper by Jaubert and Mutelet (2004) isparticularly useful where the authors predicted/correlat-ed the binary interaction parameters of a wide variety ofsystems using a group contribution method with the PREoS.
The accurate prediction of equilibrium ratios forcomponents in a gas mixture is of primary concerns inVLE calculations. Fig. 6 shows equilibrium ratios of thenatural gas mixture M19 as a function of pressure at
Table 11Experimental (Hoffmann et al., 1953) and predicted dew points for the gas condensate mixture M20
Component Vapor(mol%)
Liquid (mol%)
Experimental This work RKSNB RKS RKTCC PR PRGGPR MNM
263Kh. Nasrifar, O. Bolland / Journal of Petroleum Science and Engineering 51 (2006) 253–266
366.44K. As can be seen, the agreement between thepredictions by Eq. (6) and experimental data is quitegood except for nitrogen and carbon dioxide. Unless thecompositions of these components are large, thisinaccuracy will not pose problem. However, theinaccuracy might be alleviated by use of binaryinteraction parameters with mixing rules.
In Table 11, experimental and predicted dew pointpressures and liquid compositions for the gas conden-sate mixture M20 are compared. In order to performcalculations, the C7+ fraction was split into 12 singlecarbon number groups (SCN) using the logarithmdistribution described by Pedersen et al. (1992). Thecritical properties and acentric factor of each group weredetermined by Twu's correlations (Twu, 1984). Aftercharacterizing the C7+ fraction, the VLE calculationswere performed. The results are given in Table 11.Comparison with experimental data indicates that PREoS accurately predicts the natural gas mixture dewpoint at 367K. The RKSNB, PRGGPR and Eq. (6) arethe next best EoSs in agreement with the experimentalvalue while the MNM EoS is the worst among theothers. Nevertheless, only the MNM EoS predicts theliquid phase compositions rather accurately.
Table 12 gives flash yields for the gas condensatemixture M21. The heavy fraction was characterizedsimilarly to the gas condensate mixture M20. Withexception of the MNM EoS, the predictions are similar
Table 12Experimental (Firoozabadi et al., 1978) and predicted flash yields for the ret
in accuracy. However, the MNM EoS is slightly moreaccurate.
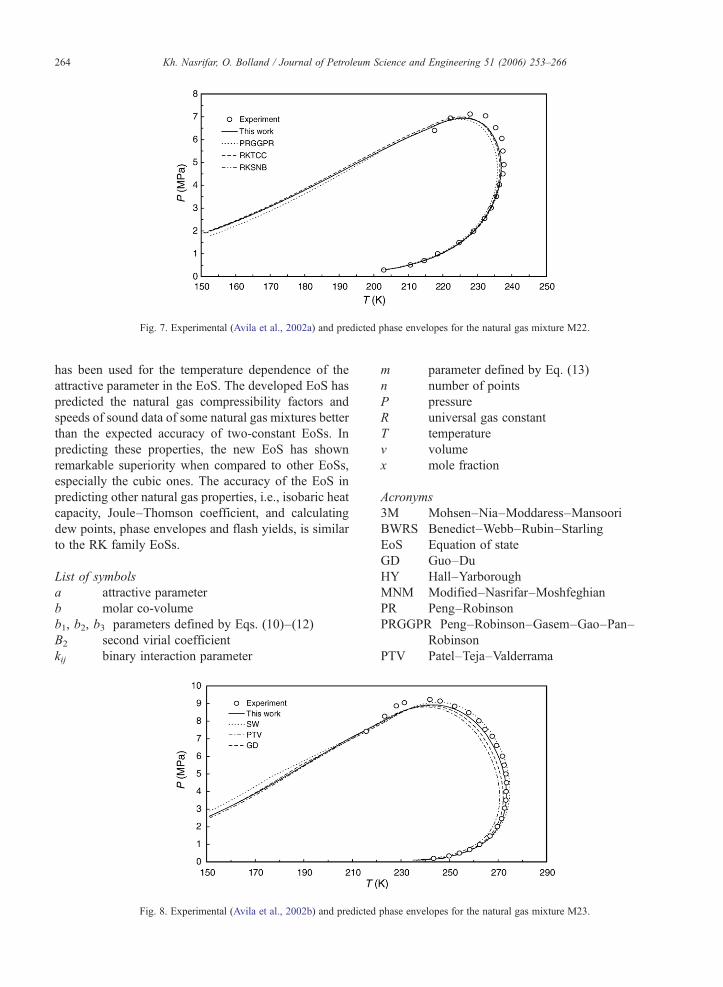
Fig. 7 shows phase envelope for the natural gasmixture M22. In addition to Eq. (6), the RKTCC,RKSNB and PRGGPR EoSs were used to predict thephase envelope. The phase envelope predicted by thePRGGPR is clearly the least accurate among the otherswhile Eq. (6), the RKTCC and RKSNB EoSs are similarin accuracy. Also, in a previous work, Nasrifar et al.(2005) reached to a similar conclusion. Fig. 8 shows thephase envelope for the natural gas mixture M23. Theexperimental values are from Avila et al. (2002b) andpredicted values from Eq. (6), and three other EoSs:Schmidt and Wenzel (1980) (SW), modified Patel andTeja (1982) by Valderrama (1990) (PTV) and Guo andDu (1989) (GD). The SW EoS and Eq. (6) are clearly inbetter agreement with experimental data when com-pared to the other EoSs. While Eq. (6) slightlyunderestimates the experimental data, the SW EoSoverestimates. The PTV and GD EoSs predictions lieinside the experimental phase envelope.
5. Conclusions
A two-constant cubic EoS has been introduced bymatching the critical fugacity coefficient of the EoSequal to the fugacity coefficient of methane at thecritical point. A recently augmented Soave's α function
Fig. 7. Experimental (Avila et al., 2002a) and predicted phase envelopes for the natural gas mixture M22.
264 Kh. Nasrifar, O. Bolland / Journal of Petroleum Science and Engineering 51 (2006) 253–266
has been used for the temperature dependence of theattractive parameter in the EoS. The developed EoS haspredicted the natural gas compressibility factors andspeeds of sound data of some natural gas mixtures betterthan the expected accuracy of two-constant EoSs. Inpredicting these properties, the new EoS has shownremarkable superiority when compared to other EoSs,especially the cubic ones. The accuracy of the EoS inpredicting other natural gas properties, i.e., isobaric heatcapacity, Joule–Thomson coefficient, and calculatingdew points, phase envelopes and flash yields, is similarto the RK family EoSs.
List of symbolsa attractive parameterb molar co-volumeb1, b2, b3 parameters defined by Eqs. (10)–(12)B2 second virial coefficientkij binary interaction parameter
Fig. 8. Experimental (Avila et al., 2002b) and predicted
m parameter defined by Eq. (13)n number of pointsP pressureR universal gas constantT temperaturev volumex mole fraction
Greek Lettersα temperature dependence for attractive
parameterδ1, δ2 constants in Eq. (1)ω acentric factorΩa, Ωb constants in Eqs. (2) and (3)
Subscriptsc critical propertyr reduced property
Acknowledgement
The authors express their appreciations to Statoil,Norway, for supporting this work.
References
AGA, Report No. 3= ANSI/API 2530, 1978. Orifice Metering ofNatural Gas. American National Standard Institute (ANSI), NewYork.
Avila, S., Blanco, S.T., Velasco, I., Rauzy, E., Otín, S., 2002a.Thermodynamic properties of synthetic natural gases: 2. Dew pointcurves of synthetic natural gases and their mixtures with water andmethanol. Measurement and correlation. Energy Fuels 16,928–934.
Avila, S., Blanco, S.T., Velasco, I., Rauzy, E., Otín, S., 2002b.Thermodynamic properties of synthetic natural gases: 1. Dew-point curves of synthetic natural gases and their mixtures withwater and methanol. Measurement and correlation. Ind. Eng.Chem. Res. 41, 3714–3721.
Barreau, A., Janneteau, P., Gaillard, K., 1996. Isobaric heat capacity ofnatural gases. Measurements and modelling. Fluid Phase Equilib.119, 197–212.
Benedict, M., Webb, G.B., Rubin, L.C., 1940. An empirical equationfor thermodynamic properties of light hydrocarbons and theirmixtures, methane, ethane, propane and n-butane. J. Chem. Phys.8, 334–345.
Čapla, L., Buryan, P., Jedelský, J., Rottner, M., Linek, J., 2002.Isothermal PVT measurements on gas hydrocarbon mixturesusing a vibrating-tube apparatus. J. Chem. Thermodyn. 34,657–667.
Costa Gomes, M.F., Trusler, J.P.M., 1998. The speed of sound in twomethane-rich gas mixtures at temperatures between 250K and350K and at pressures up to 20MPa. J. Chem. Thermodyn. 30,1121–1129.
Daubert, T.E., Danner, R.P., 1992. Physical and ThermodynamicProperties of Pure Chemicals, Data Compilation. HemispherePublishing Corp., London, UK.
Ernst, G., Keil, R., Wirbser, H., Jaeschke, M., 2001. Flow-calorimetricresults for the massic heat capacity cp and the Joule–Thomson
coefficient of CH4, of (0.85 CH4+0.15 C2H6), and of a mixturesimilar to natural gas. J. Chem. Thermodyn. 33, 601–613.
Estela-Uribe, J.F., Trusler, J.P.E., 2001. Extended corresponding statesequation of state for natural gas systems. Fluid Phase Equilib. 183–184, 21–29.
Estela-Uribe, J.F., De Mondoza, A., Trusler, J.P.E., 2004. Extendedcorresponding states model for fluids and fluid mixtures II.Application to mixtures and natural gas systems. Fluid PhaseEquilib. 216, 59–84.
Firoozabadi, A., Hekim, Y., Katz, D.L., 1978. Reservoir depletioncalculation for gas condensates. Can. Chem. Eng. 56, 610–615.
Flöter, E., de Loos, Th.W., de Swaan Arons, J., 1998. Improvedmodeling of the phase behavior of asymmetric hydrocarbonmixtures with the Peng–Robinson equation of state using adifferent temperature dependency of the parameter a. Ind. Eng.Chem. Res. 37, 1651–1662.
Gasem, K.A.M., Gao, W., Pan, Z., Robinson Jr., R.L., 2001. Amodified temperature dependence for the Peng–Robinson equa-tion of state. Fluid Phase Equilib. 181, 113–125.
Guo, T.-M., Du, L., 1989. A three-parameter cubic equation of state forreservoir fluids. Fluid Phase Equilib. 52, 47–57.
Hall, K.R., Yarborough, L., 1973. A new equation of state for Z-factorcalculations. Oil Gas J. 18, 82–92 (June).
Haynes, W.M., 1982. Measurements of orthobaric-liquid densities ofmulticomponent mixtures of LNG components (N2, CH4, C2H6,C3H8, CH3CH(CH3)CH3, C4H10, CH3CH(CH3)C2H5 and C5H10)between 110 and 130K. J. Chem. Thermodyn. 14, 603–612.
Haynes, W.M., Hiza, M.J., 1977. Measurements of the orthobaricliquid densities of methane, ethane, propane, isobutane, andnormal butane. J. Chem. Thermodyn. 9, 179–187.
Hiza, M.J., Haynes, W.M., 1980. Orthobaric liquid densities andexcess volumes for multicomponent mixtures of low molar massalkanes and nitrogen between 105 and 125K. J. Chem. Thermo-dyn. 12, 1–10.
Hoffmann, A.E., Crump, J.S., Hocott, C.R., 1953. Equilibriumconstants for a gas condensate system. Petrol. Trans. AIME 198,1–10.
Hwang, C.-A., Simon, P.P., Hou, H., Hall, K.R., Holste, J.C., Marsh,K.N., 1997. Burnett and pycnometric (p, Vm, T) measurements fornatural gas mixtures. J. Chem. Thermodyn. 29, 1455–1472.
Jaeschke, M., Audibert, S., van Caneghem, P., Humphreys, A.E.,Janssen-van Rosmalen, R., Pellei, Q., Michels, J.P., Schouten, J.A.,ten Seldam, C.A., 1989. High accuracy compressibility factor fornatural gases and similar mixtures by use of a truncated virialequation. GERG Technical Monograph, vol. TM2.
Jaubert, J.-N., Mutelet, F., 2004. VLE prediction with Peng–Robinson equation of state and temperature dependent kijcalculated through a group contribution method. Fluid PhaseEquilib. 224, 285–304.
Magee, J.M., Haynes, W.M., Hiza, M.J., 1997. Isochoric (p, ρ, T)measurements for five natural Gas mixtures from T=(225 to 350)K at pressures to 35MPa. J. Chem. Thermodyn. 29, 1439–1454.
Mathias, P.M., 2003. The second virial coefficient and the Redlich–Kwong equation. Ind. Eng. Chem. Res. 42, 7037–7044.
McCarty, R.D., 1982. Mathematical models for the prediction ofliquefied-natural-gas densities. J. Chem. Thermodyn. 14,837–854.
Mohsen-Nia, M., Moddaress, H., Mansoori, G.A., 1994. Sour naturalgas and liquid equation of state. J. Pet. Sci. Eng. 12, 127–136.
266 Kh. Nasrifar, O. Bolland / Journal of Petroleum Science and Engineering 51 (2006) 253–266
Nasrifar, Kh., Bolland, O., 2004. Square-well potential and a new αfunction for the Soave–Redlich–Kwong equation of state. Ind.Eng. Chem. Res. 43, 6901–6909.
Nasrifar, Kh., Moshfeghian, M., 2004. Application of an improvedequation of state to reservoir fluids: computation of minimummiscibility pressure. J. Pet. Sci. Eng. 42, 223–234.
Nasrifar, Kh., Bolland, O., Moshfeghian, M., 2005. Predicting naturalgas dew points from 15 equations of state. Energy Fuels 19,561–572.
Patel, N.C., Teja, A.S., 1982. A new cubic equation of state for fluidsand fluid mixtures. Chem. Eng. Sci. 37, 463–473.
Pedersen, K.S., Blilie, A.L., Meisingset, K.K., 1992. PVT calculationson petroleum reservoir fluids using measured and estimatedcompositional data for the plus fraction. Ind. Eng. Chem. Res. 31,1378–1384.
Peng, D.-Y., Robinson, D.B., 1976. A new two-constant equation ofstate. Ind. Eng. Chem. Fundam. 15, 59–64.
Redlich, O., Kwong, J.N.S., 1949. On the thermodynamics ofsolutions: V. An equation of state: Fugacities of gaseous solutions.Chem. Rev. 44, 233–244.
Schmidt, G., Wenzel, H., 1980. A modified van der Waals typeequation of state. Chem. Eng. Sci. 35, 1503–1512.
Soave, G., 1972. Equilibrium constants from a modified Redlich–Kwong equation of state. Chem. Eng. Sci. 27, 1197–1203.
Twu, C.H., 1984. An internally consistent correlation for predicting thecritical properties and molecular weights of petroleum and coal tarliquids. Fluid Phase Equilib. 16, 137–150.
Twu, C.H., Coon, J.E., Cunningham, J.R., 1995. A new generalizedalpha function for a cubic equation of state: Part 2. Redlich–Kwong equation. Fluid Phase Equilib. 105, 61–69.
Valderrama, J.O., 1990. A generalized Patel–Teja equation of state forpolar and nonpolar fluids and their mixtures. J. Chem. Eng. Jpn.23, 87–91.
Van der Kooi, H.J., Flöter, E., de Loos, Th.W., 1995. High pressurephase equilibria of {(1−x)CH4+xCH3(CH2)18CH3}. J. Chem.Thermodyn. 27, 847–861.
Wagner, W., de Reuck, K.M., 1996. (IUPAC). Methane. InternationalThermodynamic Tables of the Fluid State, vol. 13. Blackwell,Oxford, UK.
Yarborough, L., Vogel, J.L., 1967. A new system for obtaining vaporand liquid sample analyses to facilitate the study of multicompo-nent mixtures at elevated pressures. Chem. Eng. Symp. Ser. 63,1–9.
Younglove, B.A., Ely, J.F., 1987. Thermophysical properties of fluidsII. Methane, ethane, propane, isobutane, and normal butane. J.Phys. Chem. Ref. Data 16, 577–798.
Younglove, B.A., Frederick, N.V., McCarty, R.D., 1993. Speed ofsound data and related models for mixtures of natural gasconstituents. NIST Monograph, vol. 178.