Page 1
SAPience.be TECHday 2016
Your logo
Predictive Quality Management:
Predict the quality while producing!
Leemans, Katelijne
[email protected]
1
Nemery, Philippe
[email protected]
nemeryphilippe@nemeryp
Page 2
Your logo
SAPience.be TECHday 2016
Agenda
1. Introduction to IoT and Indurstry 4.0
2. Koehler Paper Group:
1. Introduction
2. Their main production challenges
3. Predictive Quality:
1. Global Approach
2. Main Components
3. Predictive Analytics
4. Outcome of the project and benefit for Koehler
5. Summary
6. Questions and Answers
2
Page 3
Your logo
SAPience.be TECHday 2016
Agenda
1. Introduction to IoT and Indurstry 4.0
2. Koehler Paper Group:
1. Introduction
2. Their main production challenges
3. Predictive Quality:
1. Global Approach
2. Main Components
3. Predictive Analytics
4. Outcome of the project and benefit for Koehler
5. Summary
6. Questions and Answers
3
Page 4
Your logo
SAPience.be TECHday 2016
Introduction to IoT 4.0
4
Predictive Quality Management
provides an answer
to this challenge and will be
coupled with Predictive
Maintenance.
McKinsey, 2015:
“Industry 4.0: the ability to monitor and
control all tools of production and use the
data collected to improve productivity and
quality in factory settings.
Gain a comprehensive view of what is
going on at every point in the production
process.
Make real-time adjustments to maintain an
uninterrupted flow
of finished goods and avoid defects.”
Page 5
Your logo
SAPience.be TECHday 2016
Quality
Production Data
Machine Data
Engineering
Returns
Planning(production, HR)
Logistics
Services(partners)
Maintenance
Sales(delivery)
CustomerSatisfaction
Sourcing
Finance
BrandRecognition
Price
What is impacted by bad quality in manufacturing?
Page 6
Your logo
SAPience.be TECHday 2016
Agenda
1. Introduction to IoT and Indurstry 4.0
2. Koehler Paper Group:
1. Introduction
2. Their main production challenges
3. Predictive Quality:
1. Global Approach
2. Main Components
3. Predictive Analytics
4. Outcome of the project and benefit for Koehler
5. Summary
6. Questions and Answers
6
Page 7
Your logo
SAPience.be TECHday 2016
Koehler Paper Group
7
Koehler Paper Group – one of
the very few independent and
family owned paper groups in
Europe
7 paper machines and 1 board
machine at 4 locations
Sales Volume 2014: 500.000 t
Sales Value 2014:650 Mio. €
Employees 2014: 1.694
Papierfabrik August Koehler SE
Oberkirch
Koehler Kehl GmbH Kehl
Page 8
Your logo
SAPience.be TECHday 2016
Driver of the Pilot
8
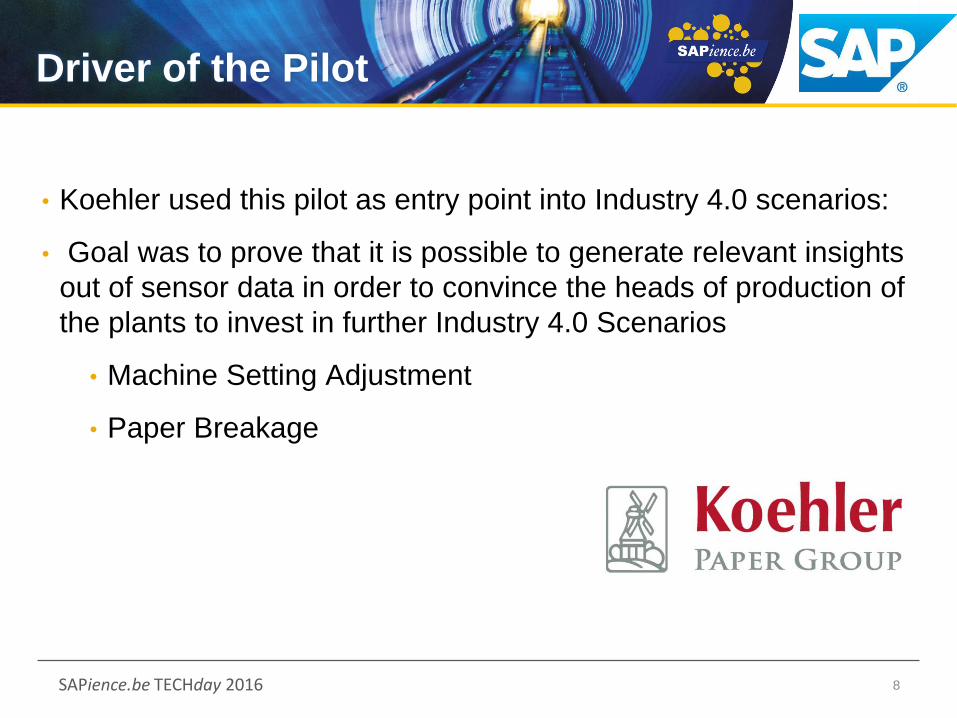
• Koehler used this pilot as entry point into Industry 4.0 scenarios:
• Goal was to prove that it is possible to generate relevant insights
out of sensor data in order to convince the heads of production of
the plants to invest in further Industry 4.0 Scenarios
• Machine Setting Adjustment
• Paper Breakage
Page 9
Your logo
SAPience.be TECHday 2016
Forecasting - Predictions
?NOW
PAST FUTURE
Time-Window
Page 10
Your logo
SAPience.be TECHday 2016
?
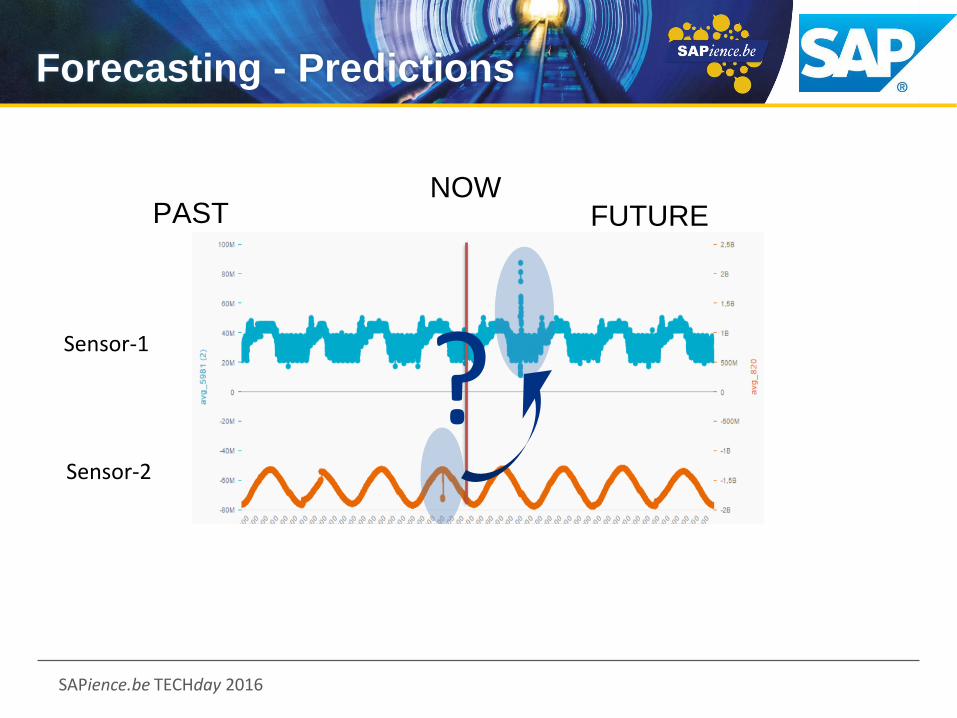
Forecasting - Predictions
NOWPAST FUTURE
Sensor-1
Sensor-2
Page 11
Your logo
SAPience.be TECHday 2016
NOWPAST FUTURE
Time-
Window
Sensor-1
Sensor-2
Action-Window
Action-Window: time during
which an action can be taken
(e.g. 10 minutes)?
Classification: Will there be an incident in 10 minutes?
Regression: What is the value in 10 minutes?
Forecasting - Predictions
Page 12
Your logo
SAPience.be TECHday 2016
Challenges
12
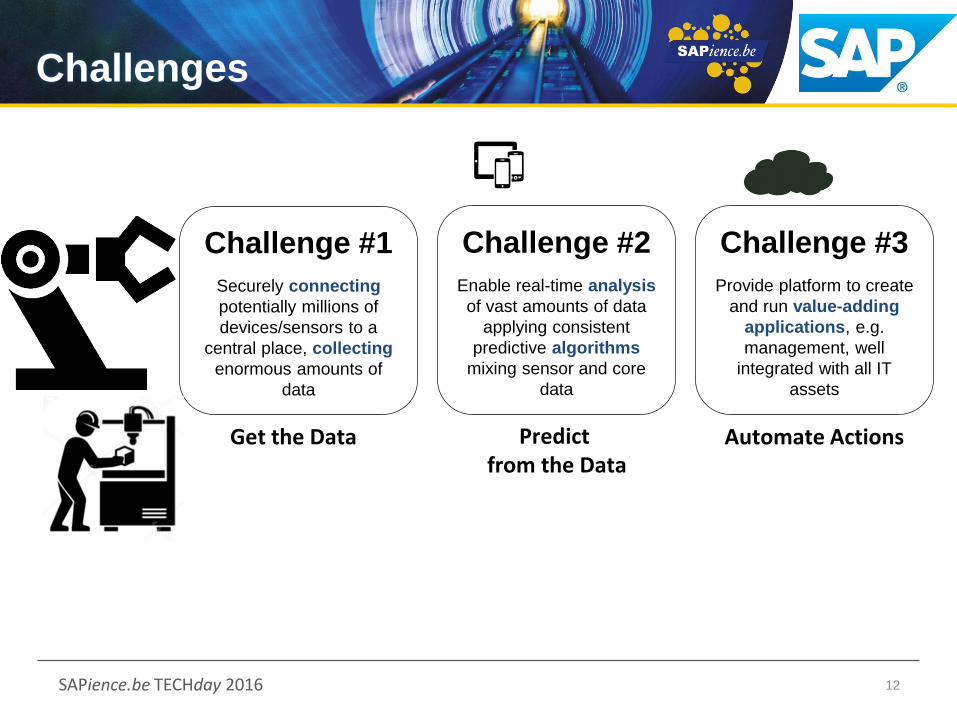
Challenge #1
Securely connecting
potentially millions of
devices/sensors to a
central place, collecting
enormous amounts of
data
Challenge #3
Provide platform to create
and run value-adding
applications, e.g.
management, well
integrated with all IT
assets
Challenge #2
Enable real-time analysis
of vast amounts of data
applying consistent
predictive algorithms
mixing sensor and core
data
Get the Data Predictfrom the Data
Automate Actions
Page 13
Your logo
SAPience.be TECHday 2016
Requirements
13
Goal: Realize a real-time prediction of quality parameters based on
sensor data and display it to machine operators
Combine sensor data, camera data and business data in a
common data model
Camera data amount varies strongly depending on the
condition of the paper roll
OnPremise Architecture
For the pilot no hot store/cold store concept needed
Page 14
Your logo
SAPience.be TECHday 2016
Agenda
1. Introduction to IoT and Indurstry 4.0
2. Koehler Paper Group:
1. Introduction
2. Their main production challenges
3. Predictive Quality:
1. Global Approach
2. Main Components
3. Predictive Analytics
4. Outcome of the project and benefit for Koehler
5. Summary
6. Questions and Answers
14
Page 15
Your logo
SAPience.be TECHday 2016
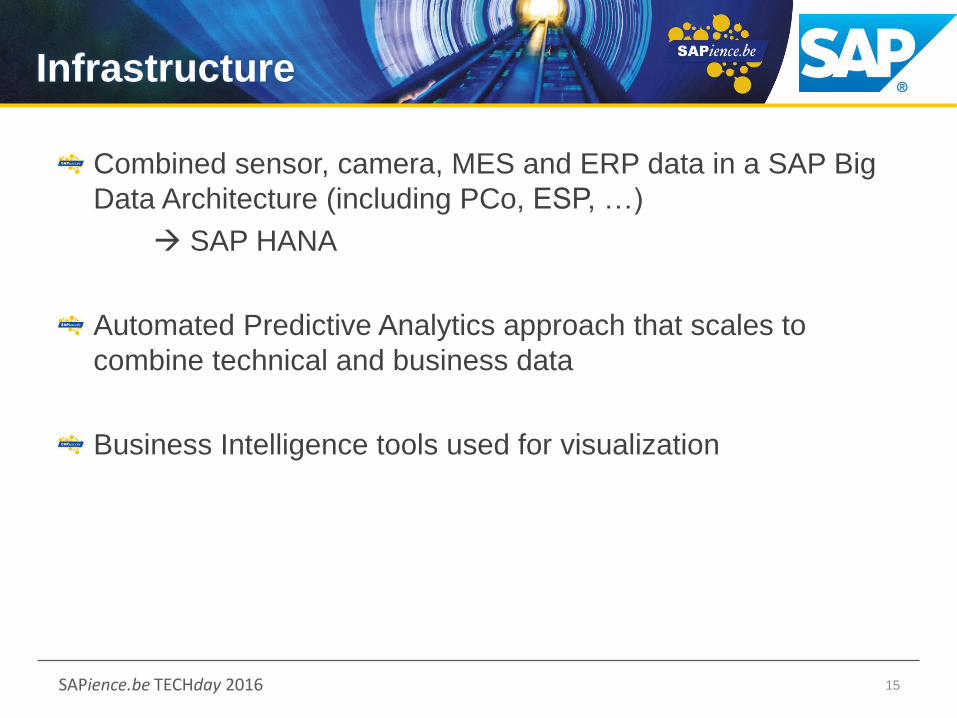
Infrastructure
Combined sensor, camera, MES and ERP data in a SAP Big
Data Architecture (including PCo, ESP, …)
SAP HANA
Automated Predictive Analytics approach that scales to
combine technical and business data
Business Intelligence tools used for visualization
15
Page 16
Your logo
SAPience.be TECHday 2016
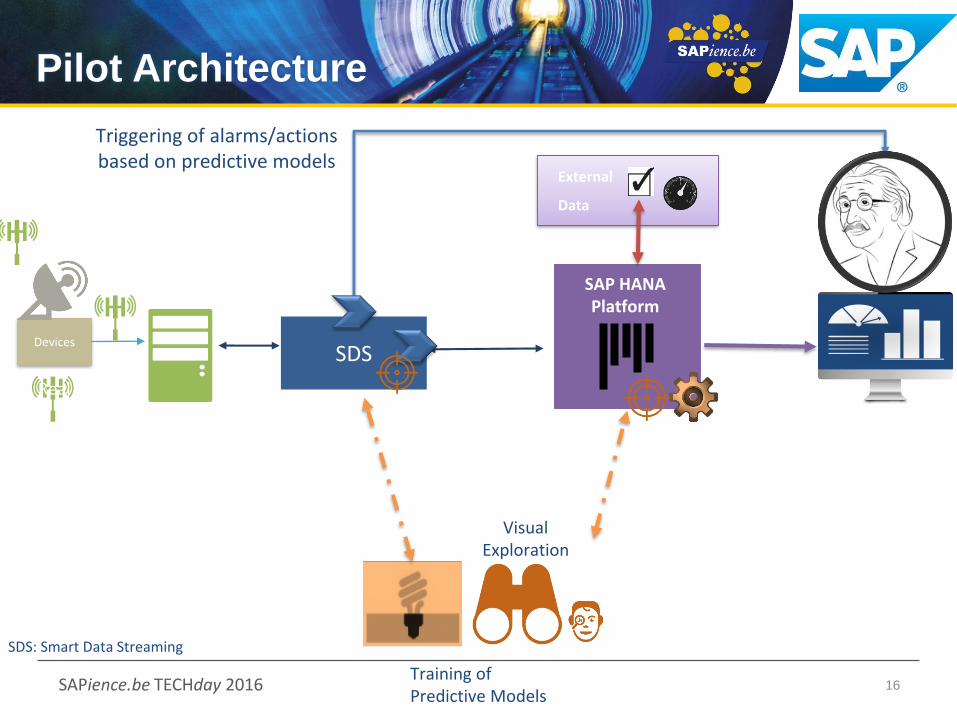
Pilot Architecture
16
Devices
BO Dashboards
External
Data
Financial, Sales
Training of Predictive Models
SDS
Triggering of alarms/actionsbased on predictive models
SDS: Smart Data Streaming
Real Time
Gateway System
Real-time Stream Analysis
Visual Exploration
SAP HANA Platform
Page 17
Your logo
SAPience.be TECHday 2016
Pilot Architecture
17
Devices
BO Dashboards
External
Data
Financial, Sales
Training of Predictive Models
SDS
Triggering of alarms/actionsbased on predictive models
SDS: Smart Data Streaming
Real Time
Gateway System
Real-time Stream Analysis
Visual Exploration
SAP HANA Platform
Page 18
Your logo
SAPience.be TECHday 2016
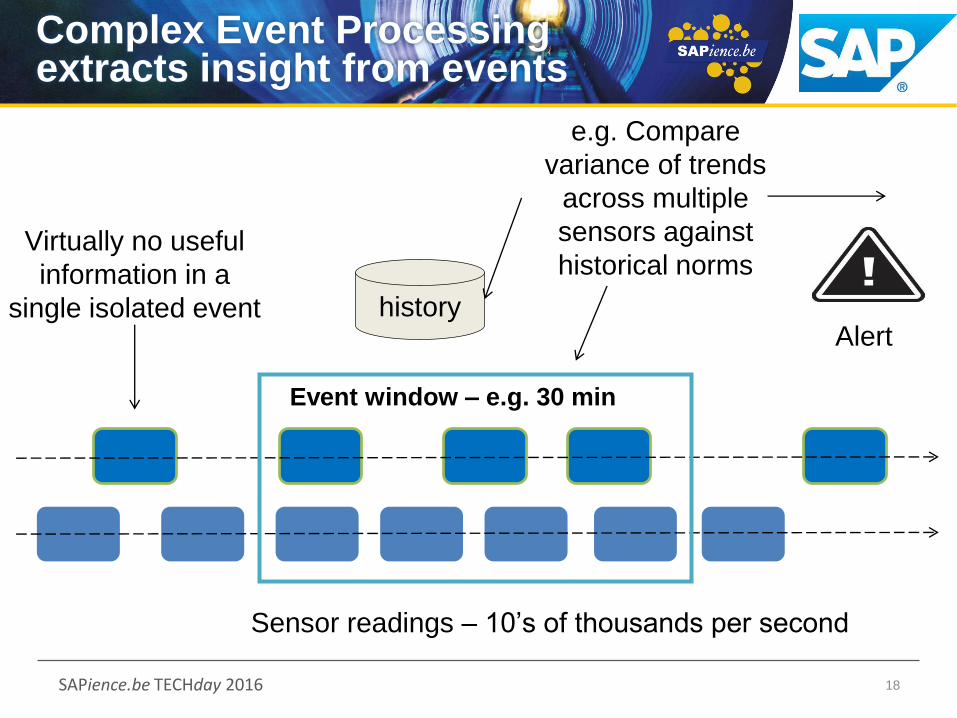
Complex Event Processing extracts insight from events
18
Sensor readings – 10’s of thousands per second
Virtually no useful
information in a
single isolated event history
e.g. Compare
variance of trends
across multiple
sensors against
historical norms
Event window – e.g. 30 min
Alert
Page 19
Your logo
SAPience.be TECHday 2016
Creating equidistant data and provisioning data stores
19
• Streams and windows, CCL script
• Create, enrich and aggregate equidistant data
• Publish raw data to hdfs and aggregates to HANA tables
Page 20
Your logo
SAPience.be TECHday 2016
Apply SAP Predictive Analytics Model within SAP SDS
20
Automated Analytics now supports
smart data streaming
Generates CCL Code which can be
deployed to HANA SDS
Page 21
Your logo
SAPience.be TECHday 2016
Pilot Architecture
21
Devices
BO Dashboards
External
Data
Financial, Sales
Training of Predictive Models
SDS
Triggering of alarms/actionsbased on predictive models
SDS: Smart Data Streaming
Real Time
Gateway System
Real-time Stream Analysis
Visual Exploration
SAP HANA Platform
Page 22
Your logo
SAPience.be TECHday 2016
Real-Time Alerting
22
Page 23
Your logo
SAPience.be TECHday 2016
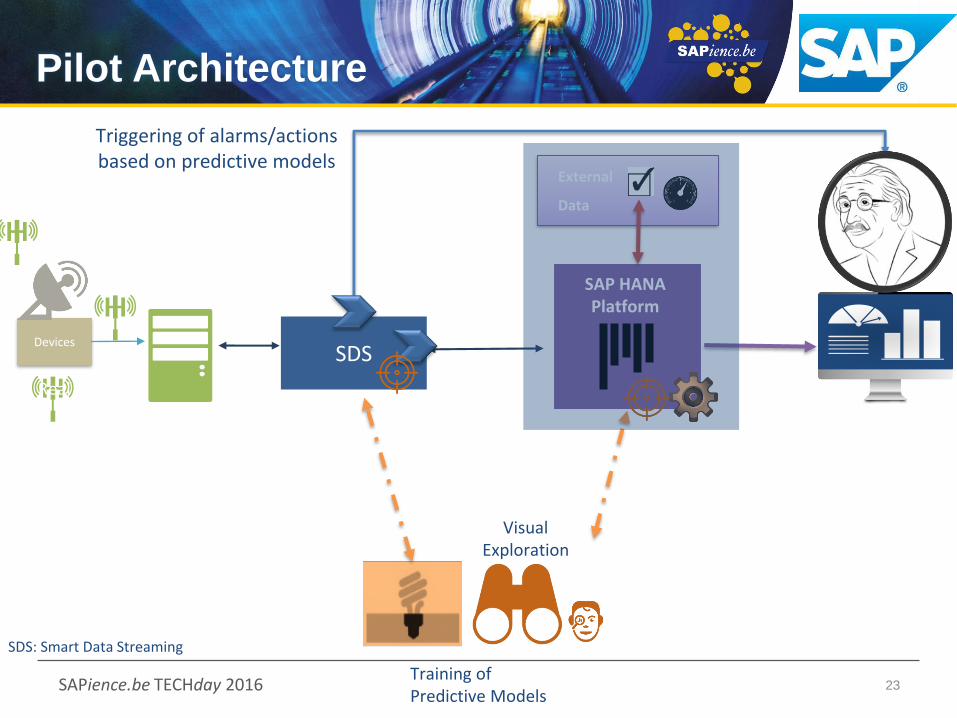
Pilot Architecture
23
Devices
BO Dashboards
External
Data
Financial, Sales
Training of Predictive Models
SDS
Triggering of alarms/actionsbased on predictive models
SDS: Smart Data Streaming
Real Time
Gateway System
Real-time Stream Analysis
Visual Exploration
SAP HANA Platform
Page 24
Your logo
SAPience.be TECHday 2016
The Hana Platform
24
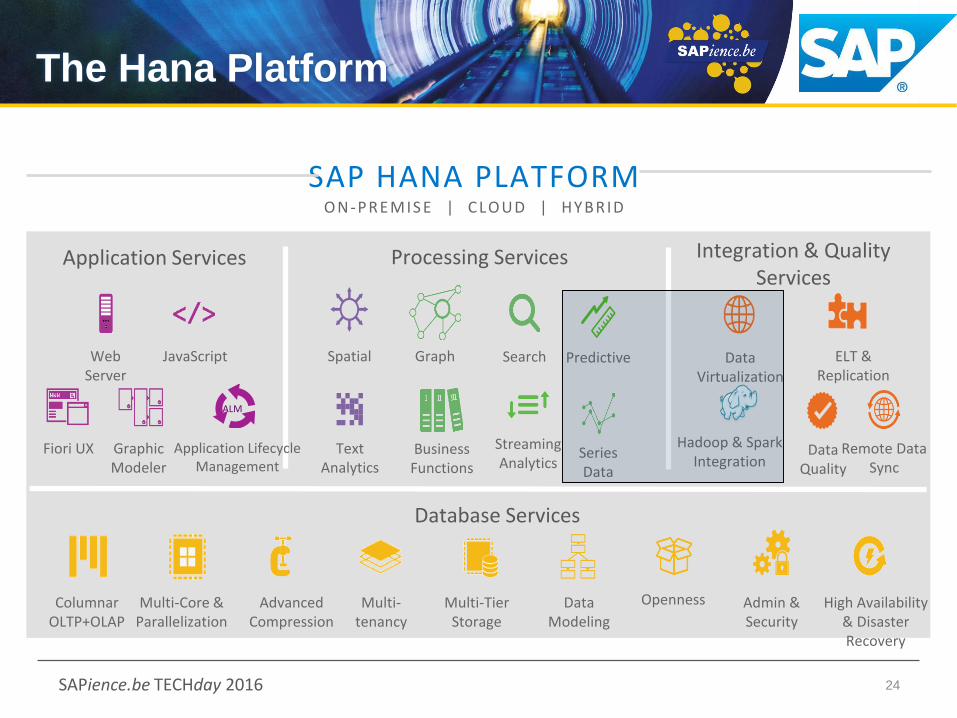
SAP HANA PLATFORMO N -PREMIS E | C LO UD | HY BRID
Web Server
JavaScript
Fiori UX Graphic Modeler
ELT & Replication
Application Services Integration & Quality Services
Columnar OLTP+OLAP
Multi-Core &Parallelization
Advanced Compression
Multi-tenancy
Multi-Tier Storage
Spatial Graph Search
Text Analytics
DataQuality
Business Functions
ALM
Processing Services
Database Services
Streaming Analytics
Application Lifecycle Management
High Availability & Disaster Recovery
OpennessData Modeling
Remote DataSync
Admin & Security
Data Virtualization
Predictive
SeriesData
Hadoop & Spark Integration
Page 25
Your logo
SAPience.be TECHday 2016
The Hana Platform
25
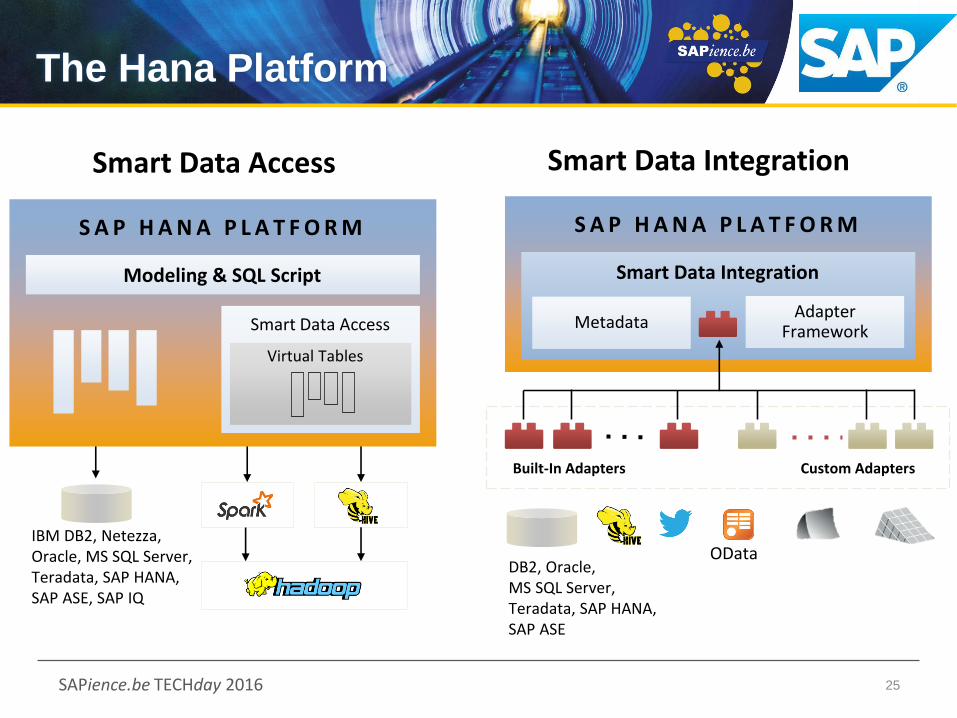
IBM DB2, Netezza, Oracle, MS SQL Server, Teradata, SAP HANA, SAP ASE, SAP IQ
Modeling & SQL Script
S A P H A N A P L A T F O R M
Smart Data Access
Virtual Tables
Smart Data Integration
Built-In Adapters Custom Adapters
ODataDB2, Oracle, MS SQL Server, Teradata, SAP HANA, SAP ASE
Adapter Framework
Metadata
S A P H A N A P L A T F O R M
Smart Data Access Smart Data Integration
Page 26
Your logo
SAPience.be TECHday 2016
Time Series Data in SAP HANA
Store
Support both equidistant and non-
equidistant data
Support very high volumes of data
using effective compression
techniques
Handle
Efficient grouping to different
granularities (GROUP BY
SERIES_ROUND(…))
Built in SQL functions for efficient
handling of Series Data
• SERIES_GENERATE;
• SERIES_DISAGGREGATE;
• SERIES_ROUND;
• SERIES_PERIOD_TO_ELEMENT;
• SERIES_ELEMENT_TO_PERIOD
26
Analyze
Analytic operations to be expressed naturally in SQL while maintaining high performance
– AUTO_CORR, CROSS_CORR
– BINNING
– CUBIC_SPLINE_APPROX, LINEAR_APPROX
– DFT
– RANDOM_PARTITION
– SERIES_FILTER
– WEIGHTED_AVG
– Sliding window support
– {FIRST/NTH/LAST}_VALUE
Page 27
Your logo
SAPience.be TECHday 2016
Predictive Analytics in SAP HANA
27
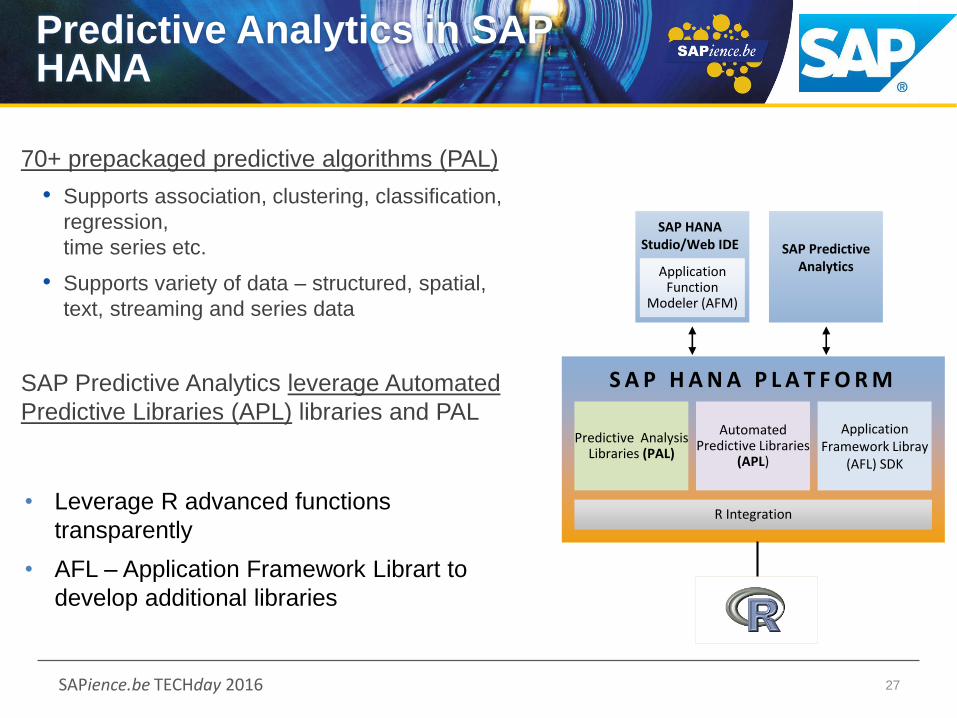
70+ prepackaged predictive algorithms (PAL)
• Supports association, clustering, classification,
regression,
time series etc.
• Supports variety of data – structured, spatial,
text, streaming and series data
SAP Predictive Analytics leverage Automated
Predictive Libraries (APL) libraries and PAL
SAP HANA Studio/Web IDE
Application Function
Modeler (AFM)
SAP Predictive Analytics
S A P H A N A P L A T F O R M
Predictive Analysis Libraries (PAL)
R Integration
Application Framework Libray
(AFL) SDK
Automated Predictive Libraries
(APL)
• Leverage R advanced functions
transparently
• AFL – Application Framework Librart to
develop additional libraries
Page 28
Your logo
SAPience.be TECHday 2016
Pilot Architecture
28
Devices
BO Dashboards
External
Data
Financial, Sales
Training of Predictive Models
SDS
Triggering of alarms/actionsbased on predictive models
SDS: Smart Data Streaming
Real Time
Gateway System
Real-time Stream Analysis
Visual Exploration
SAP HANA Platform
Page 29
Your logo
SAPience.be TECHday 2016
Advanced Analytics
29
Providing insight and actionable results to business users
?
Page 30
Your logo
SAPience.be TECHday 2016
Advanced Analytics
30
Providing insight and actionable results to business users
• SAP Lumira is used to vizualise Sensor Data and provide quickly insight to Quality and Production Managers
• SAP PA is used to identifyRoot Causes leading to beaksand quality claims
Page 31
Your logo
SAPience.be TECHday 2016
Advanced Analytics
SAPience.be TECHday ‘15 31
Usage of type-blending models to overcome small
training data sizes and adaptation to first-time materials
Prediction abilities in the range of product
specifications.
In the areas with low amount of data, good results
despite weak confidence of the model
Page 32
Your logo
SAPience.be TECHday 2016
Agenda
1. Introduction to IoT and Indurstry 4.0
2. Koehler Paper Group:
1. Introduction
2. Their main production challenges
3. Predictive Quality:
1. Global Approach
2. Main Components
3. Predictive Analytics
4. Outcome of the project and benefit for Koehler
5. Summary
6. Questions and Answers
32
Page 33
Your logo
SAPience.be TECHday 2016
Predictive Quality Management
ERP warranties
Manufacturing Execution
Production line sensors
Alarms
Quality tests
Data Fusion
Data Processing
Derive sensor values /
claim status for each
finished roll
Predictive
Predict for certain sensor
combinations whether they will
yield a quality ‘leak’
82% true positive rate
89% true negative rate
Analytics
Claim validation
3D sensor data visualization
Big data transactional
analytics
Control charts
Page 34
Your logo
SAPience.be TECHday 2016
Agenda
1. Introduction to IoT and Indurstry 4.0
2. Koehler Paper Group:
1. Introduction
2. Their main production challenges
3. Predictive Quality:
1. Global Approach
2. Main Components
3. Predictive Analytics
4. Outcome of the project and benefit for Koehler
5. Summary
6. Questions and Answers
34
Page 35
Your logo
SAPience.be TECHday 2016
Summary
35
SAP
Analytical
Platform
Future-Proof
Analytical Roadmap
Series Data
Capture and analyze a sequence of
successive data points made over a
time interval
.
Enterprise E2E Platform
Centralized administration, management &
auditing
Advanced & Real-Time
Analytics
Experience
Project Approach and Partner network
Different Users
Role-based and maturity-based
approach
Flexibility and Agility
Page 36
Your logo
SAPience.be TECHday 2016
Agenda
1. Introduction to IoT and Indurstry 4.0
2. Koehler Paper Group:
1. Introduction
2. Their main production challenges
3. Predictive Quality:
1. Global Approach
2. Main Components
3. Predictive Analytics
4. Outcome of the project and benefit for Koehler
5. Summary
6. Questions and Answers
36
Page 37
Thank you!
Your logo
37


![Fraud Detection and Event Processing for Predictive · PDF fileFRAUD DETECTION AND EVENT PROCESSING FOR PREDICTIVE BUSINESS Introduction In his latest book, The Power to Predict[1],](https://static.documents.pub/doc/80x56/5aaac7c67f8b9a86188e79d8/fraud-detection-and-event-processing-for-predictive-detection-and-event-processing.jpg)

