Page 1
i
Predictors of Academic Achievement, Motivation and
Student Disengagement in University Students
Aleisha Howlett
A report submitted as partial requirement for the degree of Bachelor of Behavioural
Science with Honours in Psychology at the University of Tasmania, 2015
Page 2
ii
Statement of Sources
I declare that this report is my own original work and that contributions of others
have been duly acknowledged.
Signature: Aleisha Howlett Date: 15/10/15
Page 3
iii
Acknowledgements
First and foremost I would like to acknowledge the assistance and guidance I
received from my supervisor Dr Kimberley Norris. Further, I would like to express
my greatest thanks for her continual support, advice and feedback throughout the
year it was immensely appreciated. I would also like to thank my Mum for her
continuous support, encouragement and late night proof readings throughout the
year. In addition, I would like to thank my family for their understanding and
encouragement. Thanks to all the students for participating in this study who made
this research possible.
Page 4
iv
Table of Contents
Abstract……………………………………………………………………………. 1
Introduction……………………………………………………………………….. 2
Self-Worth Theory and Deflective Strategies……………………………… 4
Quadripolar Model of Need of Achievement……………………………… 7
Supporting evidence for the QMNA…………………………...………….. 10
The Motivation and Engagement Wheel………...……………………........ 12
Overlap in Theories………………………………………………………… 14
The Current Study…………………………………………………………. 14
Method……………………………………………………………………………... 15
Participants…………………………………………………………………. 15
Materials…………………………...………………………………………. 16
Procedure……………………...…………………………………………… 19
Design and Analysis …………………………………………………...….. 20
Results………………………………………..……………………………………. 21
Data Screening……………………………..……………………………… 21
Descriptive Statistics………………………………….…….…………….. 22
Correlations between variables……………………………..…………….... 24
Multiple regression analyses……………………………………………..... 25
Discussion…………………………………………………………………………. 27
Page 5
v
Fear-of-Failure and the Self-Handicapping Relationship………………… 28
Success-Orientation and Self-Protective Strategies………………………. 30
Predictive utility of the QMNA and the MEW…………………………… 35
General Limitations and Directions for Future Research…………………. 37
Summary of Findings……………………………………………………… 38
References…………………………………………………………………………. 40
Appendices………………………………………………………………………… 46
Appendix A Minimal Risk Ethics Application Approval ………................ 46
Appendix B Information Sheet for Participants…………………………… 49
Appendix C Demographic Questionnaire…………………………………. 53
Appendix D Summary of Descriptive Statistics and Correlations between
Variables………………………………………………………………….. 56
Appendix E Summary of Demographic Variables Predicting Self-
handicapping and Defensive Pessimism………………………………….. 59
Appendix F Summary of Hierarchical Regression Analyses Predicting Self-
handicapping and Defensive Pessimism………………………………….. 63
Appendix G Summary of Stepwise Regression Comparing the Predictive
Utility of the two Models in regards to Self-handicapping and Defensive
Pessimism…………………………………………………………………. 67
Page 6
vi
List of Tables
Table 1 Demographic Variables of Participants…………………………… 16
Table 2 Means and Standard Deviations, and Pearson Product Moment
Correlations for Each Variable……………………………………. 23
Table 3 Percentage of Students that fell into Low, Medium or High
Classifications for Each Variable…………………………………. 24
Page 7
vii
List of Figures
Figure 1. The Quadripolar Model of Need Achievement………………………… 8
Figure 2. The Motivation and Engagement Wheel………………………………. 13
Page 8
viii
Predictors of Academic Achievement,
Motivation and Student Disengagement in
University Students
Aleisha Howlett
Word Count: 9,406
Page 9
1
Abstract
The aim of this study was to expand the work on academic achievement and
motivation by examining the relationships among success-orientation, fear-of-failure
and academic disengagement in university students. Further, the cognitive-
behavioural Quadripolar and Motivation and Engagement theories were included to
determine whether the models independently contribute to the prediction of self-
handicapping and defensive pessimism. Participants were 110 university students
enrolled at the University of Tasmania who completed a standardised questionnaire
assessing achievement orientation. The hypothesis that fear-of-failure would
positively correlate with self-handicapping and defensive pessimism in university
students was partially supported. A strong positive correlation was found between
fear-of-failure and self-handicapping, however a non-significant correlation was
found between fear-of-failure and defensive pessimism. Secondly, the hypothesis
that success-orientation would be negatively associated with self-handicapping
however positively associated with defensive pessimism was refuted as a non-
significant correlation was found for both relationships. The hypothesis that there
would be an interaction between success-orientation and fear-of-failure on self-
handicapping was also refuted. Lastly, due to the substantially small sample it was
not possible test the hypothesis that the dimensions of the Quadripolar Model of
Need Achievement would be positively associated with theoretically similar
dimensions of the Motivation and Engagement Wheel. Instead, the dimensions of
each model were compared for predictive utility regarding self-handicapping and
defensive pessimism. It was concluded that fear-of-failure in university students is a
significant predictor of self-handicapping. However further research is required with
a larger sample size to determine if the two theories are independent from each other.
Page 10
2
The importance of understanding student motivation and engagement in the
university context cannot be overestimated. High motivation and engagement has
been associated with a range of positive outcomes (e.g. excelling on tasks, graduating
from course/degree, progressing onto post-graduate courses and future career
options; Klem & Connell, 2004) whereas low motivation and engagement has been
associated with negative outcomes (e.g. financial costs and consequences of failing a
course; Nevill & Rhodes, 2006). In university settings academic outcomes are
extremely important due to the high-risk learning environment in which performance
outcomes can make the difference between a satisfying career and failure to achieve
accredited qualifications. University education requires students to learn and adapt to
new educational environments, and to cope with numerous associated stressors such
as increasing study demands, competing assignment deadlines, ambiguous tasks and
exam preparation (Ross, Niebling, & Heckert, 1999), all of which require the student
to be highly engaged and motivated. Furthermore, due to the weight placed on
university academic outcomes there is greater pressure on students at a university
level than a high school level to be self-directed in their study and to delegate their
time more effectively. Despite the high-risk learning environment of university, a
relative dearth of research has focussed on this vulnerable population, and instead
has primarily been orientated towards high school students and how motivation and
engagement influences their future academic success (Parker, Summerfeldt, Hogan,
& Majeski, 2004). However, considering the heavily weighted implications
associated with university academic outcomes and the continuously changing
demographics of the university population it is imperative that the mechanisms that
underpin motivation and engagement are understood.
Page 11
3
There are many different conceptualisations of student engagement and
motivation in academic literature, however they all share similar underlying
characteristics that involve a student’s attention, involvement and persistent effort
directed at learning (Klem & Connell, 2004; Marks, 2000) that in turn influence a
student’s academic successes and failures. Student motivation and engagement are
often terms coupled together as for a student to be engaged in their studies they must
also be motivated, for example to reach a set goal (e.g., high marks on an assignment
or graduating from a degree) or to avoid failure (Pintrich, 2003). Student motivation
and engagement can be viewed on a continuum in which levels fluctuate over time,
and in response to various challenges that students may be facing including increased
workload and time pressures (Lutz, Guthrie, & Davis, 2006). This reveals that
students cannot be simply classified as either possessing or lacking motivation and
engagement, but instead experience a complex interaction of the two constructs
which vary between individuals and over time.
In academic settings students are concerned with wanting to be perceived as
competent students that work hard and succeed in tasks (De Castella, Bryne, &
Covington, 2013). In contexts such as universities where performance is assessed the
consequences associated with failure are high in terms of both self-perceptions and
career opportunities. Students can avoid such failure by succeeding in academic tasks
or by managing and/or altering their meaning of failure by engaging in deflective
strategies (i.e. self-handicapping and defensive pessimism) designed to externalise
the cause of failure (De Castella et al., 2013). Researchers have found that
differences in student approaches to avoiding failure can be explained by the
cognitions underpinning such behaviour, and as such primarily categorise students as
having a fear-of-failure (i.e. being motivated by fear of anxiety associated with
Page 12
4
failure) or being success-orientated (i.e. being motivated to do well; Martin & Marsh,
2003). Students who are high in fear-of-failure are characterised by their fears and
doubts in their ability to succeed in academic tasks whereas students who are highly
success-orientated are argued to be motivated, resilient and excited to learn (De
Castella et al., 2013). Having a strong success-orientation enables a student to be
resilient in the face of failure, persist for high academic outcomes and remain
engaged in their studies (De Castella et al., 2013), whilst a fear-of-failure can either
act as a motivational drive for a student to persist and try hard in academic
assessments or it can make them vulnerable to disengage (Martin & Marsh, 2003).
Self-Worth Theory and Deflective Strategies
Self-worth theory is often used as a theoretical framework when examining why
some individuals are success-orientated and others have a fear-of-failure (De Castella
et al., 2013). Self-worth theory is based on the premise that the search for self-
acceptance is the highest priority an individual can strive for (Covington, 2009). It is
this search for acceptance that leads individuals towards certain orientations (i.e.
approach success or fear failure; De Castella et al., 2013). According to Covington
(1992) in a university setting self-acceptance is achieved from academic success and
competence in a task which in turn increases an individual’s sense of self-worth.
However this can exacerbate anxiety and further reinforce engagement in
maladaptive strategies (i.e. self-handicapping) for students who are already
vulnerable. This tends to occur less in highly success-orientated students as they
already have a strong sense of self-worth (Simons, Van Rheenen, & Covington,
1999) in which succeeding in academic tasks only acts to further reinforce their
positive self-beliefs.
Page 13
5
Unlike success-orientated students, students who fear failure commonly have a
low sense of self-worth (Simons et al., 1999). Incompetence or failure (perceived or
actual) in a task lowers a student’s sense of self-worth, confidence and self-esteem
regardless of their success/failure orientation (Covington, 2009). Research has shown
that in order to protect their self-worth, students who fear failure often employ
deflective strategies aimed to alter the meaning of such failure (De Castella et al.,
2013). Students who try to avoid the negative implications associated with failure
rationalise that these deflective strategies are the cause for their failure on a task
rather than lacking the ability, thereby protecting their sense of self-worth by
externalising the cause of failure (Simons et al., 1999). Two common deflective
strategies are self-handicapping and defensive pessimism (De Castella et al., 2013;
Martin, Marsh & Debus, 2001a).
Self-handicapping is a strategy that places the cause of failure away from the
student’s ability, using pre-planned excuses such as ‘I failed because I was too busy
to study’ (De Castella et al., 2013). This strategy alters the meaning of failure as
failure from lack of effort is less debilitating than failure following effort, thus
protecting an individual’s sense of self-worth (Norem & Cantor, 1986a). Self-
handicapping is evident through a number of behaviours such as task avoidance,
procrastination, purposely withholding effort, alcohol or drug use, and engaging in
activities that may debilitate performance on an academic task (Urdan & Midgley,
2001). Much of the research on academic self-handicapping has been associated with
a range of negative academic outcomes including lower academic achievement,
lower self-esteem and disengagement from studies (Urdan & Midgley, 2001). Thus it
would seem that although it appears to alleviate distress in the short-term, it can
result in a series of negative long-term outcomes.
Page 14
6
Similarly, defensive pessimism is another strategy students use to alter their
meaning of failure. Defensive pessimism is used when an individual disregards their
past successes and lowers their expectations of future performance before engaging
in a task (Norem & Cantor, 1986a; De Castella et al., 2013). An example of
defensive pessimism in an academic context includes a student having a
preconceived idea that they are going to fail on a task, even if they have previously
succeeded on a similar task. If failure should occur this strategy prepares and protects
students from the anxiety and loss of self-esteem associated with failing (Norem &
Cantor, 1986a). Similar to self-handicapping, defensive pessimism appears to
alleviate distress in the short-term however it is associated with a series of negative
long-term outcomes such as fatigue, emotional variability and eventually lower
academic performance (Norem & Cantor, 1989). Defensive pessimism in an
academic context has not received as much attention as self-handicapping in the
literature. This may be due to the fact that unlike self-handicapping which has an
array of strategies students can employ, defensive pessimism primarily only has one
strategy thus the need for such research may not have been warranted as the
motivations, behaviours, and consequences are considered clear. The current study
will therefore help to expand the research and give insight into the defensive
pessimism strategies employed within a university context.
Whilst self-handicapping and defensive pessimism may act to protect the
students’ sense of self-worth in the short term in the long term the failure that
students are trying to avoid often occurs regardless (De Castella et al., 2013). This is
primarily because after continued use of these strategies the excuses become
transparent and begin to lose much of their self-protective value (De Castella et al.,
2013). This reveals that ultimately self-handicapping and defensive pessimism are
Page 15
7
not adaptive strategies to be used in an academic context for achieving academic
success (Martin, Marsh, Williamson, & Debus, 2003). Furthermore, this also
suggests that deflective strategies are increasingly likely to hinder, rather than foster,
a student’s motivation and engagement in their studies.
Quadripolar Model of Need Achievement
Particularly in educational psychology, researchers have been interested in
why some students learn and perform well in learning contexts while other students
struggle to attain knowledge and resultantly perform poorly academically (Pintrich,
2003). A prominent theory in the academic achievement and motivational literature
is Covington’s (1992) Quadripolar Model of Need Achievement (QMNA). This
theory provides a framework for understanding the motives students use to avoid
failure and approach success (Martin et al., 2001a). In contrast to previous
conceptualisations in which success-orientation and fear-of-failure were considered
as opposites of the behavioural spectrum, the QMNA attempts to explain the
different motivational drives that result when students are either highly success-
orientated, failure-fearing, or have an interaction of the two (De Castella et al.,
2013). The two-dimensional structure of the model as shown in Figure 1 allows
students to be categorised into one of four orientations: optimists, overstrivers, self-
protectors and failure acceptors (Martin & Marsh, 2003). This theory is primarily
applied to academic achievement literature as it provides explanations for
disengagement and underperformance whilst simultaneously integrating self-
handicapping and defensive pessimism strategies used by students to protect their
self-worth (Martin et al., 2001a). Integrating self-handicapping and defensive
pessimism into the model allows researchers and teachers to see what type of
Page 16
8
students are most at risk of using these types of deflective strategies and the
preventative measures that can be put in place to reduce their use.
Figure 1. The Quadripolar Model of Need Achievement
Optimists
According to the QMNA students who are classified as optimists are high on
success-orientation and low on fear-of-failure (De Castella et al., 2013). These
students are argued to be characterised by their self-confidence (e.g. to succeed in a
task), resiliency, and high motivation and engagement in tasks (De Castella et al.,
2013). Due to the confidence optimists have in their abilities they are less likely to
engage in deflective strategies such as self-handicapping and defensive pessimism as
failure is something that is not often contemplated by these individuals (De Castella
et al., 2013).
Overstrivers
Individuals who manage their fears of failure by working hard to avoid such
failure meet the criteria of an overstriver. Overstrivers are high on both success-
Page 17
9
orientation and fear-of-failure (Martin & Marsh, 2003; De Castella et al., 2013).
Performance in overstrivers is largely driven by fear of underperformance (i.e.
failing) thus anxiety and low self-control remain high in these students (Martin &
Marsh, 2003). Whilst students in this category often achieve success, it is often at a
cost (De Castella et al., 2013). Constant hard efforts to avoid failure commonly
results in students feeling fatigue, burnout and difficulty dealing with setback and/or
challenges (Hui-Jen, 2004). Although overstriving students may demonstrate
defensive thinking it is unlikely to translate into deflective strategies/behaviours such
as self-handicapping and defensive pessimism (De Castella et al., 2013). This is
because these students still have high success-orientations in which their equally high
levels of fear-of-failure serve to foster their academic performance.
Self-protectors
Students high on fear-of-failure and low on success-orientation meet the
criteria for self-protectors. Rather than trying to prevent failure like overstriving
students, self-protectors aim to reduce and avoid the implications of failure (De
Castella et al., 2013). This is often accomplished by using deflective strategies to
protect their self-worth (Martin & Marsh, 2003). This allows the student to
externalise failure through the use of pre-meditated excuses such as ‘lack of time to
study’ or exceptionally low expectations, rather than inferring that failure occurred
due to a lack of ability (Martin & Marsh, 2003). Although these students are
predominantly driven by their fears of failing, unlike overstrivers their fear-of-failure
overrides their desire to succeed (De Castella et al., 2013). These students are at a
higher risk of using strategies such as self-handicapping and defensive pessimism to
protect their self-worth than optimists and overstrivers.
Failure acceptors
Page 18
10
Students low on both the dimensions of success-orientation and fear-of-
failure are classified as failure acceptors (De Castella et al., 2013). According to the
QMNA these students are indifferent to academic success and often disengage from
their studies (Covington, 1992). Researchers have found that students who were
classified as failure acceptors were unconcerned with failure and the consequences
that may arise from it, thus their self-worth is not damaged and the need to engage in
protective strategies such as self-handicapping and defensive pessimism is low
(Covington & Roberts, 1994). It has been argued that failure acceptance is associated
with the poorest academic outcomes (De Castella et al., 2013) not necessarily due to
lack of ability, but due to failure to learn the information in the first place due to
interference by deflective strategies or disengagement (Covington & Roberts, 1994).
Supporting evidence for the QMNA
Research with high school and university students has supported the
QMNA’s four proposed orientations. De Castella et al. (2013) employed the QMNA
to examine how fear-of-failure and success-orientation were related to self-
handicapping and defensive pessimism in Japanese high school students. Students
completed a series of questionnaires assessing achievement orientation and self-
protective strategies. De Castella et al. (2013) found that self-handicapping was
highest when students were low in success-orientation and high in fear-of-failure. It
was also found that students who were high in success-orientation (i.e. optimists and
overstrivers) were less likely to engage in self-handicapping, however reported
higher levels of defensive pessimism about future performance (De Castella et al.,
2013).
Martin et al. (2001a) examined the QMNA and its relationship with self-
handicapping, defensive pessimism, reflectivity and self-worth among university
Page 19
11
students. It was found that defensive pessimism was positively correlated with fear-
of-failure (i.e. overstrivers and self-protectors) whilst self-handicapping was largely
employed by students who were high in fear-of-failure but low in success-orientation
(i.e. self-protectors; Martin et al., 2001a). Whilst these findings support the
dimensions of the QMNA Martin et al. (2001a) did not directly measure success-
orientation and fear-of-failure, rather they were represented by a group of observed
variables. Thus results must be interpreted with caution as measuring these concepts
indirectly may produce ambiguity in their meaning. Martin et al. (2001a) suggests
that direct measures need to be established for measuring success-orientation and
fear-of-failure.
Simons et al.’s (1999) study that investigated 361 university student athletes’
motivational drives and academic achievements also lends support to the QMNA.
Using the theoretical basis of self-worth theory and the QMNA students completed a
survey examining their attitudes and motivation towards study. It was found that
success-orientated athletes, including overstrivers, were highly motivated to achieve
well academically and had greater achievement outcomes than athletes who feared
failure and were failure acceptors (Simons et al., 1999). Furthermore success-
orientated students were found to have higher levels of self-worth than failure
acceptors, supporting self-worth theory (Simons et al., 1999). However, the
generalisations of such findings are limited due to only examining a specific sub-
population of university students. As these participants were used to performing at an
elite level athletically the ability to perform at such a high level may have carried
over to their academic performance, thus may have skewed their success and failure
orientations. Alternatively, as these participants were athletes who continuously
engage in strenuous activity their concentration and motivation to focus on academic
Page 20
12
tasks may be fatigued (Simons et al., 1999) thus findings may change when using a
more representative university sample.
The Motivation and Engagement Wheel
An alternative model that aims to explain academic motivation and
engagement in students is the Motivation and Engagement Wheel (MEW). This
model aims to represent the cognitive thoughts and feelings along with behaviours
that underlie academic engagement (Martin & Marsh, 2006). The MEW as displayed
in Figure 2 is comprised of 11 first order factors (e.g. failure avoidance and self-
efficacy) that are categorised into four higher-order factors: adaptive cognitions,
adaptive behaviours, maladaptive cognitions and impeding/maladaptive behaviours
(Martin, 2007). The model can be separated in terms of motivational factors that
enhance academic motivation and motivational factors that reduce academic
motivation (i.e. self-handicapping; Martin & Marsh, 2006). According to the MEW
students who are high on the adaptive dimensions and low on the maladaptive
dimensions of the wheel are academically motivated and engaged in their study
whereas students high on the maladaptive dimensions and low on the adaptive
dimensions are less motivated and more likely to engage in self-protective strategies
(i.e. self-handicapping; Martin & Marsh, 2006).
Research has demonstrated support for the MEW. For example, Martin and
Marsh’s (2006) study provided support for the MEW when examining academic
resilience in 402 high school students using the theory’s accompanying instrument
the Motivation and Engagement Scale (MES; Martin, & Marsh, 2006). From using
this model as a theoretical basis and employing the MES, Martin and Marsh (2006)
concluded that self-efficacy, control, planning, low anxiety and persistence promoted
academic resilience and therefore increased motivation and engagement. These
Page 21
13
findings are similar to those found using the QMNA when examining students who
achieve well academically and have high success-orientations.
Further evidence that supports the theoretical framework of the MEW is
Martin’s (2009a) study. Martin (2009a) examined motivation and engagement across
primary, high school and university students using the MES. Findings supported the
MEW in which maladaptive and impeding dimensions of the Wheel were associated
with lower academic motivation and engagement (i.e. reduced academic success)
whilst adaptive dimensions were associated with increased engagement in academic
tasks. Martin (2009a) also found that primary school students were more motivated
than university students. This finding emphasises the urgency of the research that is
needed in the motivation and engagement literature in university populations to
understand why academic motivation and engagement may lack in this group.
Figure 2. The Motivation and Engagement Wheel
Page 22
14
Overlap in Theories
To date, research in the field of academic motivation and engagement has
been criticised for being inconsistent and fragmented (Pintrich, 2003; Martin, 2007).
Inconsistency in the literature may be due to a failure to adopt a single model that
comprehensively explains academic achievement and motivation in students.
Currently the two most commonly used models are Covington’s (1992) previously
mentioned QMNA and the MEW (Martin, 2007). Although the MEW is proposed as
a separate and distinct model from the QMNA it is evident that there is obvious
overlap in terms of concepts and measurement between them. For example, both
theories place emphasis on fear-of-failure and failure avoidance and how this is
closely related to lower academic achievement, increased likelihood to engage in
deflective strategies (i.e. self-handicapping and defensive pessimism) and
disengagement from studies. Additionally, both theories also contrast failure against
success-orientations. In the QMNA high success-orientations fall into categories of
optimists and overstrivers whilst in the MEW success-orientations are the result of
adaptive cognitions and behaviours. Researchers have argued that a change in
theorising motivational research is warranted (Martin, 2007). Thus the current
research will help understand to what degree these models are independent from each
other and whether there is redundancy in using both.
The Current Study
The current study was an extension of De Castella et al.’s (2013) research
that examined the predictors of academic achievement, motivation and
disengagement in high school students. The present study aimed to expand the work
on academic achievement and motivation by examining the relationships among
success-orientation, fear-of-failure and student disengagement in university students.
Page 23
15
The cognitive-behavioural Quadripolar (Covington, 1992) and Motivation and
Engagement (Martin, 2007) theories were included to determine whether the models
independently contribute to the prediction of self-handicapping and defensive
pessimism.
It was hypothesised that fear-of-failure would be positively associated with
self-handicapping and defensive pessimism in university students. Secondly it was
hypothesised that success-orientation would be negatively associated with self-
handicapping, however positively associated with defensive pessimism. Additionally
it was hypothesised that there would be an interaction between success-orientation
and fear-of-failure on self-handicapping in that when students are low in success-
orientation, fear-of-failure would be significantly positively associated with self-
handicapping but non-significantly negatively associated when students are highly
success-orientated. Lastly, it was hypothesised that the dimensions of the
Quadripolar Model of Need Achievement would be positively associated with
theoretically similar dimensions of the Motivation and Engagement Wheel.
Method
Participants
The sample comprised 110 university students from the University of
Tasmania enrolled in a variety of undergraduate and postgraduate courses. However
of the total 110 participants, 49 had incomplete data sets. The mean age of
participants was 25 years (SD=9.61) with an overall range of 18 to 58 years. Table 1
contains demographic information about sex (male, female) and age (categorised into
traditional or non-traditional university entry age) of participants identified in the
study. Participants were recruited via advertisements in lectures, tutorials, University
of Tasmania notice boards and the School of Medicine (Psychology) SONA research
Page 24
16
participation system. Participation was voluntary. Upon completion of the survey
participants were eligible to enter the draw to win one of four $50 Coles/Myer gift
vouchers. First-year psychology students at the University of Tasmania automatically
received 45 minutes of research credit on completion of the survey through the
School of Medicine (Psychology) SONA research participation system.
Table 1
Demographic Variables of Participants
Demographic
Variable
Category N %
Sex Female 56 50.91%
Male 14 12.73%
Non-identified
40 36.36%
Age (years) 17-21 yrs (Traditional) 36 32.73%
22 + yrs (Non-Traditional) 36 32.73%
Non-identified 38 34.54%
Note. Not all participants provided demographic information
Materials
Both predictor variables (fear-of-failure and success-orientation) and outcome
variables (self-handicapping and defensive pessimism) were measured and assessed
using a series of reliable and well validated scales and questionnaires discussed
below.
Page 25
17
Achievement Goal Questionnaire-Revised (AGQ-R). The AGQ-R (Elliot
& Murayama, 2008) was used to measure achievement goals (and therefore
achievement orientation) in regards to motivation in an achievement setting. The
AGQ-R comprised 12 items. Respondents rated their agreement for each item of a
five-point Likert scale with end point designations ranging from Strongly Disagree
(1) to Strongly Agree (5). Sample items included ‘I am striving to do well compared
to other students’ and ‘I am striving to understand the content as thoroughly as
possible.’ The total possible scores ranged from 12 – 60 with higher scores reflecting
greater motivation in achievement goals. The authors do not allude to the internal
consistency of the AGQ-R. The present study had a Cronbach’s alpha of 0.89.
Performance Failure Appraisal Inventory-Short Form (PFAI-S). The
PFAI-S (Conroy, Willow, & Metzler, 2002) measured the cognitive-motivational-
relational appraisals associated with fear-of-failure. The scale consisted of five items
that represented fears of experiencing shame and embarrassment, fears of devaluing
one’s self-estimate, fears of having an uncertain future, fears of having important
others losing interest and fears of upsetting important others (De Castella et al.,
2013). Respondents indicated how much they believe each statement on a five-point
Likert scale with end points ranging from Do not believe at all (1) to Believe 100%
of the time (5). An example fear-of-failure item was ‘When I am failing, I am afraid
that I might not have enough talent.’ Total scores ranged from 5-25 with higher
scores indicating a greater fear-of-failure. The authors do not give an indication of
the internal consistency of the PFAI-S. The present study had a Cronbach’s alpha of
0.77.
Patterns of Adaptive Learning Survey (PALS). The PALS (Midgely et al.,
2000) examined the relationship between the learning environment and students’
Page 26
18
motivation, affect and behaviour. The present study used the academic self-
handicapping strategies subscale of the PALS. The academic self-handicapping
strategies subscales comprised six items. Each item assessed the defensive strategies
students use if performance on an academic task is low (Midgely et al., 2000).
Respondents indicated how true each statement was of them on a five-point Likert
scale with end points ranging from Not at all true (1) to Very true (5). An example
item of a self-handicapping strategy was ‘Some students put off doing their class
work until the last minute. Then if they don’t do well on their work, they can say that
is the reason. How true is this of you?’ Total scores ranged from 6 – 30 with higher
scores reflecting greater use of self-handicapping strategies in an academic context.
The PALS has a Cronbach’s alpha of 0.84 for the academic self-handicapping
strategies subscale (Midgely et al., 2000). The present study had a Cronbach’s alpha
of 0.85.
Optimism-Pessimism Prescreening Questionnaire (OPPQ). The OPPQ
(Norem & Cantor, 1986b) measured the use of defensive pessimism or optimism
strategies used in academic situations. The OPPQ comprised nine statements
describing either defensive pessimism or optimism that were characteristics of
students’ cognitions and behaviours in academic situations (Norem & Cantor,
1986b). Respondents indicated how much each statement was true of them on a five-
point Likert scale end point designations ranging from Not at all true of me (1) to
Very true of me (5). Items included ‘I go into academic situations expecting the
worst, even though I know I will probably do OK’ (defensive pessimism) and ‘I
generally go into academic situations with positive expectations about how I will do’
(optimism). For the purpose of this study only scores from the defensive pessimism
items were calculated thus total scores ranged from 4-20. Higher scores on defensive
Page 27
19
pessimism items reflect a greater use of defensive pessimism strategies in academic
situations. The authors do not mention the internal consistency of the OPPQ. The
present study had a Cronbach’s alpha of 0.69 for the pessimism scale.
The Motivation and Engagement Scale- University & Colleges (MES-
UC). The MES-UC (Martin, 2008b) was used to measure university students’
motivation and engagement. The MES-UC comprised 44 items assessing motivation
and engagement through statements regarding adaptive and maladaptive cognitions
and adaptive and maladaptive/impeding behaviours. Respondents rated their
agreement with each statement on a seven-point Likert scale with end points
designated at Strongly Disagree (1) to Strongly Agree (7). Sample items include ‘If I
try hard, I believe I can do my university work well’ (adaptive cognition), ‘When I
don’t do well at university I don’t know how to stop that happening next time’
(maladaptive cognition), ‘If I can’t understand my university/college work at first, I
keep going over it until I do’ (adaptive behaviour) and ‘I’ve pretty much given up
being interested in university/college’ (maladaptive/impeding behaviour). Four items
are associated with each of the 11 motivation and engagement factors thus total
scores for each factor ranged from 4 – 28. Higher scores were associated with higher
levels of that particular cognition or behavior (i.e., self-handicapping and failure
avoidance). The 11 factors comprised in the MES-UC each have a Cronbach’s alpha
that exceeds 0.70 (Martin, 2009b). The present study had Cronbach’s alphas ranging
from 0.66 (task management) to 0.90 (self-handicapping).
Demographic Questionnaire: A series of socio-demographic questions
including age and sex were asked at the beginning of the online survey to enable
statistical evaluation of whether these variables systematically influenced results.
Procedure
Page 28
20
Ethical approval for the present study was obtained through the Tasmanian
Human Research and Ethics Committee (reference number H0014852, Appendix A).
All participants were directed to Limesurvey to complete the online survey. Prior to
commencing the survey all participants read an information sheet outlining the
purpose, risks, benefits and the voluntary nature of the study (Appendix B).
Participants were also informed that their responses would be anonymous and kept
confidential, and that completion and submission of the online survey implied
consent. Participants completed the online survey which was comprised of several
questionnaires: the Achievement Goal Questionnaire-Revised (AGQ-R), the
Performance Failure Appraisal Inventory-Short Form (PFAI-S), Patterns of
Adaptive Learning Survey (PALS), Optimism-Pessimism Prescreening Questionnaire
(OPPQ), The Motivation and Engagement Scale- University & Colleges (MES-UC)
and a demographic questionnaire that was always presented first (Appendix C). The
survey took approximately 45 minutes to complete. After submission of the online
survey participants were eligible to enter the draw to win one of four Coles/Myer gift
vouchers or alternatively first year psychology students at the University of
Tasmania could receive 45 minutes research credit. All participant data was de-
identified to ensure anonymity.
Design and Analysis
This study employed a cross-sectional design. This study consisted of two
predictor variables. The first predictor variable was participants’ level of success-
orientation which had two levels: high or low. The second predictor variable was
participants’ level of fear-of-failure which also had two levels: high or low. The
outcome variable was participants’ scores on the measures of self-handicapping and
defensive pessimism.
Page 29
21
A correlational design was used to address hypotheses one and two.
Pearson’s Product Moment correlations were used to determine the strength and
direction of the relationship between fear-of-failure and self-handicapping, and fear-
of-failure and defensive pessimism as predicted in hypothesis one. Pearson’s Product
Moment correlations were also used to determine the strength and direction of the
relationship predicted in hypothesis two between success-orientation and self-
handicapping, and success-orientation and defensive pessimism.
To address hypothesis three a multiple regression analysis was conducted to
examine the amount of variance explained by each predictor on self-handicapping
and defensive pessimism, and to explore if there was an interaction between success-
orientation and fear-of-failure on these constructs.
Originally to address the fourth hypothesis an exploratory factor analysis was
to be conducted to examine whether theoretically similar dimensions of the QMNA
and the MEW have the same underlying latent variable. However, an exploratory
factor analysis could not be conducted due to the substantially small sample size and
several violations of assumptions that would have occurred as a result. Instead, two
stepwise regression analyses were conducted in which the predictive utility of the
QMNA and the MEW regarding self-handicapping and defensive pessimism were
compared.
Results
Data Screening
Prior to conducting analyses, all variables were assessed with tests of
normality. Assumptions of normality, homogeneity of variance and linearity were
met. Additionally, Pearson product moment correlations were examined for any
possible concerns of multicollinearity. All correlations between variables were below
Page 30
22
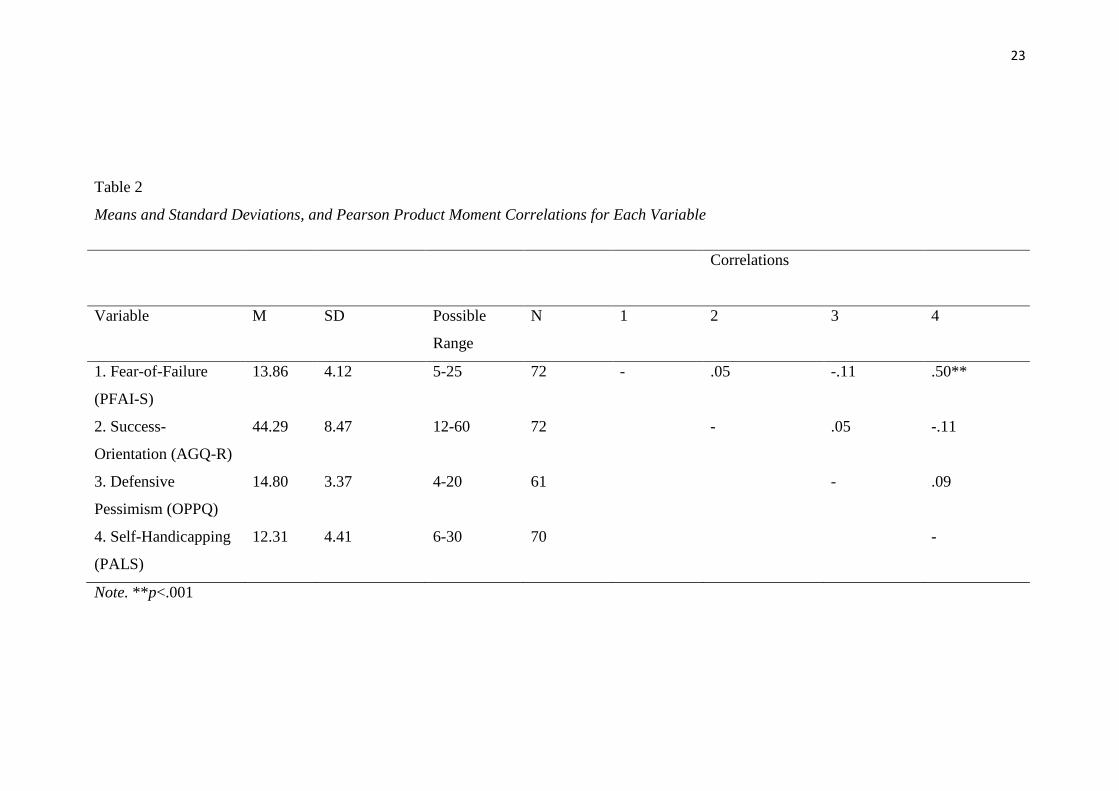
.6, as displayed in Table 2 along with the means (M) and standard deviations (SD) of
the predictor and outcome variables. To further ensure multicollinearity was not an
issue Tolerance and Variance Inflation Factor (VIF) were examined. Following the
recommendations of Field (2013), Tolerance levels below 0.1 and VIF levels above
10 are cause for concern. Within the current study, no levels of Tolerance were found
to be below 0.71 and no VIF levels were found above 1.41. As previously identified,
of the total of 110 participants that attempted the survey, 49 had incomplete data. A
missing data analysis was to be performed on the incomplete data sets however
participants who had incomplete data had ignored whole scales within the survey. As
a result only complete response scales were included in the analyses (Table 2).
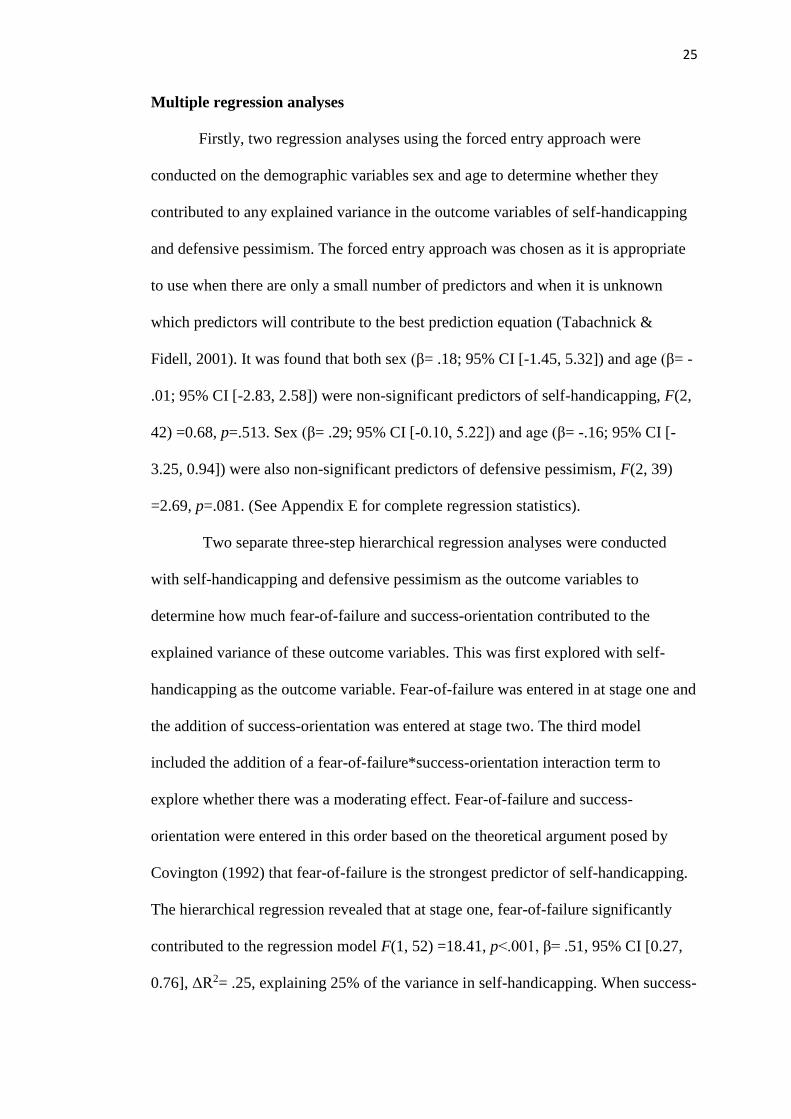
Descriptive Statistics
Scores for each of the variables’ measures were trichotomised into
percentages of low, medium and high in order to conceptualise where students fell
within the QMNA (Covington, 1992) and are presented in Table 3. Inspection of the
means displayed in Table 2 revealed that on average students reported medium levels
of both success-orientation (AGQ-R) and fear-of-failure (PFAI-S). Inspection of the
means also revealed that of the outcome variables, students primarily endorsed
medium levels of defensive pessimism (OPPQ) and low levels of self-handicapping
(PALS). (See Appendix D for complete descriptive statistics and correlations
between variables).
Page 31
23
Table 2
Means and Standard Deviations, and Pearson Product Moment Correlations for Each Variable
Note. **p<.001
Correlations
Variable M SD Possible
Range
N 1 2 3 4
1. Fear-of-Failure
(PFAI-S)
13.86 4.12 5-25 72 - .05 -.11 .50**
2. Success-
Orientation (AGQ-R)
44.29 8.47 12-60 72 - .05 -.11
3. Defensive
Pessimism (OPPQ)
14.80 3.37 4-20 61 - .09
4. Self-Handicapping
(PALS)
12.31 4.41 6-30 70 -
Page 32
24
Table 3
Percentage of Students that fell into Low, Medium or High Classifications for Each
Variable
Variable Low
%
Medium
%
High
%
Fear-of-Failure
(PFAI-S)
21.8 33.6 10.0
Success-Orientation
(AGQ-R)
5.5 25.7 34.9
Defensive
Pessimism (OPPQ)
5.6 24.1 26.9
Self-Handicapping
(PALS)
46.4 17.3 0.0
Correlations between variables
As predicted, there was a significant strong positive correlation between fear-
of-failure and self-handicapping, r(70) =.50, p<.001, d= 0.36, revealing a small to
medium effect size. Following the recommendations of Cohen (1992), what
constitutes a small or large effect are as follows: d= 0.2 (small), 0.5 (medium) and
0.8 (large). However a non-significant correlation was found between fear-of-failure
and defensive pessimism, r(46) =-.11, p>.05, d=0.25, revealing a small effect size.
Success-orientation also yielded a non-significant correlation between self-
handicapping, r(54) =-.11, p>.05, d= 4.74, and defensive pessimism, r(61) =.05,
p>.05, d= 4.58 in which both relationships had very large effect sizes.
Page 33
25
Multiple regression analyses
Firstly, two regression analyses using the forced entry approach were
conducted on the demographic variables sex and age to determine whether they
contributed to any explained variance in the outcome variables of self-handicapping
and defensive pessimism. The forced entry approach was chosen as it is appropriate
to use when there are only a small number of predictors and when it is unknown
which predictors will contribute to the best prediction equation (Tabachnick &
Fidell, 2001). It was found that both sex (β= .18; 95% CI [-1.45, 5.32]) and age (β= -
.01; 95% CI [-2.83, 2.58]) were non-significant predictors of self-handicapping, F(2,
42) =0.68, p=.513. Sex (β= .29; 95% CI [-0.10, 5.22]) and age (β= -.16; 95% CI [-
3.25, 0.94]) were also non-significant predictors of defensive pessimism, F(2, 39)
=2.69, p=.081. (See Appendix E for complete regression statistics).
Two separate three-step hierarchical regression analyses were conducted
with self-handicapping and defensive pessimism as the outcome variables to
determine how much fear-of-failure and success-orientation contributed to the
explained variance of these outcome variables. This was first explored with self-
handicapping as the outcome variable. Fear-of-failure was entered in at stage one and
the addition of success-orientation was entered at stage two. The third model
included the addition of a fear-of-failure*success-orientation interaction term to
explore whether there was a moderating effect. Fear-of-failure and success-
orientation were entered in this order based on the theoretical argument posed by
Covington (1992) that fear-of-failure is the strongest predictor of self-handicapping.
The hierarchical regression revealed that at stage one, fear-of-failure significantly
contributed to the regression model F(1, 52) =18.41, p<.001, β= .51, 95% CI [0.27,
0.76], ΔR2= .25, explaining 25% of the variance in self-handicapping. When success-
Page 34
26
orientation was added to the model it did not significantly improve the amount of
variance explained in self-handicapping, F(1, 51) =1.19, p=.280, β= -.13, 95% CI [-
0.20, 0.05], ΔR2= .25. Lastly, the addition of the fear-of-failure*success-orientation
interaction term to the regression model did not significantly add to the explained
variance in self-handicapping, F(1, 50) =0.00, p=.951, β= -.05, 95% CI [-0.03, 0.03],
ΔR2= .24. Thus model 1 was identified as the best fit.
Although originally there were no significant correlations found between
defensive pessimism and both fear-of-failure and success-orientation a hierarchical
regression analysis was conducted to analyse whether there were any moderating
effects when all predictor variables were combined. The predictors were entered in
the same order as the above regression, again in keeping with theoretical propositions
as argued by Covington (1992). The hierarchical regression revealed that both fear-
of-failure, F(1, 44) =0.51, p=.479, β= -.11, 95% CI [-0.31, 0.14], success-orientation,
F(1, 43) =0.25, p=.779, β= .01, 95% CI [-0.13, 0.14], and the fear-of-failure*success-
orientation interaction term F(1, 42) =0.53, p=.668, β= -1.32, 95% CI [-0.05, 0.01],
were non-significant predictors of defensive pessimism. (See Appendix F for
complete hierarchical regression statistics).
As previously indicated, due to sample size limitations an exploratory factor
analysis could not be conducted to examine the independence of constructs theorised
within the Quadripolar and Motivation and Engagement theories of achievement
behaviour. Instead, a series of stepwise regression analyses were conducted in which
the predictive utility of the theoretical constructs in regards to defensive pessimism
and self-handicapping were compared. A stepwise method was chosen as it is a
particularly useful method when there are a large number of predictor variables being
explored but not enough data to estimate their coefficients meaningfully (Gelman &
Page 35
27
Hill, 2007). In the first stepwise regression analysis self-handicapping was the
outcome variable and fear-of-failure and success-orientation of the QMNA and the
11 first order factors (displayed in Figure 2) of the MEW were the predictor
variables. The stepwise regression revealed that of the predictor variables only fear-
of-failure significantly contributed to the model, F(1, 44) =14.47, p<.001, β= .50,
95% CI [0.22, 0.73], ΔR2=.23, explaining 23% of the variance in self-handicapping.
Secondly, a stepwise regression analysis was conducted with the same
predictor variables and defensive pessimism as the outcome variable. The final
model revealed that of the predictor variables only the MEW’s factors of anxiety (β=
.52, 95% CI [0.28, 0.73]), disengagement (β= .45, 95% CI [0.14, 0.52]), and valuing
(β= .37, 95% CI [0.13, 0.68]) significantly contributed to the model F(3, 42) =14.96,
p<.001, ΔR2= .48, explaining 48% of the variance in defensive pessimism. (See
Appendix G for complete stepwise regression statistics).
Discussion
The current study was an extension of De Castella et al.’s (2013) research
with the aim to expand the work on academic achievement and motivation by
examining the relationships among success-orientation, fear-of-failure and academic
disengagement in university students. The cognitive-behavioural Quadripolar
(Covington, 1992) and Motivation and Engagement (Martin, 2007) theories were
included to determine whether the models independently contributed to the
prediction of self-handicapping and defensive pessimism.
The results of the current study partially supported the hypothesis that fear-
of-failure would be positively associated with self-handicapping and defensive
pessimism in university students. A strong positive correlation was found between
fear-of-failure and self-handicapping, however a non-significant negative correlation
Page 36
28
was found between fear-of-failure and defensive pessimism. Secondly, the
hypothesis that success-orientation would be negatively associated with self-
handicapping however positively associated with defensive pessimism was refuted as
a non-significant negative correlation was found for self-handicapping and a non-
significant positive correlation was found for defensive pessimism. The hypothesis
that there would be an interaction between success-orientation and fear-of-failure on
self-handicapping in that when students were low in success-orientation, fear-of-
failure would be positively associated with self-handicapping but non-significantly
negatively associated when students are highly success-orientated was also refuted.
Lastly, due to the substantially small sample it was not possible test the hypothesis
that the dimensions of the QMNA would be positively associated with theoretically
similar dimensions of the MEW. Instead, the dimensions of each model were
compared for predictive utility on how well each predicted self-handicapping and
defensive pessimism. It was found that the QMNA’s dimension fear-of-failure
significantly predicted self-handicapping whilst the MEW’s dimensions of anxiety,
disengagement and valuing significantly predicted defensive pessimism.
Fear-of-Failure and the Self-Handicapping Relationship
The finding that fear-of-failure was significantly positively associated with self-
handicapping lends support to the theoretical argument posed by Covington’s (1992)
QMNA in that students who fear failure are more likely to engage in self-
handicapping, thus have lower motivation and engagement in their studies. This
finding is also consistent with the notion that university education poses an
environment in which fear-of-failure and the implications of failure are of higher
stakes (i.e. financial consequences and career opportunities; Nevill & Rhodes, 2006).
Thus engaging in self-handicapping, for example going to a party the night before a
Page 37
29
test, allows an individual to avoid the implications associated with failure and protect
their self-worth (De Castella et al., 2013). This is because failure from lack of effort
is less debilitating than failure following effort (Norem & Cantor, 1986a). This
finding was further supported by the regression analysis that was performed in which
fear-of-failure was able to explain 25% of the variance in the prediction of self-
handicapping in university students. In addition to theoretical support, these findings
also support the empirical findings of De Castella et al. (2013) who found that fear-
of-failure significantly predicted self-handicapping in high school students. De
Castella et al. (2013) interpreted such findings as students who have a high fear-of-
failure being increasingly more likely to engage in self-handicapping and disengage
from their studies.
Implications and applications
Fear-of-failure is likely to act as the driving force behind the range of self-
handicapping strategies that students engage in designed to explain and excuse poor
academic outcomes (De Castella et al., 2013). Self-handicapping therefore
contributes to lower motivation and engagement in university students’ studies.
However as mentioned previously, the strategies students use (i.e. self-handicapping)
to protect their self-worth ultimately lose much of their self-protective value as the
excuses become transparent (De Castella et al., 2013). In addition to this, De Castella
et al. (2013) also proposed the idea that as self-handicapping was associated with
fear-of-failure it can easily be interpreted that students do not care enough about their
studies, however the opposite may be true in which self-handicapping may be the
result of caring too much about failure and the consequences it holds. This has
important practical implications not only for future research but also educational
interventions and preventative strategies trying to reduce self-handicapping in
Page 38
30
students. This finding suggests that in order to reduce the self-handicapping
strategies students employ that contribute to lower academic performance,
motivation and disengagement in studies, reducing their levels of fear-of-failure first
would have the most beneficial outcomes. If educational strategies attempted to
reduce the use of self-handicapping in students before investigating the factors that
predicted self-handicapping (i.e. fear-of-failure) their effectiveness in reducing such
strategies is likely to be short lived unless the factors such as fear-of-failure that
predict self-handicapping are considered. Therefore future research should focus on
both preventative and intervention strategies designed to reduce the fear-of-failure
among university students. These intervention programs designed to prevent or
minimise fear-of-failure and self-handicapping should be able to be effectively
applied to university settings across different areas of study (Schwinger, Wirthwein,
Lemmer, & Steinmayr, 2014). Reducing fear-of-failure in university students would
not only reduce self-handicapping but may also help to improve academic motivation
and engagement in their studies, and therefore career opportunities and outcomes.
Furthermore, Covington (1992) argued that educators and family members
who place pressure on students to succeed in the face of failure can in fact increase
fear-of-failure among students who do not believe they have the potential to succeed
academically. Consequently, these students are likely to engage in self-protective
strategies such as self-handicapping. Future research would benefit by examining the
relationship between social pressures to succeed academically and fear-of-failure in
university students in an attempt to be able to further reduce the level of fear-of-
failure in students.
Success-Orientation and Self-Protective Strategies
Page 39
31
The finding that both fear-of-failure and success-orientation were non-
significantly correlated with defensive pessimism is inconsistent with pre-existing
theoretical and empirical literature. This finding contradicts the QMNA that suggests
that fear-of-failure and success-orientation are predictors of defensive pessimism
(Covington, 1992). According to this model both self-protecting and overstriving
students are argued to engage in defensive pessimism due to their high levels of fear-
of-failure, with the only thing that alters their academic outcome being their level of
success-orientation (high or low; De Castella et al., 2013). In addition to these
findings, the finding that success-orientation was not associated with self-
handicapping was also inconsistent with the QMNA that argues that students who are
success-orientated (i.e. optimists and overstrivers) are less likely to engage in self-
handicapping strategies as they are motivated to perform well (Covington, 1992).
The absence of this expected relationship also explains why a non-significant
interaction was found between success-orientation and fear-of-failure on self-
handicapping, as success-orientation was not found to have a meaningful association
with self-handicapping in any way.
The above findings are also inconsistent with the empirical findings of Martin
et al. (2001a) who found an association between fear-of-failure and defensive
pessimism in students. The absence of a relationship between success-orientation
and deflective strategies found in the current study were also inconsistent with the
findings of Simons et al. (1999) that found that success-orientated students were
likely to have high levels of self-worth therefore less likely to engage in self-
protective strategies. The findings also did not lend support to Simons et al. (1991)
conclusions that success-orientated student athletes were more motivated to perform
Page 40
32
well academically and had greater achievement outcomes than student athletes who
feared failure.
Implications and applications
The inconsistent findings with both theoretical and empirical literature
regarding defensive pessimism may be due to several reasons. Firstly, the sample
size was substantially smaller than expected due the large amount of missing data.
This may have impacted the ability to detect a meaningful relationship between fear-
of-failure, success-orientation and defensive pessimism, and success-orientation and
self-handicapping. Secondly, the measure used to assess defensive pessimism in this
study (the OPPQ) only consisted of four items designed to specifically measure
defensive pessimism. Therefore these items may not have encompassed a
comprehensive representation of the cognitions of a defensive pessimist. For
example, researchers have commonly argued that anxiety plays an important role in
individuals who engage in defensive pessimism (Norem, 2008) however the items of
the OPPQ neglect to include an element of anxiety. Furthermore, as research
examining the predictors of academic achievement as outlined in the QMNA in
university students has not been widely researched it may be that this model does not
apply as well to this cohort as it does to high school students, due to the differing
cognitive, social, and academic environments in which study is being undertaken.
The non-significant relationships found between success-orientation and self-
handicapping may also be due to operationalisation of the QMNA in which there is
no one measure to assess its theory. For example the measures used to assess fear-of-
failure and success-orientation in this study are not the only measures available. De
Castella et al. (2013) note that there is a debate of how such constructs should be
measured. Many of the existing measures assessing fear-of-failure and success-
Page 41
33
orientation focus on the comparative nature of success and failure to other students
(Smith, Duda, Allen, & Hall, 2002). It is suggested that further research be directed
at establishing measures that focus on fear-of-failure and success-orientation in
regards to how this impacts the individual (Martin et al., 2001a).
Fear-of-failure as measured by the PFAI-S had high face validity. This can be
problematic as it makes it easy for students to manipulate their responses in which
they may have under or overplayed their tendency to engage in these
cognitions/behaviours. Moreover, due to the obvious face validity of the PFAI-S it is
clear that most of the items assessed aspects of fear of social evaluation rather than
fear-of-failure for the individual, for example, ‘When I am failing, I worry about
what others think about me.’ Therefore, instead of measuring fear-of-failure at the
individual level in which this study aimed to do it also measured failure at the social
level. Fear of social evaluation from others relates to the concept of socially
prescribed perfectionism. Socially prescribed perfectionism refers to the perceived
need to perform well and maintain expectations held by significant others (Hewitt &
Flett, 1991). According to Hewitt and Flett (1991) an individual engaging in socially
prescribed perfectionism perceives these expectations held by their significant others
as unrealistic and exerting pressure on them. It is therefore arguable that students
who engage in socially prescribed perfectionism are increasingly likely to engage in
defensive pessimism in order to reduce the fear-of-failure of disappointing others.
Consequently, as the PFAI-S items were largely concerned with socially prescribed
perfectionism this may have contributed to the reason as to why a non-significant
relationship was found between fear-of-failure and defensive pessimism. This is
because most students at a university level are unlikely to be enrolled to please or
satisfy those around them (i.e. parents) and are instead often enrolled with a purpose,
Page 42
34
for example to further or foster their career opportunities. Thus, the consequences
associated with failing in university studies are likely to impact a student at the
individual level rather than at the social level of disappointing others. Further
research is therefore warranted in which a different measure of fear-of-failure is used
to assess university students’ fear-of-failure of the individual consequences failure
holds for these students.
Lastly, success-orientation was neither positively nor negatively correlated
with defensive pessimism, which is similar to findings reported by Elliot and Church
(2003) who suggested that this null relationship indicates that success-orientation
may be a positive predictor of defensive pessimism for some students however a
negative predictor for others. This had led to the conceptualisation that there are
different forms of defensive pessimism. This includes the idea some individuals set
low expectations for their performance then simply just prepare for failure (low
success-orientation), whereas other defensive pessimists set low expectations then
put in extra effort to increase the chances of succeeding (high success-orientation;
Elliot & Church, 2003). This has practical and theoretical implications for future
research for how defensive pessimism should be characterised and the way in which
each form of defensive pessimism may be linked with different achievement
outcomes (Elliot & Church, 2003). This idea of different types of defensive
pessimists may have contributed to the unexpected findings of this study as it is may
not be purely due to the measures used but may instead reflect that this sample
contained two different types of defensive pessimists as articulated by Elliot and
Church (2003). Further, as these defensive pessimism types have different motives
(succeed or fail) thus different academic outcomes, using the same regression
Page 43
35
equation for the two different achievement behaviours would be inappropriate and
fail to identify a clear predictive relationship.
Predictive utility of the QMNA and the MEW
The predictive utility of the models was assessed for how well each was able
to predict self-handicapping and defensive pessimism in university students. In
regards to self-handicapping the only predictor was the QMNAs’ fear-of-failure. This
links back to the present study’s previous findings in which fear-of-failure
significantly predicted self-handicapping. An expected predictor that was not found
to correlate with self-handicapping was the MES’s factor of self-handicapping. The
MES’s self-handicapping factor may not have been a significant predictor in
explaining self-handicapping in this instance as it only measured behavioural
strategies and neglected to include claimed strategies of self-handicapping. Verbal
claims of self-handicapping include for example students stating they are
experiencing physiological symptoms that they claim will interfere with their
performance (e.g. ill-health; Coudevylle, Ginis, & Famose, 2008). Thus, it may be
the case that university students tend to engage in claimed rather than behavioural
strategies of self-handicapping and these were not detected by the measures used
within the current study. This seems possible considering that claimed self-handicaps
may be more socially acceptable in an adult population than behavioural self-
handicaps.
It was found that only the MEW’s predictors of anxiety, disengagement and
valuing significantly contributed to explaining defensive pessimism. This is an
interesting finding because theoretically the QMNA’s predictors of fear-of-failure
and success-orientation should have been the greatest predictors of defensive
pessimism as this model specifically argues that when students are failure-fearing or
Page 44
36
success-orientated they are at increased risk of engaging in defensive pessimism (De
Castella et al., 2013). The MEW on the other hand does not claim to measure
defensive pessimism, however does a better job at predicting it than the QMNA.
However, the predictor variables that were found from the MEW fit within the
theorisation of defensive pessimism. For example, as previously mentioned,
researchers argue that anxiety plays an important role in predicting students who are
likely to engage in defensive pessimism (Norem, 2008). For these students engaging
in defensive pessimism allows them to manage their anxiety and for some serves to
facilitate efforts (Norem, 2008). Researchers have also argued that disengagement is
associated with defensive pessimism (De Castella et al., 2013; Martin, Marsh, &
Debus, 2001b). This is because students who in engage in this self-protective
strategy often have lower grade point averages and satisfaction in their studies as the
consistent use of this strategy lowers its self-protective value (De Castella et al.,
2013). Lastly, valuing is thought to be related to defensive pessimism as the students
that engage in this strategy tend to do so because they care about the outcomes of
their academic achievement (Hancock, 2001). If a student did not care about their
academic achievement or had no fear-of-failure there would be no reason for them to
engage in defensive pessimism.
Implications and applications
The above findings support the argument that the academic motivation and
engagement literature is fragmented and inconsistent (Pintrich, 2003; Martin, 2007).
This is evident in the present study as no single model could comprehensively
account for academic achievement cognitions/behaviours in university students.
However these findings have practical implications for reducing the use of defensive
pessimism in university students. As anxiety and valuing were found to be predictors
Page 45
37
of defensive pessimism future research should be directed towards strategies aimed
at ameliorating their impact on university students. This is also important as Hancock
(2001) found that test anxiety and evaluative threat was associated with lower
academic achievement and motivation.
These findings also have theoretical implications for future academic
motivation research. Further research with a larger sample size should be conducted
as this would allow researchers to conduct a factor analysis to determine whether the
QMNA and MEW models are independent from each other. This would also allow
researchers to consider the possibility of modifying, refining and consolidating the
two models in order to be able to comprehensively explain the academic
achievement cognitions and behaviours in university students.
It is important to note that these findings must be interpreted with caution.
The current study abided by the ten case rule recommended by Field (2013).
According to Field (2013) when conducting a regression analysis there should be at
least ten cases of data for each predictor in the model. However due the small sample
size of the current study and the large amount of predictor variables in the last
regression analyses having ten cases per predictor was not possible.
General limitations and directions for future research
Although the current study does provide some valuable insights into
academic achievement behaviours in university students, the findings should be
interpreted with the following limitations in mind. Firstly, the findings of this study
are of a correlational nature therefore no causal statements can be made about the
predictor variables and their influence on the outcome variables. Secondly, the
current study was based on self-report online questionnaires thus response bias may
have occurred either consciously (i.e. students deny the academic behaviours they
Page 46
38
engage in) or unconsciously (i.e. students do not have insight into their use of self-
protective strategies). Thus, it is possible that the rates of self-handicapping and
defensive pessimism may be higher than reported in this population (De Castella et
al., 2013). Future research would benefit from obtaining data from multiple sources
such as academic and attendance records, and observations made by teachers (De
Castella et al., 2013). Inclusion of these additional sources would allow researchers
to grasp a more objective and comprehensive understanding of which students are
most vulnerable to engage in these self-protective strategies.
A further methodological limitation of this study is that it was cross-sectional
by design. This had the ability to influence the findings of the study as all responses
were only measured once and majority of responses were collected early on in the
year. Furthermore, as majority of students were in their first-year at university they
may not have had insight into their own study habits yet, or had reason to think about
what kind of student they perceived themselves to be and the self-protective
strategies they might engage in. As such, further studies should be conducted with a
longitudinal design in which responses are measured at the beginning, middle and
end of the year in order to assess whether these self-protective strategies used by
students are more predominant at certain time points in the year. Lastly, as
previously mentioned the current study had a smaller than anticipated sample size.
This may limit the generalisability of results as they may not reflect the actual
academic behaviours that exist in a university population.
Summary of Findings
In summary, the results of the current study indicate that fear-of-failure in
university students enhances the likelihood that they will engage in self-
handicapping strategies in order to protect their self-worth. This consequently lowers
Page 47
39
students’ academic motivation and engagement in studies. Therefore both future
research and university resources should be directed towards facilitating preventative
strategies for first year university students and intervention strategies for students
who fear failure in an attempt to reduce its consequential effects (e.g. self-
handicapping and defensive pessimism). In particular, these intervention strategies
should focus on restructuring students’ attributions they hold in relation to failing.
This would not only protect their sense of self-worth, but also aid in improving their
academic achievement, motivation and engagement as the need to engage self-
handicapping would be reduced. Future research is also urgently warranted in
regards to university students and defensive pessimism due to the non-existent
relationship that was found between fear-of-failure and success-orientation, and the
potential implications for understanding the construct in this population. The current
study’s findings also revealed that at present neither the QMNA or the MEW can
comprehensively account and explain the academic achievement
cognitions/behaviours found in university students. In addition neither model can
sufficiently explain why some students are motivated and engaged to succeed and
why others are likely to disengage from their studies.
Page 48
40
References
Cohen, J. (1992). A power primer. Psychological Bulletin, 112, 155-159.
Conroy, D. E., Willow, J. P., & Metzler, J. N. (2002). Multidimensional fear of
failure measurement: The performance failure appraisal inventory. Journal of
Applied Sport Psychology, 14, 76-90. doi: 10.1080/10413200252907752
Coudevylle, G. R., Ginis, K. M. A., & Famose, J. (2008). Determinants of self-
handicapping strategies in sport and their effects on athletic performance.
Social Behaviour and Personality, 36, 391-398.
Covington, M. V. (1992). Making the grade: A self-worth perspective on motivation
and school reform. Cambridge, England: Cambridge University Press. doi:
10.1017/CBO9781139173582
Covington, M. V. (2009). Handbook of motivation at school. New York, NY:
Routledge
Covington, M. V., & Roberts, B. W. (1994). Self-worth and college achievement:
Motivational and personality correlates. In Pintrich, P. R., Brown, D. R., &
Weinstein, C. E. (Ed.), Student motivation, cognition, and learning: Essays in
honour of Wilbert J. McKeachie (pp.157-187). New Jersey: Lawrence
Erlbaum Associates, Inc., Publishers.
De Castella, K., Byrne, D., & Covington, M. (2013). Unmotivated or motivated to
fail? A cross-cultural study of achievement motivation, fear of failure, and
student disengagement. Journal of Educational Psychology, 105, 861-880.
doi: 10.1037/a0032464
Elliot, A. J., & Church, M. A. (2003). A motivational analysis of defensive
pessimism and self-handicapping. Journal of Personality, 71, 369-396.
Page 49
41
Elliot, A. J., & Murayama, K. (2008). On the measurement of achievement goals:
Critique, illustration, and application. Journal of Educational Psychology,
100, 613-628. doi: 10.1037/0022-0663.100.3.613
Field, A. (2013). Discovering statistics using IBM SPSS statistics (4th ed.). London:
Sage Publications.
Gelman, A., & Hill, J. (2007). Data analysis using regression and
multilevel/hierarchical models. Cambridge University Press: New York,
USA.
Hancock, D. R. (2001). Effects of test anxiety and evaluative threat on students’
achievement and motivation. The Journal of Educational Research, 94, 284-
290. doi: 10.1080/00220670109598764
Hewitt, P. L., & Flett, G. L. (1991). Perfectionism in the self and social contexts:
Conceptualisation, assessment, and association with psychopathology.
Journal of Personality and Social Psychology, 60, 456-470.
Hui-Jen, Y. (2004). Factors affect student burnout and academic achievement in
multiple enrolment programs in Taiwan’s technical-vocational colleges.
International Journal of Educational Development, 24, 283-301. doi:
10.1016/j.ijedudev.2003.12.001
Klem, A. M., & Connell, J. P. (2004). Relationships matter: Linking teacher support
to student engagement and achievement. Journal of School Health, 74, 262-
273. doi: 10.1111/j.1746-1561.2004.tb08283.x
Lutz, S. L., Guthrie, J. T., & Davis, M. H. (2006). Scaffolding for engagement in
elementary school reading instruction. The Journal of Educational Research,
100, 3-20. doi: 10.3200/JOER.100.1.3-20
Page 50
42
Marks, H. M. (2000). Student engagement in instructional activity: Patterns in the
elementary, middle, and high school years. American Educational Research
Journal, 37, 153-184.
Martin, A. J. (2007). Examining a multidimensional model of student motivation and
engagement using a construct validation approach. British Journal of
Educational Psychology, 77, 413-440. doi: 10.1348/000709906X118036
Martin, A. J. (2008). Motivation and engagement in diverse performance settings:
Testing their generality across school, university/college, work, sport, music
and daily life. Journal of Research in Personality, 42, 1607-1612. doi:
10.1016/j.jrp.2008.05.003
Martin, A. J. (2009a). Motivation and engagement across the academic lifespan.
Educational and Psychological Measurement, 69, 794-824. doi:
10.1177/0013164409332214
Martin, A. J. (2009b). Motivation and engagement across the lifespan: A
developmental construct validity study of elementary school, high school, and
university/college students. Educational and Psychological Measurement, 69,
794-824. doi: 10.1177/0013164409332214
Martin, A. J., & Marsh, H. W. (2003). Fear of failure: Friend or foe? Australian
Psychologist, 38, 31-38. doi: 10.1080/00050060310001706997
Martin, A. J., & Marsh, H. W. (2006). Academic resilience and its psychological and
educational correlates: A construct validity approach. Psychology in the
Schools, 43, 267-281. doi: 10.1002/pits.20149
Martin, A. J., Marsh, H. W., & Debus, R. L. (2001a). A quadripolar need
achievement representation of self-handicapping and defensive pessimism.
Page 51
43
American Educational Research Journal, 38, 583-610. doi:
10.3102/00028312038003583
Martin, A. J., Marsh, H. W., & Debus, R. L. (2001b). Self-handicapping and
defensive pessimism: Exploring a model of predictors and outcomes from a
self-protection perspective. Journal of Educational Psychology, 93, 87-102.
doi: 10.1037/0022-0663.93.1.87
Martin, A. J., Marsh, H. W., Williamson, A., & Debus, R. L. (2003). Self-
handicapping, defensive pessimism, and goal orientation: A qualitative study
of university students. Journal of Educational Psychology, 95, 617-628. doi:
10.1037/0022-0663.95.3.617
Midgley, C., Maehr, M. L., Hruda, L. Z., Anderman, E., Anderman, L., Freeman, K.
E., Gheen, M., Kaplan, A., Kumar, R., Middleton, M. J., Nelson, J., Roeser,
R., & Urdan, T. (2000). Manual for the patterns of adaptive learning scale.
Michigan: University of Michigan.
Nevill, A., & Rhodes, C. (2006). Academic and social integration in higher
education: A survey of satisfaction, and dissatisfaction within first-year
education studies cohort at a new university. Journal of Further and Higher
Education, 28, 179-193. doi:10.1080/0309877042000206741
Norem, J. K. (2008). Defensive pessimism, anxiety, and the complexity of evaluating
self-regulation. Social and Personality Psychology Compass, 2, 121-134. doi:
10.1111/j.1751-9004.2007.00053.x
Norem, J. K., & Cantor, N. (1986a). Anticipatory and post hoc cushioning strategies:
Optimism and defensive pessimism in “risky” situations. Cognitive Therapy
and Research, 10, 347-362.
Page 52
44
Norem, J. K., & Cantor, N. (1986b). Defensive Pessimism: Harnessing anxiety as
motivation. Journal of Personality and Social Psychology, 51, 1208-1217
Norem, J. K., & Cantor, N. (1989). Defensive pessimism and stress and coping.
Social Cognition, 7, 92-112.
Parker, J. D. A., Summerfeldt, L. J., Hogan, M. J., & Majeski, S. A. (2004).
Emotional intelligence and academic success: Examining the transition from
high school to university. Personality and Individual Differences, 36, 136-
172. doi:10.1016/S0191-8869(03)00076-X
Pintrich, P. R. (2003). A motivational science perspective of the role of student
motivation in learning in teaching contexts. Journal of Educational
Psychology, 95, 667-686. doi: 10.1037/0022-0663.95.4.667
Ross, S., Niebling, B., & Heckert, T. (1999). Sources of stress among college
students. College Student Journal, 33, 312 – 317.
Schwinger, M., Wirthwein, L., Lemmer, G., & Steinmayr, R. (2014). Academic self-
handicapping and achievement: A meta-analysis. Journal of Educational
Psychology, 106, 744-761. doi: 10.1037/a0035832
Simons, H. D., Van Rheenen, D., & Covington, M. V. (1999). Academic motivation
and student athlete. Journal of College Student Development, 40, 151-162.
Smith, M., Duda, J., Allen, J., & Hall, H. (2002). Cotemporary measures of approach
and avoidance goal orientations: Similarities and differences. British Journal
of Educational Psychology, 72, 155-190.
Tabachnick, B. G., & Fidell, L. S. (2001) Using multivariate statistics (4th ed.).
Boston, MA: Allyn and Bacon
Page 53
45
Urdan, T., & Midgley, C. (2001). Academic self-handicapping: What we know, what
more is there to learn. Educational Psychology Review, 13, 115-138.
Page 54
46
Appendix A
Minimal Risk Ethics Application Approval
Page 57
49
Appendix B
Information Sheet for Participants
Page 58
50
PARTICIPANT INFORMATION SHEET
An analysis of the variables predicting academic achievement, motivation and
student disengagement in university students.
[To currently enrolled university students]
1. Invitation
Thank you for your interest in the study and taking the time to read this information
sheet. This study is being conducted as partial fulfilment of a Psychology Honours
Degree for Aleisha Howlett supervised by Dr. Kimberley Norris at the University of
Tasmania. Please read this information sheet carefully to fully understand what this
study is about and what it involves. It is important that you understand this
information before consenting to participate. If you have any questions regarding this
research or would like more information please contact the
researchers;[email protected] (Aleisha Howlett)
or [email protected] (Kimberley Norris).
2. What is the purpose of this study?
The aim of the study is understand the motivational and engagement factors that lead
some students to do better academically, while other students disengage from their
study. The results of this study will help us better understand the factors influencing
academic achievement and help future research promote intervention programs that
help improve students’ academic success.
3. Why have I been invited to participate?
You have been invited to participate in the study if you are at least 18 years old and
currently enrolled as a student at the University of Tasmania. Please not that your
involvement in this study is voluntary. There are no consequences should you decide
to not participate and this will not affect your relationship with the university in any
way.
4. What will I be asked to do?
As a participant you will be asked to complete an online survey in relation to your
university study. All questions on the survey are in multiple choice format and you
will be asked to click the response that is most applicable to you. The survey will
take approximately 45 minutes to complete. The online survey can be accessed via
any computer that has internet access.
5. Are there any possible benefits from participation in this study?
Page 59
51
Your participation in the study will help us better understand the motivational and
engagement factors that contribute to academic success. The results of this study will
also assist future research, policy makers and the university in helping students
improve academically.
You are able to go into the draw to win one of four $50 Coles/Myer gift cards or if
you are enrolled in an introductory psychology class at the University of Tasmania
you are able to receive 45 minutes research credit.
6. Are there any possible risks from participation in this study?
The study poses no more than minimal risk, that is risks that are encountered in
everyday life. Additionally no foreseeable specific risk has been anticipated by
participating in the study. The study does not involve any deception. If at any point
in completing the survey you feel uncomfortable in responding please stop. However
if participating in the study has caused you any distress we recommend you contact
counselling services and support through Lifeline: 13 11 44, or BeyondBlue: 1300 22
4636.
7. What if I change my mind during or after the study?
Please remember that your involvement in the study is voluntary and you are free to
withdraw from it at any time prior to submission without an explanation or negative
consequence. It is important to note however that once you have submitted the
survey it is not possible to remove your data from the data-set as there is no way of
identifying which response-set belong to you.
8. What will happen to the information when this study is over?
The data from the study will be kept confidential and will be archived by the School
of Medicine (Psychology) in a locked repository for five years following publication.
The student researcher and supervisor will be the only people who have access to the
data. Five years after publication the data will be destroyed following the University
of Tasmania’s data destruction process.
9. How will the results of the study be published?
The results of the study will be able available at the University of Tasmania’s
websitehttp://www.utas.edu.au/psychology/. The approximate release date of
findings from the study is November 2015. The results of the study will be de-
identified and only reported at a group level therefore it is not possible for your own
data to be identified.
10. What if I have questions about this study?
Page 60
52
If you have any further questions please email Aleisha Howlett (Student Researcher)
at [email protected] or Dr. Kimberley Norris (Chief Investigator)
at [email protected] .
This study has been approved by the Tasmanian Social Sciences Human Research
Ethics Committee. If you have concerns or complaints about the conduct of this
study, please contact the Executive Officer of the HREC (Tasmania) Network on +61
3 6226 6254 or email [email protected] . The Executive Officer is the
person nominated to receive complaints from research participants. Please quote
ethics reference number '[H0014852].
Thank you for taking the time to read this information sheet. This form is for
you to keep and refer to at any point during the study if needed. Your consent
to participate in the study is implied by completion and submission of the
survey. If you have any further questions or enquires please contact Aleisha
Howlett at [email protected] .
Page 61
53
Appendix C
Demographic Questionnaire
Page 62
54
Information about You
The following questions will help us understand a little more about you, and how
things like age, sex, year of university study and entry pathway can affect your
learning, goals, and motives.
1. How old are you?
2. What is your sex?
- Male
- Female
- No Answer
3. What is your year of university study?
- First-year
- Second-year
- Third-year
- Honours
- Masters
- PhD
- Other: Please Specify
4. What is your citizenship?
- Australian Citizenship
- International
- Permanent Resident
- Humanitarian Visa
5. Are you of Aboriginal or Torres Strait Islander Origin?
- Yes, I am of Aboriginal Origin
- Yes, I am of Torres Strait Islander Origin
Page 63
55
- Yes, I am both of Aboriginal and Torres Strait Islander Origin
- No, I am not of Aboriginal or Torres Strait Islander Origin
6. What was your Entry Pathway?
- Secondary Qualification (ATAR) – Directly from high school
- Secondary Qualification (ATAR) – Following a gap year
- University College Program
- University Preparation/Enabling Program
- TAFE/VET Completion (Cert III)
- Previous University Study
- International Application
- Personal Competency Statement
- Aptitude Test
- Other: Please Specify
Page 64
56
Appendix D
Summary of Descriptive Statistics and Correlations between Variables
Page 65
57
Descriptive Statistics
Mean Std. Deviation N
OPPQpessimism 14.8033 3.36561 61
PALStotalSelfhandicapping 12.3143 4.40863 70
PFAIStotalFearofFailure 13.8611 4.10875 72
AGQRtotalSucessOrientation 44.2917 8.47272 72
Defensive Pessimism Classifications
Frequency Percent Valid Percent Cumulative
Percent
Valid
low 6 5.6 9.8 9.8
medium 26 24.1 42.6 52.5
high 29 26.9 47.5 100.0
Total 61 56.5 100.0
Missing System 47 43.5
Total 108 100.0
Self-handicapping Classifications
Frequency Percent Valid Percent Cumulative
Percent
Valid
low 51 46.4 72.9 72.9
medium 19 17.3 27.1 100.0
Total 70 63.6 100.0
Missing System 40 36.4
Total 110 100.0
Success-orientation Classifications
Frequency Percent Valid Percent Cumulative
Percent
Valid
low 6 5.5 8.3 8.3
medium 28 25.7 38.9 47.2
high 38 34.9 52.8 100.0
Total 72 66.1 100.0
Missing System 37 33.9
Total 109 100.0
Page 66
58
Fear-of-failure Classifications
Frequency Percent Valid Percent Cumulative
Percent
Valid
low 24 21.8 33.3 33.3
medium 37 33.6 51.4 84.7
high 11 10.0 15.3 100.0
Total 72 65.5 100.0
Missing System 38 34.5
Total 110 100.0
Page 67
59
Appendix E
Summary of Demographic Variables Predicting Self-handicapping and Defensive
Pessimism
Page 68
60
1. Sex and Age Predicting Self-handicapping
ANOVAa
Model Sum of Squares df Mean Square F Sig.
1
Regression 27.395 2 13.697 .678 .513b
Residual 849.050 42 20.215
Total 876.444 44
a. Dependent Variable: PALStotalSelfhandicapping
b. Predictors: (Constant), Sex, Age
Page 69
61
2. Sex and Age Predicting Defensive Pessimism
Model Summary
Model R R Square Adjusted R
Square
Std. Error of the
Estimate
Change Statistics
R Square
Change
F Change df1 df2 Sig. F Change
1 .348a .121 .076 3.33859 .121 2.686 2 39 .081
a. Predictors: (Constant), Sex, Age
Page 70
62
ANOVAa
Model Sum of Squares df Mean Square F Sig.
1
Regression 59.870 2 29.935 2.686 .081b
Residual 434.702 39 11.146
Total 494.571 41
a. Dependent Variable: OPPQpessimism
b. Predictors: (Constant), Sex, Age
Coefficientsa
Model Unstandardized Coefficients Standardized
Coefficients
t Sig. 95.0% Confidence Interval for B Collinearity Statistics
B Std. Error Beta Lower Bound Upper Bound Tolerance VIF
1
(Constant) 13.341 2.312 5.769 .000 8.664 18.018
Age -1.152 1.038 -.167 -1.110 .274 -3.252 .947 .994 1.006
Sex 2.559 1.316 .293 1.945 .059 -.102 5.220 .994 1.006
a. Dependent Variable: OPPQpessimism
Page 71
63
Appendix F
Summary of Hierarchical Regression Analyses Predicting Self-handicapping and
Defensive Pessimism
Page 72
64
1. Predicting Self-handicapping from Fear-of-failure, Success-orientation, and Fear-of-failure*Success-orientation interaction term
Model Summary
Model R R Square Adjusted R
Square
Std. Error of the
Estimate
Change Statistics
R Square
Change
F Change df1 df2 Sig. F Change
1 .511a .261 .247 3.97157 .261 18.406 1 52 .000
2 .528b .278 .250 3.96427 .017 1.192 1 51 .280
3 .528c .278 .235 4.00356 .000 .004 1 50 .951
a. Predictors: (Constant), PFAIStotalFearofFailure
b. Predictors: (Constant), PFAIStotalFearofFailure, AGQRtotalSucessOrientation
c. Predictors: (Constant), PFAIStotalFearofFailure, AGQRtotalSucessOrientation, SO_FoF
ANOVAa
Model Sum of Squares df Mean Square F Sig.
1
Regression 290.322 1 290.322 18.406 .000b
Residual 820.215 52 15.773
Total 1110.537 53
2
Regression 309.050 2 154.525 9.833 .000c
Residual 801.487 51 15.715
Total 1110.537 53
3
Regression 309.111 3 103.037 6.428 .001d
Residual 801.426 50 16.029
Total 1110.537 53
a. Dependent Variable: PALStotalSelfhandicapping
b. Predictors: (Constant), PFAIStotalFearofFailure
c. Predictors: (Constant), PFAIStotalFearofFailure, AGQRtotalSucessOrientation
d. Predictors: (Constant), PFAIStotalFearofFailure, AGQRtotalSucessOrientation, SO_FoF
Page 73
65
2. Predicting Defensive Pessimism from Fear-of-failure, Success-orientation, and Fear-of-failure*Success-orientation interaction term
Model Summary
Model R R Square Adjusted R
Square
Std. Error of the
Estimate
Change Statistics
R Square
Change
F Change df1 df2 Sig. F Change
1 .107a .011 -.011 3.44824 .011 .510 1 44 .479
2 .107b .012 -.034 3.48795 .000 .004 1 43 .951
3 .190c .036 -.033 3.48504 .025 1.072 1 42 .306
a. Predictors: (Constant), PFAIStotalFearofFailure
b. Predictors: (Constant), PFAIStotalFearofFailure, AGQRtotalSucessOrientation
c. Predictors: (Constant), PFAIStotalFearofFailure, AGQRtotalSucessOrientation, SO_FoF
Page 74
66
ANOVAa
Model Sum of Squares df Mean Square F Sig.
1
Regression 6.063 1 6.063 .510 .479b
Residual 523.176 44 11.890
Total 529.239 45
2
Regression 6.110 2 3.055 .251 .779c
Residual 523.129 43 12.166
Total 529.239 45
3
Regression 19.128 3 6.376 .525 .668d
Residual 510.111 42 12.146
Total 529.239 45
a. Dependent Variable: OPPQpessimism
b. Predictors: (Constant), PFAIStotalFearofFailure
c. Predictors: (Constant), PFAIStotalFearofFailure, AGQRtotalSucessOrientation
d. Predictors: (Constant), PFAIStotalFearofFailure, AGQRtotalSucessOrientation, SO_FoF
Page 75
67
Appendix G
Summary of Stepwise Regression Comparing the Predictive Utility of the two
Models in regards to Self-handicapping and Defensive Pessimism
Page 76
68
1. Predicting Self-handicapping from the dimensions of the Quadripolar Model of Need Achievement and the Motivation and Engagement
Wheel
Model Summary
Model R R Square Adjusted R
Square
Std. Error of the
Estimate
Change Statistics
R Square
Change
F Change df1 df2 Sig. F Change
1 .497a .247 .230 3.98340 .247 14.468 1 44 .000
a. Predictors: (Constant), PFAIStotalFearofFailure
ANOVAa
Model Sum of Squares df Mean Square F Sig.
1
Regression 229.572 1 229.572 14.468 .000b
Residual 698.167 44 15.867
Total 927.739 45
a. Dependent Variable: PALStotalSelfhandicapping
b. Predictors: (Constant), PFAIStotalFearofFailure
Page 77
69
2. Predicting Defensive Pessimism from the dimensions of the Quadripolar Model of Need Achievement and the Motivation and
Engagement Wheel
Model Summary
Model R R Square Adjusted R
Square
Std. Error of the
Estimate
Change Statistics
R Square
Change
F Change df1 df2 Sig. F Change
1 .107a .011 -.011 3.44824 .011 .510 1 44 .479
2 .107b .012 -.034 3.48795 .000 .004 1 43 .951
3 .190c .036 -.033 3.48504 .025 1.072 1 42 .306
a. Predictors: (Constant), PFAIStotalFearofFailure
b. Predictors: (Constant), PFAIStotalFearofFailure, AGQRtotalSucessOrientation
c. Predictors: (Constant), PFAIStotalFearofFailure, AGQRtotalSucessOrientation, SO_FoF
ANOVAa
Model Sum of Squares df Mean Square F Sig.
1
Regression 6.063 1 6.063 .510 .479b
Residual 523.176 44 11.890
Total 529.239 45
2
Regression 6.110 2 3.055 .251 .779c
Residual 523.129 43 12.166
Total 529.239 45
3
Regression 19.128 3 6.376 .525 .668d
Residual 510.111 42 12.146
Total 529.239 45
a. Dependent Variable: OPPQpessimism
b. Predictors: (Constant), PFAIStotalFearofFailure
c. Predictors: (Constant), PFAIStotalFearofFailure, AGQRtotalSucessOrientation
d. Predictors: (Constant), PFAIStotalFearofFailure, AGQRtotalSucessOrientation, SO_FoF