Page 1
-PREFACE-
I
PREFACE This thesis has been written as the final part of the Master of Science
programme in Industrial Engineering and Management at Lund University,
Faculty of Engineering (LTH). The study was carried out as an internship for
the European Space Agency (ESA) at the European Space Research and
Technology Centre (ESTEC) in Noordwijk, the Netherlands. The thesis is
focused on evaluating different software solutions that should support the Risk
Management process while implementing complex space projects at ESA.
There are a lot of people I would like to thank for assisting me throughout this
project. First my supervisor at ESA, Zaky El Hamel who organized my training
period and guided me through the whole project from start to end; Bertil
Nilsson, my supervisor at Lund University, who has provided lots of support
and feedback and helped me with the academic part of the thesis; everyone at
ESTEC who has taken an active part in the project and provided me with
valuable advices, guidance, information and support when writing this report
including Massimo Falcolini, Bernard Weymiens, Maria-Gabriella Sarah, Salim
Ansari, Isidro De Paz, Louise Daly, Raul Alarcon, and Raffaele Tosellini.
I would also like to take the opportunity to thank everyone else, especially the
members of the JWST team, who ensured a pleasant and rewarding placement
at ESTEC.
Although I have interacted with several people during the completion of this
report it is in the end me, the author, who is responsible for the report and its
contents.
Lund 2010-06-03
Claes Ohlsson
Page 2
-ABSTRACT-
II
ABSTRACT Projects in the space domain are extremely complex and often characterized as
being “one-off”, which makes it very difficult to make good predictions on
future developments. Furthermore, space projects are also associated with state-
of-the-art technology, high costs and long development time. Risks are
therefore a threat to project success because they may have negative effects on
the project cost, schedule and technical performance.
In order to properly manage these potential risks, a Risk Management (RM)
process is implemented as a support in the various project phases. The RM
discipline provides a framework for an iterative process that shall be used for
finding, dealing and working proactively with project risks.
To facilitate the proper implementation of the RM activities ESA has
developed, together with a software company, a Risk Management system,
Alpha. This is a customized solution and a question has been raised whether or
not the customized solution is the best approach. Some reasons being that ESA
has to take all the cost and initiative for further development of the system. As
an alternative, a COTS solution could be implemented. In order to find out what
direction to take a question needs to be initially answered: Are there any
available COTS solutions that are capable in supporting ESA’s RM process
and replacing the existing solution?
This report has tried to answer the question through conducting a survey of
commercially available RM tools and through performing a benchmarking
exercise where four COTS solutions were compared with the existing
customized solution. The survey was based on some of the major RM elements
suggested by the ECSS standard for RM with the purpose to find and down
select four tools to be included in the benchmark. The benchmark was in
general based on a framework for software requirements suggested by Soren
Lausen and interviews with relevant ESA personal but in particular based on
the ECSS standard for RM.
Several capable solutions where found in the survey but an analysis of the
results separated four tools (Alpha, Beta, Gamma and Delta) to be included in
the benchmark. The systems acquired the following score for the mandatory
requirements: Alpha 80 %, Beta 67 %, Gamma 79 % and Delta 74 %.
Page 3
-ABSTRACT-
III
From these results and the benchmark the author drew the following
conclusions:
Alpha is performing well and the tool is superior, compared to the
evaluated commercial tools, in terms of reporting requirements.
Two tools, Gamma and Delta, are able to compete with Alpha in terms
of overall performance. Gamma scored almost equally with Alpha and if
the tool supports the claimed configuration possibilities it could achieve
a perceivable increase in score. This basically means that if ESA would
change strategy and implement a commercial tool instead, the agency
would not have to sacrifice anything in terms of relative performance
(there would of course be gains/sacrifices for specific requirements).
Beta is currently not able to compete in terms of performance with the
other tools.
The approach of sending the requirement list as an enquiry to Epsilon’s
developer did not provide sufficient information to include the system in
the benchmark. However, the impression is that the tool may be capable
in supporting ESA’s RM process.
Alpha scored 80 % for the mandatory requirements, which means that
there is a possibility to improve the system. In chapter six suggestions of
further development of the tool has been presented which could increase
Alpha’s score to 97 %.
While Alfa is definitely a good candidate for continuing supporting the ESA
RM process, especially if the suggestions for further developing the tool are
taken into consideration, the author’s opinion is that the agency should further
investigate the possibility of implementing a new RM system. A recommended
approach is to extend the investigation described in this report by including
additional parameters (e.g. one of them also being financial) with the objective
to improve the current process and find a suitable vendor competent in both the
IT and RM fields. In this investigation a third party consultant could be
included with experience in the area of IT but most importantly also in the RM
field. Such project could be beneficiary for ESA both from an IT and from a
RM point of view.
Page 4
-ABSTRACT-
IV
The author’s opinion is that the developed methodology used in this study has
provided ESA with proper results and could be used in similar future studies.
However, as the requirements were assessed quantitatively an assessment of the
importance or criticality of each requirement would have provided even better
results.
Page 5
-SAMMANFATTNING-
V
SAMMANFATTNING Projekt inom rymdindustrin är av extremt komplex karaktär och nästan aldrig
det andra likt, något som gör det oerhört svårt att förutspå vilka framtida
problemscenarion som kan uppstå under projektets gång. De är också
associerade med höga kostnader, avancerad teknologi och långa tidshorisonter
vilket innebär att oförutsedda problem kan ha en stor negativ påverkan på
uppsatta projektmål.
För att kunna arbeta konstruktivt med de problem som kan uppstå under
projektets gång har ESA implementerat en riskhanteringsprocess till stöd för
projektprocessen. Detta för att säkerställa att man arbetar proaktivt med olika
risker i ett projekt och att rätt beslut fattas. För att underlätta och effektivisera
riskhanteringsarbetet har man också tillsammans med ett mjukvaruföretag
utvecklat ett riskhanteringssystem, Alpha. Huruvida detta är den bästa
lösningen har dock på senare tid ifrågasatts när faktorer som att ESA får ta all
kostnad och allt initiativ för vidareutveckling av systemet tas i beaktning. Ett
möjligt alternativ är att istället för den befintliga lösningen köpa in ett
kommersiellt standardsystem där utvecklaren är specialiserad på just
riskhantering. För att undersöka saken vidare måste en viktig fråga först
besvaras: Finns det några standardlösningar på den kommersiella marknaden
som är kapabla att stödja ESAs riskhanteringsprocess?
Denna rapport har försökt att svara på denna fråga genom att genomföra en
undersökning av den kommersiella marknaden för riskhanteringssystem och
med detta som utgångspunkt, testa och jämföra några av dessa lösningar mot
det befintliga systemet. Undersökningen är baserad på de viktigaste elementen
från ECSS-standarden för riskhantering och jämförelsen av systemen är baserad
på Soren Lausens bok Software Requirements – Styles and Techniques, på
intervjuer med anställda på ESA och mer djupt ingående på ECSS-standarden
för riskhantering.
Flera intressanta lösningar hittades i den initiala undersökningen, dock var det
fyra system (Alpha, Beta, Gamma och Delta) som utmärkte sig och dessa blev
därmed inkluderade i den slutgiltiga jämförelsen. Respektive system erhöll
följande poäng för de obligatoriska kravspecifikationerna: Alpha 80 %, Beta 67
%, Gamma 79 % och Delta 74 %.
Page 6
-SAMMANFATTNING-
VI
Nedan följer de slutsatser som författaren drog utifrån resultatet av jämförelsen:
Alpha är ett bra system på alla punkter och är överlägsen de andra
systemen på att generera önskvärda rapportformat.
Prestandamässigt är två system, Gamma och Delta, konkurrenskraftiga.
Gamma erhöll en poäng likvärdig Alphas. Om systemet går att
konfigurera i den utsträckning som är påstådd av utvecklaren skulle
Gamma kunna erhålla en märkbar poängökning. Det betyder att om
ESA skulle ändra strategi och implementera en kommersiell lösning,
skulle inte organisationen behöva uppoffra någon relativ prestanda (det
skulle dock självklart leda till förbättring/försämring på specifika
punkter).
Enligt utvärderingen är Beta inte tillräckligt bra för att konkurrera med
de tre toppnoterade systemen.
Tillvägagångssättet att skicka kravspecifikationslistan till Epsilon’s
utvecklare och låta företaget använda listan för att utvärdera sin egen
produkt gav inte tillräckligt bra information för att ha med systemet i
den slutgiltiga jämförelsen. Den kvarvarande uppfattningen är dock att
systemet kan vara kapabel att stödja ESA’s riskhanteringsprocess.
Alpha uppnådde 80 % av de obligatoriska kraven, vilket innebär att det
finns utrymme för förbättringar. I sjätte kapitlet har författaren gett
förslag på förbättringar vilka skulle kunna öka Alpha’s poäng till 97 %.
Eftersom det finns kommersiellt tillgängliga system som är kapabla att stödja
ESA’s riskhanteringsprocess anser författaren att organisationen ska fortsätta
att överväga att implementera ett nytt system. Något man först dock borde
ifrågasätta är varför en rymdorganisation utvecklar system för att stödja
affärsprocesser om det redan existerar flera befintliga aktörer med mångårig
erfarenhet inom ämnet. En rekommendation är att utvidga undersökningen
gjord av denna rapport och denna gång inkludera fler parametrar t.ex.
ekonomiska. Detta med syftet att förbättra processen och att hitta en passande
utvecklare som har sin nisch i IT– och riskhanteringsområdet. I denna
undersökning skulle man i så fall kunna inkludera en tredjepartskonsult som har
erfarenhet inom områdena. En sådan undersökning skulle ESA kunna dra fördel
av både genom en förbättrad process och ett förbättrat system.
Page 7
-TABLE OF CONTENTS-
VII
TABLE OF CONTENTS
1 INTRODUCTION ............................................................................................... 1 1.1 Background .......................................................................................................... 1 1.2 European Space Agency (ESA) ....................................................................... 2
1.2.1 History ........................................................................................................................... 2 1.2.2 Organisation and sites ............................................................................................. 3 1.2.3 Funding ......................................................................................................................... 4 1.2.4 A cooperation with European industry ........................................................... 5
1.3 Problem description ......................................................................................... 6 1.4 Focus and delimitations................................................................................... 7 1.5 Target group ........................................................................................................ 7 1.6 Purpose and goals .............................................................................................. 8 1.7 Report outline ..................................................................................................... 8
2 METHODOLOGY ............................................................................................. 10 2.1 ECSS-M-ST-80C and Case Study .................................................................. 10 2.2 Tool for selection and survey ..................................................................... 11 2.3 Qualitative vs. Quantitative methodology.............................................. 12 2.4 Operationalizing ECSS-M-ST-80C and the Case Study ........................ 12 2.5 Benchmark ........................................................................................................ 13 2.6 Process description ........................................................................................ 13 2.7 Criticism of the sources................................................................................. 14 2.8 Restricted material ......................................................................................... 15
3 THEORETICAL FRAMEWORK .................................................................... 16 3.1 Risk Management ............................................................................................ 16 3.2 Risks in projects .............................................................................................. 17 3.3 ECSS and ECSS-M-ST-80C .............................................................................. 18 3.4 The Risk Management Process for Space Projects .............................. 19
3.4.1 Step 1: Define risk management implementation requirements ........ 21 3.4.2 Step 2: Identify and assess the risks ................................................................ 23 3.4.3 Step 3: Decide and act ........................................................................................... 23 3.4.4 Step 4: Monitor, communicate and accept risks ........................................ 24
3.5 Developing software requirements ......................................................... 25 3.5.1 Software Requirements – An introduction ................................................... 26 3.5.2 Requirement list – contents overview ........................................................... 26 3.5.3 Requirement level ................................................................................................... 27 3.5.4 The traditional approach: product-level requirements .......................... 28
4 EMPIRICAL STUDY OF ESA RM PROCESS .............................................. 29 4.1 Step 1: Define RM implementation requirements .............................. 29
Page 8
-TABLE OF CONTENTS-
VIII
4.2 Step 2: Identify and assess the risks ......................................................... 31 4.3 Step 3: Decide and act .................................................................................... 32 4.4 Step 4: Monitor, communicate and accept risks .................................. 33 4.5 An iterative process ....................................................................................... 37 4.6 RM at agency level........................................................................................... 37
5 TOOL FOR SELECTION AND MARKET SURVEY .................................... 38
6 SOFTWARE REQUIREMENTS..................................................................... 41
7 BENCHMARK: ANALYSIS AND RESULTS ................................................ 42 7.1 GAMMA ................................................................................................................ 43 7.2 BETA .................................................................................................................... 45 7.3 DELTA .................................................................................................................. 47 7.4 ALPHA .................................................................................................................. 49 7.5 EPSILON .............................................................................................................. 50 7.6 COMPARISON OF RESULTS ........................................................................... 51 7.7 THE METHODOLOGY ...................................................................................... 52
8 CONSIDERATIONS AND RECOMMENDATIONS .................................... 54 8.1 Recommended approach for the commercial tools............................ 54 8.2 Recommended approach for Alpha .......................................................... 55
9 CONCLUSION AND REFLECTIONS ............................................................ 59 9.1 Conclusion ......................................................................................................... 59 9.2 General Reflections ........................................................................................ 60
10 REFERENCES............................................................................................... 63 10.1 Literature ........................................................................................................... 63 10.2 Articles ................................................................................................................ 63 10.3 Internet references ........................................................................................ 63 10.4 Other references.............................................................................................. 64
APPENDIX I: SCORING SCHEMES ......................................................................... I
APPENDIX II: RISK INDEX SCHEME .................................................................... II
APPENDIX III: RISK REGISTER .......................................................................... III
APPENDIX IV: RISK TREND CHART .................................................................. IV
APPENDIX V: INVESTIGATED TOOLS ................................................................ V
APPENDIX VI: SOFTWARE REQUIREMENTS LIST ..................................... VIII
APPENDIX VII: ABBREVIATIONS ...................................................................XVII
Page 9
-INTRODUCTION-
1
1 INTRODUCTION
In this chapter the author aims to give the reader an understanding of the
report’s background. The chapter will also include a presentation of the
European Space Agency as well as the report’s purposes and objectives.
1.1 Background
Projects in the space domain are extremely complex and often characterized as
being “one-off”, which makes it very difficult to make good predictions on
future developments. Furthermore, space projects are also associated with state-
of-the-art technology, high costs and long development time. Risks are
therefore a threat to project success because they may have negative effects on
the project cost, schedule and technical performance. A “good” example is the
Hubble Space Telescope, a project that was carried out by the National
Aeronautics and Space Administration (NASA). The project was delayed 7
years beyond its original launch date and the cost had increased with a factor 4
or 5 times its original cost estimates before the telescope was finally put into
orbit in 1990 to a cost of around $1.6 billion.1 But the setbacks did not end
there. Due to a problem with the primary mirror the telescope sent blurry
pictures back to earth and a repair mission was implemented ending up with an
additional price tag of $700 million.2 The Hubble project is unfortunately not an
exception in the space industry. When it comes to space projects, a majority of
the projects have overruns in terms of cost and duration.
To guarantee, to a project’s stakeholders, ESA’s capabilities and preparedness
to set objectives and pursue their successful attainment the agency has
implemented Risk Management (RM) as a support to the project process. The
requirements for the RM process are defined in documents such as the “ESA
Risk Management Policy” and standards e.g. “Space Project Management –
Risk Management” provided by the “European Cooperation for Space
Standardization” (ECSS).3 These documents and standards stress i.a the
1 Wilson R.N, 1999, Reflecting Telescope Optics II, p. 193
2 http://www.wired.com/science/discoveries/news/2004/02/62242, Hubble Space Telescope:
1990-2007, 2009-07-15 3 ESA Risk Management Policy
Page 10
-INTRODUCTION-
2
importance of documenting, communicating and reporting risks throughout the
process.
For an international organization such as ESA, implementing Risk Management
means that a lot of information and data need to be handled and thus the
organization decided to develop an IT-system to facilitate the process. ESA
outsourced the development of the software but decided to develop the system
in-house and according to the organization’s preferences.
1.2 European Space Agency (ESA)
ESA is an intergovernmental organisation dedicated to space oriented activities.
The agency’s mission is to:
“Shape the development of Europe’s space capability and ensure that
investment in space continues to deliver benefits to the citizens of Europe and
the world”. – ESA website
This is carried out by elaborating and implementing a European space policy,
suggesting and implementing (approved ones) space activities and projects and
coordinating the European space programme, a mission with solely peaceful
intentions.
1.2.1 History
After the Second World War European scientists realized that space projects
and research on a national basis in Europe would not be able to compete with
the ones carried out in the US and the Soviet Union. As a result, ESA’s
predecessor, European Space Research Organisation (ESRO) was formed in
1961 by ten European countries with the mission to develop a European space
programme. Three years later the member states decided to have two different
agencies, one responsible for developing spacecrafts (ESRO) and one,
European Launch Development Organisation (ELDO), responsible for
developing a launch system.
ESA, in its current form, was founded in 1975 by ten European countries
(Belgium, Germany, Denmark, France, United Kingdom, Italy, the Netherlands,
Sweden, Switzerland and Spain) through a merger between ESRO and ELDO.
Since then the agency has extended its number of member states to 18 (2009)
Page 11
-INTRODUCTION-
3
with Ireland, Austria, Finland, Greece, Czech Republic, Portugal, Luxembourg
and Norway as affiliating nations. Further; Canada, Hungary, Romania, Poland,
Slovenia and Estonia have signed cooperation agreements with the agency.
ESA has throughout its history implemented several different space projects.
Venus Express was launched in November 2005 with the purpose to study the
planet Venus. It has made several discoveries including finding evidence that
the planet once had surface water. Rosetta (launch date: 2004-03-02) is another
example of an ESA project and the first mission designed to orbit and land on a
comet (expected arrival in 2014). The agency is also involved in international
projects, e.g. the ISS (International Space Station) to which ESA has made
contributions such as the science laboratory module, Columbus. In addition to
these projects the agency also has a human spaceflight programme. This
programme has in cooperation with NASA and RKA sent several European
astronauts into space.
1.2.2 Organisation and sites
As being an intergovernmental organization, ESA has a governing organ, “the
Council”, which is composed by representatives from the agency’s member
states. The council is responsible for:
Drawing up the European space plan and ensuring that it is being
followed
Approving both ongoing and future Programmes
Deciding on the level of resources to be made available to ESA4
Another of the Council’s responsibilities is to appoint a “Director General”
(DG), the chief executive officer and legal representative of ESA who is
managing the agency in accordance with the directives set by the Council.5
All the activities carried out at ESA are divided into 10 different directorates
(see figure 1.1), each headed by a director who reports directly to the DG and
each with a specific area of responsibility.
4 http://www.esa.int/esaCP/ESATE4UM5JC_index_0.html, The ESA Council, 2009-07-16
5 Convention for the establishment of a European Space Agency & ESA Council – Rules of
procedure, March 2003
Page 12
-INTRODUCTION-
4
Figure 1.1 Organisational structure for the DG and the Directorates6
The agency has around 2000 employees and an annual budget of €3591 million
(2009). The main sites constituting ESA are:
Headquarter in Paris, France.
EAC, the European Astronauts Centre in Cologne, Germany.
ESAC, the European Space Astronomy Centre, in Villanueva de la
Canada, Madrid, Spain.
ESOC, the European Space Operations Centre in Darmstadt, Germany.
ESRIN, the ESA centre for Earth Observation, in Frascati, near Rome,
Italy.
ESTEC, the European Space Research and Technology Centre,
Noordwijk, the Netherlands.
1.2.3 Funding
The majority of the programmes carried out at ESA are funded by its member
states, but a single member state can still to some extent decide its level of
involvement. As a member it is compulsory to contribute, based on a member
state’s Gross Domestic Product (GDP), to the activities which fall under the
6 http://www.esa.int/esaCP/ESATE4UM5JC_index_0.html, The ESA Council, 2009-07-16
Director General
Earth Observation
Technical & Quality
Management
Launchers
Human Spaceflight
Resources Management
Legal Affairs and External
relations
Science and Robotic
Exploration
Telecommunications and
Integrated Applications
Applications
Galileo Programme and
Navigation-related Activities
Operations and Infrastructure
Page 13
-INTRODUCTION-
5
general budget and the scientific programme. These are called the “mandatory”
activities and include basic activities such as studies on future projects and
technology research. On the contrary there are the “optional” activities (e.g.
activities that falls under the earth observation and human spaceflight
programme) for which member states can decide their level of involvement.
The figure below shows 2009’s budget for the mandatory and optional
programmes.
Fig 1.2 ESA’s budget 2009 by programme
1.2.4 A cooperation with European industry
After getting an insight in how ESA’s activities are funded one could ask
themselves what the benefits as a member state are and why a member state
should contribute to the optional activities. The answer to this starts with
getting a general understanding of ESA’s role in a project. When space projects
are born and developed at ESA the agency works closely with the European
Page 14
-INTRODUCTION-
6
industry. Though ESA is coordinating the project from an idea phase to the
actual implementation some processes are outsourced to commercial companies
within the agency’s member states. Such contracted processes include for
example manufacturing which exclude a common misconception that “ESA is
producing satellites”. Which company/companies that will be involved in the
project is/are to some extent regulated through something called the
“geographical return”. This means that ESA is investing a more or less
equivalent amount of a member state’s contribution back into the country’s
local industry. Thus ESA is not only providing European citizens with benefits
through technology and research but also in terms of jobs and economic growth
within its member states.7
1.3 Problem description
Some years ago one of ESA’s directorates, Science and Robotic Exploration
(SRE), contracted a software developer to create a fully customized IT tool to
be used as a support for SRE’s RM process. Since then the tool has been in
constant development adding new functionality according to SRE’s needs.
Compared to a commercial standard solution, it is questionable whether or not
the customized solution is the most effective one. Especially when considering
the following aspects:
The contracted company may not have the necessary competency in the
field of RM, which may lead into problems during the development of
the tool
All initiative and associated costs for further development/enhancement
of the tool are to be born by the Agency.
As being the only customer of the tool, the Agency shall also cover the
necessary costs for maintenance and support.
The list can be made long, but there are of course also sizeable benefits when
going for a fully customized solution. Most importantly, SRE can control the
development according to the directorate’s needs.
If there are no commercially available tools capable in supporting ESA’s RM
process, then a customized solution is the only option. If this is not the case, the
agency may reconsider its approach. In order to fully understand what options
7 http://www.esa.int/esaMI/About_ESA/SEMW16ARR1F_0.html, What is ESA?, 2009-07-16
Page 15
-INTRODUCTION-
7
ESA and SRE have available today, a project was initiated to benchmark the
existing tool and together with suitable commercially available solutions.
The main question this report will try to answer is:
How well does the existing tool perform compared to solutions
available on the commercial market?
1.4 Focus and delimitations
The project will focus on finding what Soren Lausen in his book “Software
Requirements – Styles and Techniques” refers to as a COTS (Commercial Off
The Shelf) system. In this report this will also refer to software only, not
hardware.
The report will focus on finding a support tool for risk management on a
project basis. Thus, it will not consider the process of managing operational
risks. Neither will the report focus on questioning the risk management process
itself and will therefore mainly consider, in the theory chapter, the approach
provided by the European Corporation of Space Standardisation (ECSS).
The presented considerations and recommendations will almost entirely be
based on software performances/capabilities, based on a consolidated set of
requirements identified together with the SRE management and potential users.
No recommendations will be presented of what option ESA should proceed
with (the already implemented customized solution or any of the commercially
available tools) as this would require an investigation of several other aspects
(e.g. return on investment, long term pros/cons etc.), outside of the scope of this
work.
1.5 Target group
The primary target group is ESA staff members dealing with Project
Management, Project Control, Quality Assurance and System Engineering. The
second target group include University students in the fields of Risk, Project
and Quality Management as well as Information Technology.
Page 16
-INTRODUCTION-
8
1.6 Purpose and goals
The main purpose of this report is to provide ESA with a relative comparison
(mainly in terms of performances and capabilities) between the agency’s
customized RM solution and commercially available RM solutions. With this as
a base the author will provide ESA with, for each tested tool, recommendations
and aspects to consider. Thus, the benchmarking will also address what each
tool lacks and where there are room for improvements. To verify and present
the final recommendations the study has been broken down into a number of
phases:
Empirical study of ESA’s (SRE’s) RM process
Survey of commercially available RM tools
Down selection and demo acquisition
Development of user/software requirements list
Evaluation and benchmarking
Final considerations and recommendations
1.7 Report outline
The report will consist of the following main chapters:
Methodology The methodology chapter will present and discuss the methodological approach
that was used in the report. The aim of the chapter is to provide a clear and
complete description of the steps when writing the thesis and to ensure that the
research has been carried out properly.
Theoretical framework This chapter will have two parts. The first one will present the Risk
Management process suggested by the ECSS, which will form a foundation for
the coming chapters. It will also be used to validate the input from the software
users. The second part will present a framework when defining and structuring
software requirements.
Empirical study of ESA RM process Basically, one could define a requirement list based entirely on the ECSS
standard. This would however not be appropriate as the standard is intended to
provide a framework for the actual work tasks and thus there will be some
Page 17
-INTRODUCTION-
9
differences between practise and theory. This chapter aims to provide a general
understanding of the actual RM process at ESA. The approach does also
provide an opportunity to validate and compare the user requirements.
Tool for selection and market survey The aim with the report is to find a number of commercial RM tools and
compare them with the existing one. This chapter will explain and present the
survey that was conducted in order to investigate the market and to down select
a number of tools to be further analysed and included in the benchmark.
Software Requirements Based on ESA’s current RM process, requirement engineering was performed
in order to create a framework for the benchmark. In this chapter the developed
list of requirements that was used in the benchmark will be explained. The
actual requirements are listed in Appendix VI.
Benchmarking: Analysis and Results The outcome of the benchmark will be presented and analysed in this chapter. It
will start with a presentation and an overview of the benchmark. Then each tool
is presented along with their major strengths and weaknesses. Finally, a relative
comparison between the tools is presented.
Considerations and Recommendations With the previous chapter as a base, considerations and recommendations for
each evaluated tool is presented in this chapter depending on ESA’s future
approach.
Conclusion and Reflections
The conclusion will summarize the most important parts in the previous
chapters and answer how well the existing RM tool is performing compared
with the commercial solutions. The chapter will also present some reflections
the author got from the project.
Page 18
-METHODOLOGY-
10
2 METHODOLOGY
In this chapter the author will discuss the used methodology when writing the
thesis.
2.1 ECSS-M-ST-80C and Case Study
In order to understand the requirements for a RM solution the actual process
has to be described and studied. As ESA’s RM process is aligned with ECSS’s
standard for RM (ECSS-M-ST-80C, see part 3.2 for more information), this
will be considered as the main theoretical framework for understanding the
process and the base for both the tool for selection and the benchmark.
An empirical study of the actual process will also be carried out in order to
provide a deeper understanding of how the standard has been implemented.
Thus, the standard does only provide a framework for how the process should
be implemented which means that in most cases there is room for interpretation.
For this part the author will primarily use the case study approach. This means
that when describing ESA’s actual RM process, a specific case will be studied
and this case will be considered to represent the whole organization. This
approach has both pros and cons compared with studying several cases more
superficially. The pros including: less time consuming and deeper
understanding of the specific case. The cons including: the case might not be
representative for the organization and important parts might be missed.
The empirical study of ESA’s RM process will be represented by the activities
carried out under the directorate of Science and Robotic Exploration (SRE) for
the James Webb Space Telescope project. The reason for this is mainly because
the directorate is in the frontline of implementing RM at ESA (which implies
that the studied case is representing how ESA actually wants to work with RM).
Some other projects will also be superficially studied, as this will provide an
idea of the needed flexibility of the RM tool.
In cases where the aim is to define a number of software requirements the case
study approach can be beneficial because it will most probably narrow down
the scope of each requirement. This will further define a better system standard
Page 19
-METHODOLOGY-
11
and a standard way of doing things, something that large organizations such as
ESA are striving for.
The study will be performed primarily through gathering relevant information
from RM documentation and through in depth interviews with the project
group. The aim for the study is to provide additional and more accurate
information for the tool for selection and the benchmark.
2.2 Tool for selection and survey
One of the first tasks in this project is to find four suitable tools to be compared
with the existing solution. The natural approach is thus to initially find as many
tools as possible that fits ESA’s basic criteria for a RM solution, and from this
population select four tools with the most potential for the comparison. There is
of course an option to include all the tools in the benchmark but that would not
be feasible from a time point of view. Commercially available RM solutions
will mainly be found through searching the Internet but also through asking
employees at ESA with experience in the field as well as actors in the same and
related industry.
The question that now needs to be answered is: which of the investigated
solutions will be selected for the benchmark? The answer to this starts with
developing a tool for selection, which will form the foundation for the decision-
making. This tool will consist of some of the basic requirements for a RM
solution and provide information to be analyzed for each of the found solutions.
The analyzed information will then be presented and discussed together with
the project group, which will eventually lead to a decision for the tools to be
included in the benchmark. The project group consists of ESA employees with
relevant experience in the RM and IT field including the SRE-M management
(see part 4.4), project members from the JWST project and representatives from
the Directorate of Technical and Quality Management and the Director
General’s Policy Office.
A part from some basic requirements stemming from the ECSS standard for
RM, the tool for selection will also include information about the perceived
credibility of the supplier and some other and technical information that needs
to be considered. This part of the tool will be based upon an empirical case
study. The actual information about the developers and their RM applications
will be gathered from marketed material, telephone and e-mail conversations.
Page 20
-METHODOLOGY-
12
2.3 Qualitative vs. Quantitative methodology
Qualitative methodology is a less formalized methodology (compared to
quantitative) where the purpose is to obtain a deeper understanding of the
problem that is studied and to make a complete detailed description.
Quantitative methodology is more focused on collecting data in primarily
numerical form to be used in statistical models. 8
Using one of the methods does not rule out the use of the other method.
Sometime it is preferred to use a combination of them. A qualitative approach
will be used when making the empirical study in order to provide a deeper
understanding of the process, but also when evaluating the data in the
benchmark. The quantitative approach will be used in order to assess the score
of each tool. With this combination approach we benefit both from the structure
of the quantitative method and its strong analytical qualities as well as the
flexibility of the qualitative method. Thus, in this type of project it is both
important to be able to compare the evaluated tools in terms of numbers but at
the same time remain flexible when evaluating software. A flexible requirement
will not disregard a solution just because it is different.
2.4 Operationalizing ECSS-M-ST-80C and the Case Study
Operationalization is the process of converting the used theoretical frameworks
and concepts into something measurable.9 In this case we want to
operationalize the concepts and frameworks provided by the ECSS-M-ST-80C
and the case study in order to create the tool for selection and the framework for
the benchmark. Thus, in the first case the task is to measure different
commercially available RM solutions in order to find the four most appropriate
ones. The second task is to, more deeply, measure these four tools and the
existing solution to provide a relative comparison between the tools.
The tool for selection will, as discussed before, consist of some basic
generalized requirements. You could say that the tool is a superficial version of
the benchmark.
The next task is to operationalize the concepts into an in depth measurable
investigation for the benchmark. For the conversion part the author will study
8 Holme I.M, Solvang B.K, 1997, Forskningsmetodik, p. 76-79
9 Holme I.M, Solvang B.K, 1997, Forskningsmetodik, p. 159-160
Page 21
-METHODOLOGY-
13
literature in the subject, i.e. requirements engineering. Thus, a software
requirement can translate a real task into an IT-system demand. The foundation
for the benchmarking will consist of a list of defined requirements for which
each tool’s performance is quantified and evaluated.
2.5 Benchmark
The list of down selected tools will include the internally developed solution
and those solutions with the highest ranking according to the tool for selection/
survey. The actual evaluation will then be assessed through testing demo
versions (except for the existing tool, where the actual implemented software is
tested) acquired from the developers. Any restraints in the demo versions will
also be assessed.
Each requirement will be assessed in terms of the level of fulfillment and
verified as objectively as possible. Some requirements, e.g. The RM tool shall
support a "multiuser" environment, are easier to assess objectively as the level
of fulfilment can be verified numerically, in this case the number of users that
the tool supports. Others, e.g. The RM tool shall be user friendly and easily
deployable to non expert users, is harder to assess objectively without
performing a survey including several different users. As time is a restraint,
these types of requirements will have to be assessed in a more qualitative
manner based on the author’s perception.
2.6 Process description
The figure below aims to visualize and describe the process and the interaction
between gathered material and tasks when carrying out this project.
Page 22
-METHODOLOGY-
14
Fig 2.1 Process description
On the left side, under “supporting material”, it is shown how the theoretical
framework and the case study have been used to create the tool for selection
and the list of software requirements. On the right side, under “the process”, it
is shown how the tool for selection is used to perform a survey on the RM Tool
Market, which results in four down selected tools. These are later included
together with ESA’s tool in the benchmark (which is based on the defined list
of software requirements) where the output information is presented and
analyzed. Considerations and recommendations will then be provided to ESA,
which will be followed by some final conclusions drawn by the author.
2.7 Criticism of the sources
When performing the survey the credibility of the provided information from
RM software suppliers will be questioned. Thus, suppliers’ marketed materials
along with information provided from sales persons have a tendency to
exaggerate the capabilities of their product. However, the suppliers will also be
required to send screenshots of their product’s interface while it is performing
Page 23
-METHODOLOGY-
15
different tasks, something that often provides good information of what the
product is really capable of doing.
For the case study, the information will also be gathered through interviews
with people from the project group in general and the head of SRE-MC in
particular, which could in principle offer a sometime biased view. Therefore,
the author will, to the greatest possible extent, use multiple sources in order
establish an independent assessment of the information..
2.8 Restricted material
Due to some of the investigated material being internal not all information can
be published in this report. This specifically refers to the information gathered
during the evaluation process of the down selected tools. Evaluated tools will
therefore be referred to as letters in the Greek alphabet (Alpha, Beta, Gamma
etc). ESA´s existing RM solution will be referred to as Alpha, the four tools
included in the benchmark as the four consecutive letters (Beta, Gamma, Delta,
Epsilon) and the same will be applicable for the tools included in the survey
starting from Zeta. If letters run out, numbers starting from 1 will be applied
after the Greek letters.
If the information has not been gathered from a company’s marketed material,
or e.g. is a widely known methodology the report will not describe in detail how
a tool solves a problem/ fulfil a requirement only if it solves the problem/ fulfil
the requirement. This is also applicable on information gathered through other
types of information exchange (telephone conversations, e-mail, documents
etc.) where classification has been stated.
Further, some of the information gathered from ESA documents has been
excluded. This especially applies to specific information about projects under
development where confidential/proprietary information is being addressed.
These exclusions will not influence the reading nor interfere with the review of
the thesis.
Page 24
-THEORETICAL FRAMEWORK-
16
3 THEORETICAL FRAMEWORK
This chapter will provide a fundamental exposition of the theories and concepts
used in this project. The chapter will also form the foundation for the following
chapters and discussions.
“Risk - The possibility of incurring misfortune or loss.”10
“Risk is a problem that has not happened – yet.”11
Above are two definitions of what a risk is. Both definitions imply that a risk is
something negative, which some people would disagree with. They would say
that a risk could have both a negative and a positive outcome. The Chinese
language has for example the same sign for both risk and chance.12
For the
author, however, a risk does imply a possible unfortunate event and thus will
throughout the report have a negative notion to it.
3.1 Risk Management
The concept of Risk Management originates from the U.S in the 1950s. It was
at that time associated with the activities for handling a company’s insurances.
Since then the area of Risk Management has broadened and it now includes
several processes and activities that has the end purpose of reducing future
losses/damages.13
The original American definition of Risk Management is pretty simple but still
quite accurate: “RM is common sense when finding cost effective ways to
either prevent or pay for accidental losses”. It has the purpose to limit the
amount and the magnitude of damages to the lowest possible protection cost.
Thus, it will always be a consideration between the damage cost and the cost of
preventing the damage from occurring with the end purpose to maximize profit.
Most people would probably agree so far. The systematic process for dealing
10
Collins English Dictionary & Thesaurus 11
H. Frank Cervone, Project risk management, OCLC Systems & Services, Vol. 22 No. 4,
2006 12
Hamilton G, 1996, Risk Management, p. 13 13
Hamilton G, 1996, Risk Management, p. 9-11
Page 25
-THEORETICAL FRAMEWORK-
17
with risks will however differ depending on whom you ask and what kind of
risks you are dealing with. Gustaf Hamilton suggests a four-step process with
the following activities:
1. Risk analysis – Map the risk environment. Identify, assess and prioritize
the risks.
2. Risk treatment – Take measures in order to reduce the probability of the
risks.
3. Damage treatment – Reduce the consequences of the risk.
4. Damage financing – Elicit the needed resources for repairing or
compensating the loss/damage.
There are several different approaches and methods for each of the steps,
especially for the risk analysis, but this report will from this point onward focus
on the ones suggested by the ECSS.
3.2 Risks in projects
In the context of projects, a risk is commonly described as an uncertain
event/series of events that, if occurring, could affect the project objectives
negatively. This is sometimes also referred to as a risk scenario and described
through a cause and a consequence. For example, a cause could be that a
technology planned to be used in a project has not yet matured within the given
time frame and if occurring this could have negative consequences in regard to
cost, schedule, performances etc. Making this kind of description is included in
the identification of risks, one of the steps in the RM process.
Stakeholders in a project are almost certain in wanting information about the
involved risks before investing any resources. To be able to take proper
decisions a description of the cause and consequence is not enough, the risk
scenario must also be measured somehow. This is most commonly done
through assessing the likelihood/probability of occurrence and the severity of
impact of the risk scenario.14
Depending on the risk’s and project’s
characteristics there are different methods when carrying out the assessment
activity. Basically these methods can be categorized into two groups,
14
Ayyub B.M, 2003, Risk Analysis in Engineering and Economics, p. 35
Page 26
-THEORETICAL FRAMEWORK-
18
quantitative and qualitative assessment. Quantitative assessment is the most
objective approach. It relies on statistical data and defines the probability and
severity of impact in numerical values. For example, there is a 62.5 %
probability that the risk will have a cost impact of € 20 000. Qualitative
assessment uses judgement and expert opinions to define the probability and
severity of impact and is thus more of a subjective approach. The output when
using this approach could for example be; it is likely that the risk will have a
significant impact on project costs.
The approach to use depends on the availability of data and the complexity of
the risk. The quantitative method demands a lot more detailed information
compared with the qualitative and is used more commonly for known and less
complex systems. The opposite is applicable on the qualitative approach and is
thus more commonly used for risk management at project level.15
The Risk Management process adds the controlling of risks to the previous
described identification and assessment activities. Controlling of risks include
activities such as monitoring, communication and mitigation. If applied to
projects, this can be referred to as Project Risk Management (is equivalent to
Risk Management in this report). The discipline will be thoroughly described as
a process, specifically drawn up for the space industry, later in the chapter.
3.3 ECSS and ECSS-M-ST-80C
As mentioned in the introduction, ESA is an international agency incorporating
a vast number of different actors from different nationalities. This is almost
certain to result in problems in terms of high costs and ineffectiveness because
of the usage of different standards. An example of how devastating this could
be was in 1999 when NASA lost a $125 million Mars orbiter. According to a
later published review the loss was simply due to a metric confusion where one
engineering team used metric units while another one used imperial units for a
key spacecraft operation.16
To reach a common consensus the European Cooperation for Space
Standardisation (ECSS) was formed in the autumn 1993. ECSS consists of
15
Ayyub B.M, 2003, Risk Analysis in Engineering and Economics, p. 84 16
http://www.cnn.com/TECH/space/9909/30/mars.metric.02/, Metric mishap caused loss of
NASA orbiter, 2009-06-19
Page 27
-THEORETICAL FRAMEWORK-
19
participants from ESA, other European space agencies (and the Canadian Space
Agency), industry (Eurospace is representing the European industry) and other
associated organisations. The cooperation’s goal is to increase the efficiency
and strengthen the international competitiveness of the European space industry
through standardisation of the activities carried out in space projects. These
activities could be categorized into five domains:
Project management - responsible for the organisation of a project,
making sure it reaches its objectives in a timely and cost effective
manner.
Engineering – responsible for the system’s design, structure and
verifying that the technical requirements specified by the customer are
achieved.
Production – responsible for manufacturing the system specified by the
engineering domain.
Operations – responsible for making sure the system achieves its
objectives during the operational phases.
Product assurance – responsible mainly for the quality assurance part
of a project.17
The standard developed by ECSS for risk management, ECSS-M-ST-80C:
Space project management – Risk management, was published 31 July 2008
and contains guidelines, principles and tools for the risk management process. It
is intended for the project management, engineering and product assurance
domain of a space project.
3.4 The Risk Management Process for Space Projects
The risk management process “consists of all the project activities related to
the identification, assessment, reduction, acceptance and feedback of risks”.
The process can be divided into four steps, where the last three steps are
iterated throughout the project phases (see fig 3.1). Each step consists of a
number of tasks (see fig 3.2).
17
http://www.ecss.nl/, ECSS – A Single Set of European Space Standards, 2009-06-16
Page 28
-THEORETICAL FRAMEWORK-
20
Figure 3.1: The steps in the risk management process.
The figure (3.1) above illustrates how the RM process starts with defining the
risk management implementation requirements and then continues with three
steps (identification and assessment, decide and act, monitor, communicate and
accept risks), which are iterated throughout the project process.
The next figure (3.2) shows the tasks included in each of the steps. The steps
and the included tasks will be deeply described in the next parts (3.3.1-4).
Figure 3.2: The tasks associated with the different steps in the risk management process.
Page 29
-THEORETICAL FRAMEWORK-
21
3.4.1 Step 1: Define risk management implementation requirements
The initial step initiates the risk management process and consists of two tasks
where the first one is to define the risk management policy. This policy shall
define and include the following:
The set of resources with impact on risks.
The project goals and resource constraints.
A strategy for dealing with risks.
Scoring schemes for the severity of consequences (impact) a risk has on
a certain resource and the likelihood of this risk to occur (see fig 3.3 and
3.4).
Figure 3.3. Example of a scoring scheme for severity of consequence (tbd is an
abbreviation for “to be determined”).
Figure 3.4. Example of a scoring scheme for likelihood of occurrence
A risk index scheme to communicate the magnitude for a certain risk
(see fig 3.5). The risk magnitude is decided through creating a scheme
with the likelihood of occurrence on the y-axis and the severity of
consequence on the x-axis. A risk is then given its corresponding
magnitude depending on where in the scheme it is located. The red area
indicates high risks and the green area low risks.
Page 30
-THEORETICAL FRAMEWORK-
22
Figure 3.5. Example of risk index scheme
The actions to be taken for various risk magnitude (see fig 3.6).
Figure 3.6. Example of proposed actions to be taken for different risk index/magnitude
The magnitude of an acceptable risk.
Page 31
-THEORETICAL FRAMEWORK-
23
A method for ranking and comparing risks.
A method to measure the overall risk.
When the overall risk has reach an acceptable level.
How to monitor risks and what format to use when communicating risks
to decision-makers.
The second task in the first step is to prepare the risk management plan. This
document typically contains the following data:
A description of the risk management organisation, defining different
roles and responsibilities.
Summary of the risk management policy.
Format of documentation used during the risk management process.
How the risk management activities should be implemented during the
project duration.
3.4.2 Step 2: Identify and assess the risks
The second step initiates the actual iterative process that is carried out
throughout the project duration. The first part in this step is the identification
of risks which is done according to the risk management policy. This part
includes defining; cause, consequences and project objectives at stake for each
identified risk.
The next task is to assess the identified risks, which is done according to the
defined scoring schemes (see fig 3.3-5). Activities in this task include:
Determination of severity of consequence, likelihood of occurrence and
risk index for each risk.
Determination of the magnitude for each risk.
Determination of the overall project risk.
3.4.3 Step 3: Decide and act
After a risk scenario has been identified and assessed, a strategy has to be set in
defining how to deal with the risk and what actions to be taken. The first task in
this step is to decide whether the risk shall be accepted or if a
reduction/mitigation plan shall be applied, which is mainly based on the
magnitude of the risk. If the decision is to accept the risk proceed directly to
Page 32
-THEORETICAL FRAMEWORK-
24
step 4 (Monitor, communicate and accept risks) but if the decision is to set a
treatment plan the next task will be to reduce the risk. This task includes the
following activities:
Determine what actions that can be taken to mitigate the risk.
Determine the criteria for mitigation success, failure and verification.
Decide what action(s) to be taken in order to reduce the risk, taking into
consideration the resources needed to be invested.
Verification of risk reduction.
Identify and present the risks that cannot be reduced or verified in
having been reduced to appropriate management level.
Determine how the potential risk reduction efforts will affect the overall
risk.
Document the resolved and unresolved risks in two separate lists.
The next task is to recommend acceptance which include presentation of
resolved and unresolved risks. This in order to seek approval for the resolved
risks and to take further actions for the unresolved risks.
3.4.4 Step 4: Monitor, communicate and accept risks
The last step in the RM process consists of the two tasks: monitor and
communicate the risks and submit risks for acceptance.
The identified risks have to be updated and reassessed regularly to be able to
track the progress of the RM work. Thus, the attributes of the risk could have
changed over time and the efforts to reduce the risk might not have been
successful. This information should then be communicated to appropriate
management level.
An example in how to illustrate the risk evolution is through a risk trend chart.
This chart shows how the magnitude has changed over time. In figure 3.7, three
risk scenarios’ (S1, S2 and S3) changes in magnitude during different project
phases have been illustrated through a risk trend chart.
Page 33
-THEORETICAL FRAMEWORK-
25
Figure 3.7. Risk trend chart for three different risks; S1, S2 and S3.
In the final task the risk should be submitted to appropriate management level
for formal risk acceptance. If the risk is not accepted further actions has to be
taken in order to reduce the risk.
In the end, risks will always be taken during the project process but it is up to
management to decide whether or not to stop with the mitigation actions. This
decision will always be a consideration between the magnitude of the risk
(severity of consequence and the probability of occurrence) and the set of
resources needed to mitigate the risk to an acceptable level.
An ESA spacecraft, Rosetta, with the main purpose to study the comet
46P/Wirtanen was scheduled to launch in January 2003. However, due to a
failure in the planned launch vehicle the month before liftoff, the risk of losing
Rosetta was considered too high and therefore the spacecraft was grounded.
The launch was postponed and the scientists had to look for new alternatives,
new comet to study, new trajectory for Rosetta etc. Hence, the spacecraft was
planned to encounter an object covering a huge distance on its path through the
solar system which means that if missing the relatively short launch window, it
might take a while to the next opportunity. This stress the importance of
keeping the project up to schedule in some space missions. Though the risk
scenario described above had been taken in to account no real actions were
implemented to mitigate the risk as the necessary resources were considered to
be too high.
3.5 Developing software requirements
The information in this part derives from Soren Lausen’s “Software
Requirements – Styles and Techniques”, if not otherwise is stated.
Page 34
-THEORETICAL FRAMEWORK-
26
3.5.1 Software Requirements – An introduction
The aim when specifying a system’s requirements is to describe what the
system should do, basically the system’s inputs and outputs.
Depending on what type of system the customer is looking for and the chosen
process leading up to its implementation, the requirements could vary in
character and importance. In cases where the requirement list is used as a
contract between customer and supplier, for example when acquiring a fully
customized solution, the list is crucial as it must be well defined in order to
meet the stakeholders expectations and could be used as reference in case of
disputes. When looking for an off-the-shelf product, a requirement list is more
used for a comparison between different solutions. Still, the list is important to
find the “best” and most suitable solution but every single requirement does not
need to be exactly defined if it is not crucial. On the contrary, if a requirement
should solve a problem through an already existing function, an “over defined”
requirement could sort out capable solutions just because it does not follow the
requirement exactly.
As mentioned in the introduction, the focus for this study is to identify COTS
(Commercial Off The Shelf) systems, which denote an already existing
commercial package solution (e.g. Microsoft Office, SAP solutions). Some of
the COTS systems are static (e.g. Microsoft Office) and others are more
flexible and can be configured in such extent that the customer needs a
consultant to do it (e.g. SAP). There are two different terms when referring to a
COTS system:
COTS purchase – refers to the purchase of a fully off-the-shelf
product. Any required configurations will be performed by the customer
itself.
COTS- based acquisition – refers to the acquisition of a solution built
around off-the-shelf parts but to some extent tailor-made by the supplier
to meet the customer’s need.
3.5.2 Requirement list – contents overview
As mentioned earlier the requirements should specify the input and outputs of
the system. There are a wide number of different types of requirements and
below follows some central parts (categories) in a requirement list:
Page 35
-THEORETICAL FRAMEWORK-
27
Data requirements - specifies the system input and output and what
data to be stored internally in for example a database. The requirement
can be described in several different ways e.g. through a data model or
through a simple textual description.
Functional requirements – specifies how the system records,
computes, transforms and transmits data.
Quality requirements – specifies how well the system performs its
intended functions. This is for example measured in terms of respond
time and usability.
Other deliverables – specifies requirements for other deliverables e.g.
documentation.
Managerial requirements – specifies time frames for implementation,
price, legal matters etc. This type of requirements could be more of a
contractual issue.
3.5.3 Requirement level
Depending on the situation and the purpose of the requirement list there are a
number of different levels to choose from when specifying and phrasing each
requirement. When for example a management consultant agency is the system
supplier, it might be enough for the customer to specify the business goals that
the software is intended to help achieve. In other cases when for example the
customer is looking for a fully customized solution and is specifying the
requirements directly to a software supplier the requirements need to be more
thoroughly specified, as the supplier often does not have sufficient knowledge
about the specific business process the software is intended to support. Soren
Lausen is separating four requirement levels:
Goal-level requirement – defines the business goal and the purpose of
the product. E.g. the product shall ensure that at least 90 % of the
organization’s projects are within time and budget.
Domain-level requirement – domain-level refers to the activities and
tasks that shall be supported by the system but are carried out outside
the actual product. Thus, a requirement on domain-level does not tell
how the product shall perform something. E.g. the product shall support
the reduction planning of risks.
Page 36
-THEORETICAL FRAMEWORK-
28
Product-level requirement – the actual input/output of the product is
specified in this type of requirement. E.g. the product shall for each risk
record and retrieve (text) a reduction plan.
Design-level requirement – in this type of requirement the actual
interface is specified. E.g. the product shall provide a data entry screen
as seen in fig x.
3.5.4 The traditional approach: product-level requirements
There is no standard way in how to combine the different types of requirements
and what approach to use when structuring a requirement list, mainly because
of the different nature for these types of projects. However, there are some
guidelines/models that can be used as a basis depending on the project type.
When carrying out a benchmarking exercise for a COTS system, the customer
often has a number of desired features that he/she wants to compare different
products against. The suggested model when creating the requirement list is
then the traditional approach: product-level requirements. In this model the
stakeholders are interviewed, relevant documents are studied and brainstorming
activities are conducted. The central parts in the specification list are the
following:
Introductory parts (including business goals)
The limits of the system
Data requirements
Product-level functional requirements
Quality requirements
When creating and implementing a system specification list, each of the
requirements needs to be verified and validated. Verification of a requirement
means that the product is tested against the requirement in order to assure that it
is fulfilled, while validation infers a test of the actual requirement in order to
assure that it corresponds to; what the customer really want/ the actual task that
shall be supported.
Page 37
-EMPIRICAL STUDY OF ESA RM PROCESS-
29
4 EMPIRICAL STUDY OF ESA RM PROCESS
The following part aims to present how the risk management process and work
proceeds at the European Space Agency. The presented information is gathered
through reviewing a RM process carried out at the SRE directorate and
originates mainly from interviews with JWST project members and from JWST
risk management plan.
4.1 Step 1: Define RM implementation requirements
The first step in ESA’s RM process is to elaborate a project specific RM plan.
This step contains elements from the first two tasks (i.e. “define the risk
management policy” and “prepare the risk management plan”) in the RM
process suggested by ECSS (see figure 3.1). ESA has developed a separate
“Agency level” risk management policy, which is very generic and does require
a dedicated plan addressing its implementation, which is currently being
prepared. Furthermore the ongoing certification in the frame of ISO 9001
would require the preparation of additional procedures.
The risk management plan is specific for each project and includes the
following:
Objectives of the risk management implementation
An introduction stating what the purpose is (enlarge visibility, ensure effective
communication in the project etc.) when carrying out risk management.
Mission objectives and risks domain
In this part the objectives, the requirements for successful attainment, the
sources of risks and the domains of impact are presented. For example:
Mission objective: study the atmospheric composition of exoplanets
(planets outside our solar system).
Requirements: put an instrument in orbit around earth on-time with no
cost overruns and provide scientists with data from at least 500 objects.
Sources of risks: launcher vehicle, subsystems etc.
Domains of impact: technical performance, schedule, cost etc.
Risk management strategy and approach
Page 38
-EMPIRICAL STUDY OF ESA RM PROCESS-
30
Explains the general RM approach for the particular mission and defines the
schemes and metrics used in the assessment step. This is an important part in
order to successfully assess the risks and is something that differs from project
to project depending on the project scope, complexity and allocated resources.
For risks with an impact on cost and schedule the scores (except the highest
ones) are defined in terms of contingency loss (measured in %). Thus, all risks
with an impact leading to project cost and duration overruns, even the smallest
one, will be assessed with the highest score as they would lead to an
unsuccessful attainment of project objectives. The scoring schemes used for the
James Webb Space Telescope Project (JWST) can be viewed in Appendix I.
Risk management process
This part explains the systematic approach suggested by the ECSS and how it
should be implemented for the mission in particular.
Roles, responsibilities and procedure for risk management
Different people have different roles in a project according to their area of
expertise. The RM responsibilities within the JWST project team are:
Project Manager - Has the overall responsibility for the RM process
within the ESA part of a mission. Holds regular meetings (in JWST at
least every 12 weeks) with the project leads with the purpose to review
identified and assessed risks and associated action plans.
Project Assurance Manager – Is in charge of the risk register, the
supporting software and updates the risk register in accordance with the
risk review meetings.
Risk owner - Is in charge for the specific risk. The risk a person will be
responsible for commonly reflects the project task one has. Thus, it is
the person responsible for the specific activity or sub process that also
holds the knowledge about the involved risks within his/her area. These
are categorized into areas of concern or sources of risks. For example, a
source could be the launcher vehicle that has an assigned coordinator
and it is his/her responsibility to identify, assess and report the
associated risks, changes, coordinate action tasks for mitigation etc.
The RM process is continuous, which means that as soon as a risk is identified
this is communicated to the Project Manager and to the Project Assurance
Manager. Together with the project leads, they will review the risk, decide if it
Page 39
-EMPIRICAL STUDY OF ESA RM PROCESS-
31
is going to be implemented in the risk register and if so assign a risk owner.
The risk review meetings are formal activities to further ensure, review and
discuss the risks.
Risk management documentation and follow-up This part defines and explains the reasons for the risk documentation to be used
throughout the RM process. These are as follows:
to ensure and demonstrate a proper conducted RM process
to provide evidence for a systematic approach
to provide a historical record
to provide decision makers with sufficient information
to facilitate continuous monitoring and review
to provide an audit trail
to share and communicate information
to increase efficiency and effectiveness in managing the project’s
problem areas
The actual reporting frameworks are described in step 4.
4.2 Step 2: Identify and assess the risks
While the first step mainly exists to define the project specific framework for
the risk management activities, it is in the second step the actual RM work to be
carried out throughout the project life-cycle starts.
Basically a risk is identified through a risk title, cause, consequence and the
domain(s) for which the risk has an impact (i.e. financial, schedule etc.). When
a risk is first identified a number of additional information is recorded to keep
track of the risk and further categorize it. This includes:
Risk originator – Person who identifies the risk
Risk owner – See Roles, responsibilities and procedure for risk
management
Risk source – See Mission objectives and risk domain
Risk horizon – The time frame for when the risk can materialize
Project/Organisation – The affected entity/entities (e.g. JWST, SRE)
Page 40
-EMPIRICAL STUDY OF ESA RM PROCESS-
32
The risk assessment is based on the perception of the people responsible for the
risk, using the scoring schemes defined in the risk management plan. The
assessment of risks is discussed at dedicated review meetings in order to ensure
that the proposed scoring is not based on one person’s subjective perception.
The severity of consequence and the likelihood of occurrence is scored through
an ordinal scale from 1 to 5 respectively A to E. The two metrics define the risk
index (e.g. 5E) and the risk magnitude (Red, Yellow, Green or High, Medium,
Low). The risk magnitude is determined depending on where in the risk index
scheme the assessed risk is located. Examples of a risk register and the scoring
schemes can be viewed in Appendix I-III.
The assessment of risks is an important activity in the RM process as it
communicates the importance and criticality of the risk and is often the
foundation from which decisions are taken.
All project members and supporting staffs are requested to contribute to the risk
identification and assessment activities. Further shall all risks with a possible
impact on project objectives, whether originating internally or externally, be
included when identifying the risks. This means that subcontractors are also
responsible to carry out RM on their activities and provide the project teams at
ESA with risk reports. These are reviewed and it is then decided whether or not
to integrate the risks in ESA’s system.
Note: In the ECSS standard one of the bullets was to determine the overall
project risk. This is not done through any calculations and should be treated
with caution. A qualitative assessment does not provide any numbers that can
be used mathematically even though the actual risks have an impact on the
same domain. Also, two risks with an impact on different domains are not
comparable (in many cases risks have an impact on several domains). There are
other RM approaches that provide a methodology for determining the overall
project risk. This will be presented briefly later in the report.
4.3 Step 3: Decide and act
After a risk has been identified, assessed and stored in the risk register the
options for handling the risk will be considered. Below follows examples of
handling strategies that can be considered:
Page 41
-EMPIRICAL STUDY OF ESA RM PROCESS-
33
Risk avoidance - if an activity is associated with an unacceptable risk
the preferred strategy could be not to proceed with the activity or
replace it with another one which meets the project objectives.
Risk mitigation - refers to reducing the risk’s likelihood of occurrence
and/ or its severity of consequence. A consideration will be made
between the risk magnitude and the needed resources in order to reduce
the risk. Reducing a risk’s likelihood of occurrence is more common
than reducing its severity of consequence, because of the former most
often demands less resources. Imagine an identified risk being a tank
leakage leading to an uncontrolled ignition of the propellant causing the
launcher vehicle to explode. In order to reduce the severity of
consequence this would probably have to be done through developing a
total new way of launching the vehicle or researching a new type of
propellant. This would further lead to a revision of several of the
vehicles already existing functions. On the other hand, reducing the
risk’s likelihood of occurrence could be done through strengthen and
isolating the tank or implementing routines for inspection.
Risk transfer – refers to transfer the risk, in part or in full, to another
party. This commonly means a reallocation of the costs to different
parties which could be done through e.g. insurance.
Risk defer – if a risk is automatically reduced over time due to being
triggered by external circumstances, or if a treatment action is foreseen
to take place at a later stage the risk could be deferred.
In order to achieve the handling strategy, a number of actions are planned
which are later implemented accordingly. Recorded information associated with
actions includes basically who shall do what, when, the planned residual risk
magnitude after implementation and the means for verifying successful
attainment.
4.4 Step 4: Monitor, communicate and accept risks
The purpose when monitoring risks is to obtain clarification of how the risk
reduction measures are proceeding and how the risks are changing over time.
Risks and the effectiveness of control measures need to be monitored in order
to ensure changing circumstances do not alter risk priorities. New factors may
arise changing the assessment metrics as well as the suitability of assigned
Page 42
-EMPIRICAL STUDY OF ESA RM PROCESS-
34
resources for reduction. To keep track of any changes the status of the risk is
updated continuously.
Both the ESA risk management policy and the ECSS-M-ST-80C stress the
importance of communicating and reporting risks internally and externally.
These are some of the major elements in the RM process and partially exist to
provide stakeholders and management with information concerning the
different risks associated with their area of interest and responsibility. Thus, in
the end it is the upper level management that are taking the overall decisions,
holds the final responsibility for the agency’s activities and it is the
stakeholder’s resources that are put at risk. Effective internal and external
communication is therefore of great importance to be able to understand the
basis of which decisions are taken and why particular actions are required.
In each step when reporting upwards in the hierarchy the major risk items and
the process of managing them are monitored and discussed to ensure the RM
process has been carried out properly.
The structure of the SRE directorate is presented in figure 4.1.
Page 43
-EMPIRICAL STUDY OF ESA RM PROCESS-
35
Figure 4.1 Structure of the SRE Directorate
The specific project process under the SRE directorate is carried out within the
directorate’s departments and offices, where the departments functions as the
initiators and implementers of the process and the offices as a support for this.
The general responsibility of each department includes:
Science and Robotic Exploration Projects Department (SRE-P) –
determining needs for projects and the management of all approved
ones from the initial definition phase to in-orbit commissioning.
Research and Scientific Support Department (SRE-S) – providing
scientific expertise and support to projects and studies in all phases.
Science Operations Department (SRE-O) – managing and operating
missions ones they have been successfully commissioned and ensuring
Page 44
-EMPIRICAL STUDY OF ESA RM PROCESS-
36
maximum scientific return within the technical and budgetary
constraints.18
During a project’s duration at SRE the different departments and the Project
Control and Risk Management Service (SRE-MC) work closely with carrying
out the risk management process. The project teams within the divisions hold
the expert knowledge concerning specific risks and are providing SRE-MC
with risk inputs. Relevant information (major risk items and the process of
managing these risks) are reported to the head of each department and continues
upwards to the director of the directorate and finally to the DG.
Due to having different concerns, needs, assumptions and constraints the
perception of the same risk can vary from one stakeholder to another. Because
of the significant impact stakeholders can have on the decision-making this is
something that has to be taken into account by the PM when communicating the
risks.
Within projects and between SRE-MC, risks are basically communicated
through a risk register (see Appendix III), presenting the current information of
the specific risk. When communicating and reporting to upper level
management a heat map (i.e. the risk magnitude is illustrated through a position
in the risk matrix) and a risk trend chart (i.e. illustrating the evolution of the risk
magnitude over time, see Appendix IV) are presented in order to provide an
overview of the organisation’s/project’s risks and how the RM work is
proceeding.
A risk is basically accepted when it reaches the green area in the risk index
scheme (low magnitude risk). In some cases, higher magnitude risks may also
be accepted. Thus, in the end the decision of accepting a risk will always be a
consideration between the risk magnitude and the demanded resources for
reducing the risk. The acceptance of risks does not mean that the risk will not
be further considered, it will be monitored thus circumstances and risk
magnitude may still change over time.
18
Directorate of Science and Robotic Exploration (Admin), 2009-04-23
Page 45
-EMPIRICAL STUDY OF ESA RM PROCESS-
37
4.5 An iterative process
New risks will be identified and controlled throughout the project life cycle
according to the last three steps in the RM process. This is also the case for
existing risks that are yet to be accepted, making RM an iterative process. The
existing risks are reconsidered at least every review meeting in order to update
the risk information and to plan any further handling strategy.
4.6 RM at agency level
The actual RM process at agency level is basically the same as the one
implemented at SRE with one major exception: The scale for the severity of
consequence and likelihood of occurrence is based on a 3-part scale. This
means that the risk index scheme is a 3x3 matrix and all risks eventually
escalated from project level will have to be re-assessed according to the new
scale.
Page 46
-RM TOOL MARKET SURVEY AND DOWN SELECTION-
38
5 TOOL FOR SELECTION AND MARKET SURVEY
This chapter aims to describe the survey and down selection of commercially
available RM tools.
The purpose with the survey was to investigate the commercial market and see
if there were any available RM tools with the potential of supporting ESA’s
RM process. The survey would also form the decision base for which tools to
be included in the benchmark (if there were any with the capability). It was
carried out through gathering information from RM tool developers’ websites,
brochures and through e-mail/ telephone conversations. A first consideration
was taken to the suitability of the tool i.e. how well in line with ESA’s risk
management process the software is:
1. Project and risk specification. The ability to start a new project and
define risk categories, impact areas etc.
2. Identification and assessment. The ability to define risk scenario
attributes (e.g. title, owner, cause, consequence, impact domain etc.),
carry out qualitative assessment (likelihood of occurrence, severity of
consequence, risk index etc.) of the risk scenarios and store them in a
risk register/database. The ability to rank risk scenarios, thus to identify
the most critical ones.
3. Decide and act. The ability to record a reduction strategy, the action to
be taken and the status of the risk scenario.
4. Monitoring and communicating the risks. Produce reports and risk
index scheme (heat maps) to provide a good overview for upper level
management. Tracking of the evolution of identified risk items through
e.g. risk trend chart.
Three measurements, some with a more subjective (from the author’s point of
view) nature, were then evaluated.
1. Company credibility. The main question to ask here is: Does the
company manage to successfully convey a credible image through their
website? This is partially done through investigating:
General information about the company.
Page 47
-RM TOOL MARKET SURVEY AND DOWN SELECTION-
39
Previous customers.
Website layout and structure.
Contact information.
If the information about the company’s products are well
structured and informative.
The credibility has also been investigated by searching the Internet in
order to find if there are any customer complaints or company
appearances in any relevant magazines and/or websites.
2. Overall marketed features and extra functions to support ESA’s
(future) risk management activities.
3. Tool design. This is investigated through the first impression that is
provided by screenshots of the tool in how user friendly and
aesthetically appealing the tool’s interface seems to be.
Other and technical information:
1. Integration possibilities with other project management software used at
ESA (Microsoft Office, Oracle Project Management etc.).
2. Customization possibilities (and flexibility)
3. Stability, based on the software version.
4. Proceedings for demo acquisition.
5. What platform the software is based on. A web-based application could
provide the risk management team with access externally and would
facilitate maintenance.
6. Is it a standalone application or does it come with a backend database?
7. Does the tool come with a user administration tool? If the tool shall be
incorporated throughout the whole organisation it has to be possible to
assign different access and permissions to different users.
8. Firewall restrictions.
9. Cost for setup and maintenance.
In general the abilities to identify and assess risks and associate them with
specific projects/organisations are some of the basic functionalities for a tool
capable in supporting ESA’s RM process. A majority of the tools included in
the survey were capable of doing this, but there were basically two distinctive
differences in how this was done. Several software developers integrate the RM
Page 48
-RM TOOL MARKET SURVEY AND DOWN SELECTION-
40
process into the project scheduling activities. This means that when a risk is
identified it is more or less associated with a specific task in the project
schedule. E.g. Microsoft Project has this feature included and through adding a
separate tool, for example Palisades “@Risk for project” it is possible to
perform Monte Carlo simulations and additional risk analysis. In this kind of
RM it is necessary to use a different approach, than presented in this report, for
the assessment of risks (otherwise the provided information could be totally
misleading). For more information the author recommends the book The failure
of Risk Management: Why it’s broken and how to fix it by Douglas W.
Hubbard. The other commonly used method lets you add risks separately from
the project schedule and store them in a central register. The systems that are
supporting this kind of method are often referred to as Enterprise Risk
Management systems. As the process is carried out now at ESA the latter is
more suitable.
The majority of the analyzed tools that were not selected for a more thorough
evaluation can be viewed, accompanied with a short comment, in Appendix V:
Investigated Tools. Some of these were excluded just by reviewing the
marketed material others needed additional information exchange through e-
mail and telephone conversations.
The tools selected for the benchmark was Alpha, Beta, Gamma, Delta and
Epsilon. .
Page 49
-SOFTWARE REQUIREMENTS-
41
6 SOFTWARE REQUIREMENTS
This chapter will explain the requirements that were used as a base for the
benchmark.
The requirements have been divided into six different groups:
1. General requirements – specifies the overall requirements of the
system.
2. Technical requirements – specifies some overall requirements with a
more technical nature. Note: The actual hardware and software
requirements have not been evaluated. This has to be tested in order to
investigate the possibility to implement the system on ESA’s IT
infrastructure.
3. Functional requirements – specifies how the system records,
computes, transforms and transmits data.
4. Data requirements – specifies the system’s input and output and what
data to be stored internally in for example a database.
5. Reporting requirements – specifies the system output in terms of
generated reports.
6. Quality requirements – specifies how well the system performs its
intended functions and the provided support.
As the requirements are mainly described as a textual feature description they
will be relatively easy to validate, both according to the ECSS-standard and the
customer. For the same reason and because demo versions were acquired it was
also relatively easy to verify the majority of requirements. However, some of
the requirements (mainly in section 1,2 and 6) had to be verified by the vendor,
which is of course not an ideal situation.
The full list of 68 mandatory and 12 optional requirements are presented in
Appendix VI: Software Requirements List.
Page 50
-BENCHMARK: ANALYSIS AND RESULTS-
42
7 BENCHMARK: ANALYSIS AND RESULTS
This chapter will provide a short introduction of the tools included in the
benchmark, the most important outcome of the evaluation and an analysis of
the results.
All tools except Epsilon have been evaluated according to the set of
requirements defined in Appendix VI. The approach to Epsilon has been to
provide the developer with the list of requirements to be commented on in order
to form an opinion. For the tested tools, each requirement has been given a
score (Good, Fair and Bad) depending on the level of fulfillment. The general
definition and the weight of the score is the following:
Good – The tool meets (or exceeds) the expectations of fulfilling the
requirement. Weight: 1.
Fair – The tool does partially or not in a fully satisfactory way meet the
requirement. Weight: 0.5.
Bad – The tool does not meet the requirement or does not meet the
requirement in a way that can be considered useful. Weight: 0
Table 7.1 presents examples of three assessed requirements (each with a
different degree of fulfillment) that have been picked from the evaluation. In
addition to the degree of fulfillment a “comment box” has also been used in
order to explain and justify the assessment.
ID Requirement Degree of Fulfillment
Comments Good Fair Bad
1.2
The RM tool shall support a ”multiuser” environment
No restraints
3.17
The RM tool shall list all risks that match specific search values.
Even with given access over several projects, the search engine only list the searched risks included in the active project and revision.
3.10
The RM tool shall allow the deletion of an existing risk
Not supported due to audit trail (will be addressed in the new release)
Table 7.1 Examples of assessed requirements
Page 51
-BENCHMARK: ANALYSIS AND RESULTS-
43
The total score for each system in the benchmark was calculated as the total
level of fulfillment (%), through the following equation:
wi
ji 1
j
wi weight for requirement i
j total number of requirements
The score alone does not provide enough information for any decision taking.
Thus, a system with a score of 0 % for the optional requirements and 50 % for
the mandatory requirements could be, if all requirements ranked as fair, a
system capable in supporting ESA’s RM process. Further, a system could with
a score of 100 % for the optional requirements and slightly below 100 % for the
mandatory requirements, be a system not capable in supporting ESA’s RM
process, as one of the most critical requirements was not fulfilled. The score
does however provide; an overview of the general capability and suitability of
the tool and a foundation for a relative comparison between the tools. In order
to create a better foundation for decision-making, the score is followed by an
impression and analysis accompanied with an explanation of the tools major
strengths and weaknesses (something that could disqualify the tool).
All tested tools support project risk management (i.e. possible to create risks
and associate them with projects), which is an indication that the survey has
been conducted properly. They support a similar step-by-step process as the one
suggested by the ECSS standard for RM. This is done through a “tab structure”,
meaning: the recording of risk information is split into tabs where each tab
presents the user with a screen representing one of the RM steps. Where and
how information is recorded differs but it is basically divided into
identification, assessment and reduction measures.
7.1 GAMMA
Gamma’s developer is focused on providing software solutions and services for
Risk Management. Claimed previous customers include Boeing and Lockheed
Martin. Gamma is marketed as an Enterprise Risk Management software
solution.
Page 52
-BENCHMARK: ANALYSIS AND RESULTS-
44
Gamma’s score
The table below presents the score that Gamma acquired through the
benchmark.
Mandatory requirements Optional Requirements
79 % 67 % Table 7.2 Gamma’s Score
Impression and analysis
Gamma “stands out” in a positive way with a logical and intuitive folder
structure built around a convenient architecture. When logging on to the
application the user will be provided with a view that lists the risks and actions
that needs attention. The creation of risks, actions, hierarchies etc. is made
through right clicking on an item in the hierarchy structure and then choosing
the wanted action. This will lead the user to a new layout where the actual
information is recorded.
The tool is capable in supporting SRE’s and ESA’s Risk Management process.
“Capable” meaning, compared to the evaluated demo version, some
configurations has to be made and tested before implementation. This should
not be a barrier as the needed configurations can be performed by the
administrator. What could disqualify the tool is the lack of possibility to define
mandatory fields, any restraints in configuring the reporting features and most
important the response time.
Major strengths
Folder structure and usability - One of the major strengths of Gamma
is the folder structure, where the separate folders can represent different
projects and organizations. This provides the user with a logical
structure and made the tool the easiest among the tested to understand
and use.
Configuration and flexibility – The tool is highly configurable. In
order to fully support SRE’s RM process, the tool has to be configured
to some extent. When evaluating the demo version the author identified
a number of areas that would have to be configured, these included:
drop down menus, terminology, categories, the risk information input
layout and reports (e.g. colors in the probability grid and information
Page 53
-BENCHMARK: ANALYSIS AND RESULTS-
45
shown in reports). The developer claims that all of these areas are
possible to configure by the administrator.
Audit trail – The audit trail records all changes and support a layout
were it is possible to see what changes that have been made. It also
excludes the need for a “review structure” (refers to the functionality of
Alpha).
Service – This was not addressed in the list of requirements but should
be taken into consideration. Provided information, material and
response time (to set up demo, answering e-mails etc.) were excellent.
There was no unwillingness to share information which indicates that in
a possible implementation there will be no “unpleasant surprises”.
Major weaknesses
Mandatory fields – It is not possible to set mandatory fields in the
current version. This is a major weakness because it can lead to
inconsistent input information and reports.
Numerical index – This has to be treated with caution. The scales of
the assessment metrics are not comparable and can not be used for any
further calculations or comparisons.
Response time – The response time of the demo can not be considered
as reasonable. This was applicable on the general usage of the tool
including performing different actions, inputting data and browsing
between the application’s different screens.
Reports – The reporting features included in the demo version were not
capable in supporting SRE’s reporting requirements. There were no
comparative reporting feature and no filters for what risks to include in
the reports. The tool can generate reports for a specific folder and it is
possible to create filters for what risks to be shown in the system (and
eventually in the reports) but this is an inconvenient way to solve the
problem.
7.2 BETA
Beta’s developer is providing systems, engineering, technical and managed
services to mainly governmental customers. Claimed customers include
Lockheed Martin and T-Mobile. Beta is marketed as an easy-to-use web
application for enterprise-wide, program and/ or project Risk Management.
Page 54
-BENCHMARK: ANALYSIS AND RESULTS-
46
Beta’s score
The table below presents the score that Beta acquired through the benchmark.
Mandatory requirements Optional Requirements
67 % 54 % Table 7.3 Beta’s Score
Impression and analysis
Beta runs smoothly and is easy to use and understand. However, it does not
manage to fulfill enough of the reporting requirements and are lacking many of
the functional and data requirements. The early version of the tool manifests
itself through some minor bugs. For example, it is possible to change the date
for which the risk was implemented in the system and the residual assessment
for the mitigation plan is not connected to the initial assessment.
Major strengths
Usability – The layout and the structure of the tool is good, making it
easy to understand.
Project screen – The “Project Screen” provides a good overview of the
project risks, which is a nice feature for the Project Manager/ Risk
Coordinator.
Project step-by-step setup – The tool provides an easy-to-use step-by-
step guide when setting up project attributes.
Major weaknesses
License fee for any additional projects – The pricing strategy of
buying a license per every project is adding an additional cost compared
with the other evaluated systems. There is a possibility to reuse retired
projects but will exclude the functionality of communicating a “lesson
learned” as the previous information will be overwritten.
Help desk open hours – The company is situated in a country where
the opening hours of the help desk are inconvenient due to the time
difference.
Page 55
-BENCHMARK: ANALYSIS AND RESULTS-
47
Audit trail – The information stored in the audit trail is insufficient.
Basically only the change date along with changes in risk assessment
and status are recorded.
Lack of search engine – The tool does not support a search engine
within the application.
Reports – The detailed reports are well structured and the filtering
options are good but the tool lacks other reporting features such as
comparative, distribution, heat map and risk evolution reports. None of
the graphical reports provide any real relevant information for RM
(more focused towards compliance) e.g. a bar chart showing the amount
of new identified risks per month. Further, the tool is lacking “dummy-
proofs” as it is possible to for example set unrealistic time horizons and
mitigation actions that do not reflect the actual risk assessment.
Configuration – It is possible to set a number of attributes and define
some terminology, but the configuration possibilities are not enough in
order to align the tool with SRE’s RM process.
7.3 DELTA
Delta’s developer offers management solutions to a variety of complex
technology industries. Claimed previous customers include NASA. Delta is
marketed as a web-enabled application database for documenting and
communicating information about risks in a manner that enhances the
probability of program success.
Delta’s score
The table below presents the score that Delta acquired through the benchmark.
Mandatory requirements Optional Requirements
74 % 54 % Table 7.4 Delta’s Score
Impression and analysis
The tool is aligned to a RM process similar to the one suggested by ECSS, but
it will most certainly not revolutionize the way RM is carried out at ESA. It
does not “stand out” (neither in a positive nor negative way) compared to the
other evaluated tools. It supports a hierarchy structure, but this is poorly
developed compared to Alpha’s.
Page 56
-BENCHMARK: ANALYSIS AND RESULTS-
48
Major strengths
Usability – The tool is easy to use and no training is needed to
understand its basic functionalities.
Reporting features – Delta is the commercial available tool that best
fulfills the reporting requirements and the only reporting feature it lacks
is a risk distribution table. The tool also provides a convenient filtering
feature, making it possible to choose which risks to include in each
report. Only the administrator is able to create new revisions therefore it
was not possible to generate an evolution or a comparison report in the
demo version. This requirement was therefore assessed as fair (with
room for corrections). Several reports are generated in Microsoft Office
software (Excel, Power Point, Word) which is viewed as beneficiary by
some thus making it possible to “post edit” reports. The author’s
opinion is the opposite for the same reason as this would lead to
inconsistency between the reported information and the information
recorded in the tool. All editing of information should be done within
the tool itself. A weakness for the reporting features is the time it takes
to generate a single report in Word, Power Point and Excel.
Major weaknesses
Stability – Delta’s version number is quite high, but the demo version
did not manage to convey an impression of Delta being a mature and
stable system. During the evaluation phase, Delta was the tool with most
experienced problems and crashes. The tool does not feel robust and
you get the impression that functionality has been added without the
code being “renovated”.
Pricing strategy and maintenance policy – There is no clear pricing
strategy or maintenance policy.
Date format – The recording of dates causes some frustration. First of
all the user has to record the date manually, secondly the date format is
U.S adjusted meaning MM/DD/YYYY (compared to the European
standard: DD/MM/YYYY). Beta uses the same format but the tool had
a “Calendar pop up” feature when recording dates. The format could
lead some confusion when reading reports generated by both Beta and
Delta.
Page 57
-BENCHMARK: ANALYSIS AND RESULTS-
49
7.4 ALPHA
Alpha’s developer has a long history of providing services to ESA (other
customers include Astrium). The company’s core activity is to develop solutions
for project management and control. Alpha is described as a risk management
support tool that aims to help identifying, assessing, reducing, accepting and
controlling risks during the lifecycle of a project.
Alpha’s score
The table below presents the score that Alpha acquired through the benchmark.
Mandatory requirements Optional Requirements
80 % 63 % Table 7.5 Alpha’s Score
Impression and analysis
From the defined list of mandatory requirements, Alpha can be considered as
the best application. The tool supports the basic functional and data
requirements and is undeniably the best suited to support the reporting
requirements. What has to be kept in mind is that a majority of the requirements
originates from actual users of Alpha, which gives the tool a “head start”. For
example, one of the requirements is that the RM tool shall support progressive
revisions, which is not necessary with a sufficient audit trail (will be discussed
later in the report). Further, does the requirement for a demo tutorial become
obsolete as the tool is already implemented at ESA’s IT infrastructure.
Alpha has some minor flaws but the major problem is within the application’s
structure and layout, which impact the usability of the tool. The impression of
the tool is that functionality has been picked together and been spread
throughout the application with not too much consideration been taken where it
should be and how it should be performed according to the process (will be
further discussed later in the report).
Major Strengths
Reporting features – Alpha is the only application that more or less
supports all the required reporting features.
Number of supported functional and data requirements – The tool
does support most of the mandatory functional and data requirements.
Page 58
-BENCHMARK: ANALYSIS AND RESULTS-
50
Major Weaknesses
Organization/Project Structure – The application does not, in a
convenient way, support a hierarchy structure. This is important if
implemented as an agency wide tool.
Layout –The layout when browsing through the application is somehow
confusing and the screens have not been properly structured.
Clone/Copy Risks – The tool is currently not supporting the copying of
risks.
7.5 EPSILON
Epsilon’s developer is specialized in developing risk management software with
Epsilon as its core product. Previous (and current) claimed customers include
NASA and Lockheed Martin. Epsilon is marketed as a highly configurable ERM
system, comprehensively covering project, operational and corporate risk
management.
Note: There has been no testing of the actual application and the following part
is thus based on the perception of the information provided by the developer.
Impression and analysis
As the scoring system for the level of fulfillment, based on the provided
comments, basically becomes obsolete Epsilon would reach a score of 100%
for both the mandatory and the optional requirements, provided of course that
all information and the verification process can be viewed as credible. In reality
this is clearly not the case. The requirement list was developed to be used as a
base for testing COTS systems and is not suited to use in this type of
investigation, simply because it leaves to much room for interpretation
(especially for a sales person). If the reader is not familiar to the ESA RM
process, there will be confusion when analyzing the list of requirements. For
example, the developer claims the tool supports the recording of a risk
originator, something that is not visible in the screenshots and should be in the
“identification tab” (note: there is a provided field for origin in Epsilon but this
is equal to the requirement for risk source).
Epsilon was not included in the relative comparison because of the reason
described above. Based on the completed enquiry and the provided screenshots
Page 59
-BENCHMARK: ANALYSIS AND RESULTS-
51
a general idea about the tool can be formed. It uses a folder structure similar to
Gamma and it is aligned with a step-by-step process similar to the one
suggested by ECSS. The tool provides a variety of different reporting features
and one that is especially interesting is “Risk List”, which is similar to ESA’s
directors report.
7.6 COMPARISON OF RESULTS
In figure 7.1 the scores of the evaluated tools has been illustrated through a
block diagram. Alpha and Gamma scored almost equal for the mandatory
requirements with 80 % respectively 79 %. Delta was close behind with 74 %
and Beta scored the lowest with 67 %.
For the optional requirements Gamma scored the highest with 67 %, Alpha
second with 63 %, Beta and Delta 54 %. What is noticeable is that Gamma and
Beta are the only tools that are currently able to support the assessment at
agency level.
Fig 7.1 Scores of the evaluated tools
Page 60
-BENCHMARK: ANALYSIS AND RESULTS-
52
The big difference between the commercial available tools and Alpha is the
reporting features. If the reporting requirements are separated the results are:
Alpha: 86 %
Delta: 57 %
Gamma: 43 %
Beta: 29 %
A part from an evolution chart the ECSS is not specific enough to what
reporting formats that shall be used as standard. As reporting features has been
added to Alpha according to SRE’s demand it is not a huge surprise why the
tool is the most suited in this aspect. However, the commercial tools offer some
reporting features not included in the ECSS and Alpha that can still be
considered interesting. For example, several of the commercial applications
offer a feature to generate a report, which illustrates the planned risk magnitude
after action implementation through a schedule or a waterfall chart. This
provides management with an overview for the planned reduction measures for
each risk and what impact each action will have on the risk magnitude.
It is quite surprising to find two tools that are performing close to Alpha. Alpha
should, in my opinion, be superior to the other tools with the main reason being
that the system has been developed directly from the process at SRE. The
developers of the commercial tools never claimed that their software was
aligned with the ECSS, however the suggested RM process is probably a
common industry standard.
7.7 THE METHODOLOGY
Elaborating a good methodology has been a central and demanding part for this
study. There were a lot of important aspects to consider especially when
creating the framework for the benchmark. In order to provide ESA with proper
results the requirements needed to be representative for a RM system as it
should be: from a business process, ECSS process and an IT-system point of
view. At the same time the requirements cannot be too well defined, thus
leaving out good solutions just because they are different.
If you do not carry out the methodology properly or in the correct order, it is
easy to get lost and biased by impressions and individual views along the way.
Page 61
-BENCHMARK: ANALYSIS AND RESULTS-
53
Initiating the project with a study of the ECSS standard for RM and a case
study of SRE’s RM process provided a good view of how ESA wanted the
system to work, both in theory and in practice. In addition, the market survey
provided some general inputs in how a RM system could work.
It was of great importance not to test the existing solution that should be
benchmarked before the list of requirements was made. Thus, this could
influence the framework basing it on the existing solution instead of the
process.
The author’s opinion is that the developed methodology has provided ESA with
proper results and could be used in similar future studies. However, as the
requirements were assessed quantitatively a slightly different approach would
have provided even better results. The requirements were treated with an equal
weight with one exception; they were categorized as either mandatory or
optional. If time were not a restraint an assessment of the importance or
criticality of each requirement would have been more correct. This could have
been done through a survey where the potential users assess the importance
(e.g. on a scale from 1 to 5) from which the mean value decides the weight of
the single requirement.
Page 62
-CONSIDERATIONS AND RECOMMENDATIONS-
54
8 CONSIDERATIONS AND RECOMMENDATIONS
In this chapter, recommendations and considerations for how to proceed with
each tool will be presented.
8.1 Recommended approach for the commercial tools
If ESA would decide to further consider any of the tested commercial tools the
recommended approach is the following;
Gamma
As the tool scored almost equal to Alpha it should be further considered.
However, the following considerations need to be taken:
Test the application’s response time when installed on ESA’s
infrastructure. This will answer the question if the slow response time
was due to slow connection to the demo server or due to “bad
programming”.
Investigate the actual capabilities of the administrator tool in order to
fully understand the configuration possibilities, especially for the
reporting features. Describe, through design level requirements, for Risk
Decisions the needed reporting features, what information to be shown
and the framework (for example in MS Excel or Power point). It is also
important to find out if any of the configurations will cause any
implications to the functionality of the tool.
The structure and the amount of possible information to record have to
be “cleaned up” in order to emphasize what is actually important when
recording information.
Beta
As the tool scored the lowest, especially for the reporting requirements (not
configurable), the recommendation is to exclude the tool from further
investigations.
Delta
The tool should be further considered but it should be kept in mind that the
Page 63
-CONSIDERATIONS AND RECOMMENDATIONS-
55
current version does not add any major benefits compared to Alpha. Further,
the stability of the tool needs to be tested on ESA’s IT infrastructure.
Epsilon
The gathered material is stating that the tool is capable in supporting ESA’s RM
process, thus it should be further considered. However, it needs be tested
according to the list of requirements in order to find out the actual performance
of each specific requirement.
8.2 Recommended approach for Alpha
Because of Alpha being a solution customized and controlled by ESA,
recommendations in terms of improvement possibilities are presented.
If ESA decides to further develop Alpha, the following improvements could
increase (best case scenario) the score to 97 % for the mandatory and 71 % for
the optional requirements (the id of the requirement and the expected
improvement for the level of fulfillment is shown within brackets):
Structure (3.3 and 1.1: fair to good) - A recommendation is to
implement a hierarchy structure, especially if the application shall be
used agency-wide. This will provide the user with a logic structure and
good visibility of the risks and their associated project/organization.
Functionality could also be added making it possible to interact with the
folders and the associated risks (e.g. copy/paste risks to different
folders, creating folders/sub-folders etc.)
Layout (6.5.1: fair to good) - The layout of the screens should be
reconsidered and the structure of recording data. This include re-
organizing the fields, tabs, how to input specific data etc. When
structuring the screens it is important to emphasize the most critical
information to be recorded and base the structure on a step-by-step
format similar to the process suggested by ECSS.
Search engine (3.16 and 3.17: fair to good) - The search engine should
be able to include all risks the user has a permission to view when
performing a search (and not be limited to the active project and
revision).
Page 64
-CONSIDERATIONS AND RECOMMENDATIONS-
56
Lesson learned and closed projects (3.14: bad to good) - To provide a
“lesson learned” within the organization, the recommendation is to add
a feature that list all closed projects and their associated risks in a
structured environment (e.g. a folder structure with a search engine).
This should be a view-only feature available to all users (some
boundaries would have to be set to protect classified/sensitive
information).
Cause and Consequence fields (4.2.6: bad to good) - The standard
way of describing a risk scenario is through a cause and a consequence.
Thus, Alpha should have two fields where it is possible to input this
data.
Handling Strategy and Actions (4.2.7, 4.2.19 and 4.2.21: fair to
good; 4.2.15 and 4.2.17: bad to good) - Add a field to describe the
overall plan for handling the risk depending on chosen strategy. This is
more or less the idea for what “approach” is aimed to do. Thus, these
two should be bundled and positioned together with actions (the
requirements should also be bundled). Further, the available options
should be according to ESA’s RM plan (i.e. Transfer, Avoid, Mitigate
and Defer). Each action should have a data entry same as for the
assessment when recording the expected reduction and the possibility to
record start/end date and the progress status.
Reports (5.1 and 5.5: fair to good) - Improve the director’s report
making it possible to view the id of more than 3 risks in the heat map
and fix the feature for generating (editable) reports in Power Point.
Also, consider implementing a reporting feature that can describe the
mitigation plan (through e.g. a Gantt chart, Waterfall chart or similar).
Copy Risks (3.24: bad to good) - Add a feature making it possible to
copy risks between projects and organizations.
Change log (3.13: fair to good) - Currently you can see where and
when risk information was updated. It is also possible to click and see
the updated information, but in many cases you have to manually
browse through the screens on different dates in order to identify what
the actually changes were. The audit trail should describe what the
Page 65
-CONSIDERATIONS AND RECOMMENDATIONS-
57
actual changes were (compared to previous update) or provide an
environment where you can compare the information on previous
updates.
Support assessment at agency level (3.22: bad to good) - Implement a
feature that supports the assessment scale at agency level, making it
possible to choose the preferred method when setting up a
project/organization.
Closure of risks (3.7: fair to good) - It should always be mandatory to
update the conclusion field when closing a risk, thus a risk can be re-
opened. Currently this is not the case if something has already been
recorded in that field.
Deletion of risks (3.10: fair to good) - It is possible to completely
delete risks from the application, but this is currently in the hand of the
“super administrator” (i.e. administrator rights possessed by Alpha’s
developer). A more convenient solution would be to give this right to
the user administrating the project.
Each of the requirement has been treated with an equal weight, thus no
recommendation can be presented in terms of which improvement is the most
important. However, the methodology of weighing each requirement according
to importance/criticality was discussed in chapter one. Through carrying out a
survey among the users of the tool, this could provide ESA with an indication
for which improvements are the most important.
The following suggestions may not directly increase the score of Alpha, but
through this study the author has been convinced that these aspects should be
considered:
Reviews - The structure of creating “snapshot” reviews is contradicting
to a continues process. This practically limits the update of risk
information to a single date (which could last up to 6 months depending
on the projects RM strategy). The structure also more or less limits the
information to only be updated centrally. Re-assessment between review
dates will not be considered or recognized by the reporting features,
leading to incorrect information in reports such as e.g. the evolution
Page 66
-CONSIDERATIONS AND RECOMMENDATIONS-
58
chart. It also causes problems due to the system categorizing risks into
review dates (instead of for example risk status), which is problematic
when searching for risks and when listing all associated project risks
(the system only list risks in the current revision). My recommendation
is to delete this feature, improve the audit trail and add one control point
meaning; risk information that has been updated (by someone else than
the Risk Coordinator/Project Manager) shall be approved by the Risk
Coordinator or Project Manager before being fully implemented in the
system. According to the author’s perception based on the evaluation,
this is a much more convenient solution.
Risk Status - For JWST the status of the risks are updated after every
review. Currently this information along with the review date is updated
manually through adding information about the new status in a “free
text field”. I recommend that this feature is changed and made similar to
the “response” feature in the “update action” layout. Thus, this feature
automatically records the time of update, separates and lists the
implemented changes.
Step-by-step guide - Implement a step-by-step guide when setting up
project properties and consider a feature making it possible to choose a
3x3 matrix for specific organizations (if the application shall be used at
agency level).
Level of Impact - The same risk impacting two different levels (e.g.
project and directorate) cannot be given similar attributes due to
different objectives, making the possibility to record “level of impact”
unnecessary. E.g. a 5B Project risk might be a 3B Directorate risk.
Risk categorization - Categorize risks into Pending (not yet approved),
Active (Project/Organization Risk), Closed/Accepted and Rejected
(Pending risks that were not approved) risks.
Page 67
-CONCLUSION AND REFLECTIONS-
59
9 CONCLUSION AND REFLECTIONS
This chapter will present the conclusions drawn by the author. It will also
present some of the author’s reflections on the project.
9.1 Conclusion
The conclusions that can be drawn from the benchmark are the following:
Alpha is performing well and the tool is superior, compared to the
evaluated commercial tools, in terms of reporting requirements.
Two tools, Gamma and Delta, are able to compete with Alpha in terms
of overall performance. Gamma scored almost equally with Alpha and if
the tool supports the claimed configuration possibilities it could achieve
a perceivable increase in score. This basically means that if ESA would
change strategy and implement a commercial tool instead, the agency
would not have to sacrifice anything in terms of relative performance
(there would of course be gains/sacrifices for specific requirements).
Beta is currently not able to compete in terms of performance with the
other tools.
The approach of sending the requirement list as an enquiry to Epsilon’s
developer did not provide sufficient information to include the system in
the benchmark. However, the impression is that the tool may be capable
in supporting ESA’s RM process.
Alpha scored 80 % for the mandatory requirements, which means that
there is a possibility to improve the system. In chapter six suggestions of
further development of the tool has been presented which could increase
Alpha’s score to 97 %.
While Alfa definitely is a good candidate for continuing supporting the ESA
RM process, especially if the suggestions for further developing the tool are
taken into consideration, the author’s opinion is that the agency should further
investigate the possibility of implementing a new RM system. A recommended
Page 68
-CONCLUSION AND REFLECTIONS-
60
approach is to extend the investigation described in this report by including
additional parameters (e.g. one of them also being financial) with the objective
to improve the current process and find a suitable vendor competent in both the
IT and RM fields. In this investigation a third party consultant could be
included with experience in the area of IT but most importantly also in the RM
field. Such project could be beneficiary for ESA both from an IT and from a
RM point of view.
The author’s opinion is that the developed methodology used in this study has
provided ESA with proper results and could be used in similar future studies.
However, as the requirements were assessed quantitatively an assessment of the
importance or criticality of each requirement would have provided even better
results.
9.2 General Reflections
The following part does not derive from the conducted research in this project,
instead it is merely some reflections the author got during the project’s
duration. It is mainly concerning the RM process and the RM system as they
had been implemented at ESA.
First of all, there are some minor discrepancies between the current
implemented RM system (Alpha) and the RM process. Why this is, would need
a new investigation but Chuang M-L & Shaw W. H present some important
critical success factors when implementing an ERP-system in their article “An
empirical study of enterprise resource management systems implementation
From ERP to RFID”. They stress for example the importance of the vendor
having sufficient business process knowledge and the customer having
sufficient system process knowledge. This stresses even more the need to have
a vendor that is not only familiar with software development but that also fully
understands the RM process.
The main concern is however not the discrepancies between the process and the
system, it is the one between the ECSS standard and the RM process carried out
at ESA. In the author’s opinion this is partially because of the standard not
communicating sufficient and clearer guidelines and partially because ESA is
still consolidating its implementation across the Agency. However it has to be
understood that the ECSS are more tailored to an industrial environment and
some specific elements may not be fully applicable to internal processes of
Page 69
-CONCLUSION AND REFLECTIONS-
61
organisations like ESA. The first problem is seen in for example the
identification step where the ECSS is suggesting that the overall project risk
shall be determined, but the standard is not explaining how this should be done.
Determining the overall project risk is not currently done formally at ESA. As
the assessment is done the determination of an overall project risk would
basically be impossible. The provided metrics for the probability and
consequence cannot somehow be added into an overall project risk or be used
to compare risks between projects. This is important to understand otherwise it
could lead to misleading information. Determining the total risk of a project
could be done with the Monte Carlo approach but this approach demands that
the assessment is much more accurate and consistent.
The assessment of risks brings us to the next part, which is a central part in the
RM process but at the same time a bit vague at ESA. Severity of consequence
and the likelihood of occurrence is the base from which decisions are taken.
Thus, there should be ONE standard policy for how to assess risks in the
agency. This should not be done differently between projects, which is
sometimes the case right now. Further, the agency is currently using different
scoring schemes (3x3 instead of 5x5) at agency level, which further increase the
confusion in the author’s opinion.
The only way to implement a standard, consistent and accurate measuring
method is through starting with assessing the probability and the consequence
in a quantitative manner, i.e. in terms of hard numbers which leaves no room
for interpretation. As seen in several different RM plans at ESA the qualitative
assessment was not consistent. This means that: not only is the assessment
based on people with often very different, subjective perception there is also a
different perception of the actual scoring schemes. E.g. if a risk’s probability is
assessed as “likely” the perception will be different for how often something
that is “likely” to occur actually occurs. To further explain the problem imagine
for example if someone would want to make a purchase for a component where
the weight is central. The buyer would not settle with an offer where the weight
is specified as “heavy” or just a number, thus this could mean almost anything.
Instead the buyer would ask the supplier to specify the weight in terms of a
number and a unit e.g. 3 kg or 3 lb. This would provide sufficient, objective
information to base a decision upon.
Page 70
-CONCLUSION AND REFLECTIONS-
62
This problem will almost certainly lead to misleading information. Information
that is the foundation from which important decisions are taken. As mentioned
earlier in the report ESA has a reporting chain in order to mitigate the problem.
The assessment of risks along with the risk information is discussed and
consolidated before reported to upper level management. However, this is not
enough if RM shall be fully implemented throughout the organization. Risks
cannot be fully understood and explained at each step throughout the reporting
chain because it leads to an inefficient process and also takes away some of the
purpose when assessing the risks. If the top manager is provided with two risks
both with the same magnitude it should be accurate for him/her to assume that
they are equally critical and important. Thus, the risks should be assessed in
terms of unambiguous numbers e.g. probability in percent and impact in euros.
This does not consequently mean that you have to be fully accurate, which
would be impossible for risks at project level, the important thing is that the
metric is unambiguous.
In addition to the risk assessment there are additional things that the author
believes can be improved with the RM process. Right now there are no accurate
measurements at ESA that could answer the question if and by how much the
RM process is improving the business. The author suggests that ESA starts a
project in order to more clearly define the RM process (through a much more
detailed RM policy), to investigate alternatives for the assessment of risks and
to find additional reliable KPI’s. Thus, with the purpose of making information
consistent, more accurate and to put numbers on the benefits provided by RM.
In general it is hard to believe that the implementation of a new IT-system
would be defendable from a ROI-perspective when considering the associated
risks and costs for such project. Especially if a new system would only replace
one with similar functionality and not be implemented with the purpose to
improve the business process itself. A new IT-system could of course provide
long term cost benefits and the ROI has to be calculated in order to draw any
conclusions.
Page 71
-REFERENCES-
63
10 REFERENCES
10.1 Literature
Ayyub B.M, 2003, Risk Analysis in Engineering and Economics, Chapman &
Hall/CRC
Holme I.M, Solvang B.K, 1997, Forskningsmetodik, Studentlitteratur
Lauesen S, 2002, Software Requirements Styles and Techniques, Pearson
Education Limited
Wilson R.N, 1999, Reflecting Telescope Optics II, Springer
10.2 Articles
Chuang M-L & Shaw W. H, An empirical study of enterprise resource
management systems implementation From ERP to RFID, Business Process
Management Journal,
Vol. 14 No. 5, 2008
H. Frank Cervone, Project risk management, OCLC Systems & Services, Vol.
22 No. 4, 2006
10.3 Internet references
http://www.esa.int/
http://www.ecss.nl/, ECSS – A Single Set of European Space Standards, 2009-
06-16
http://www.cnn.com/TECH/space/9909/30/mars.metric.02/, Metric mishap
caused loss of NASA orbiter, 2009-06-19
http://www.wired.com/science/discoveries/news/2004/02/62242, Hubble Space
Telescope: 1990-2007, 2009-07-15
Page 72
-REFERENCES-
64
10.4 Other references
Collins English Dictionary & Thesaurus, HarperCollins Publishers, June 2006
ESA Risk Management Policy, 2007-05-16
Convention for the establishment of a European Space Agency & ESA Council
– Rules of procedure, March 2003
Directorate of Science and Robotic Exploration (Admin), 2009-04-23
Page 73
-APPENDIX-
I
APPENDIX I: SCORING SCHEMES
Page 74
-APPENDIX-
II
APPENDIX II: RISK INDEX SCHEME
Page 75
-APPENDIX-
III
APPENDIX III: RISK REGISTER
Page 76
-APPENDIX-
IV
APPENDIX IV: RISK TREND CHART
Page 77
-APPENDIX-
V
APPENDIX V: INVESTIGATED TOOLS
Tool Name Comment
Zeta Solution integrated in MS
project/Excel
Eta Integrated in MS Excel, Simulation
& Optimization tool
Theta Low credibility
Iota Low credibility. Not meeting
enough of the reporting requirements.
Kappa Security issue due to external
database
Lambda1 Secondary option
Mu Not enough relevant functionalities
Nu2 Secondary option
Xi Focused towards health, safety
environmental risks
Omicron Not suitable for ESA RM process
and reporting requirements
Pi1 Secondary option
Rho
Not aligned with the reporting formats suggested by ECSS.
Integrated with PM planning and scheduling software
Sigma Low credibility. Focused towards the finance and insurance sector.
Tau Reporting and graphical formats
not aligned with ECSS
Upsilon Risk assessment techniques focused
on the process industry
Page 78
-APPENDIX-
VI
Phi Server and Database hosted by
supplier in Atlanta
Chi Audit software where risk
management is a small part of the solution.
Psi
Integrated solution with RM, internal control, internal audit,
governance and IT security management
Omega Powerful but complex tool.
Standalone application. (Multiuser edition scheduled for Q4 2009)
1 Not meeting the reporting
requirements. Built around a discussion board and voting system.
2 Provided screenshots indicates that
the tool does not meet the data requirements. First version.
3 Not meeting the reporting
requirements. More focused towards quantitative assessment.
41 Secondary option
51 Secondary option
1 These tools did not have any major flaws; however they were missing minor features that were
included in the “selected tools”. Further, some of the tools were also less credible and
performed functionalities in a less appropriate way compared to the “selected tools”.
“Secondary option” means that if ESA any time in the future would decide to replace the
existing tool with a COTS solution, these could be included in the investigation.
2
It is questionable whether or not the developer to Nu is offering COTS solutions. On one hand
they are offering solutions with already existing functionalities but still, on the other hand, you
would in most cases need a Nu consultant to implement and tailor the tool according to the
customer’s need. When the aim is to find a COTS tool, which supports one specific defined
process, the author’s personal opinion is to be a bit hesitant when it comes to companies that are
focused on supplying systems supporting almost every business process. Basically because their
core competence seldom lies within a specific module (e.g. one supporting RM). On strategic
level it is of course viewed as beneficiary to find a standard system for the whole organization
supporting all its processes, but the specific module has to be investigated on the same terms as
all the other commercial solutions. These reasons can not in any way exclude Nu, thus the RM
solution might be suitable for SRE’s RM process. The tool does not have any major flaws,
Page 79
-APPENDIX-
VII
however it fails to meet some of the data requirements (originator, source etc.) and the “risk
response” feature is not appropriate for SRE.
The tools selected for the benchmarking are presented in the table below:
Tool Name
Alpha1
Beta
Gamma
Delta
Epsilon2
1 Alpha is the tool already implemented to support ESA’s RM process.
2 Epsilon’s developer were unable to provide a demo version. Instead of evaluating the tool, the
list of requirements was sent as an “enquiry” to the developer.
Page 80
-APPENDIX-
VIII
APPENDIX VI: SOFTWARE REQUIREMENTS LIST
ID Requirement Additional info and
verification Mandatory/
Optional
1 General Requirements Specifies the overall requirements of the system.
1,1 The RM tool shall support a "multiproject/multiorganization" environment
Good > 100 M
1,2 The RM tool shall support a "multiuser" environment
Good > 2000 M
1,3 The RM tool shall support a "multirisk" environment
Good > 5000 M
1,4
Users shall be assigned permissions, access, functionalities according to their role
See note 1 M
1,5 The RM tool shall be "administered" by the customer
M
1,6 It shall be possible to customize the RM tool
This requirement refers to the possibilities to customize the tool in order to fit it to SRE’s RM process, e.g. the terminology, layout, reports etc. Consideration will mainly be taken to the configuration possibilities made by the customer.
O
1,7 The RM tool shall have a clear pricing
The usual associated costs when implementing the system. Is there a clear pricing strategy (per user, per consulting hour etc.)?
M
2 Technical Requirements
2,1
The supplier shall be able to provide ESA with documentation regarding the technical requirements
To ensure no software or hardware constraints in a potential implementation.
M
Page 81
-APPENDIX-
IX
2,2 The RM tool shall Interface to external tools
Even if the tool is providing the required reporting and data output formats it will be considered as a strength if the tool can export/import the information to other data handling software. Thus, the tool is unlikely to provide the same capabilities for editing and handling data as for example MS Excel or MS Word.
O
2,3 The RM tools shall support a centralized backend database, located at customer's premises
This requirement was partially identified due to some of the suppliers were only capable in offering a ‘hosted’ solution (i.e. actual software located at the supplier’s premises), which causes security complications as valuable and classified information will be stored and handled by the tool.
M
2,4 The RM tool shall be under configuration/version control
If the supplier are releasing any updates, this should not in any way ‘reset’ the system or impose a new process to its users.
M
2,5
The RM tool shall be able to operate "standalone" or together with software already existing at ESA
ESA should not be forced to acquire any (new) 3rd party software. If so, this cost must also be presented by the supplier.
M
2,6 The RM tool shall support a back up feature
In order to mitigate the risk of loosing valuable information
M
3 Functional Requirements
3,1 The RM tool shall be able to create new risks
M
3,2 The RM tool shall be able to create new projects
M
3,3 The RM tool shall be able to create new organizations
M
3,4 The RM tool shall be able to create proposed risks to be sent for approval
Risk to be sent for approval shall have the same data requirements as risks
O
Page 82
-APPENDIX-
X
3,5
The RM tool shall send an e-mail notification for approval when inserted as proposed into the system
It shall be possible to disable this feature. If risk information is implemented centrally in the system by the project/organization group this feature is unnecessary
O
3,6 The RM tool shall send an e-mail notification to the assigned risk owner
Same as 3.5 O
3,7 The RM tool shall allow the closure of a risk with related justification (free text field)
The closure (in contrast to the acceptance) of a risk refers to a risk that can not materialize (e.g. elapsed time horizon
M
3,8
The RM shall allow modifications of existing data in the current revision/scenario by all users with the necessary access rights
M
3,9 The RM tool shall allow re-opening of a Closed Risk.
M
3,10 The RM tool shall allow the Deletion of an existing risk
By authorized user M
3,11 The RM tool shall allow "Copy and Paste" from documents into fields.
M
3,12 The RM tool shall allow "risk attachments"/ files (especially for actions)
O
3,13 The RM tool shall support an Audit Trail record (change log)
M
3,14
The RM tool shall store closed projects and risks in a structured way, with a search engine accessible by all users
With the purpose to communicate previous risks and provide a "lesson learned" (viewing only)
M
3,15 The RM tool shall support required and optional fields when recording information
M
3,16 The RM tool shall support searches within the database
M
3,17 The RM tool shall list all risks that match specific search values.
M
3,18 The RM tool shall have a "My Risks" view
I.e. risks for which the User is either Risk Originator, Risk Owner and/or Actionee
O
3,19 The RM tool shall support progressive "revisions/scenarios" of the same project
Revisions of a risk shall not overwrite data associated with a risk in a previous revision. This to be able to perform a
M
Page 83
-APPENDIX-
XI
comparative analysis over a period of time.
3,20 The assessment of previous revisions/scenarios shall not be editable.
M
3,21 The RM tool shall support a 5x5 risk matrix
M
3,22 The RM tool shall support a customized risk matrix per each project (e.g 3x3)
This requirement originates from the RM framework at agency level.
O
3,23 The RM tool shall allow for local replicas on laptops/computers
O
3,24 The RM tool shall have the ability to clone/copy risks
To another Project or Organization
M
4 Data Requirements
Data to be stored (recorded and retrieved) associated with specific items. Any data restraints shall be informed by the supplier. See Note 2.
4,1 Project & Organization Data to be stored for specific Projects & Organizations
4.1.1 The RM tool shall record for each project the title
Text (Good) M
4.1.2 The RM tool shall record for each organization the title
Text (Good) M
4.1.3
The RM tool shall record for each project/organization the established project/organization strategy for dealing with the risks
In accordance with the related Project Risk Management Plan. Table (Good), Text (Fair)
O
4.1.4
The RM tool shall record for each project/organization the established project scoring scheme for the severity of consequence and likelihood of occurrence
In accordance with the related Project Risk Management Plan. Table (Good), Text (Fair)
O
4,2 Risks Data to be stored for specific risk items
4.2.1 The RM tool shall record per each risk the name of the organization
e.g. ESA Directorate. Automatic recording (Good)
M
Page 84
-APPENDIX-
XII
4.2.2 The RM tool shall record per each risk the name of the project
Automatic recording (Good) M
4.2.3 The RM tool shall record per each risk the risk title
Text (Good) M
4.2.4 The RM tool shall record per each risk the name of the Risk Owner
Predefined dropdown list (Good), Text (Fair)
M
4.2.5 The RM tool shall record per each risk the source of the risk
e.g. Payload, spacecraft, launcher, operations, etc. Predefined dropdown list (Good), Text (Fair)
M
4.2.6 The RM tool shall have a field to describe the nature of the risk and the potential consequences
Text (Good) M
4.2.7 The RM tool shall record per each risk the selected approach with some description
Possible letters summarizing the approach: T (Transfer), A (Avoid), M (Mitigate), D (Defer) + "Unlimited" text field. Predefined dropdown list + text (Good), Dropdown list or text (Fair)
M
4.2.8 The RM tool shall record per each risk the potential domain(s) of impact of the subject risk
e.g. cost, schedule, performances (science, technical). : Predefined dropdown list (Good), Text (Fair)
M
4.2.9 The RM tool shall record the time frame for the risk (risk horizon)
Pop up schedule, predefined dropdown list etc. (Good), text (Fair)
M
4.2.10 The RM tool shall record per each risk the name of the Risk Originator
Predefined dropdown list (Good), Text (Fair)
M
4.2.11 The RM tool shall record per each risk the severity of consequence of the risk
Qualitatively from predefined dropdown list/ risk matrix: scale 1-5, 1-3 (Good), entering digit/quantitatively/text (Fair)
M
4.2.12 The RM tool shall record per each risk the likelihood of occurrence of the risk
Qualitatively from predefined dropdown list/ risk matrix: scale 1-5, 1-3 (Good), entering digit/quantitatively/text (Fair)
M
4.2.13 The RM tool shall record per each risk the corresponding risk index
Automatic recording (Good), Text (Fair)
M
4.2.14 The RM tool shall record per each risk the corresponding risk magnitude
e.g. very high (Red), high (red), medium (yellow), medium (yellow), low (yellow), very low (green). Automatic recording in risk matrix (Good), Other recording/ Text (Fair)
M
Page 85
-APPENDIX-
XIII
4.2.15 The RM tool shall record per each risk the eventual risk reduction measures
Text (Good) M
4.2.16
The RM tool shall record per each risk the verification means of the risk reduction measures (Reduction Indicators)
Shall not be a required field. Text (Good)
M
4.2.17 The RM tool shall record per each risk the expected risk reductions of the risk reduction measures
i.e. severity, likelihood, risk index. Shall not be a required field. Qualitatively from predefined dropdown list/ risk matrix: scale 1-5, 1-3 (Good), entering digit/quantitatively/text (Fair)
M
4.2.18 The RM tool shall list per each risk the actions related to the risk
The feature can be used for action also related to the assessment, approach, monitoring, etc. and not only for mitigation. Text (Good)
M
4.2.19 The RM tool shall record the time frame for the actions to be taken
Predefined dropdown list/from pop up schedule (Good), Manual input text/number (Fair)
M
4.2.20 The RM tool shall list per each action the name of the actionee
Predefined dropdown list (Good), Text (Fair)
M
4.2.21 The RM tool shall record the status of the actions related to the risk
Text (Good) M
4.2.22 The RM tool shall record the name/role that shall agree/accept the proposed risk disposition
Predefined dropdown list (Good), Text (Fair)
M
4.2.23 The RM tool shall have a field to describe the progress status/evolution of the risk
The status of the previous revisions shall be carried forward in the new revision (unlimited text field). Text (Good)
M
4.2.24 The RM tool shall be able to record a risk as accepted
Check box (Good), Dropdown list or similar (Fair)
M
5 Reporting requirements
5,1 All reports shall be in (or exportable to) Html, pdf, MS Excel, MS, Word, MS Powerpoint.
M
5,2 The RM tool shall be able to generate reports using filters
Filter risks, filter per domain of impact, for risk index, etc
M
Page 86
-APPENDIX-
XIV
5,3 The RM tool shall generate a risk register (with the filtered risks) for the selected project
M
5,4
The RM tool shall generate the distribution report/risk table (with the filtered risks) for the selected project
M
5,5
The RM tool shall generate the risk matrix/heat map (with the filtered risks) for the selected project/organization
M
5,6
The RM tool shall generate a trend chart/evolution report (with the filtered risks) for the selected project
M
5,7
The RM tool shall generate a comparative report (with the filtered risks) for the selected project between current and previous revisions
M
6 Quality requirements
6,1
The RM tool shall have a comprehensive list of previous/current users in an ESA comparable environment/domain
Previous customers etc. M
6,2 The RM tool shall be a stable system
Verified through no experienced crashes during testing
M
6,3 Performance
6.3.1 The RM tool shall have a reasonable response time
When creating reports, implementing risks, calculating risk magnitude, performing searches etc. "Peak in traffic"
M
6,4 Maintenance and support requirements
6.4.1 The help desk shall be easily accessible
Both phone and e-mail M
6.4.2 The RM tool shall provide on line training possibilities and demo example
O
Page 87
-APPENDIX-
XV
6.4.3 The RM tool shall provide on line help and user/administrator tutorial/help guide
M
6.4.4 The supplier shall have a clear maintenance policy
M
6,5 Usability
6.5.1 The RM tool shall be user friendly and easily deployable to non expert users
Verified through 3 peoples opinions/ first time users
M
Note 1: User access and permissions (explanation of requirement 1.2 and
1.3)
Below follows a suggestion of the user structure, consisting of two users and
one administrator.
General user
Create, Edit, Update, Delete Risk Proposals (Risk that has not yet been
approved as a Project/Programme Risk), Overview closed Risk items
and Read Risk information.
The Edit, Update and Deletion refers only to the Risk Proposed by the
user, which means that the user can not Edit, Update or Delete any
Risks that have been proposed by another user.
If a General User is assigned to a Risk as a Risk Owner the person will
be able to Edit and Update the assigned Risk (the changes are stored in
the audit trail/ change log). All the user permissions will still apply.
Project/Organisation Risk Manager
Has the permission to do all of the above. In addition, edit project
information, approve risks, edit all risks, create reports etc.
Note: All permissions, except the Overview of closed risks, are
connected to a specific Project/Organisation. For example, a user
connected to Project1 have no permission to Create, Edit, Update,
Page 88
-APPENDIX-
XVI
Delete or Read Risk information connected to Project2. However, a user
can be connected to multiple Projects/Organisations.
System Administrator
All above with the addition to; configure the system (terminology etc.),
create, edit and delete users, assign permissions, create
project/programme classes.
Note 2: Class relations
The Project/Organisation class can have none, one or many associated Risk
items and the Risk can impact one Project/ Organisation class as illustrated in
the figure below.
N.B. In practise risks can affect several Projects/Organisations. E.g. a project
risk might be of such magnitude that it could affect the whole organisation’s
objectives or several projects might be reliant on the same source. However, the
same risk will be input twice in the system if also affecting a different class,
thus some attributes might change when a risk is escalated from project to
organisation level. Further, from project to project the perception of the same
risk might be different and the assessment will most certainly change due to
different project objectives and restraints.
Page 89
-APPENDIX-
XVII
APPENDIX VII: ABBREVIATIONS
COTS Commercial Of The Shelf
ECSS European Cooperation for Space Standardisation
ELDO European Launch Development Organisation
ESA European Space Agency
ESRO European Space Research Organisation
ESTEC European Space Technology and Research Center
ISS International Space Station
JWST James Webb Space Telescope
NASA National Aeronautics and Space Administration
RKA Russian Federal Space Agency
ROI Return On Investment
RM Risk Management
SRE Science and Robotic Exploration (ESA directorate)


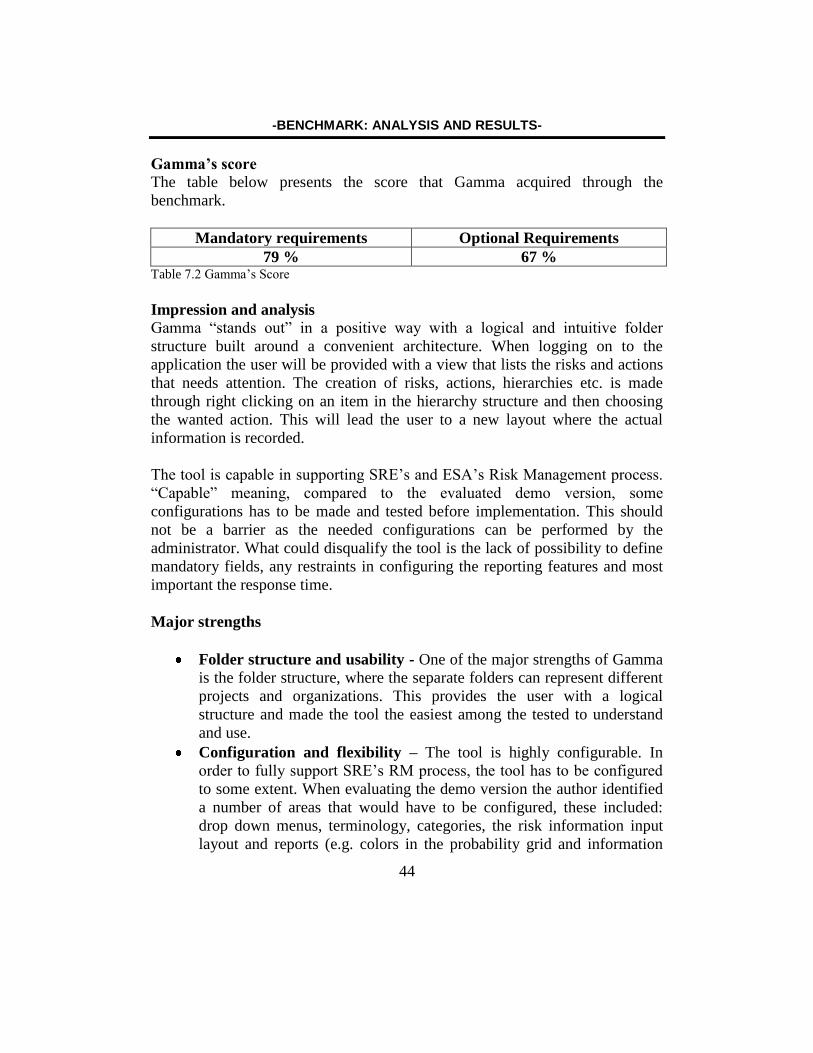


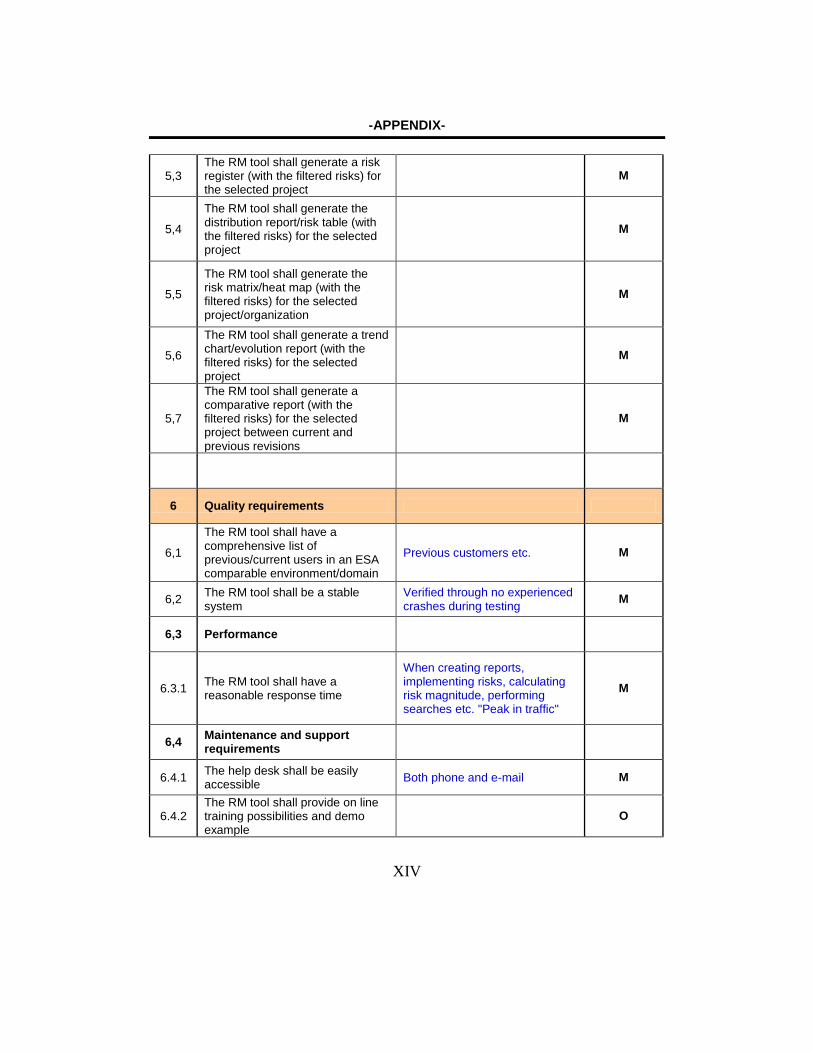


![0!123!,4--! 5674+'()!56!'/55+124--4)! - lup.lub.lu.selup.lub.lu.se/student-papers/record/2541581/file/2541585.pdf · 4uv2:!]-](https://static.documents.pub/doc/80x56/5b9cf67609d3f2de128b5013/01234-56745655124-4-luplubluseluplublusestudent-papersrecord2541581file.jpg)


