referred orientation and elastic anisotropy in shales
van Lonardelli1, Hans-Rudolf Wenk1, and Y. Ren2
detafm
titaOqctf
mvtdiptvca�t
pdotvc
ved Sepkeley, Cis. E-ma
ABSTRACT
Anisotropy in shales is becoming an important issue in ex-ploration and reservoir geophysics. In this study, the crystal-lographic preferred orientation of clay platelets that contrib-utes to elastic anisotropy was determined quantitatively byhard monochromatic X-ray synchrotron diffraction in twodifferent shales from drillholes off the coast of Nigeria. Toanalyze complicated diffraction images with five differentphases �illite/smectite, kaolinite, quartz, siderite, feldspar�and many overlapping peaks, we applied a methodologybased on the crystallographic Rietveld method. The goal wasto describe the intrinsic physical properties of the sample�phase composition, crystallographic preferred orientation,crystal structure, and microstructure� and compute macro-scopic elastic properties by averaging single crystal proper-ties over the orientation distribution for each phase. Ourresults show that elastic anisotropy resulting from crystallo-graphic preferred orientation of the clay particles can bedetermined quantitatively. This provides a possible way tocompare measured seismic anisotropy and texture-derivedanisotropy and to estimate the contribution of the low-aspectratio pores aligned with bedding.
INTRODUCTION
The elastic properties of shales are crucial for understanding seis-ic field measurements in sedimentary basins. The anisotropy of
lasticity mainly depends on preferred orientations of rock-forminginerals, single crystal properties, the fracture and pore distribution,
nd pressure-temperature conditions �Hornby et al., 1994; Sayers,994, 2005�. Preferred orientation or texture is caused by slow sedi-entation of plate-shaped clay minerals that favors orientation of
latelets parallel to the sediment surface. This pattern is modified
Manuscript received by the Editor June 13, 2006; revised manuscript recei1University of California, Department of Earth and Planetary Science, Ber2Argonne National Laboratory, Advanced Photon Source, Argonne, Illino2007 Society of Exploration Geophysicists. All rights reserved.
D33
uring compaction and diagenesis �Swan et al., 1989; Schoenbergt al., 1996�. A quantitative understanding of the texture, and thushe intrinsic contribution of single crystals and their orientation tonisotropy, may help us to better evaluate the effects of the orientedracture and pore fabric and porosity by comparing calculated andeasured elastic properties.Clay minerals are fine grained and poorly crystalline. Conven-
ional analysis with X-ray pole figure goniometry gives only limitednformation. An X-ray transmission technique has been developedo study the orientation distribution of basal planes of sheet silicatesnd has been successfully applied to slates �e.g., Kaarsberg, 1959;ertel, 1983; Sintubin, 1994b; Ho et al., 1999�. However, so far, nouantitative 3D crystal orientation distributions �ODs� exist for anylay minerals in shales. Knowledge of the OD is necessary to modelhe polycrystalline elastic properties in a rigorous and quantitativeashion.
Hard X-rays produced at synchrotron sources provide a newethod to investigate weakly scattering materials. Advantages are a
ery intense and highly focused X-ray beam and short wavelengthhat permit high sample penetration without major absorption. Two-imensional detectors, either charge-coupled device cameras ormage plates, are used to record diffraction images. Shales areolyphase materials with many overlapping reflections. Both quan-itative phase and texture analyses are necessary to determine theolume fractions and the ODs for each mineral, respectively. The re-ently developed Rietveld method with texture capabilities has beenpplied to illite �Wenk et al., 2007� and biomineralized materialsLonardelli et al., 2005� and has emerged as a powerful tool to ex-ract reliable texture information.
Our aim was to investigate texture in two shales with differentorosity by hard X-ray synchrotron diffraction measurements and toetermine 3D ODs with the Rietveld method. From the OD, webtained the polycrystalline elastic tensor by averaging single-crys-al elastic properties. From those compressional and shear-waveelocities and their texture-related component, anisotropy can bealculated.
Two different well-preserved wet shales from a drillhole off theigerian coast were provided by Chevron. The first one from a high-
r level is a soft shale with low density �� = 2.21 g/cm3� and highorosity �26%�. The second, from a lower level, is a hard shale, moreompacted and lithified, with a higher density �� = 2.51 g/cm3� andower porosity �6%�. The exact location of these shales is Chevronroprietary information. The microstructure for both �Figure 1� re-eals a matrix composed of clay minerals and relatively large inclu-
100 µm 100 µm
a) b)
igure 1. Microstructures for �a� hard shale and �b� soft shale. Hardhale is characterized by large grains of silt. SEM micrographs, sec-ndary electron image.
Monochromatic beam
Reflected line from {hkl}
planes
ω
ϑ ϑ
{hkl} planes
yx
zSample
n
Beam stop
Detector
2
igure 2. Schematic sketch illustrating a X-ray diffraction experi-ent in transmission geometry. The sample is rotated around the
-axis �x, y, z define the sample reference system� to improve polegure coverage. The diffraction pattern is recorded with a 2Detector.
Hard shale
I/S (200)
I/S (110)
K (001)
I/S (200)
I/S (110)
K (001)
) b) c) Soft shale
ions caused by the presence of approximately 15%–20% of silt,articularly in the hard shale.
Slabs of 20�10�1 mm were cut from core plugs with the longimension more or less parallel to the bedding plane as well as coulde determined macroscopically. It was later determined that, in thease of hard shale, the core plug axis was about 20° off the beddinglane. The samples were then mounted on an aluminum holder fortability.
These samples were analyzed on beamline BESSRC 11-ID-C athe Advanced Photon Source �APS� at Argonne National Laborato-y on a high-energy beam line with a monochromatic wavelength of.107863 Å. Beam size was 1 mm, and sample-to-detector distanceas approximately 2 m. The samples were mounted on the metal
od parallel to the vertical axis �y in Figure 2� on a goniometer. Imag-s were recorded using a Mar345 image plate detector �3450�3450ixels� at seven different omega tilt angles, rotating the samplesround the axis perpendicular to the beam �y� in 10° increments. Im-ges collected at � = 30° for both soft and hard shales, with the com-lete coverage used in the analysis, are shown in Figure 3. The inten-ity variations along the Debye rings immediately reveal the pres-nce of texture. After data collection, images were converted inIT2D �Hammersley, 1998� to 16-bit tagged image file formatTIFF� and exported for further processing. A lanthanum hexaborideowder standard was used to calibrate the sample to detector dis-ance and refine instrumental parameters.
The TIFF images were entered into the material analysis usingiffraction �MAUD� program, a Rietveld code written in Java �Lut-erotti et al., 1997�. An image manager provides the possibility to in-eractively set the correct parameters �e.g., sample/detector distance,anges for integration, center coordinates, number of spectra� to ob-ain integrated spectra. In this study, the integration was performedver 10° sectors, providing for both samples 36 spectra for each 2Dmage. Seven images, rotating the sample around � in 10° incre-ents from −30° to +30°, provided 7�36 = 252 spectra that were
sed simultaneously in the Rietveld refinement. The d-range usedor the analysis was from 1 to 12 Å.
First, instrumental parameters such as the center of the ring, theackground parameters �three for each spectrum�, and the scale pa-ameters �one for each image� were refined. The scale parametersake into account different absorption and volumes with tilt �Heidel-ach et al., 1999�. The second step was to extract the correct volume-ractions for each phase �quantitative phase analysis� and structural-icrostructural information concerning lattice parameters and an-
0º
40º
20º
0º
Coverage
x
Figure 3. Diffraction images recorded with animage plate detector. Intensity variations alongDebye rings are indicative of texture. �a� Hardshale, �b� soft shale, and �c� pole figures cover-age provided by seven images at different rota-tion angles �. The reference system for the ex-periment in transmission geometry is x, y, and z.�Figure 2�. An equal area projection.
80º 6
y
z
iiWufm
h
pbIgfuso
Tg
S
H
S
FDm
º
º
º
º
º
a
FtHl
Preferred orientation in shales D35
sotropic crystallite size �Popa, 1998�. The refined values are shown-n Table 1. In a last step, a modified EWIMV algorithm related to
IMV �Matthies and Vinel, 1982� and implemented in MAUD wassed for texture analysis. This algorithm allows us to calculate ODsor irregular and incomplete pole figure coverage. No sample sym-etry was imposed.An example of one selected spectrum from each sample �soft and
ard shale� is shown in Figure 4. Notice the extremely complicated
able 1. Density, porosity, anisotropic crystallite size, and quenerated during Rietveld refinement (standard deviation) is
Crystallite siz
ampleDensity�g/cm3�
Porosity�%� �100� �010�
ard shale 2.51 6 I/S 15.1�7� 16.5�8�
Ka 22.4�8� 20.1�9�
oft shale 2.21 26 I/S 26.4�8� 18.5�12
Ka 16.3�9� 20.1�8�
35
30
25
20
1.0 2.0 3.0 4.0 5.0
2-Theta (º)
1.0 2.0 3.0 4.0 5.0
2-Theta (º)
Inte
nsity
(co
unt1/
2 )
Soft shale
Hard shale
I/S (200)
I/S (110)
K (001)
I/S (200)
I/S (110)
K (001)
I/SKsparSidKaolQuartz
I/SKsparSidKaolQuartz
a)
30
25
20
Inte
nsity
(co
unt1/
2 )
b)
igure 4. Example of spectra from �a� hard shale and �b� soft shale.ots are experimental data, and the solid line is the Rietveld refine-ent fit.
t
rofile with numerous overlapping peaks and the good agreementetween experimental data �dots� and the recalculated fit �solid line�.n the 2D multiplot that stacks all spectra and displays intensities inray shades �Figure 5�, some reflections are indexed. Here, the dif-erence in texture between the two shales is clearly visible. In partic-lar and contrary to hard shale, the kaolinite �001� diffraction peak inoft shale shows no significant variation in relative intensity becausef its very weak texture.
ive phase information (in weight percent). The errorin parentheses.
� Weight fraction �%�
001� I/S Kaolinite Quartz Siderite Feldspar
3.6�8� 37�2� 42�2� 16.1�1� 1.9�3� 2.6�1�
4.4�6�
2.7�2� 39�2� 40�2� 13.7�6� 5.4�2� 1.9�1�
1.8�4�
Soft shale
Hard shale
Intensity (count1/2)
2-Theta (º)
16.0 20.0 24.0 28.0 32.0 36.0
1 2 3 4 5
K (001) I/S (110) K (002) I/S (200)
Dat
a
fit
Dat
a
fit
360
270
180
90
0
)
b)
igure 5. Map plots illustrating, with gray shades, intensity varia-ions in 36 spectra from one 2D synchrotron diffraction image. �a�ard shale and �b� soft shale. Notice that in soft shale the kaolinite
ine is barely textured. The bottom plot in each image is experimen-
antitatshown
e �nm
�
1
�
1
al data, and the top is the Rietveld fit for each sample.
ittpttttZ�tti
aEta�F6ois
mr2p�nfitfppf�ca
I
otap
smltw7pofinps
felcmmseem1two
ptetmGfim
sltiepfif�=easia
Tfit
S
H
S
D36 Lonardelli et al.
RESULTS
Table 1 shows some information regarding the density and poros-ty for both shales as well as the volume fractions for each phase ob-ained with Rietveld refinement. The aim of this work is to quantifyexture; thus, illite and smectite are treated as a single mixed-layerhase in both samples �I/S�, with a 1:1 ratio �50% illite, 50% smec-ite� and a Reichweite �R� ordering parameter R1. Each layer is iden-ical and contains an Al-rich and an Al-poor tetrahedral sheet and al-ernating K-rich and K-poor interlayers �Stixrude et al., 2002�. Forhis phase, we assume a crystal structure of muscovite �Comodi andanazzi, 1995� with monoclinic symmetry and space group C2/c
Hermann-Mauguin convention�. We are aware of the limitationshese assumptions put on interpretations, particularly elastic proper-ies, and we hope this can be refined further in the future. For kaolin-te, space group P1 was used �Young and Hewat, 1988�.
We used MAUD to extract ODs for quartz, feldspar, siderite, I/S,nd kaolinite and to export them for further processing in BEART-X �Wenk et al., 1998�. The strength of lattice-preferred orienta-
ions �F2, Bunge, 1985�, the OD minimum-maximum, and addition-l texture information are summarized in Table 2. The �001� and100� pole figures are used for graphic representations �Figures 6-8�.or both samples, I/S displays strong preferred orientation �Figurea and b�. Kaolinite is oriented in hard shale �Figure 7a� but is morer less random in soft shale �Figure 7b�. Quartz, feldspar, and sider-te are oriented randomly, so pole figures for silt components are nothown.
For hard shale �001�, pole figures of I/S display a slightly obliqueaximum �Figure 6a� with a concentration of 3.01 multiples of a
andom distribution �MRD�. The apparent tilt of approximately 15°-0° from the center is caused by the core plug not being exactly per-endicular to the foliation plane. The significant �001� minimumalso OD minimum� of approximately 0.37 MRD tells us that a sig-ificant portion of crystallites is randomly oriented. The �100� polegure for I/S displays a broad girdle with no significant concentra-
ions, indicating the mineral tends to align in a fiber texture rotatingreely around the �001� normal. Figure 7a shows �001� and �100�ole figures for kaolinite where the maximum is more than 30° dis-laced from the I/S maximum. The texture is similar to that observedor I/S, with a larger proportion of crystallites randomly orientedminimum 0.5 MRD�. In the hard shale, the strong texture for bothlay minerals �kaolinite and I/S� is also easily recognized by lookingt the map plot �Figure 5a�.
To confirm the tilt of the �001� pole figure maximum relative to/S, we have extracted the ODs for three additional different regions
able 2. Quantitative texture information for OD and polegures in multiples of a random distribution (MRD). F2 ishe texture strength.
ample phaseF2
�max/min�OD
�max/min��001�
�max/min��100�
�max/min�
ard shale
I/S 1.43 4.21/0.28 3.01/0.37 1.39/0.62
Kaolinite 1.38 3.68/0.35 2.63/0.50 1.30/0.70
oft shale
I/S 1.64 5.82/0.27 4.91/0.33 1.45/0.38
Kaolinite 1.03 1.38/0.84 1.18/0.89 1.06/0.94
f the hard shale sample. Figure 8 shows the �001� pole figures forhree different spots separated by 3 mm. The results confirm ansymmetric maximum of kaolinite with respect to the foliationlane.
In the soft shale, I/S is more strongly aligned than in the hardhale, with �001� poles perpendicular to the foliation plane and aaximum of 4.9 MRD �Figure 6b�. The volume fraction of random-
y oriented crystallites is similar �0.33 MRD�. Although I/S is moreextured than in hard shale, kaolinite is nearly randomly orientedith a �001� maximum of approximately only 1.18 MRD �Figureb�. This result can be confirmed qualitatively by inspecting the maplot in Figure 5, where the variation in intensity along the �001� ka-linite reflection is minimal compared with hard shale. Just to con-rm that this unexpected feature is representative of the sample andot a local aberration, several spots were investigated. Figure 9 com-ares experimental �001� kaolinite lines on several spots for bothoft and hard shale, indicating a consistent pattern.
DISCUSSION
Hard X-ray synchrotron radiation was used to investigate the pre-erred orientation of two different shale samples collected at differ-nt burial depths. Two-dimensional diffraction images were ana-yzed with the Rietveld method to provide a quantitative textureharacterization from full spectra. Both samples show strong align-ent of I/S with �001� planes parallel to the foliation plane. Maxi-um �001� pole densities are similar to those reported for Zechstein
hales �Sintubin, 1994a; 4–6 MRD�, Gulf Coast mudstones �Hot al., 1995; 2–7 MRD�, and mudstones from Pennsylvania �Hot al., 1995; 2–5 MRD� but considerably weaker than muscovite inetamorphic slates �Oertel and Phakey, 1972; 16 MRD.; Sintubin,
994b; 5–18 MRD�. All these previous studies used single peak in-ensity measurements, which can be unreliable for interlayer claysith diffuse peaks and background uncertainties. Our method reliedn full spectra deconvolution.
If the ODs and the elastic constants of single crystals for eachhase are known, averaging procedures can be applied to evaluatehe elastic properties of the polycrystal. Unfortunately, elastic prop-rties of clay minerals are poorly known �Katahara, 1996�, and forhis study we have used experimental elastic stiffness moduli of
uscovite measured with Brillouin scattering �Vaughan anduggenheim, 1986� and kaolinite elastic constants derived fromrst-principles studies �Sato et al., 2005�. Muscovite is treated asonoclinic, and kaolinite is treated as triclinic.Results for aggregate elastic constants weighted by the OD are
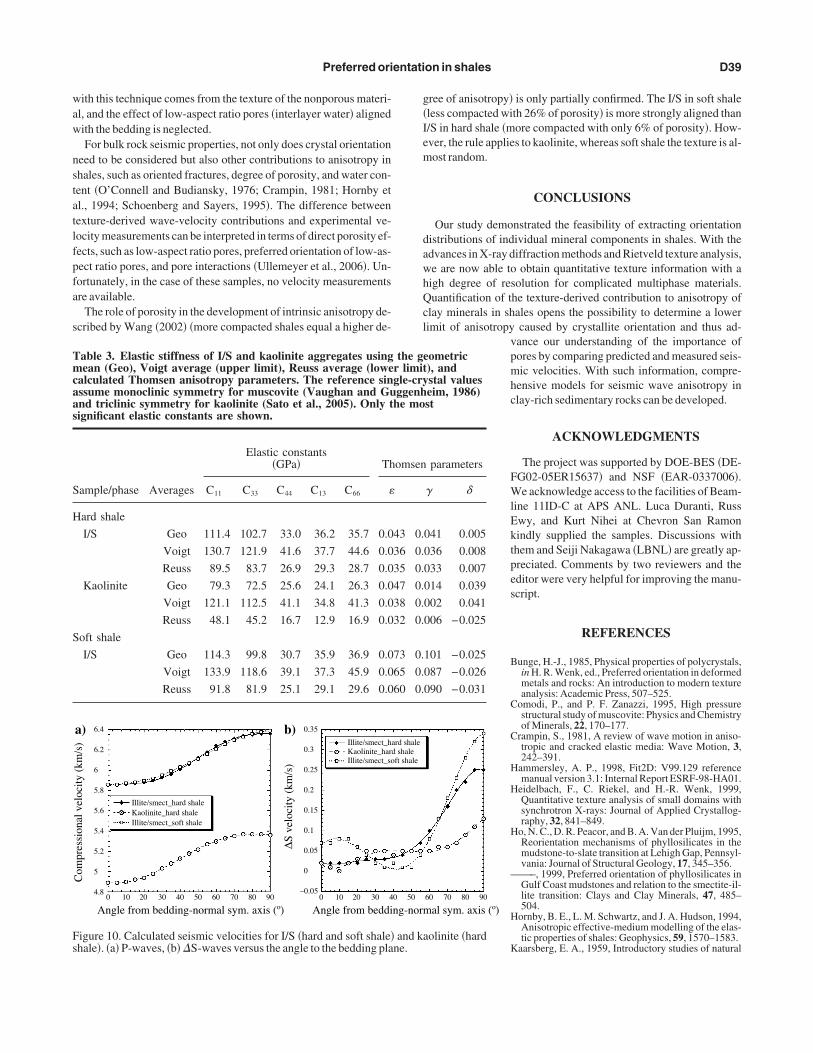
hown in Table 3. The Voigt and Reuss values provide upper andower bounds, assuming uniform strain and uniform stress, respec-ively, throughout the textured aggregate. A geometric mean averag-ng is intermediate �Matthies and Humbert, 1993�. From aggregatelastic constants obtained by the geometric mean, we calculatedhase velocity surfaces �Vp, Vsh, and Vsv�. Figure 10 gives the 1D pro-les of Vp and �Vs �Vsh − Vsv� from a position perpendicular to theoliation plane �0°� to the position parallel to the foliation plane90°�. Anisotropies �in percent� for the clay mineral components �A
200�Vmax − Vmin�/�Vmax + Vmin�� are in the range of 10%. Fromlastic coefficients, we can also calculate Thomsen parameters thatre used in exploration seismology �Thomsen, 1986�. For the twohales analyzed in this study, anisotropy is moderate �Table 3�. Thiss because by using muscovite elastic moduli for I/S, we assume thatny interlayer water is pore water. The elastic anisotropy calculated
a
b
Preferred orientation in shales D37
a)
b)
100
100
Pol
e de
nsity
(M
RD
) P
ole
dens
ity (
MR
D)
3.01 2.63 2.26 1.88 1.5 1.12 0.75 0.37
4.91 4.26 3.6 2.95 2.29 1.64 0.98 0.33
001
001
x
y
z
Figure 6. �100� and �001� I/S pole figures recal-culated from the OD: �a� hard shale and �b� softshale. An equal area projection. The pole densi-ty scale is in multiples of random distribution�MRD�.
)
)
100
100
Pol
e de
nsity
(M
RD
)
2.6 2.3 2 1.7 1.4 1.1 0.8 0.5
001
001
x
yz
Figure 7. Kaolinite pole figures �100� and �001�,recalculated from the OD: �a� hard shale and �b�soft shale. An equal area projection. The poledensity is scale in MRD.
Fuep
Favtae
D38 Lonardelli et al.
a)
b)
Spot 5
2.32-0.58 (MRD)
2.62-0.48 (MRD)
2.49-0.54 (MRD)
2.53-0.50 (MRD)
3.01-0.37 (MRD)
2.60-0.50 (MRD)
Spot 5
Spot 8
Spot 8
Spot 11
Spot 11
1 cm
5 8 11
Kaolinite
I/S
x
x
y
y
z
igure 8. �a� I/S and �b� kaolinite �001� pole fig-res recalculated from the OD for three differ-nt spots of the hard shale sample. An equal arearojection. The pole density is in MRD.
Spot 5
Spot 8
Spot 11
Spot 5
Spot 8
Spot 11
Intensity (count1/2)
22 24 26 28 30
0º 90º 180º 270º 360º
Intensity (count1/2)
21 22 23 24 25
b)
a)igure 9. The �001� kaolinite peak for hard �a�nd soft shale �b�. The image shows intensityariation in 36 spectra �from 0° to 360°� fromhe 2D synchrotron image at � = 30° �tiltingngle� for each spot analyzed. Notice the differ-nt intensity scales for �a� and �b�.
waw
nstatlfpfa
s
g�Iem
dawhQcl
Tmcaas
S
H
S
Fs
Preferred orientation in shales D39
ith this technique comes from the texture of the nonporous materi-l, and the effect of low-aspect ratio pores �interlayer water� alignedith the bedding is neglected.For bulk rock seismic properties, not only does crystal orientation
eed to be considered but also other contributions to anisotropy inhales, such as oriented fractures, degree of porosity, and water con-ent �O’Connell and Budiansky, 1976; Crampin, 1981; Hornby etl., 1994; Schoenberg and Sayers, 1995�. The difference betweenexture-derived wave-velocity contributions and experimental ve-ocity measurements can be interpreted in terms of direct porosity ef-ects, such as low-aspect ratio pores, preferred orientation of low-as-ect ratio pores, and pore interactions �Ullemeyer et al., 2006�. Un-ortunately, in the case of these samples, no velocity measurementsre available.
The role of porosity in the development of intrinsic anisotropy de-cribed by Wang �2002� �more compacted shales equal a higher de-
able 3. Elastic stiffness of I/S and kaolinite aggregates usingean (Geo), Voigt average (upper limit), Reuss average (lowe
alculated Thomsen anisotropy parameters. The reference sinssume monoclinic symmetry for muscovite (Vaughan and Gund triclinic symmetry for kaolinite (Sato et al., 2005). Only tignificant elastic constants are shown.
Elastic constants�GPa� Th
ample/phase Averages C11 C33 C44 C13 C66 �
ard shale
I/S Geo 111.4 102.7 33.0 36.2 35.7 0.0
Voigt 130.7 121.9 41.6 37.7 44.6 0.0
Reuss 89.5 83.7 26.9 29.3 28.7 0.0
Kaolinite Geo 79.3 72.5 25.6 24.1 26.3 0.0
Voigt 121.1 112.5 41.1 34.8 41.3 0.0
Reuss 48.1 45.2 16.7 12.9 16.9 0.0
oft shale
I/S Geo 114.3 99.8 30.7 35.9 36.9 0.0
Voigt 133.9 118.6 39.1 37.3 45.9 0.0
Reuss 91.8 81.9 25.1 29.1 29.6 0.0
a) b)
0 10 20 30 40 50 60 70 80 90 0 10 20 30 4
6.4
6.2
6
5.8
5.6
5.4
5.2
5
4.8
0.35
0.3
0.25
0.2
0.15
0.1
0.05
0
–0.05
Angle from bedding-normal sym. axis (º) Angle from beddi
igure 10. Calculated seismic velocities for I/S �hard and soft shale�hale�. �a� P-waves, �b� �S-waves versus the angle to the bedding pla
ree of anisotropy� is only partially confirmed. The I/S in soft shaleless compacted with 26% of porosity� is more strongly aligned than/S in hard shale �more compacted with only 6% of porosity�. How-ver, the rule applies to kaolinite, whereas soft shale the texture is al-ost random.
CONCLUSIONS
Our study demonstrated the feasibility of extracting orientationistributions of individual mineral components in shales. With thedvances in X-ray diffraction methods and Rietveld texture analysis,e are now able to obtain quantitative texture information with aigh degree of resolution for complicated multiphase materials.uantification of the texture-derived contribution to anisotropy of
lay minerals in shales opens the possibility to determine a lowerimit of anisotropy caused by crystallite orientation and thus ad-
vance our understanding of the importance ofpores by comparing predicted and measured seis-mic velocities. With such information, compre-hensive models for seismic wave anisotropy inclay-rich sedimentary rocks can be developed.
ACKNOWLEDGMENTS
The project was supported by DOE-BES �DE-FG02-05ER15637� and NSF �EAR-0337006�.We acknowledge access to the facilities of Beam-line 11ID-C at APS ANL. Luca Duranti, RussEwy, and Kurt Nihei at Chevron San Ramonkindly supplied the samples. Discussions withthem and Seiji Nakagawa �LBNL� are greatly ap-preciated. Comments by two reviewers and theeditor were very helpful for improving the manu-script.
REFERENCES
Bunge, H.-J., 1985, Physical properties of polycrystals,in H. R. Wenk, ed., Preferred orientation in deformedmetals and rocks: An introduction to modern textureanalysis: Academic Press, 507–525.
Comodi, P., and P. F. Zanazzi, 1995, High pressurestructural study of muscovite: Physics and Chemistryof Minerals, 22, 170–177.
Crampin, S., 1981, A review of wave motion in aniso-tropic and cracked elastic media: Wave Motion, 3,242–391.
Hammersley, A. P., 1998, Fit2D: V99.129 referencemanual version 3.1: Internal Report ESRF-98-HA01.
Heidelbach, F., C. Riekel, and H.-R. Wenk, 1999,Quantitative texture analysis of small domains withsynchrotron X-rays: Journal of Applied Crystallog-raphy, 32, 841–849.
Ho, N. C., D. R. Peacor, and B. A. Van der Pluijm, 1995,Reorientation mechanisms of phyllosilicates in themudstone-to-slate transition at Lehigh Gap, Pennsyl-vania: Journal of Structural Geology, 17, 345–356.
——–, 1999, Preferred orientation of phyllosilicates inGulf Coast mudstones and relation to the smectite-il-lite transition: Clays and Clay Minerals, 47, 485–504.
Hornby, B. E., L. M. Schwartz, and J. A. Hudson, 1994,Anisotropic effective-medium modelling of the elas-tic properties of shales: Geophysics, 59, 1570–1583.
Kaarsberg, E. A., 1959, Introductory studies of natural
eometric), andstal valueseim, 1986)st
parameters
� �
041 0.005
036 0.008
033 0.007
014 0.039
002 0.041
006 −0.025
101 −0.025
087 −0.026
090 −0.031
60 70 80 90
al sym. axis (º)
aolinite �hard
the gr limitgle-cryggenh
he mo
omsen
43 0.
36 0.
35 0.
47 0.
38 0.
32 0.
73 0.
65 0.
60 0.
0 50
ng-norm
ard shaled shaleft shale
and kne.
K
L
L
M
M
O
O
O
P
S
S
—
S
S
S
—
S
S
TU
V
W
W
W
Y
D40 Lonardelli et al.
and artificial argillaceous aggregates by sound-propagation and X-ray dif-fraction method: Journal of Geology, 67, 447–472.
atahara, K. W., 1996, Clay mineral elastic properties: 66th Annual Interna-tional Meeting, SEG, Expanded Abstracts, 1691–1694.
onardelli, I., H.-R. Wenk, L. Lutterotti, and M. Goodwin, 2005, Textureanalysis from synchrotron diffraction images with the Rietveld method:Dinosaur tendon and salmon scale: Journal of Synchrotron Radiation, 12,354–360.
utterotti, L., S. Matthies, H.-R. Wenk, A. S. Schultz, and J. W. RichardsonJr., 1997, Combined texture and structure analysis of deformed limestonefrom time-of-flight diffraction spectra: Journal of Applied Physics, 81,594–600.atthies, S., and M. Humbert, 1993, The realization of the concept of a geo-metric mean for calculating physical constants of polycrystalline materi-als: Physica Status Solidi, B177, K47–K50.atthies, S., and G. W. Vinel, 1982, On the reproduction of the orientationdistribution function of textured samples from reduced pole figures usingthe concept of conditional ghost correction: Physica Status Solidi, B112,K111–K114.
’Connell, R., and B. Budiansky, 1976, Seismic velocities in dry and saturat-ed cracked solids: Journal of Geophysical Research, 79, 5412–5426.
ertel, G., 1983, The relationship of strain and preferred orientation of phyl-losilicate grains in rocks — Review: Tectonophysics, 100, 413–447.
ertel, G., and P. P. Phakey, 1972, The texture of a slate from Nantille, Caer-narvon, North Wales: Texture, 1, 1–8.
opa, N. C., 1998, The hkl dependence of diffraction-line broadening causedby strain and size for all Laue groups in Rietveld refinement: Journal ofApplied Crystallography, 31, 176–180.
ato, H., K. Ono, C. T. Johnston, and A. Yamagishi, 2005, First-principlesstudies on elastic constants of a 1:1 layered kaolinite mineral: AmericanMineralogist, 90, 1824–1826.
ayers, C. M., 1994, The elastic anisotropy of shales: Journal of GeophysicalResearch, 99, 767–774.—–, 2005, Seismic anisotropy of shales: Geophysical Prospecting, 53,
667–676.choenberg, M., and C. M. Sayers, 1995, Seismic anisotropy of fracturedrock: Geophysics, 60, 204–211.
choenberg, M., F. Muir, and C. M. Sayers, 1996, Introducing ANNIE: Asimple three-parameter anisotropic velocity model for shales: Journal ofSeismic Exploration, 5, 35–49.
intubin, M., 1994a, Clay fabrics in relation to the burial history of shales:Sedimentology, 41, 1161–1169.—–, 1994b, Phyllosilicate preferred orientation in relation to strain pathdetermination in the lower Paleozoic Stavelot-Venn Massif �Ardennes,Belgium�: Tectonophysics, 237, 215–231.
tixrude, L., and D. R. Peacor, 2002, First-principles study of illite-smectiteand implications for clay mineral systems: Nature, 420, 165–168.
wan, G., J. Cook, S. Bruce, and R. Meehan, 1989, Strain rate effects in Kim-meridge Bay shale: International Journal of Rock Mechanics and MiningSciences, 26, 135–149.
homsen, L., 1986, Weak elastic anisotropy: Geophysics, 51, 1954–1966.llemeyer, K., S. Siegesmund, P. N. J. Rasolofosaon, and J. H. Behrmann,2006, Experimental and texture-derived P-wave anisotropy of principalrocks from the TRANSALP traverse: An aid for the interpretation of seis-mic field data: Tectonophysics, 414, 97–116.
aughan, M. T., and S. Guggenheim, 1986, Elasticity of muscovite and itsrelationship to crystal structure: Journal of Geophysical Research, 91,4657–4664.ang, Z., 2002, Seismic anisotropy in sedimentary rocks: Part 2 — Labora-tory data: Geophysics, 67, 1423–1440.enk, H.-R., I. Lonardelli, H. Franz, K. Nihei, and S. Nakagawa, 2007, Pre-ferred orientation and elastic anisotropy of illite-rich shale: Geophysics,this issue.enk, H.-R., S. Matthies, J. Donovan, and D. Chateigner, 1998, BEARTEX,a Windows-based program system for quantitative texture analysis: Jour-nal of Applied Crystallography, 31, 262–269.
oung, R. A., and A. W. Hewat, 1988, Verification of the triclinic crystalstructure of kaolinite: Clays and Clay Minerals, 36, 225–232.