Page 1
PRELIMINARY CARBON DIOXIDE CAPTURE TECHNICAL AND
ECONOMIC FEASIBILITY STUDY
SUBMITTED TO
U.S. Department of Energy National Energy Technology Laboratory
SUBMITTED UNDER FUNDING OPPORTUNITY ANNOUNCEMENT
DE-FOA-0000403
EVALUATION OF CARBON DIOXIDE CAPTURE FROM EXISTING COAL FIRED
PLANTS BY HYBRID SORPTION USING SOLID SORBENTS
PRINCIPAL INVESTIGATOR
Steven A. Benson, Ph.D.
Phone: 701-777-5177
Fax: (701)777-3773
[email protected]
November 30, 2012
DUNS # 10-228-0781
SUBMITTED BY
Institute for Energy Studies
College of Engineering and Mines
University of North Dakota
243 Centennial Drive Stop 8153
Upson II Room 366
Grand Forks, ND 58203
WORK PERFORMED UNDER AGREEMENT
DE-FE0007603
Signature of Submitting Official: ___________________________________________
Steven A. Benson, Ph.D.
Page 2
2
University of North Dakota–Department of Energy Preliminary Carbon Dioxide Capture Technical and Economic Feasibility Study
EVALUATION OF CARBON DIOXIDE CAPTURE FROM EXISTING COAL-FIRED PLANTS BY HYBRID SORPTION USING SOLID SORBENTS
Prepared for Institute for Energy Studies University of North Dakota Date
November 30, 2012
Page 3
3
University of North Dakota–Department of Energy Preliminary Carbon Dioxide Capture Technical and Economic Feasibility Study
EVALUATION OF CARBON DIOXIDE CAPTURE FROM EXISTING COAL-FIRED PLANTS BY HYBRID SORPTION USING SOLID SORBENTS
Prepared for Institute for Energy Studies University of North Dakota Date
November 30, 2012
4700 West 77th
Street Minneapolis, MN 55435-4803 Phone: (952) 832-2600 Fax: (952) 832-2601
Page 4
University of North Dakota–Department of Energy Preliminary Carbon Dioxide Capture Technical and Economic Feasibility Study
November 30, 2012
Table of Contents
1.0 Executive Summary 1
1.1 Introduction ................................................................................................................................. 1
1.2 Key Finding—ASPEN Model Review ....................................................................................... 3
1.3 Key Finding—Design Basis ....................................................................................................... 3
1.4 Key Finding—Major Equipment ................................................................................................ 3
1.5 Key Finding—Heat Balance ....................................................................................................... 4
1.6 Key Finding—Capital Cost ......................................................................................................... 5
1.7 Key Finding—Operation and Maintenance Cost ........................................................................ 5
1.8 Key Finding—Levelized Cost of Electricity .............................................................................. 6
1.9 Key Finding—Cost of CO2 Capture ........................................................................................... 7
1.10 Key Finding—Sensitivity Case ................................................................................................... 8
1.11 Key Finding—550 MW Net Output Sensitivity Case................................................................. 8
1.12 Key Finding—Zero Value Sorbent Sensitivity Case ................................................................ 10
2.0 Aspen Model Review 12
2.1 Aspen Model Review ................................................................................................................ 12
3.0 Design Basis 14
3.1 Carbon Capture Design Basis ................................................................................................... 14
3.1.1 Sorbent Selection and Formulation .............................................................................. 14
3.1.2 Detailed Process Description ....................................................................................... 14
3.1.3 Process Modeling and Equipment Design ................................................................... 15
3.2 Major Equipment ...................................................................................................................... 15
3.2.1 Account 5—Flue Gas Cleanup .................................................................................... 15
3.2.2 Account 6—Sorbent Regeneration .............................................................................. 16
3.2.3 Account 7—Preconditioning and CO2 Compression Train ......................................... 16
3.2.4 Account 8—Sorbent Handling ..................................................................................... 16
3.2.5 Account 9—Waste-Sorbent Recovery and Handling .................................................. 16
3.2.6 Account 10—Balance-of-Plant Equipment ................................................................. 17
3.2.7 Account 11—Electrical ................................................................................................ 17
3.2.8 Account 12—Instrumentation and Controls ................................................................ 17
3.3 General Arrangement ................................................................................................................ 17
4.0 Major Equipment List 19
Page 5
4.1 Major Equipment List ............................................................................................................... 19
4.1.1 Account 5—Flue Gas Cleanup .................................................................................... 19
4.1.2 Account 6—Sorbent Regeneration .............................................................................. 19
4.1.3 Account 7—Preconditioning and CO2 Compression Train ......................................... 20
4.1.4 Account 8—Sorbent Handling ..................................................................................... 20
4.1.5 Account 9—Waste Sorbent Recovery and Handling ................................................... 20
5.0 Heat Balance 22
5.1 Heat Balance Analysis .............................................................................................................. 22
5.1.1 Overview ...................................................................................................................... 22
5.1.2 CACHYS™
Process Requirements .............................................................................. 22
5.1.3 CACHYS™
Auxiliary Power Requirements ................................................................ 23
5.1.4 Plant Performance Summary ....................................................................................... 23
6.0 Capital Cost Estimate 26
6.1 Qualification of Estimated Cost ................................................................................................ 26
6.2 Estimate Type ........................................................................................................................... 26
6.3 Cost Breakdown ........................................................................................................................ 27
6.4 Cost Estimate Methodology ...................................................................................................... 28
6.5 Quantities and Allowances ....................................................................................................... 29
6.6 Contingency .............................................................................................................................. 30
6.6.1 Process Contingency .................................................................................................... 31
6.6.2 Project Contingency ..................................................................................................... 31
6.7 Capital Cost Summary .............................................................................................................. 32
7.0 Operating Cost Estimate 33
7.1 Overview ................................................................................................................................... 33
7.2 O&M Cost Summary ................................................................................................................ 34
8.0 Levelized Cost of Electricity and Cost of CO2 Capture 35
8.1 Overview ................................................................................................................................... 35
8.2 Parasitic Power Losses .............................................................................................................. 35
8.3 Levelized Cost of Electricity and Steam ................................................................................... 36
8.4 Cost of Carbon Dioxide Capture ($/ton) ................................................................................... 36
8.5 Pulverized Coal Plant Efficiency .............................................................................................. 37
9.0 Sensitivity Cases 38
9.1 Sensitivity Cases ....................................................................................................................... 38
Page 6
List of Tables
Table 1.1 Thermal Performance Summary
Table 1.2 O&M Cost Summary
Table 1.3 Cost Comparison Summary
Table 1.4 Cost of CO2 Capture Summary
Table 1.5 Sensitivity Case Summary
Table 1.6 LCOE Summary
Table 1.7 Cost of CO2 Capture Summary (550 MW Net Output Sensitivity Case)
Table 1.8 Cost of CO2 Capture Summary Base Case (with Zero Value Spent Sorbent)
Table 1.9 Cost of CO2 Capture Summary 550 MW Case (with Zero Value Spent Sorbent)
Table 4.1 Account 5—Flue-Gas Cleanup
Table 4.1 Account 6—Sorbent Regeneration
Table 4.1 Account 7—Preconditioning and CO2 Compression Train
Table 4.1 Account 8—Sorbent Handling
Table 4.1 Account 9—Waste-Sorbent Recovery and Handling
Table 5.1 CACHYS™
Heat Duty Summary
Table 5.2 CACHYS™
Steam Supply Summary
Table 5.3 Auxiliary Power Summary
Table 5.4 Plant Performance Summary
Table 6.1 AACE Generic Cost Estimate Classification Matrix
Table 6.2 Exhibit 2-3 AACE Guidelines for Process Contingency
Table 6.3 CACHYS™
System Capital Cost Summary
Table 7.1 O&M Cost Summary
Table 8.1 Parasitic Power Losses
Table 8.2 Levelized Cost of Electricity and Steam
Table 8.3 Cost of CO2 Capture Summary
Table 8.4 Plant Efficiency Summary
Table 9.1 Plant Efficiency Summary
List of Exhibits
Exhibit A: Process Flow Diagram
Exhibit B: Levelized Cost of Electricity
Exhibit C: Capital Cost Estimate
Exhibit D: Sensitivity Case Calculations
Exhibit E: Supporting Calculations for 550 MW Net Output Sensitivity Case and Zero
Value
Page 7
Sorbent Sensitivity Case List of Acronyms and Abbreviations
AACE: Association for the Advancement of Cost Engineering International
Barr: Barr Engineering Co.
BEC: Bare erected cost (equipment, on-site facilities, infrastructure, labor)
BOP: Balance of plant
Btu/kWh: British thermal unit per kilowatt hour
CACHYS™
: Capture from Existing Coal-Fired Plants by Hybrid Sorption Using Solid Sorbents
Capture
CO2: Carbon dioxide
DCS: Distributed control system
DOE: Department of Energy
Envergex: Envergex LLC
EPC: Engineering, procurement, and construction
EPCM: Engineering, procurement, and construction management
oF: Fahrenheit
FGD: Flue-gas desulfurization
FOA: Federal Opportunity Announcement
FT: Feet
HHV: Higher heating value
HP: High pressure
Hp: Horsepower
IEP: Independent Energy Producers
IES: Institute for Energy Studies
Page 8
IP: Intermediate pressure
kW: Kilowatt
LB/HR: Pound per hour
LCOE: Levelized cost of electricity
LP: Low pressure
Mills/kWh: mills per kilowatt-hour
MMBtu/hr: Million British thermal units per hour
MVA: Megavolt amperes
MW: Megawatt
MWe: Megawatt electrical
O&M: Operation and maintenance
OEM: Original equipment manufacturer
PC: Pulverized coal
PFD: Process flow diagram
PSIA: Pounds per square inch absolute
SCR: Selective catalytic reduction
Solex: Solex Thermal Science
Ton/hr: Ton per hour
TPC: Total plant cost
UND: University of North Dakota
$/kW: Dollar per kilowatt
$/ton: Dollar per ton
$/yr: Dollar per year
Page 9
1.0 Executive Summary
1.1 Introduction
Barr Engineering Co. was retained by the Institute for Energy Studies (IES) at University of North
Dakota (UND) to conduct a technical and economic feasibility analysis of an innovative hybrid
sorbent technology (CACHYS™
) for carbon dioxide (CO2) capture and separation from coal
combustion–derived flue gas.
The project team for this effort consists of the University of North Dakota, Envergex LLC, Barr
Engineering Co., and Solex Thermal Science, along with industrial support from Allete, BNI Coal,
SaskPower, and the North Dakota Lignite Energy Council.
An initial economic and feasibility study of the CACHYS™
concept, including definition of the
process, development of process flow diagrams (PFDs), material and energy balances, equipment
selection, sizing and costing, and estimation of overall capital and operating costs, is performed by
Barr with information provided by UND and Envergex.
The technology—Capture from Existing Coal-Fired Plants by Hybrid Sorption Using Solid Sorbents
Capture (CACHYS™
)—is a novel solid sorbent technology based on the following ideas: reduction of
energy for sorbent regeneration, utilization of novel process chemistry, contactor conditions that
minimize sorbent-CO2 heat of reaction and promote fast CO2 capture, and a low-cost method of heat
management. The technology’s other key component is the use of a low-cost sorbent.
The proposed CACHYS™
concept consists of the following components:
1. A hybrid sorbent that can capture CO2 from flue gases exiting a desulfurization scrubber.
This hybrid sorbent is composed of the following: (i) active alkaline components that react
with CO2; (ii) a defined amount of additives combined with the alkaline component to enable
low heats of reaction and to optimize specific physical properties; and (iii) a minor quantity
of promoters to activate the alkali components.
2. Adsorber operation to achieve a high degree of sorbent conversion and CO2 capture, while
minimizing thermal effects.
3. Regenerator operation that fosters sorbent transformations consistent with low heats of
dissociation for CO2 release.
Page 10
The basis for this study was results from a DOE SBIR-STTR exploratory research project conducted
by Envergex LLC together with UND. A novel process (CACHYS™
) was developed from this
initiative. The technology and feasibility analysis in this report was performed using a combination
of laboratory test results as well as modeling efforts from the above study.
Key items identified as part of the exploratory research included sorbent and process metrics , such as
heat of reaction and sorbent capacity, as well as the operating envelope of the adsorber and
regenerator systems. The heats of reaction measured during testing ranged from 0 to 80 kJ/mol CO 2;
an average value of 40 kJ/mol CO2 was used in the process modeling efforts. Various loadings of the
active component in the sorbent were tested; a conservative value for the active component loading
was used in the feasibility study. In addition, bench-scale test results indicated sorbent capacity
ranges from 7 to 10 grams of CO2/100 grams of sorbent. Based on these key elements of the physical
and chemical performance of the sorbent, a detailed process design was conducted using Aspen Plus®
software.
The basis for the process design further included input from a previous DOE-funded analysis (Cost
and Performance Baseline for Fossil Energy Plants, Volume 1: Bituminous Coal and Natural Gas to
Electricity; Revision 2, November 2010). The process design covered a supercritical pulverized coal -
fired power plant with a net power output of 550MWe and equipped with an Econoamine-based
system for post-combustion CO2 capture. The gas composition as well as the flue gas flow
corresponding to the gross power output of 662MWe was used as a baseline for the CACHYS™
process modeling effort. The Aspen Plus®
design provided heat and material balance data that was
used in estimating the cost of CO2 capture, separation and compression, while benchmarking against
other competing technologies, such as the Econoamine-based system.
The project will develop key information for the CACHYS™
process—sorbent performance, energy
for sorbent regeneration, physical properties of the sorbent, the integration of process components,
sizing of equipment, and overall capital and operational costs of the integrated CACHYS™
system.
Through integrated bench-scale testing, this project aims to develop a novel sorbent-based, post-
combustion technology, namely the CACHYS™
process, which can achieve at least 90% CO2
removal from coal-fired power plants while demonstrating progress toward achievement of the DOE
target of less than a 35% increase in the levelized cost of electricity (LCOE).
Page 11
1.2 Key Finding—ASPEN Model Review
Barr met with staff from UND’s Institute for Energy Studies and staff from Envergex to review the
Aspen Plus®–based process model developed by UND. The Aspen Plus
® process model was designed
to evaluate a potential process for CO2 capture. The model begins with desulfurized flue gas and ends
with compressed liquid CO2 for reuse or sequestration.
The review consisted of an overview of the entire model and examination of each unit operation
represented therein. The system was evaluated from the standpoint of each unit’s necessity to the
process, how each unit was represented (e.g., kinetic versus equilibrium reactions, heat transfer
extent, etc.), whether any necessary equipment was absent, and the reasonableness of the
assumptions used within the model. The process streams were examined in like manner. The overall
mass and energy balance of the process was reviewed and confirmed.
The model’s overall quality was found suitable for determining and tracking the magnitudes of mass
and energy into and out of the CO2 capture process. While the model does not include the power
plant, it does include the important links to the power plant, such as flue gas and steam streams. The
model output was deemed adequate for the basis of Barr’s cost estimating task.
1.3 Key Finding—Design Basis
Using the Aspen Plus®
model as a foundation, the PFD was populated as shown in Exhibit A. The
PFD included the equipment accounted for in the Aspen Plus® model, along with the material
handling and transfer equipment. Creating the PFD allowed for a complete major equipment list to be
formulated, along with balance-of-plant equipment to be accounted for, and electrical requirements to
be considered.
1.4 Key Finding—Major Equipment
Major equipment for one CACHYS™
process train consists of the following:
A flue gas cleanup system with CO2 adsorber, inlet and exhaust fans, cyclone separator, sorbent
conditioner, baghouse, and stack;
A Solex sorbent regeneration system with a feed bin, rotary airlock, sorbent heaters and coolers,
and fin fan cooler;
A preconditioning and CO2 compression system with condensate pumps and collection tank,
four-staged intercooled compression skid, and condensing heat exchanger for energy recovery;
and
Page 12
Fresh and spent sorbent handling systems with screw conveyors, bucket/L-path conveyors,
blowers, baghouse, and silo storage.
Other major equipment includes transformers, switchgear, motor control centers, shop-fabricated
tanks, general-service pump skids, miscellaneous process equipment, as well as an instrumentation
and control package.
1.5 Key Finding—Heat Balance
CO2 capture and compression systems impact the overall heat rate of a coal-fired power plant two
ways:
Consuming heat in the form of steam extraction from the steam turbine; and
Consuming station service to operate the equipment in the carbon capture and compression
system. The majority of the station service is consumed in compressing the CO2 that is captured.
Other auxiliary uses, such as flue gas inlet/outlet fans, conveyors, pumps, etc., also consume
station service.
In developing the heat balance for the CACHYS™
system, Barr used the Cost and Performance
Baseline for Fossil Energy Plants, Volume 1, Revision 2, dated November 2010 as a reference
document. Case 12 from the report, developed for a 550 MWe (net) supercritical pulverized coal-fired
power plant with CO2 capture, was used for comparison.
The CACHYS™
system required significantly less heat input in the form of steam extraction from the
steam turbine than the Econoamine System used to develop Case 12 of the DOE report. This results
in a significant thermal efficiency improvement for the CACHYS™
system compared to an
Econoamine System. Summary results are shown in Table 1.1.
Table 1.1 Thermal Performance Summary
Case 12 (DOE,
2010)
CACHYS™
Heat Requirements
(MMBtu/hr)
2,335.0 547.6
Thermal Efficiency (%) 28.4 34.6
Page 13
1.6 Key Finding—Capital Cost
Barr calculated the capital cost for the CACHYS™
system as an overnight cost calculated in 2012
dollars, with no adjustments for escalation in future years. The cost consists of equipment and
materials, construction labor, engineering, and construction and project management, as well as
process and project contingencies. The capital cost is based on retrofitting the CACHYS™
system
into the flue gas stream of an existing, hypothetical, 600 to 700 MW coal-fired power plant located
on a generic, greenfield site in moderate climates within the United States.
High-level quantity takeoffs for major system components, such as sorbent regeneration, flue gas
cleanup, and conveyance systems were developed from the general arrangement drawings and the
PFD. Cost allowances were used for construction quantities where current project definition did not
allow for the determination of itemized construction quantities. These allowances were based on
costs from indicative coal-fired power projects considered to be similar in scope and level-of-effort.
Databases for costs were provided by Barton Malow Company, an EPC construction contractor based
in southeast Michigan.
The capital cost corresponds to a Class 5 estimate class (AACE International Recommended Practice
No. 18R-97) for the process industries, with an end use for screening and feasibility studies. A Class
5 estimate classification is characterized by limited project definition and the wide-scale use of
scaling and power industry experience to calculate costs.
The capital cost for the CACHYS™
system installed on a 670 MWe (net) supercritical pulverized
coal-fired power plant is estimated to be $672.3 million, which represents a unit cost of $1,004 per
kilowatt (net).
1.7 Key Finding—Operation and Maintenance Cost
Barr evaluated the yearly operation and maintenance (O&M) costs associated with the CACHYS™
system. The main components of the yearly operating cost are:
O&M labor
Maintenance materials
Sorbent
The O&M labor was estimated using similarly-sized projects, such as coal-fired power plants;
operating experience; and scrubber installations. The CACHYS™
system has very similar
components and will require highly-skilled O&M personnel.
Page 14
The largest single operating expense is the cost of the CO2 sorbent estimated at $1.00/lb.
Approximately 6,500 tons/hr of sorbent are moved within the CACHYS™
system. It is estimated that
2 tons/hr are rejected to waste. The waste sorbent is assumed to be sold as fertilizer supplement at
$0.50/lb. A summary of O&M costs is provided in Table 1.2.
Table 1.2 O&M Cost Summary
Category Cost per year
Personnel $2,723,000
Maintenance Materials $1,380,000
Sorbent $29,784,000
Sorbent Recovery -$14,892,000
Total $18,995,000
1.8 Key Finding—Levelized Cost of Electricity
The major inputs to developing the LCOE and the cost per ton of CO2 captured are:
Process flow diagram
Heat balance diagram
Capital cost of the carbon capture system
O&M cost of the carbon capture system
A methodology for turning these inputs into an LCOE and cost per ton of CO2 captured is contained
in Attachment 3 of the Federal Opportunity Announcement (DE-FOA-0000403), included as Exhibit
B of this report.
Barr used this methodology to calculate the following parameters described by the FOA. The full
results are provided in Section 8.
Parasitic power losses
LCOE
Cost of CO2 capture—$/ton
Changes in pulverized coal (PC) plant efficiency
As shown in Table 1.3, the LCOE results for the CACHYS™
system were also compared to Cases 11
and 12 contained in the DOE report.
Page 15
Table 1.3 Cost Comparison Summary
Case 11
(DOE, 2010)
Case 12 (DOE,
2010)
CACHYS™
LCOE
(mills/kWh)
74.7 132.28 95.1
1.9 Key Finding—Cost of CO2 Capture
The FOA outlines the methodology for calculating the cost of CO2 capture expressed in $/ton. The
inputs are described below:
Total O&M costs—this item is composed of both fixed and variable components (see Section 7).
The largest component is approximately $15 million per year for the sorbent;
Capital charge for the CO2 system—this item represents the yearly cost recovery needed to
support the capital investment as shown in the equation below; and
CO2 captured in tons using the PFD.
The capital Charge [$/yr] is equivalent to the Capital Charge Factor multiplied by the Capital Cost,
where:
Capital Charge Factor = 17.5% per year; and
Capital Cost = $672.8 million.
The results are shown in the Table 1.4.
Table 1.4 Cost of CO2 Capture Summary
Cost Per Year
Total O&M $18,995,000
Capital Charge $117,740,000
Total Cost $136,735,000
Tons Per Year
CO2 Captured 4,405,200
Cost Per Ton
Cost of CO2 Capture $31.04
Page 16
1.10 Key Finding—Sensitivity Case
Steam is used as a heat source to regenerate the sorbent material. The results discussed in the
previous sections are based upon the current state of the research for the sorbent material.
To represent a case in which the sorbent material requires more steam than expected, it was decided
to double the amount of indirect steam required to regenerate the sorbent from 625 to 1250
MMBtu/hr. The results are shown in Table 1.5. Calculations can be found in Exhibit D.
Table 1.5 Sensitivity Case Summary
Case 12 CACHYS™
Base Case
Sensitivity
Case
Steam Turbine
Power (kWe)
662,880 773,200 731,300
Net Power
(kWe)
549,970 670,400 628,500
Equivalent
Steam Use
(kW)
156.7 46.2 88.2
Net Plant
Efficiency %
(HHV)
28.4 34.6 32.5
LCOE
(mills/kWh)
132.8 95.1 107.9
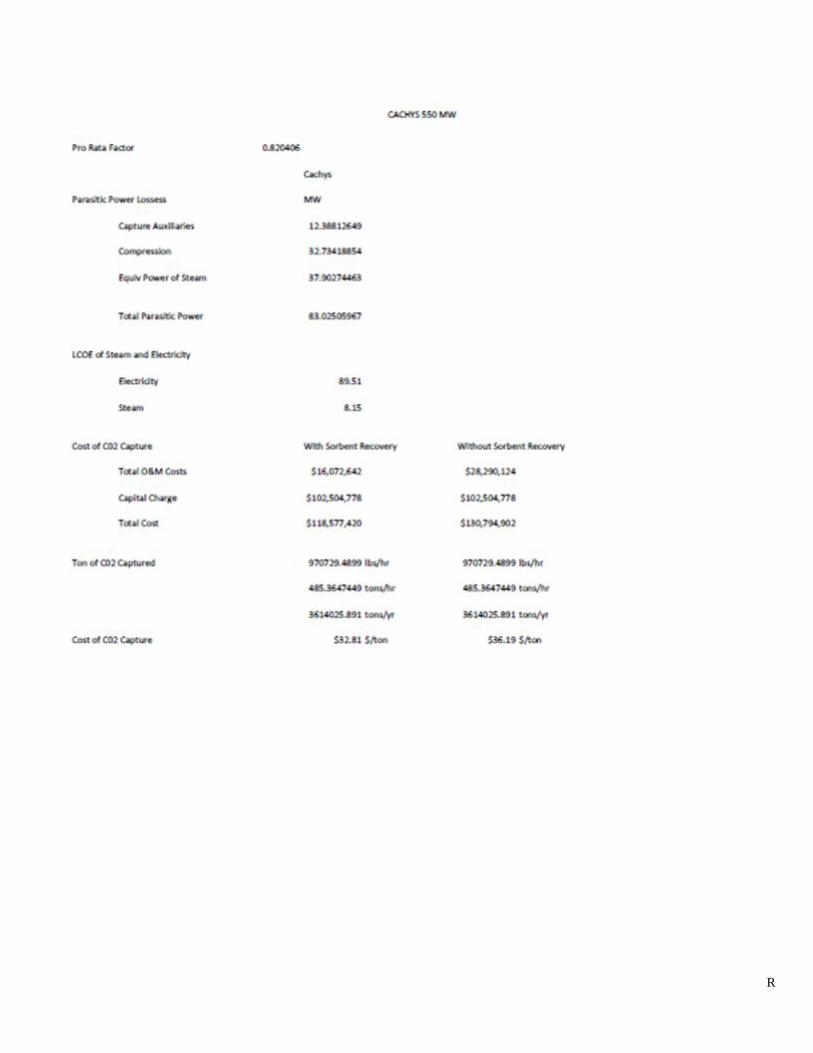
1.11 Key Finding—550 MW Net Output Sensitivity Case
A sensitivity case was run reducing the net output of the supercritical PC power plant integrated with
the CACHYS™ process from 670.4 to 550 MWe. Adjustments were made to the CACHYS™
base
case by prorating (550/670.4) the following categories:
Gross and net turbine power
Station service use
Carbon capture system electrical use
Equivalent steam use (kW)
Tons of CO2 captured
Amount of sorbent used
Page 17
The capital cost of the CACHYS™
system was prorated down by the following rule of thumb:
New Capital Cost = (550/670.4)0.7
x $672.8M
This approach to modifying the capital cost reflects the fact that some components of the capit al cost
have a fixed component and some components are variable. The results of the calculations are shown
in Tables 1.6 and 1.7. The supporting calculations are provided in Exhibit C.
Table 1.6 LCOE Summary
Case 12 CACHYS™
Base Case
550 MW
Sensitivity
Case
Steam Turbine Power
(kWe)
662,880 773,200 634,340
Net Power (kWe) 549,970 670,400 550,000
Equivalent Steam Use
(kW)
156.7 46.2 37.9
Net Plant Efficiency
% (HHV)
28.4 34.6 34.6
LCOE (mills/kWh) 132.8 95.1 89.5
Table 1.7 Cost of CO2 Capture Summary
CACHYS™
Base Case
Cost Per Year
550 MW Sensitivity
Case
Total O&M $18,995,000 $16,072,000
Capital Charge $117,740,000 $102,504,000
Total Cost $136,735,000 $118,577,000
Tons Per Year Tons Per Year
CO2 Captured 4,405,200 3,614,000
Cost Per Ton Cost Per Ton
Cost of CO2 Capture $31.04 $32.81
Page 18
1.12 Key Finding—Zero Value Sorbent Sensitivity Case
The base case assumes that the spent sorbent is recovered and sold into the fertilizer market thereby
recovering 50% of the value of the sorbent. Cases were run for the base case and the 550 MW case
assuming that the spent sorbent had zero value. The results of the calculations are shown in Tables
1.8 and 1.9. The supporting calculations are in Exhibit E.
It should be noted that the sorbent consumption is based upon an entering flue gas SO2 concentration
of 50 ppm. Use of a polishing scrubber ahead of the CACHYS™
system could potentially reduce the
SO2 concentration to less than 5 ppm. Reducing the concentration of SO2 below 5ppm will reduce the
amount of SO2 that ends up as sulfate in the sorbent. Sorbent-containing sulfate must be removed
from the system and then replaced with fresh sorbent. The end result of lower SO2 will be reduced
consumption of sorbent, which will greatly reduce the O&M cost down from the $33,887,000 shown
in Table 1.8.
Table 1.8 Cost of CO2 Capture Summary Base Case (with Zero Value Spent Sorbent)
CACHYS™
Base Case
Cost Per Year
Zero Value for
Spent Sorbent
Cost Per Year
Total O&M $18,995,000 $33,887,000
Capital Charge $117,740,000 $117,740,000
Total Cost $136,735,000 $151,627,000
Tons Per Year Tons Per Year
CO2 Captured 4,405,200 4,405,200
Cost Per Ton Cost Per Ton
Cost of CO2 Capture $31.04 $34.42
Page 19
Table 1.9 Cost of CO2 Capture Summary 550 MW Case (with Zero Value Spent Sorbent)
550 MW Sensitivity Case Zero Value for Spent
Sorbent
Cost Per Year
Total O&M $16,072,000 $28,290,000
Capital Charge $102,504,000 $102,504,000
Total Cost $118,577,000 $130,794,000
Tons Per Year Tons Per Year
CO2 Captured 3,614,000 3,614,000
Cost Per Ton Cost Per Ton
Cost of CO2
Capture
$32.81 $36.19
Page 20
12
2.0 Aspen Model Review
2.1 Aspen Model Review
Barr Engineering Co. met with staff from the University of North Dakota’s Institute for Energy
Studies and staff from Envergex LLC to review the Aspen Plus® process model developed by UND.
The Aspen Plus® process model was designed to evaluate a potential process for CO2 capture. The
model begins with desulfurized flue gas and ends with compressed liquid CO2 for reuse or
sequestration.
The review consisted of an overview of the entire model and examination of each unit operation
represented therein. The system was evaluated from the standpoint of each unit’s necessity to the
process, how each unit was represented (e.g., kinetic versus equilibrium reactions, heat transfer
extent, etc.), whether any necessary equipment was absent, and the reasonableness of the
assumptions used within the model. The process streams were examined in like manner. The overall
mass and energy balance of the process was reviewed and confirmed.
The model’s overall quality was found suitable for determining and tracking the magnitudes of mass
and energy into and out of the carbon capture process. While the model does not include the power
plant, it does include the important links to the power plant, such as flue gas and steam, as described
below. The model output was deemed adequate for the basis of Barr’s cost estimating task.
As with any simulation, the assumptions that go into the model are key to the model’s accuracy in
representing the actual process. The process-specific assumptions, in many cases, are still being
confirmed. This was taken into consideration during review of the process model. Throughout the
model’s review, several significant changes were made in order to update the process and better
represent the flow streams.
Based on the above discussion, the following observations have been made:
1. The model begins with desulfurized flue gas and ends with compressed liquid CO2 for reuse or
sequestration.
2. The model incorporates the required assumptions as prescribed by solicitation DE-FOA-0000403.
3. The model is based on UND-developed adsorbent, the exact behavior of which is still being
determined in laboratory tests.
4. The mass and energy flows are being properly tracked and accounted for.
Page 21
13
5. The model, once updated with additional sorbent data, will represent a useful tool for evaluating
process sensitivity to certain major variables.
6. The model inputs and outputs are sufficiently balanced to support Barr’s efforts on equipment
sizing and related activities.
Page 22
14
3.0 Design Basis
3.1 Carbon Capture Design Basis
The purpose of this report is to perform an initial evaluation of the technical and economic feasibility
of the CACHYS™
concept. The CACHYS™ process takes a water saturated CO2-rich flue gas
through a fluidized bed adsorber that is designed to operate at 60 to 85°C and a static pressure of 50
to 200 in H2O. The CO2-rich flue gas is scrubbed using a hybrid sorbent process that reduces the CO2
gas concentration by 90 percent. The spent sorbent is then routed to a regenerator for regeneration
using a temperature swing. The heat required for regeneration is provided by pressurized steam. It is
anticipated that the regenerator will operate at 150 to 170°C.
The techno-economic assessment for the CACHYS™ process covered the unique process design
comprising flue gas pre-treatment, adsorber and regenerator sections and CO2-rich gas compression.
Barr completed this portion with the assistance of engineers from UND and Envergex. The following
steps were followed to complete the initial technology and economic feasibility study.
3.1.1 Sorbent Selection and Formulation
Envergex used laboratory-scale test methods to expedite sorbent selection and formulation, as well as
to determine the heat of sorption, sorbent capacity (CO2 loading), and sorbent physical properties for
process design definition. A larger-scale, fixed-bed reactor will be used to obtain data on
adsorption/desorption kinetics, working capacity, and cyclic operation. Optimum process conditions
(e.g., temperatures, pressures, and residence times), preferred sorbent compositions, and updated
bench-scale equipment design (e.g., size, energy duties, and material feed rates) were established.
3.1.2 Detailed Process Description
Process flow diagrams (PFDs) that included all unit operations required to capture CO2 from flue gas,
desorb the CO2, regenerate the sorbent, and recover the sorbent were developed by Barr using the
Aspen Plus® process model developed by UND. The key process equipment was identified. Process
boundaries and CACHYS™
process plant size were then defined for a 550 MWe (target output)
pulverized-coal (PC) power plant.
The PFD was used as a major input to the following sections of the report:
4.0 Major Equipment List
5.0 Heat Balance
Page 23
15
6.0 Capital Cost Estimate
7.0 Operating Cost Estimate
3.1.3 Process Modeling and Equipment Design
Based on the process concept, material and energy balances were generated using Aspen Plus®
simulation software. The Aspen Plus® model provided the following data:
1. Generation of material and energy balances around the combined CO2 capture and compression
process equipment;
2. Determination of heat/mass flows and utility requirements;
3. Completion of stream tables showing operating pressures, temperatures, compositions, and
enthalpies of all streams entering and leaving major process equipment; and
4. Development of process heat and mass flow tables and other information required to size
equipment.
The above items laid the foundation to complete a PFD. Using the Aspen Plus®
model as a
foundation, the PFD was populated as shown in Exhibit A. The PFD included the equipment
accounted for in the Aspen Plus®
model, along with the material handling and transfer equipment.
Creating the PFD allowed for a complete major equipment list to be formulated, along with balance -
of-plant equipment to be accounted for, and electrical requirements to be considered.
3.2 Major Equipment
The following sections describe the equipment required per the PFD as shown in Exhibit A. The
accounts used in the equipment list correspond to the account numbers used in the cost estimates in
Section 7 and Exhibit C.
Accounts 1 through 4, which cover Sitework; Foundations and Concrete; Structural; and Piping,
Valves, and Supports, do not have any major associated equipment.
3.2.1 Account 5—Flue Gas Cleanup
The flue gas cleanup account consists of the following: inlet fan, CO2 adsorber, cyclone separator,
CO2-lean fabric filter (FF) baghouse, exhaust fan, exhaust stack, and a sorbent conditioner. The flue
gas from the PC plant travels through an inlet fan into the CO2 adsorber. A cyclone separator sends
recycled sorbent back through the system. The CO2-lean flue gas then proceeds to a fabric filter
baghouse. The exhaust fan sends the CO2-lean flue gas to the stack.
Page 24
16
3.2.2 Account 6—Sorbent Regeneration
The sorbent regeneration account consists of the following: feed bin with rotary airlocks, sorbent
heaters, regenerators, sorbent coolers, and fin fan coolers. The spent sorbent flows to a feed bin with
a rotary air lock and then proceeds to a series of Solex Thermal Science equipment, which consists of
heater sections that use steam provided by the existing PC plant to regenerate the sorbent. The
regenerated sorbent then passes through a rotary air lock into a hopper and is then transferred back to
the adsorber area. Glycol fin-fan coolers provide additional cooling of the regenerated sorbent prior
to transfer.
3.2.3 Account 7—Preconditioning and CO2 Compression Train
The preconditioning and CO2 compression train consists of the following: condensate return pump,
condensate collection tank, four-staged intercooled CO2 compression skid, cooling water pump, and a
heat exchanger for heat recovery. CO2 from the compression train baghouse will flow to the
condensing heat exchanger skid, which will utilize condensate. Condensibles will be removed and the
CO2 will travel on to the intercooled four-stage compression skid.
3.2.4 Account 8—Sorbent Handling
The sorbent handling account consists of the following: fresh-sorbent unloading station, fresh-
sorbent storage silo, fresh-sorbent blower, regenerated-sorbent transfer blower, screw conveyor, and
bucket elevator/L-Path conveyor. The fresh sorbent will be unloaded and transferred via screw
conveyor and bucket elevator/L-Path conveyor to the fresh-sorbent storage silo. The fresh sorbent
will then be transferred to the sorbent conditioner for use in the adsorber via a blower.
3.2.5 Account 9—Waste-Sorbent Recovery and Handling
The waste-sorbent recovery and handling account consists of the following: waste-sorbent storage
silo, waste-sorbent transfer blower, CO2 lean baghouse sorbent transfer blower, separator, CO2
compression train baghouse, screw conveyor, and bucket elevator/L-Path conveyor. Waste sorbent
from the CO2 lean baghouse will be transferred via the waste-sorbent transfer blower to the waste-
sorbent storage silo for disposal. Transfer from the waste-sorbent storage silo to disposal will occur
via a screw conveyor and bucket elevator/L-Path conveyor. Sorbent from the CO2 lean baghouse can
also be transferred via the CO2 lean baghouse sorbent transfer blower to the sorbent conditioner,
depending on the operating conditions.
Page 25
17
3.2.6 Account 10—Balance-of-Plant Equipment
The balance-of-plant equipment account consists of the following: shop-fabricated tanks, general
service pump skids, and miscellaneous process plant equipment—all components that are not
included in the primary system itself, that are necessary, but not primary components.
3.2.7 Account 11—Electrical
The CO2 capture process requires significant modifications to any existing power plant. To
accommodate these additions as straight-forwardly as possible, the basis of the design considered the
installation of two large power transformers directly connected to an electrical transmission system.
A common transmission voltage leaving generating stations is 138 kilovolts, and it was chosen as the
primary voltage for supplying the CACHYS™
equipment.
Two 40 MVA transformers are arranged to provide power to redundant medium-voltage busses for
the 55 MW electrical load. The medium-voltage busses provide power to the large equipment loads,
such as the forced draft fans, induced draft fans, CO2 compressors, and to the low-voltage electrical
system. Much of the remainder of the equipment is expected to be powered from the low-voltage
electrical system. The electrical distribution equipment is expected to be located as centrally as
possible in a dedicated room.
3.2.8 Account 12—Instrumentation and Controls
The CACHYS™
equipment is expected to be delivered with the required instrumentation in each
equipment package. The balance-of-plant systems will require a separate allotment for
instrumentation, which has been included in the cost estimate as such.
The system operation is expected to be performed from the existing plant control room via a
distributed control system (DCS). The DCS make will be from the same manufacturer as the existing
plant; however, the system will be stand-alone. The size and complexity of the CACHYS™
process
warrants a separate data-highway network. The auxiliary operators will be dispatched to this plant
area for monitoring equipment from the existing control-room area.
3.3 General Arrangement
The general arrangement drawings were formulated using the PFD and the equipment sizing that was
compiled based off the Aspen Plus® model flowstreams. Using the required flowpath, the equipment
was laid out to accommodate the process with the main objective of utilizing gravity when possible
to reduce the footprint of the facility and eliminate handling systems that could potentially degrade
Page 26
18
the sorbent during transfer. With these two objectives in mind, bucket elevators, L-Path conveyors,
screw conveyors, and stacking of the Solex sorbent regeneration equipment was utilized. This
arrangement reduced the overall footprint. The general arrangement will consist of four trains of
process equipment.
Page 27
19
4.0 Major Equipment List
4.1 Major Equipment List
Major equipment items for the CO2 capture facility are shown in the following tables.
Accounts 1 through 4, which cover Sitework; Foundations and Concrete; Structural; and Piping,
Valves, and Supports, do not have any major associated equipment.
Accounts 10 through 12, which are Balance-of-Plant; Electrical; and Instrumentation and Controls,
require detailed engineering to determine type, design condition, and operating quantity. Therefore,
these accounts are not included in the major equipment list at this time.
4.1.1 Account 5—Flue Gas Cleanup
PFD Equipment
Number
Description Type
Design Condition
Operating
Quantity
1-001-FS001 Inlet Fan Centrifugal 4,000 Hp 4
1-002-AD001 CO2 Absorber Fluidized Bed 16'x20'x75' 4
1-004-SEP001 Cyclone Separator Cyclone 10' diameter 12
1-003-HUM001 Sorbent Conditioner Fluidized Bed 10' diameter 4
1-005-FIL-001 CO2 Lean Baghouse Fabric Filter 1,450,000 lb/hr 4
1-XXX-ID001 Exhaust Fan Centrifugal 1,000 Hp 4
1-006-STK001 Stack Concrete 250 ft 1
4.1.2 Account 6—Sorbent Regeneration
PFD Equipment
Number
Description Type Design Condition Operating
Quantity
1-007-BLW001 Spent Sorbent Transfer
Blower
Centrifugal 415 tons/hr 16
None Sorbent Feed Bin w/
Rotary Air Lock
Carbon Steel
415 tons/hr 16
1-008-HTR001 Sorbent Heater Solex 1.1 MMBtu/hr 16
1-011-REG001 Regenerator Solex 415 ton/hr 16
1-009-COL001 Cooler 1 Solex 1.1 MMBtu/hr 16
Page 28
20
1-010-COL001 Cooler 2 Solex 1.7 MMBtu/hr 16
None Fin Fan Cooler Glycol/air
7.1 MMBtu/hr 4
None Sorbent Collection Bin
w/ Air Lock
Rotary
415 ton/hr 16
4.1.3 Account 7—Preconditioning and CO2 Compression Train
PFD
Equipment
Number
Description Type Design Condition Operating
Quantity
1-017-
COMP001
CO2 Compression
Self-Contained Skid
Four Stage
Intercooled
2214 PSIA 4
1-014-HX001 Condensing Heat
Exchanger Skid for
Energy Recovery
Included in
compressor skid
49.5 MMBtu/hr 4
4.1.4 Account 8—Sorbent Handling
PFD Equipment
Number
Description Type Design Condition Operating
Quantity
None Fresh Sorbent
Unloading Station
Pneumatic
Unloader 500 ton/hr average 4
1-023-FSSIL001 Fresh Sorbent Storage
Silo Storage Silo 5 days of storage 4
1-024-BLW006 Fresh Sorbent Blower Centrifugal 500 tons/hr average 4
None Conveyor Screw 500 tons/hr average 4
None Elevator or L-Path
Conveyor Bucket 500 ton/hr average 4
4.1.5 Account 9—Waste Sorbent Recovery and Handling
PFD Equipment
Number
Description Type Design Condition Operating
Quantity
001-021-
WSSIL001
Waste Sorbent Storage
Silo Carbon Steel 5 days of storage 4
1-019-BLW004 Spent Sorbent Transfer
Blower Centrifugal 500 tons/hr average
4
Page 29
21
1-020-BLW005 Regenerated Sorbent
Transfer Blower Centrifugal 375 tons/hr 16
1-0XX-SEP02 Separator Cyclone 640 tons/hr 16
1-013-l002 CO2 Compression
Train Baghouse Fabric Filter 450,000 lbs/hr 4
Page 30
22
5.0 Heat Balance
5.1 Heat Balance Analysis
5.1.1 Overview
CO2 capture and compression systems impact the overall heat rate of a coal-fired power plant two
ways:
Consuming heat in the form of steam extraction from the steam turbine; and
Consuming station service to operate the equipment in the CO2 capture and compression system.
The majority of the station service is consumed in compressing the CO2 that is captured. Other
auxiliary uses, such as flue gas inlet/outlet fans, conveyors, pumps, etc., also consume station
service.
In developing the heat balance for the CACHYS™
system, Barr used the Cost and Performance
Baseline for Fossil Energy Plants, Volume 1, Revision 2, dated November 2010 as a reference
document. Case 12 from the report, developed for a 550 MW supercritical PC-fired power plant with
CO2 capture, was used for comparison.
5.1.2 CACHYS™ Process Requirements
The CACHYS™
system extracts steam for two different uses within the Solex-supplied sorbent
regenerator, as shown in Table 5.1. The steam will be supplied from the turbine at the exhaust of the
intermediate-pressure (IP) turbine section before it enters the low-pressure (LP) turbine section. It
should be noted that the CACHYS™
system requires much less heat in the form of steam than the
Econoamine System used in Case 12. This results in a major heat rate advantage for CACHYS™
.
Table 5.1 CACHYS™
Heat Duty Summary
PFD Identifier Pressure (psia) Temperature (°F) Heat Duty
(MMBtu/hr)
Q1 134.9 687.5 897.6
Case 12 75.0 556.3 2335.0
Page 31
23
A unique aspect of the CACHYS™ process is the heat recovery during regeneration. Condensed
steam that is used as a heating medium for regeneration will be recovered and returned as condensate
to the PC plant steam turbine system.
Additionally, the CACHYS™
system also recovers heat from the CO2 rich stream exiting the
regenerator using a condensing heat exchanger and returns LP steam to the steam turbine, as shown
in Table 5.2.
Table 5.2 CACHYS™
Heat Recovery Summary
PFD Identifier Heat Recovery Electrical Equivalence
(hp)
W4 19392
The net result is that the CACHYS™
system requires 547.6 MMBtu/hr compared to 2,335.0
MMBtu/hr for the Econoamine System used in Case 12.
5.1.3 CACHYS™ Auxiliary Power Requirements
The auxiliary power requirements are shown in Table 5.3.
Table 5.3 Auxiliary Power Summary
Item Use (kW)
CO2 Compressors 39,900
Flue Gas Inlet Fans 11,300
Flue Gas Exhaust Fans 2,800
Miscellaneous Balance of Plant 1,000
Total 55,000
5.1.4 Plant Performance Summary
A plant performance comparison between Case 12 (DOE report) and CACHYS™
is contained in
Table 5.4. The Case 12 auxiliary power uses are adjusted where noted. The table describes the impact
of sending heat to the CACHYS™
system and the effects of the reduced auxiliary power usage.
Page 32
24
Table 5.4 Plant Performance Summary
Case 12 CACHYS™
Steam Turbine Power (kW) 662,880 773,2001
Auxiliary Load Summary (kW)
Coal Handling/Conveying 510 510
Pulverizers 3,850 3,850
Sorbent Handling (Scrubber) 1,250 1,250
Ash Handling 740 740
Primary Air Fans 1,800 1,800
Forced Draft Fans 2,300 2,300
Induced Draft Fans 11,120 11,120
Selective Catalyst Reduction
(SCR)
70 70
Baghouse 100 100
Wet Flue-Gas Desulfurization
(FGD)
4,110 4,110
Miscellaneous 2,000 2,000
Steam Turbine Auxiliaries 400 400
Condensate Pumps 560 560
Circulating Water Pumps 10,100 9,0572
Ground Water Pumps 910 480
Cooling Tower Fans 5,230 6,2762
Transformer Losses 2,290 2,7433
Total Power Block (kW) 47,340 47,800
CO2 System 65,490 55,000
Total Auxiliary Use (kW) 112,830 102,800
Net Power (kW) 549,970 670,400
Net Plant Efficiency 28.4% 34.6%
Page 33
25
Net Plant Heat Rate (HHV)
(BTU/kWh)
12,002 9,859
1 Steam turbine output increased due to the reduced heat requirements of the CACHYS™ system.
2 Circulating water pump and cooling tower kW adjusted down because of elimination of amine system used in Case 12, and
adjusted up to reflect higher turbine exhaust flows for the CACHYS™ system.
3 Transformer losses increased due to larger steam turbine output.
Page 34
26
6.0 Capital Cost Estimate
6.1 Qualification of Estimated Cost
The feasibility-level construction cost estimate provided in this report is made on the basis of Barr’s
experience and qualifications and represents our best judgment as experienced and qualified
professionals familiar with the project. This opinion is based on project-related information available
to Barr at this time, current information about probable future costs, and a concept-level design of the
project. The opinion of construction cost will likely change as more information becomes available
and further design is completed. In addition, since the eventual cost of labor, materials, equipment, or
services furnished by others; the contractor’s methods of determining prices; competitive bidding;
and market conditions are unknown; Barr cannot and does not guarantee that proposals, bids, or
actual construction costs will not vary from the opinion of probable construction cost presented in
this report. Greater assurance as to the probable construction cost can be achieved through additional
design to provide more complete project definition.
6.2 Estimate Type
The cost estimate corresponds to a Class 5 estimate class (AACE International Recommended
Practice No. 18R-97) for the process industries. This estimate classification is characterized by
limited project definition and the wide-scale use of scaling and power-industry experience to
calculate costs. A Class 5 has an end use for screening and feasibility studies, with an accuracy range
of +100% to -50%. These parameters for a Class 5 estimate are shown Table 6.1.
Page 35
27
Table 6.1 AACE Generic Cost Estimate Classification Matrix
6.3 Cost Breakdown
Feasibility-level cost estimates are presented for the following construction features required for the
project:
1. Sitework
2. Foundations and concrete
3. Structural
4. Piping, valves, and supports
5. Flue gas cleanup
6. Sorbent regeneration
Primary
Characteristic Secondary Characteristics
Level of Project
Definition
End Usage Methodology Accuracy
Range
Preparation
Effort
Estimate
class
Expressed as % of
complete project
definition
Typical purpose
of estimate
Typical
estimating
method
Typical +/-
range
relative to
best range
index of
1[a]
Typical
degree of
effort
relative to
least cost
index of 1[b]
Class 5 0% to 2% Screening or
feasibility
Stochastic or
judgment
10 to 20 1
Class 4 1% to 5% Concept study
or feasibility
Primarily
stochastic
5 to 10 2 to 4
Class 3 10% to 40% Budget,
authorization or
control
Mixed but
primarily
stochastic
3 to 6 3 to 10
Class 2 30% to 60% Preliminary
estimate
Primarily
deterministic
2 to 3 5 to 20
Class 1 50% to 100% Check estimate
or engineer’s
estimate
Deterministic 1 10 to 100
Notes:
[a] If the range index value of “1” represents +10/-5%, then an index value of 10 represents +100/-50%.
[b] If the cost index value of “1” represents 0.005% of project cost, then an index value of 100 represents 0.5% of project cost.
Page 36
28
7. Preconditioning and CO2 compression train
8. Sorbent handling
9. Waste-sorbent recovery and handling
10. Balance-of-plant equipment
11. Electrical
12. Instrumentation and controls
6.4 Cost Estimate Methodology
The total plant cost (TPC) was determined to estimate the CACHYS™
process cost. The TPC is the
sum of the bare erected cost (BEC) for the process, plus the cost of the engineering, procurement,
and construction (EPC) contractor, as well as process and project contingencies. The TPC is an
overnight cost calculated in 2012 dollars, with no adjustments for escalation in future years.
The BEC consists of the cost of equipment and materials, as well as new on-site facilities, site
infrastructure, and balance-of-plant equipment necessary to support the CACHYS™
process. It
includes the direct and indirect construction labor required for installation. The BEC contains no
contingency.
The EPC costs include detailed design and building-related permits obtained by the contractor, as
well as project and construction management costs. EPC costs are based on a construction-
management approach utilizing a prime contractor with multiple subcontractors. This approach
provides the owner with greater scope control and flexibility, while mitigating the risk premium
typically included in a traditional EPC lump-sum pricing structure. A construction allowance for
items, such as price inflation over the duration of the construction period, casual overtime, and
incidentals, has been included in the EPC cost.
The scope estimate is complete for CO2 capture by hybrid sorption using solid sorbents from the flue
gas stream of an existing, hypothetical, 600 to 700 MW coal-fired power plant located on a generic,
greenfield site in moderate climates within the United States. Cost databases were provided by
Barton Malow Company, an EPC construction contractor based in southeast Michigan. The battery
limits are the system and structures depicted in the general arrangement drawings, PFD, and major
equipment list.
Page 37
29
Process steam, compressed air, water, and other utilities are assumed to be available for tie-in
immediately adjacent to the CACHYS™
system structures. Station power is assumed to be available
for tie-in at the high side of the auxiliary transformers for the CACHYS™
system.
No costs are included for specific modifications to the existing site (e.g., enlarging property
boundaries, additional roads, stormwater management, engineered fill, etc.), or modifications to
existing plant systems, such as providing steam and power to the location of the CACHYS™
system.
The site is considered to be Seismic Zone 1, relatively level, and free from hazardous materials,
archeological artifacts, or soil conditions requiring excessive treatment, such as rock, groundwater,
and unstable materials.
6.5 Quantities and Allowances
High-level quantity takeoffs for major system components, such as sorbent regeneration, flue gas
cleanup, and conveyance systems, were developed from the general arrangement drawings and the
PFD.
Where current project definition did not allow for the determination of itemized construction
quantities’ bulk items, such as sitework, foundations, piping, and electrical, allowances were
determined using indicative projects considered to be similar in scope and level-of-effort. These
projects were:
Retrofit of an existing 480 MW coal-fired power plant with installation of a new circulating
fluidized bed scrubber in the southern United States;
Installation of a new flue gas desulfurization unit that included the conversion of an existing
electrostatic precipitator to a pulse-jet fabric filter, and installation of a new fly ash collection
system at a 500 MW coal-fired power plant in the western United States;
Retrofit of an existing 480 MW coal-fired power plant with installation of a new pulse-jet
fabric filter in the midwestern United States; and
Retrofit of an existing 3200 MW coal-fired power plant with installation of a selective
catalytic reduction (SCR) system in the midwestern United States.
Pricing for major equipment was identified as follows:
Original equipment manufacturer (OEM) initial pricing estimates from Solex for sorbent
regeneration system;
OEM pricing for CO2 compression system; and
Historical OEM pricing for similar major equipment from power plant retrofits.
Page 38
30
6.6 Contingency
Contingency represents an allowance to cover unknowns, uncertainties, and/or unanticipated
conditions that are not possible to evaluate adequately from the information at hand at the time the
cost estimate is prepared, but must be represented by a sufficient cost to cover the identified risks.
Contingency relates to a known, defined project scope and is not used to predict future project scope
or schedule changes. Contingency will normally decrease as more design information is known. This
section summarizes important cost-estimating considerations related to cost contingency.
Contingencies, as used in this estimate, are intended to help identify an estimated construction cost
amount for the items included in the current project scope. The contingency percentage includes
process contingency and project contingency. These contingency amounts are based on AACE
guidelines and professional judgment considering the level of design completed, the complexity of
the work, and uncertainties in quantities and unit prices. The contingency includes the estimated cost
of ancillary items not currently identified in the quantity estimates and allowances, but commonly
identified in more detailed design and required for completeness of the work.
Contingencies are assigned to the cost estimate of each project feature on the basis of engineering
judgment and on the relative completeness of project definition. Contingency, as used in this cost
estimate, will decrease with future design efforts. The contingency provided with the estimate does
not account for:
Changes in labor availability or productivity
Delays in equipment deliveries
Changes in current industry standards or regulations
Major changes in quantities
Major changes in unit pricing
Major changes in scope during detailed design or construction
Major changes or revisions to the design basis
Costs that may result from actual site conditions differing from generic site conditions
assumed in this estimate
Costs that result from construction change orders
Costs that result from sequencing or expediting work to avoid critical path slippage
Costs that result from possible project schedule slippage
Costs that result from differing economic conditions or future cost growth
Page 39
31
Costs related to plant performance during and after start-up
6.6.1 Process Contingency
Process contingency provides for uncertainty in the cost estimate related to the technology’s
maturity. This technology is currently unproven at the commercial scale in power-generation
applications. However, many aspects of the project use current proven and accepted technology for
balance-of-plant and structural aspects. Therefore, process contingencies are applied to individual
aspects of the cost estimate based on the current status of the technology for those individual aspects.
AACE recommends the following guidelines summarized in Table 6.2 for the amount of process
contingency to apply.
Table 6.2 AACE Guidelines for Process Contingency
Technology Status Process Contingency
(% of Associated Process Capital)
New concept with limited data 40+
Concept with bench-scale data 30-70
Small pilot plant data 20-35
Full-sized modules have been operated 5-20
Process is used commercially 0-10
Process contingencies used in this estimate were assigned as follows:
New technology systems and components directly related to sorbent regeneration and waste
conveyance used 50% due to uncertainties associated with scaling-up a concept based
primarily on bench-test data.
Conventional systems and components in support of the overall CO2 process used 25% due to
adaption of existing power-industry, commercially-available equipment applications to new
bench-tested technology.
Sitework, foundations, and concrete used no contingency based upon relative certainty these
conventional applications can be adapted to the new technology with little or no risk.
6.6.2 Project Contingency
Project contingency compensates for cost uncertainties and construction risk associated with final
design and construction that exists until the project is completed. Uncertainty in early stages of
project planning and design, especially during the feasibility-study phase, are greater due to risk
Page 40
32
factors, such as limited project definition, uncertainty regarding design and analysis assumptions,
unforeseen constraints and constructability issues, construction schedule, and other construction risk
factors. In general, uncertainty will decrease as greater definition is developed and more detailed
information becomes available.
At this stage in the project, the design is less than 2% complete, and constructability has not been
evaluated due to insufficient design detail. Therefore, the range of uncertainty of TPC is considered
to be high. AACE suggests that project contingency for a Class 5 screening or feasibility study
estimate should be 15 to 35% of the sum of BEC, EPC, and process contingency. Due to the
relatively limited basis upon which this estimate is developed, a project contingency of 30% has been
applied for each aspect of the cost estimate.
6.7 Capital Cost Summary
The capital cost for the CACHYS™
system is summarized in Table 6.3.
Table 6.3 CACHYS™
System Capital Cost Summary
The cost per kilowatt-hour for the CACHYS™
system at $1,004/kW was compared to Cases 11 and
12 of the Cost and Performance Baseline for Fossil Energy Plants, Volume 1, Revision 2, dated
November 2010 as a reference document. Cases 11 and 12 were developed for a 550 MW
supercritical PC-fired power plant. Case 11 was for a plant without CO2 capture, and has a TPC unit
cost of $1,647/kW. Case 12 includes CO2 capture, and has a TPC of $2,913/kW. The difference in
unit cost between Case 11 and Case 12 of $1,266/kW represents the carbon capture costs between the
two cases. For the purpose of comparison, the unit cost of the CACHYS™
system at $1,004/kW is
less than the carbon capture technology used for Case 12 at $1,266/kW.
Category Cost $/kW
Bare Erected Cost $273,512,157 $517
EPC Cost $125,579,386 $238
Process Contingency $118,362,448 $224
Project Contingency $155,258,478 $294
Total Plant Cost $672,786,738 $1,004
Page 41
33
7.0 Operating Cost Estimate
7.1 Overview
Barr evaluated the yearly operation and maintenance (O&M) costs associated with the CACHYS™
system. The main components of the yearly operating cost are:
O&M labor
Maintenance materials
Sorbent
The O&M labor was estimated using similarly-sized projects, such as coal-fired power plants,
operating experience, and scrubber installations. The CACHYS™
system has very similar
components and will require highly-skilled O&M personnel. Personnel will be required to understand
the following devices:
Large fans
CO2 compression
Fluidized beds
Conveyors
Fabric filters
Pumps and piping
Maintenance materials were also estimated using similarly-sized projects. The major maintenance
materials are filter bags for the two fabric filters and wear parts associated with the many sorbent
conveyors.
The largest single operating expense is the cost of the CO2 sorbent estimated at $1.00/lb.
Approximately 6,500 tons/hr of sorbent are moved within the CACHYS™
system. It is estimated that
2 tons/hr are rejected to waste. The waste sorbent is assumed to be sold as fertil izer supplement at
$0.50/lb.
Page 42
34
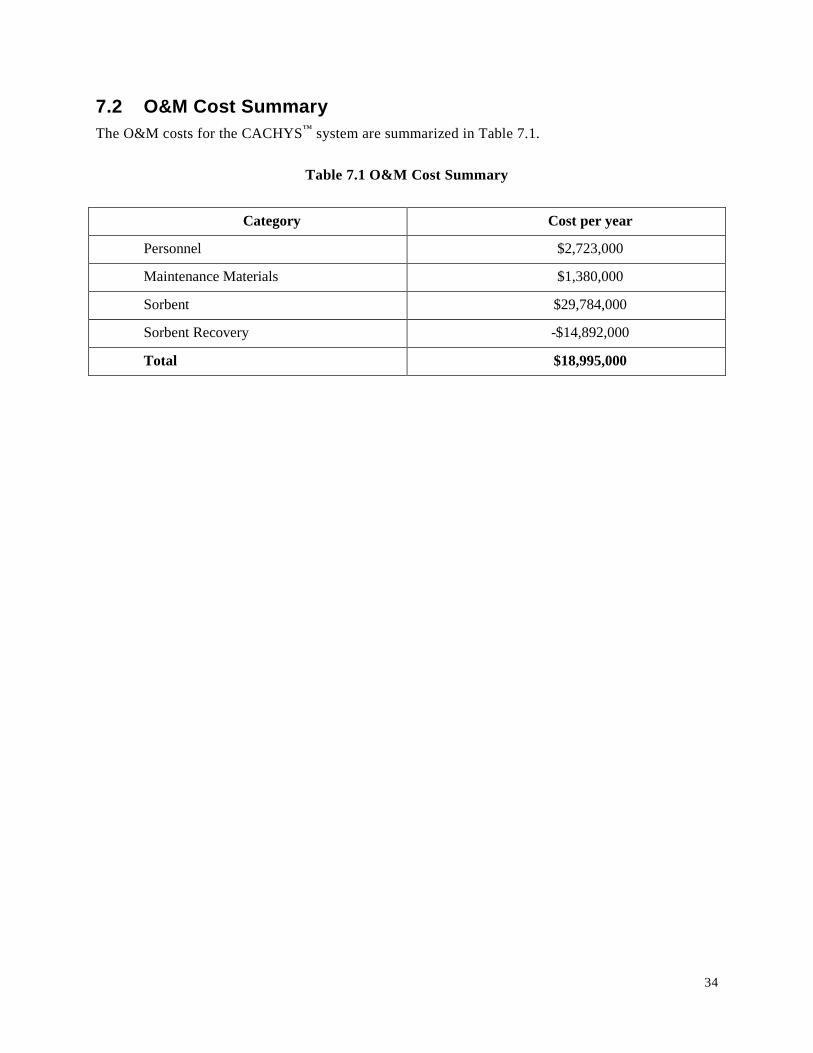
7.2 O&M Cost Summary
The O&M costs for the CACHYS™
system are summarized in Table 7.1.
Table 7.1 O&M Cost Summary
Category Cost per year
Personnel $2,723,000
Maintenance Materials $1,380,000
Sorbent $29,784,000
Sorbent Recovery -$14,892,000
Total $18,995,000
Page 43
35
8.0 Levelized Cost of Electricity and Cost of CO2 Capture
8.1 Overview
The major inputs to developing the levelized cost of electricity (LCOE) and the cost per ton of CO 2
captured are the:
PFD
Heat balance diagram
Capital cost of the carbon capture system
O&M cost of the carbon capture system
A methodology for turning these inputs into an LCOE and cost per ton of CO2 captured is contained in
Attachment 3 of the FOA (DE-FOA-0000403) included as Exhibit B of this report.
Barr used this methodology to calculate the following parameters described by the FOA.
Parasitic power losses
LCOE
Cost of CO2 capture—$/ton
Percentage decrease in PC plant efficiency
8.2 Parasitic Power Losses
Parasitic power losses as defined by the FOA are described below:
Power loss due to carbon capture system auxiliary systems, such as inlet blower, exhaust blower,
conveyors, pumps, cooling systems, and miscellaneous systems;
Power loss due to the motor associated with the CO2 compression system; this is the largest single
electrical user in the carbon capture system; and
Power lost due to the steam requirements of the carbon capture system. CACHYS™
uses IP steam
from the steam turbine for direct and indirect heating of the sorbent regenerator. CACHYS™
also
returns LP steam to the steam turbine from a heat-recovery loop in the carbon capture system.
For comparison purposes, Case 12 from the DOE report was also calculated. Note the effect of the
reduced CACHYS™
steam requirements lessening the Equivalent Power of Steam Use. The results of
the calculations are shown in Table 8.1.
Page 44
36
Table 8.1 Parasitic Power Losses
Category Case 12 (MW) CACHYS™
(MW)
CO2 Capture System
Auxiliaries
20.6 15.1
CO2 Compression 44.9 39.9
Equivalent Power of Steam
Use
156.7 46.2
Total Power Loss 222.2 101.2
8.3 Levelized Cost of Electricity and Steam
The FOA provides baseline costs for steam and electricity without CO2 capture. The following
equations were used to calculate the levelized cost of steam and electricity. Costs for Case 12 and
CACHYS™
were calculated using the following formulas:
Cost of electric power (mills/kWh) = 0.3073 x (total power loss in MW e) + 64
Cost of steam ($/1000 lb) = 0.0280 x (total power loss in MWe) + 5.83
The results of the calculations are shown in Table 8.2.
Table 8.2 Levelized Cost of Electricity and Steam
Base Case
FOA
Appendix 3
Case 11
DOE
Report
Case 12
FOA
Appendix 3
CACHYS™
FOA Appendix 3
% Increase Over
Base Case FOA
Appendix 3
Electricity
(mills/kWh)
64.0 74.7 132.28 95.1 48.6
Steam ($/1,000
lbs)
5.83 NA 12.05 8.66 48.5
8.4 Cost of Carbon Dioxide Capture ($/ton)
The FOA outlines the methodology for calculating the cost of CO2 capture expressed in $/ton. The
inputs are described below:
Total O&M costs—this item is composed of both fixed and variable components (see Section 7).
The largest component is approximately $15 million per year for the sorbent;
Page 45
37
Capital charge for the CO2 system—this item represents the yearly cost recovery needed to
support the capital investment as shown in the equation below; and
CO2 captured in tons using the PFD.
The capital Charge [$/yr] is equivalent to the Capital Charge Factor multiplied by the Capital Cost,
where:
Capital Charge Factor = 17.5% per year; and
Capital Cost = $672.8 million.
The results are shown in Table 8.3.
Table 8.3 Cost of CO2 Capture Summary
Cost Per Year
Total O&M $18,995,000
Capital Charge $117,740,000
Total Cost $136,735,000
Tons Per Year
CO2 Captured 4,405,200
Cost Per Ton
Cost of CO2 Capture $31.04/ton
8.5 Pulverized Coal Plant Efficiency
Barr used Case 12 from the report Cost and Performance Baseline for Fossil Energy Plants, Volume
1, Revision 2, dated November 2010 as a reference for comparison purposes. The results of the
comparison are shown in Table 8.4.
Table 8.4 Plant Efficiency Summary
Thermal Efficiency (HHV)
Base Efficiency Case 12 28.4 %
Efficiency CACHYS™
34.6 %
Percentage Point Increase 6.2%
Page 46
38
9.0 Sensitivity Cases
9.1 Sensitivity Cases
Three sensitivity cases were run subsequent to the CACHYSTM
Base Case being developed. The
three cases are:
Reducing the net output to 550,000 kWe
Doubling the amount of steam used to regenerate the CACHYSTM
sorbent
Reducing the value of the spent sorbent from $0.50/lb to $0/lb
The first sensitivity case reduced the net power output to 550,000 kWe. The CACHYSTM
Base Case
was developed at a net output of 670,400 kWe. To be consistent with other DOE studies , cases were
developed representing a net output of 550,000 kWe.
The results comparing the CACHYSTM
Sensitivity Case to DOE Case 12 are shown in Table 9.1.
Table 9.1 Sensitivity Case Summary
Case 12 CACHYS™
Sensitivity
Case – 550,000 kWe
net
Steam Turbine Power
(kWe)
662,880 634,340
Net Power (kWe) 549,970 550,000
Equivalent Steam Use
(kW)
156.7 37.9
Net Plant Efficiency %
(HHV)
28.4 34.6
LCOE (mills/kWh) 132.8 89.5
The second sensitivity represent a case in which the sorbent material requires more steam than
expected, it was decided to double the amount of indirect steam required to regenerate the sorbent
Page 47
39
from 625 MMBtu/hr to 1250 MMBtu/hr. For the CACHYSTM
Base Case (670,400 kWe), this raised
the LCOE by approximately 13%. This case was not run at the 550 MW level, but the effect would
be very similar.
The third sensitivity case reduced the value of the spent sorbent to $0/lb. A set of sensitivity runs
were conducted for both the CACHYSTM
Base Case and 550 MW Case related to the value of the
spent sorbent. The Base Case assumed the sorbent had a residual value of $0.50/lb and in the
Sensitivity Case it was assumed to have zero value.
The assumption raised the estimated cost of CO2 capture from $31.04/ton to $34.42/ton for the Base
Case. The assumption raised the estimated cost of CO2 capture from $32.81/ton to $36.19/ton for the
550 MW Case.
Page 48
A
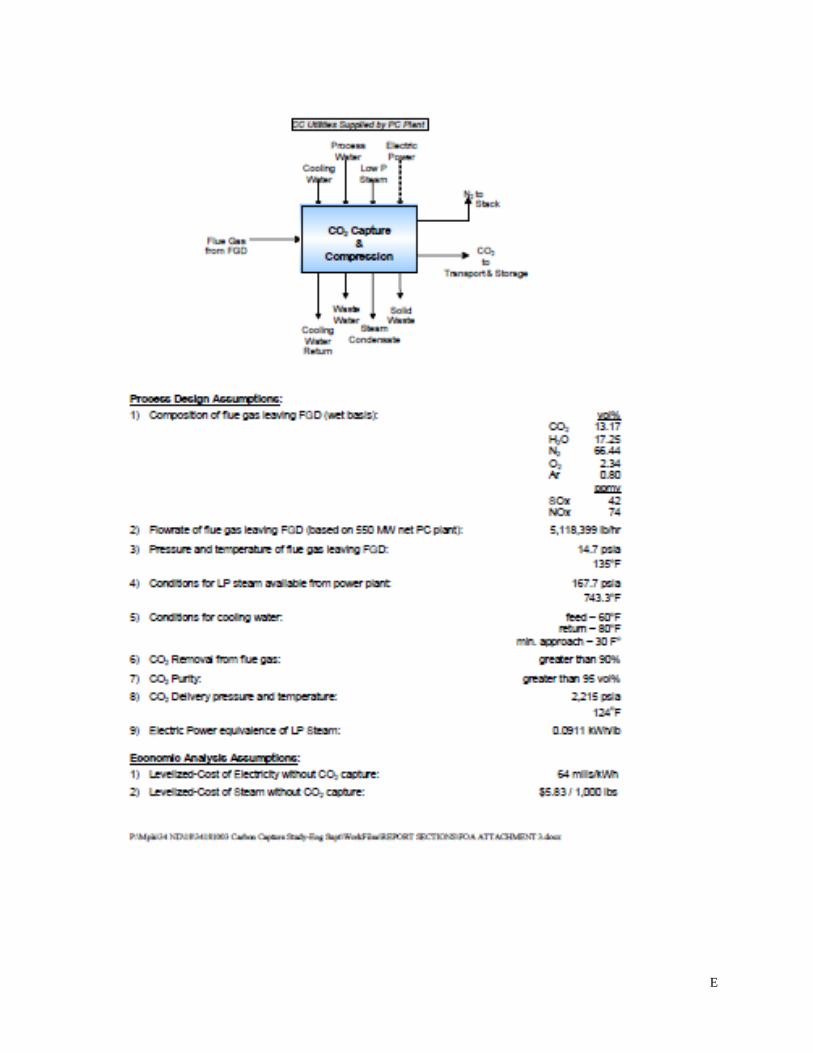
Exhibit A: Process Flow Diagram and Stream Tables
Page 50
C
Exhibit B: Levelized Cost of Electricity
Page 59
L
Exhibit C: Capital Cost Estimate
Page 60
M
Exhibit D: Sensitivity Case Calculations
Page 64
Q
Exhibit E: Supporting Calculations for 550 MW Net Output Sensitivity Case and Zero Value Sorbent Sensitivity Case