NASA Contractor Report 186027 Preliminary Design of an Intermittent Smoke Flow Visualization System Donald T. Ward and James H. Myatt (NASA-CR-186027) PRELIMINARY DESIGN OF AN INTERMITTENT SMOKE FLOW VISUALIZATION SYSTFH (Texas AgM Univ.) 65 p N93-28693 unclas G3/05 0171942 GRANT NAG-2651 June 1993 National Aeronautics and Space Administration https://ntrs.nasa.gov/search.jsp?R=19930019504 2018-05-19T21:18:59+00:00Z
Transcript
NASA Contractor Report 186027
Preliminary Design of anIntermittent Smoke FlowVisualization System
Donald T. Ward and James H. Myatt
(NASA-CR-186027) PRELIMINARYDESIGN OF AN INTERMITTENT SMOKEFLOW VISUALIZATION SYSTFH (TexasAgM Univ.) 65 p
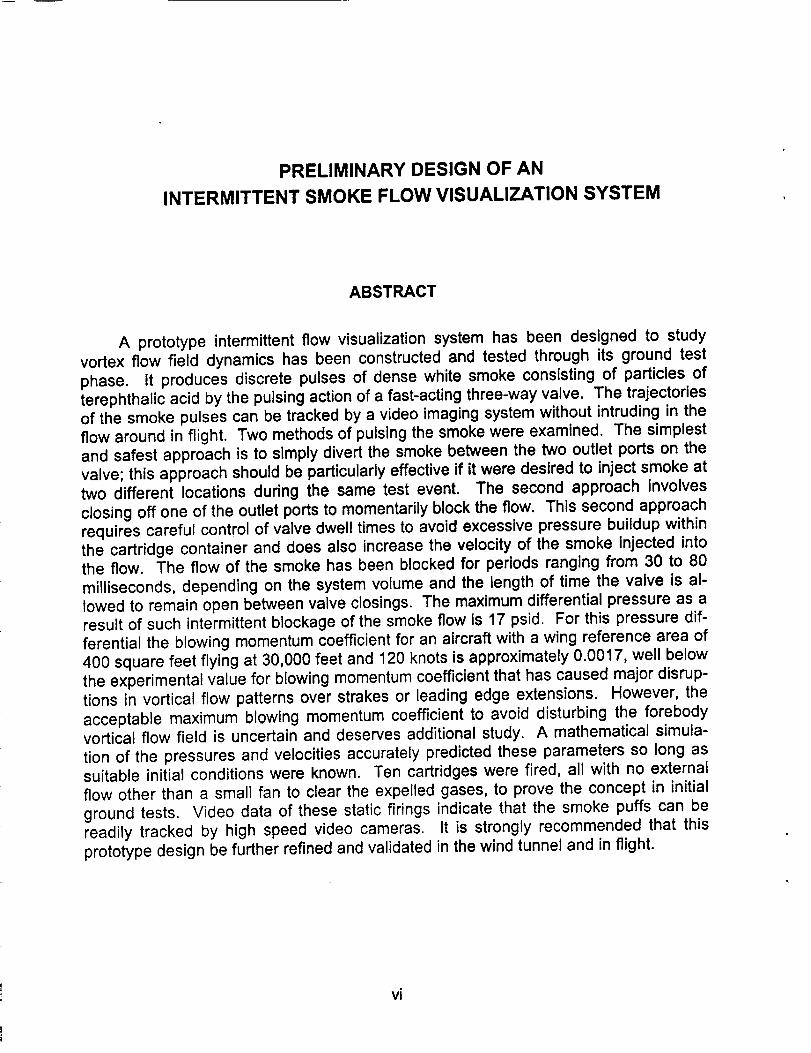
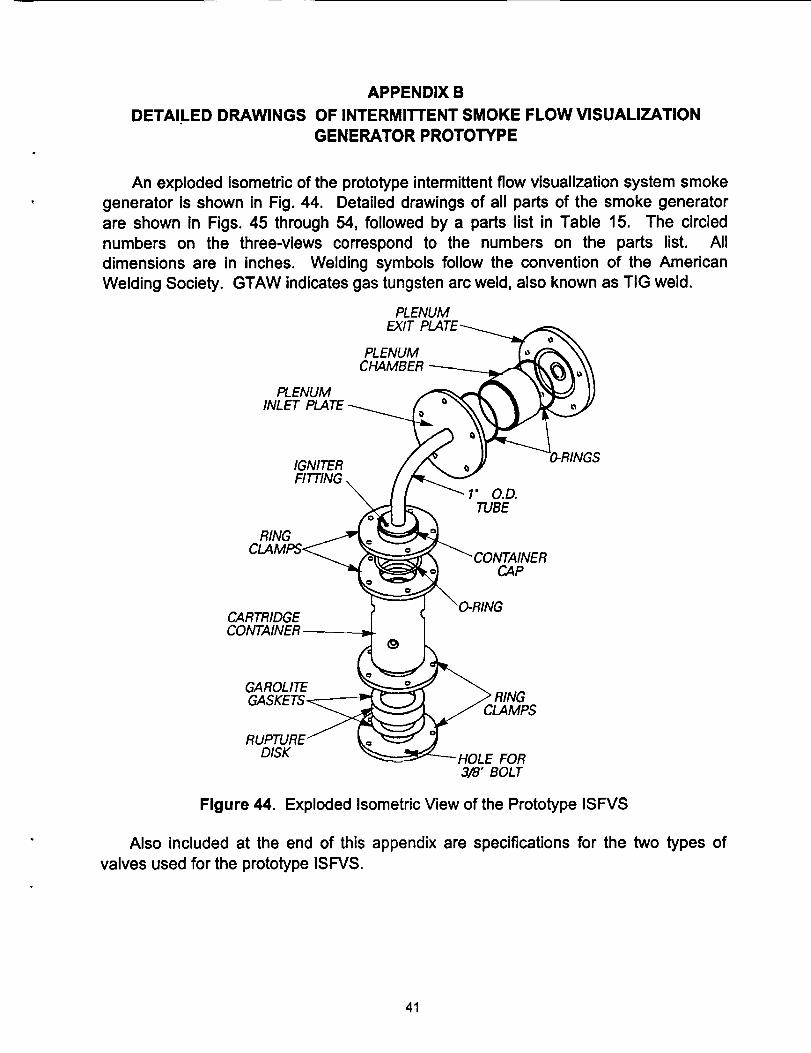
A prototype intermittent flow visualization system has been designed to study
vortex flow field dynamics has been constructed and tested through its ground testphase. It produces discrete pulses of dense white smoke consisting of particles ofterephthalic acid by the pulsing action of a fast-acting three-way valve. The trajectoriesof the smoke pulses can be tracked by a video imaging system without intruding in theflow around in flight. Two methods of pulsing the smoke were examined. The simplestand safest approach is to simply divert the smoke between the two outlet ports on thevalve; this approach should be particularly effective if it were desired to inject smoke attwo different locations during the same test event. The second approach involves
closing off one of the outlet ports to momentarily block the flow. This second approachrequires careful control of valve dwell times to avoid excessive pressure buildup withinthe cartridge container and does also increase the velocity of the smoke injected intothe flow. The flow of the smoke has been blocked for periods ranging from 30 to 80milliseconds, depending on the system volume and the length of time the valve is al-lowed to remain open between valve closings. The maximum differential pressure as aresult of such intermittent blockage of the smoke flow is 17 psido For this pressure dif-ferential the blowing momentum coefficient for an aircraft with a wing reference area of400 square feet flying at 30,000 feet and 120 knots is approximately 0.0017, well below
the experimental value for blowing momentum coefficient that has caused major disrup-tions in vortical flow patterns over strakes or leading edge extensions. However, theacceptable maximum blowing momentum coefficient to avoid disturbing the forebodyvortical flow field is uncertain and deserves additional study. A mathematical simula-
tion of the pressures and velocities accurately predicted these parameters so long assuitable initial conditions were known. Ten cartridges were fired, all with no externalflow other than a small fan to clear the expelled gases, to prove the concept in initialground tests. Video data of these static firings indicate that the smoke puffs can bereadily tracked by high speed video cameras. It is strongly recommended that this
prototype design be further refined and validated in the wind tunnel and in flight.
vi
Symbol
A
AOA or c_
Cp o
Cg
E
F
H
M
N
P
Q
R
S
SFCH
T
V
V
W
e
h
m
q
r
t
U
X
Y
Z
e
p
G
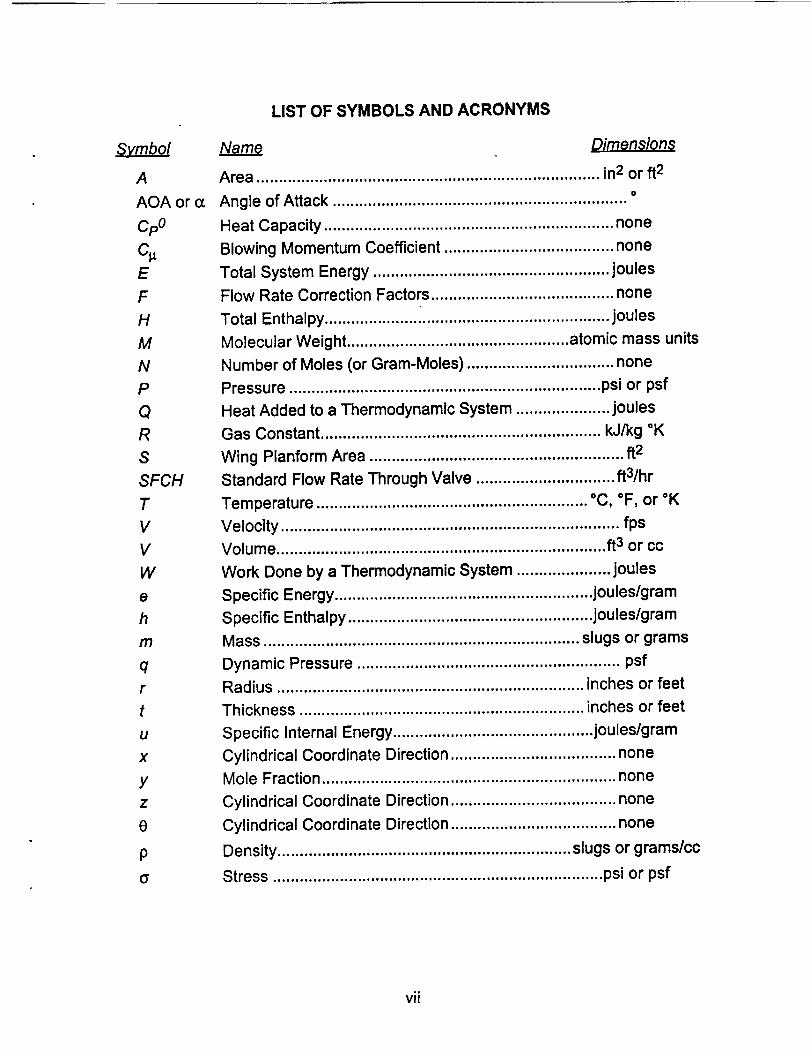
LIST OF SYMBOLS AND ACRONYMS
Name Dimensions
Area ............................................................................. in2 or ft 2
Angle of Attack .................................................................. °
Cylindrical Coordinate Direction ..................................... none
Cylindrical Coordinate Direction ..................................... none
Density .................................................................. slugs or grams/cc
Stress .......................................................................... psi or psf
vii
,_ubscriot
G
T
R
SG
T
actual
e
f
i
k
rn
max
rain
n
o
P
ref
S
1,2 ....
0
Oo
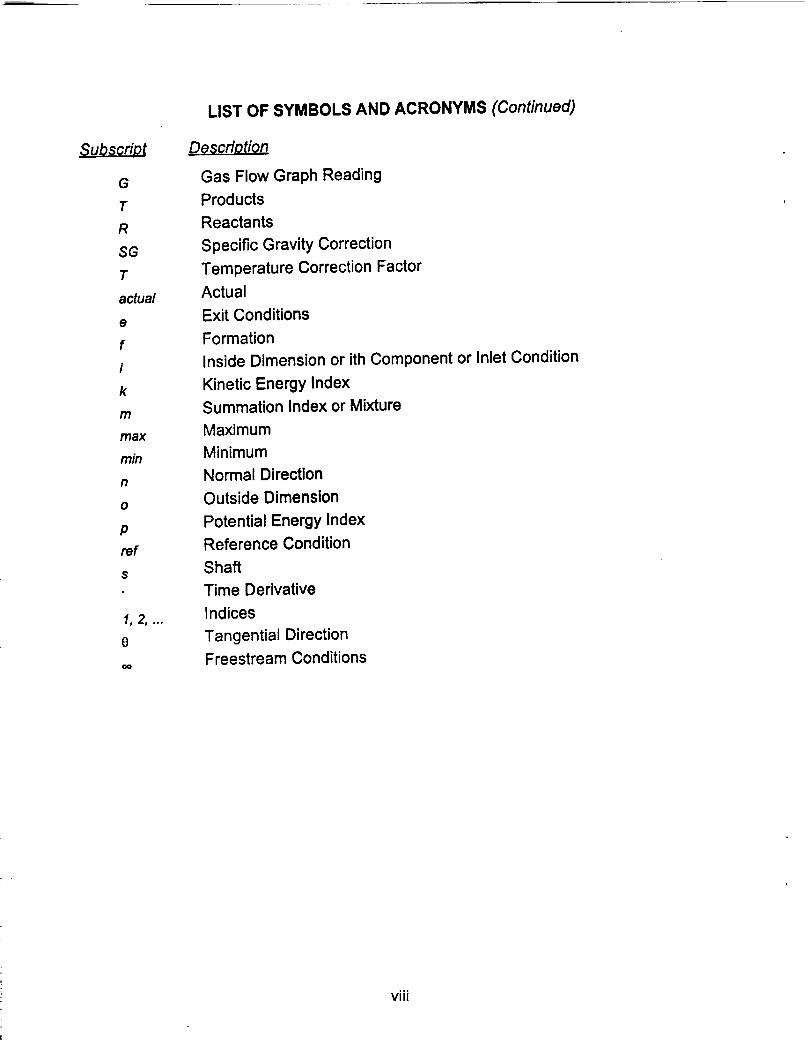
LIST OF SYMBOLS AND ACRONYMS (Continued)
Gas Flow Graph Reading
Products
Reactants
Specific Gravity Correction
Temperature Correction Factor
Actual
Exit Conditions
Formation
Inside Dimension or ith Component or Inlet Condition
Kinetic Energy Index
Summation Index or Mixture
Maximum
Minimum
Normal Direction
Outside Dimension
Potential Energy Index
Reference Condition
Shaft
Time Derivative
Indices
Tangential Direction
Freestream Conditions
viii
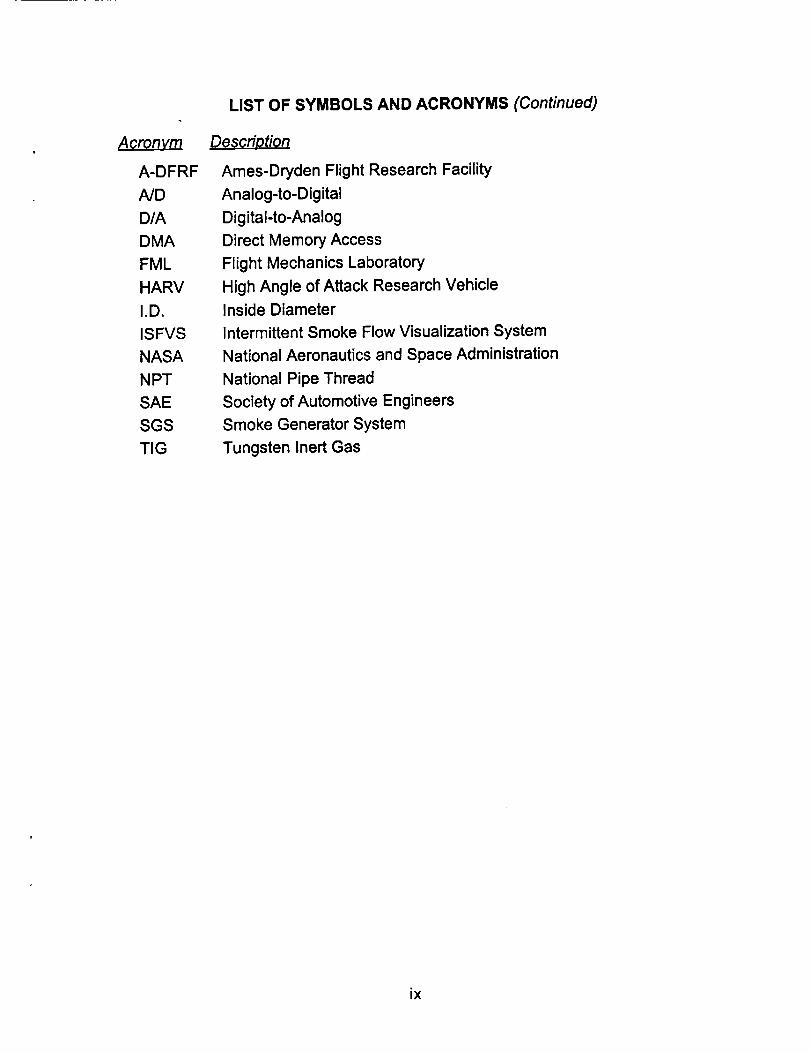
Acronym
A-DFRF
ND
D/A
DMA
FML
HARV
I.D.
ISFVS
NASA
NPT
SAE
SGS
TIG
LIST OF SYMBOLS AND ACRONYMS (Continued)
Descriotion
Ames-Dryden Flight Research Facility
Analog-to-Digital
Digital-to-Analog
Direct Memory Access
Flight Mechanics Laboratory
High Angle of Attack Research Vehicle
Inside Diameter
Intermittent Smoke Flow Visualization System
National Aeronautics and Space Administration
National Pipe Thread
Society of Automotive Engineers
Smoke Generator System
Tungsten Inert Gas
ix
PRELIMINARY DESIGN OF AN
INTERMITTENT SMOKE FLOW VISUALIZATION SYSTEM
INTRODUCTION
Aircraft designers solving problems associated with high angle of attack (AOAs)
maneuvering rely heavily on data obtained in flight. The High AOA Research Programat the NASA Ames-Dryden Flight Research Facility (A-DFRF) is currently investigating
the high AOA characteristics of a modified F/A-18 and the X-29. The purpose of this
ambitious program is to provide high AOA flight data, confirm theoretical methods,
identify and solve control problems, and validate agility measures of merit. These
experiments will help aircraft designers build aircraft which are highly maneuverable,
even in flight regimes where current fighters cannot safely operate 1.
A major part of this effort is focused on the vortical flow developed on the forebody
and leading edge extensions of the F/A-18. A smoke generating system has been in-
stalled on the F/A-18 test vehicle or the High Alpha Research Vehicle (HARV). This
smoke system releases a continuous stream of dense white smoke through ports in theskin of the aircraft into the airflow upstream of the area of interest. The smoke then
follows the airflow as it travels aft over the aircraft, allowing visualization of the vortices.
The dynamic positions of the vortices and the burst point locations can be accurately
determined by analyzing video tape and motion picture film of the smoke.
The HARV Smoke Generator System (SGS) uses chemical cartridges which were
designed and manufactured by the U.S. Army Chemical Research, Development, and
Engineering Center. They consist of metal containers filled with a pyrotechnic chemicalmixture which is ignited with electric matches 2. The chemical mixture contains tereph-
thalic acid (also known as 1,4-benzenedicarboxylic acid), sugar, potassium chlorate,
and other ingredients in small amounts to improve handling qualities and burn rate. The
sugar (fuel) and potassium chlorate (oxidizer) react to produce heat. The heat causes
the terephthalic acid to vaporize. The vapor causes a pressure increase inside the car-
tridge, forcing the vapor out of the cartridge. Once away from the heat of the reaction
the gas cools until it condenses 10 at a temperature of 572 ° F4,5 to form the solid parti-
cles which make up the visible smoke.
Six cartridges are mounted in a housing and placed in the gun bay of the F/A-18
HARV. The gun bay was chosen because of its location near the origin of the vortex
cores, and it is also designed to withstand high temperatures. The smoke from each of
the six cartridges is ducted to a common plenum chamber. The smoke is then ducted
to a port in the aircraft skin where it is released into the air flow upstream of the area of
interest. All tubing from the SGS to the exterior ports is 0.93 inches inside diameter.
The SGS has been successfully tested in flight at altitudes ranging from 18,000 to
33,000 feet, indicated airspeeds of 100 to 140 knots, and while performing several ma-
neuvers, including steady state flight at an angle of attack of 20 ° and in angle of attack
sweeps between 15 ° and 35 °. Firing two cartridges simultaneously produced smoke of
sufficient density for approximately thirty seconds. The smoke trajectory was recorded
using video cameras and still cameras mounted on the test aircraft, and it provided
ample contrast for identifying the vortex core. However, it was not possible to obtain
video datafrom any video camera for which the sun was in the field of view, which can
occur during wind-up turns or other maneuvers where a constant heading is not
maintained. Multiple cameras mounted in different locations should reduce the amount
of lost data. The automated data reduction hardware�software system used at TexasA&M University 6 permits analyses using up to three different correlated video input
channels. Provision for a fourth video channel is included in the system, but the hard-
ware to support this fourth has not been purchased.
Because the current NASA smoke generator system releases a continuous stream
of smoke, the obtainable information is limited to the positions of streamlines and vortex
cores, as well as burst point locations. However, if the smoke were to be released in
discrete pulses, and if the fluid packets remained coherent, the path of each pulse can
be tracked as it flows over the aircraft. Once the position of a fluid element is found as
a function of time, the velocity and acceleration of the pulse of smoke as it moves over
the aircraft can be found by numerical differentiation. Such information has been very
useful in studying the effects of the vortex core in water tunnels and in wind tunnels7, 8.
The central requirement for a smoke generating system which can be used to ob-
tain such fluid dynamic data is that it must produce discrete elements of the seeding
material which remain discrete as they travel through the flow field. Although it is desir-able to have smoke elements which are short enough in length that the entire element
can be tracked, it is not necessary. Alternatively, the leading edge or trailing edge of an
element can be tracked, and this procedure may even be preferable in some cases.
This report details the preliminary development of such an intermittent flow visual-
ization system through its design and initial ground tests. The report discusses selec-
tion of a visualization medium, design and construction of the hardware necessary for a
ground test, instrumentation of the system to determine its safety, and static ground
tests of the system to ensure that it produces discrete elements of the visualization
medium which will not significantly disturb the flow field. This phase of the effort in-
cludes no wind tunnel tests nor flight tests that will verify the feasibility of using the
video imaging system to collect the dynamic velocity and acceleration data described
above; those verifications of the concept are planned for Phase 2 of the project.
Essential Elements for the ISFVS
Seeding Medium. One of the critical elements of any flow visualization system is
the seeding medium. Commonly used materials used for seeding air flow and their
advantages and disadvantages for use in visualizing vortical flows in flight are listed in
Table !. Obviously, there is no perfect medium; all candidates have disadvantages.
Data Col/ection. Another important factor in producing a workable ISFVS is the
data collection scheme. The development of video imaging systems, which can be
used to track objects in a three-dimensional space, has largely automated the
quantification of flow parameters.
Method produclng
seedlng medium
heating mineral oilsvaporization 9, IO
to
bringing titanium tetrachlo-ride into the presence ofmoist air-q,10
soap bubbles 9, 10
Table 1. Common Seeding Media
Advantages
non-toxic and non-corrosive
gives cleady visible smokewith high contrast levels
non-toxic and non-corrosive
Disadvantages
may not produce enough smoke to fillthe vortex core;requires heat produced by theairplane engine or electrical systemproduces highly corrosive fumes;suitable only for air speeds on theorder of 5 feet per secondmaximum speed for using soapbubbles is about 60 miles per hour;not likely to produce discemiblecontrast levelsopen flame is not acceptable' in flightburning wood, tobacco, or fuel is cheap and readily
paper_, 10 availablemixing anhydrous ammonia uses common chemicals may not produce enough smoke to filland sulfur dioxide 11 the vortex core
chemical cartridges2, 12 some types produce verydense smoke;different colors of smokeavailable;chemical mixture can betailored to provide desiredresults
high temperatures may be associatedwith the chemical reaction;once fired, a cartridge cannot be shutdown - it must bum out;may produce unpleasant odor ordeposit residue that is unacceptable
The video imaging system used by the Texas A&M University Flight Mechanics
Laboratory (FML) consists of hardware (a video processor, cameras, video records,
etc.) and a versatile software package. Video images from either the cameras or from
video tapes are sent to the video processor, which measures the intensity of each pixel
in each frame and compares it to the intensities of adjacent pixels. If the difference in
intensity between neighboring pixels is above a threshold level set by the operator, the
pixel location is identified as an area of contrast. The pixel locations for areas of
contrast are recorded for each frame. When a light-colored object passes by a dark
background (or vice versa), the edges of the object are thus "seen" by the video
processor as lines of contrast. This video processor can also be configured to only
identify a top, bottom, left, or right edge (or any combination of these edges). The
software package is then used to find any area within a frame which has a minimum
number of contrasting pixels in it. The centroids of these areas are recorded for each
frame. The dimensions of the area and the minimum or maximum number of pixels to
be considered as a distinct object are also set by the user from a convenient menu.
Once the centroids are found, the trajectory of the object(s) is determined by comparing
similar objects in succeeding frames and linking them together in a path. Since the
frame rate is known accurately, the time history of the trajectory is defined. The
velocity and acceleration of the object(s) can then be found using digital smoothingfilters and numerical differentiation commands that are integral to the software 6.
The only equipment that must be carried on the test aircraft are video cameras that
can record the flow visualization medium in the area of interest. For best results these
camera lines of sight should be parallel as nearly as possible to three orthogonalcoordinate directions. While two cameras can produce three-dimensional data, it is
highly desirable to have multiple camera locations to provide statistical redundancy in
the lines of position that determine target positions. Since the tracking algorithms are
based on detection of contrast levels to define the targets, lighting and background of
the video scene is also critically affect the quality of the data. The system can track
over 30 different target locations simultaneously in any one area of interest, though
obviously the number of targets to be tracked simultaneously directly affects the size ofthe data files to be reduced.
PRELIMINARY DESIGN AND DEVELOPMENT
In fulfillment of the statement of work for NAG 2-651 the fabrication and ground
tests of a smoke generating system which can be used to introduce discrete elements
of a flow visualization medium into the flow field of an aircraft in flight have been com-
pleted, As dictated in the statement of work, the results presented in this report include:
131 drawings and instructions for the assembly of a prototype intermittent
smoke flow visualization system
Eli discussion of the results of the tests showing that the system producesdiscrete elements of the visualization medium
QI engineering predictions of the pressure and temperatures produced in the
system
[2]1experimental verification that the pressures and temperatures generated in
the system can be easily and safely contained.
System Requirements
A system which can produce discrete elements of a seeding material for identifying
the trajectories of vortex cores in flight must meet stringent requirements. These re-
quirements fall into two categories, those concerned with the system's ability to produce
desired results, and those concerned with its use on an aircraft in flight.
System performance requirements include:
C3 The system must produce elements of the flow visualization medium which
are discrete and remain distinguishable from one another as they travel
through the flow field.
O The seeding material should be introduced into the flow field so that it does
not significantly disturb the experimental conditions 13.
Ell The seeding material must be dense and contrast with the background so
that it can be identified by the chosen means of data collection.
Individual particles making up the visualization medium must be small
enough and contain an appropriate amount of mass so that they follow the
actual flow of the fluid around an aircraft flying at speeds near 120 knots in-
dicated airspeed 10.
QI To be useful for testing during maneuvers, the system must produce usablesmoke for at least twenty to thirty seconds 2.
A flow visualization system for use on an aircraft must also meet other require-ments:
Ell The seeding material must be non-toxic and non-corrosive 7.
O The system may not produce unsafe pressures or temperatures.
E] Because of the high cost of conducting flight tests, the system must also bereliable.
131The system must be compact and lightweight.
I_ The system must be powered by and controlled from the aircraft.
Preliminary Design
Several different methods of producing discrete elements of a visualization medi-
um were considered. A modification of NASA's HARV Smoke Generator System (SGS)
was identified as the most promising. This approach was chosen because the HARV
SGS worked well in flight during the initial phase of the High Alpha Research Program.
The chemical cartridge introduces a non-toxic and non-corrosive smoke (from the
condensation of terephthalic acid) into the flow field in quantities large enough to define
a vortex core and provide good contrast with the HARV and the sky. Moreover, the
original design has already been flight qualified, and it is safe and reliable. The data
obtained using the HARV SGS compared well with computational fluid dynamics
results; so, evidently the SGS did not significantly alter flow field characteristics 14.
The most obvious way to introduce smoke into the flow field in discrete elements is
to use a valve to shut off the flow of smoke for short periods of time. However, shutting
off the flow of smoke causes pressure rises in the system. If the flow of smoke is
blocked for too long, these pressure rises may cause damage to the system, or they
may cause the smoke to enter the flow field with a velocity sufficient to disturb the vorti-cal flow conditions. A measure of the effect of interrupting the flow of smoke on the exit
velocity is the increase in the pressure differential between the inside and outside of the
plenum. Increasing the internal volume of the system decreases the pressure rise
which occurs as a result of shutting off the flow for a short time period. However, the
volume which may be needed to ensure that the pressure rise is not too great may be
too large to meet space requirements. Another way of introducing discrete elements ofsmoke into the flow field is to divert the smoke to an alternate outlet when it is not being
sent to the region of the flow field being studied. The alternate outlet flow path may lead
to another flow region which is being studied or any region of the flow where it will not
interfere with the flow in the region of concern. The latter option will waste visualization
material, but it may be necessary to preserve the integrity of the flow field.
Since the effect of blocking the smoke flow path, especially on pressure and tem-
perature, was largely unknown at the beginning of the project, a three-way valve was
sought. This type of valve would allow both diversion of the smoke to an alternate path,
and complete blockage of the flow of smoke. The pressure rises caused by blocking
5
the flow path must be analyzed and verified to determine which method of pulsing the
smoke is best for a given application.
Because of NASA's success with the HARV SGS in the initial phase of the High Al-
pha Research Program, their existing design was used as the basis for the prototype
system that would pulse the smoke. However, the prototype was kept simple by de-
signing for only one smoke cartridge and the uncertainty surrounding the thermody-
namic effects of opening and closing the valve led to designing a plenum chamber in
which the volume could be easily changed. This volume flexibility deliberately designed
flexibility into the prototype to help meet what was perceived as the difficult design
challenge.
Detailed Design
As suggested above, a single cartridge prototype with three different plenum
chamber volumes was designed for use in Phase 1 ground tests. The NASA SGS de-
sign was otherwise duplicated as nearly as possible. The major components of the
prototype design are discussed in detail below.
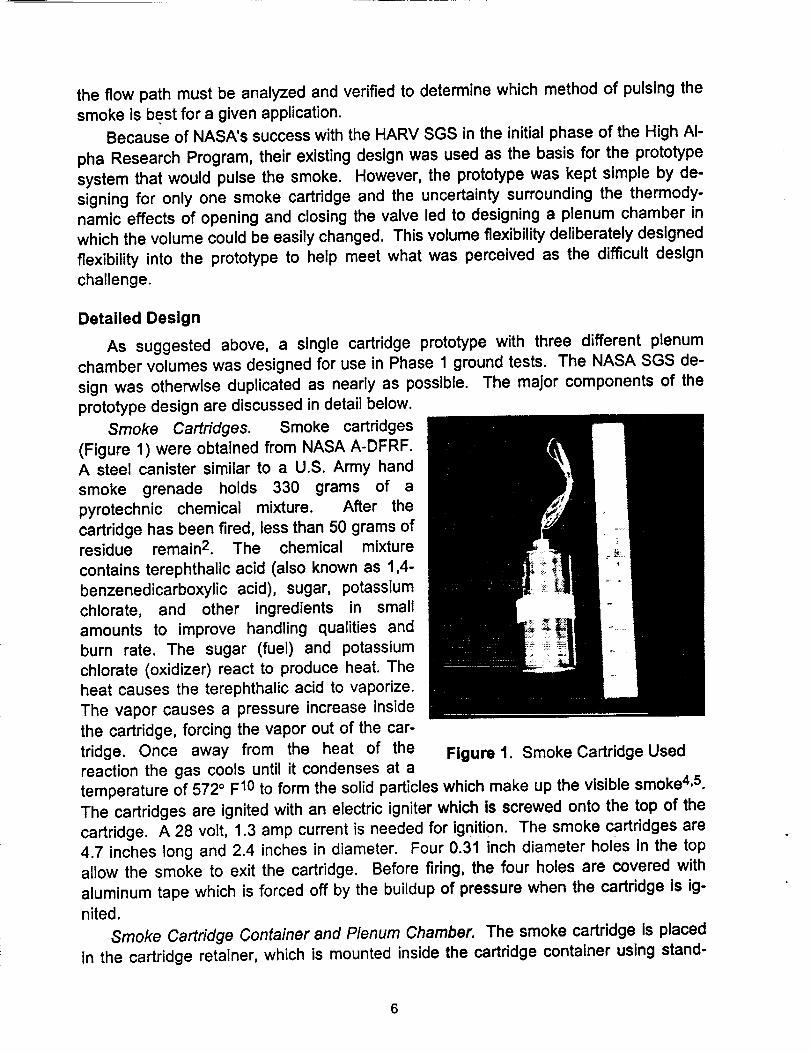
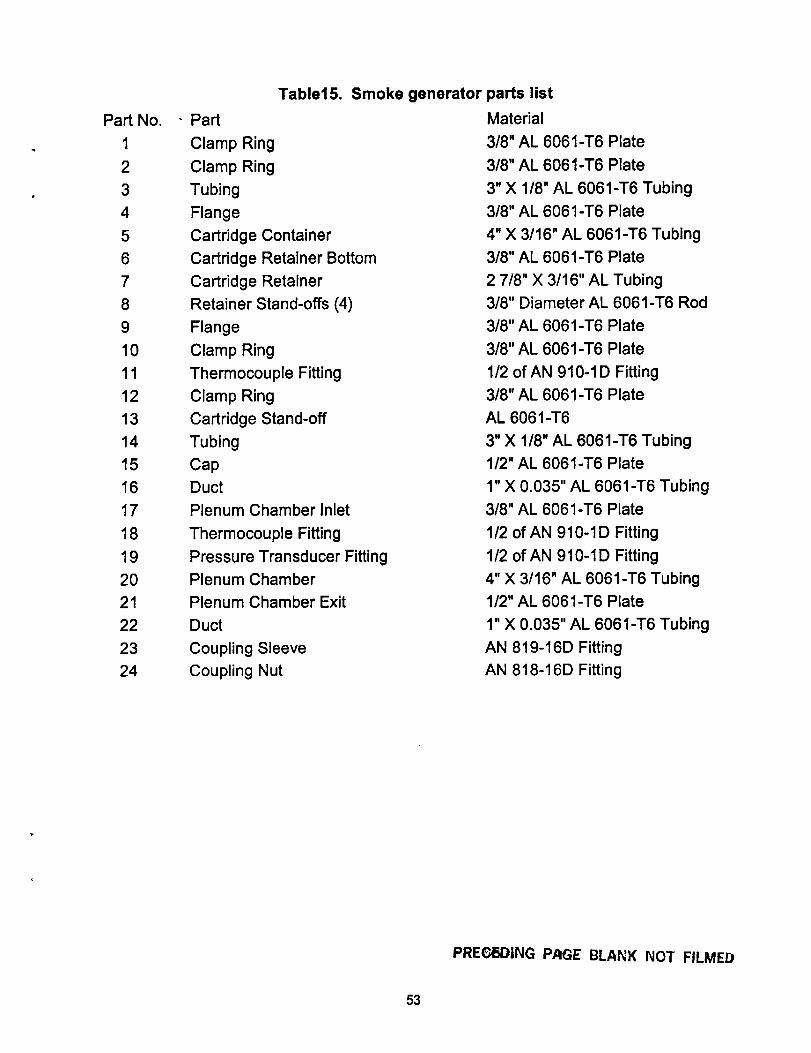
Smoke Cartridges. Smoke cartridges
(Figure 1) were obtained from NASA A-DFRF.
A steel canister similar to a U.S. Army hand
smoke grenade holds 330 grams of a
pyrotechnic chemical mixture. After the
cartridge has been fired, less than 50 grams ofresidue remain 2. The chemical mixture
contains terephthalic acid (also known as 1,4-
benzenedicarboxylic acid), sugar, potassium
chlorate, and other ingredients in small
amounts to improve handling qualities and
burn rate. The sugar (fuel) and potassium
chlorate (oxidizer) react to produce heat. The
heat causes the terephthalic acid to vaporize.
The vapor causes a pressure increase inside
the cartridge, forcing the vapor out of the car-
tridge. Once away from the heat of the Figure 1. Smoke Cartridge Usedreaction the gas cools until it condenses at atemperature of 572 ° F10 to form the solid particles which make up the visible smoke4, 5.
The cartridges are ignited with an electric igniter which is screwed onto the top of the
cartridge. A 28 volt, 1.3 amp current is needed for ignition. The smoke cartridges are
4.7 inches long and 2.4 inches in diameter. Four 0.31 inch diameter holes in the topallow the smoke to exit the cartridge. Before firing, the four holes are covered with
aluminum tape which is forced off by the buildup of pressure when the cartridge is ig-nited.
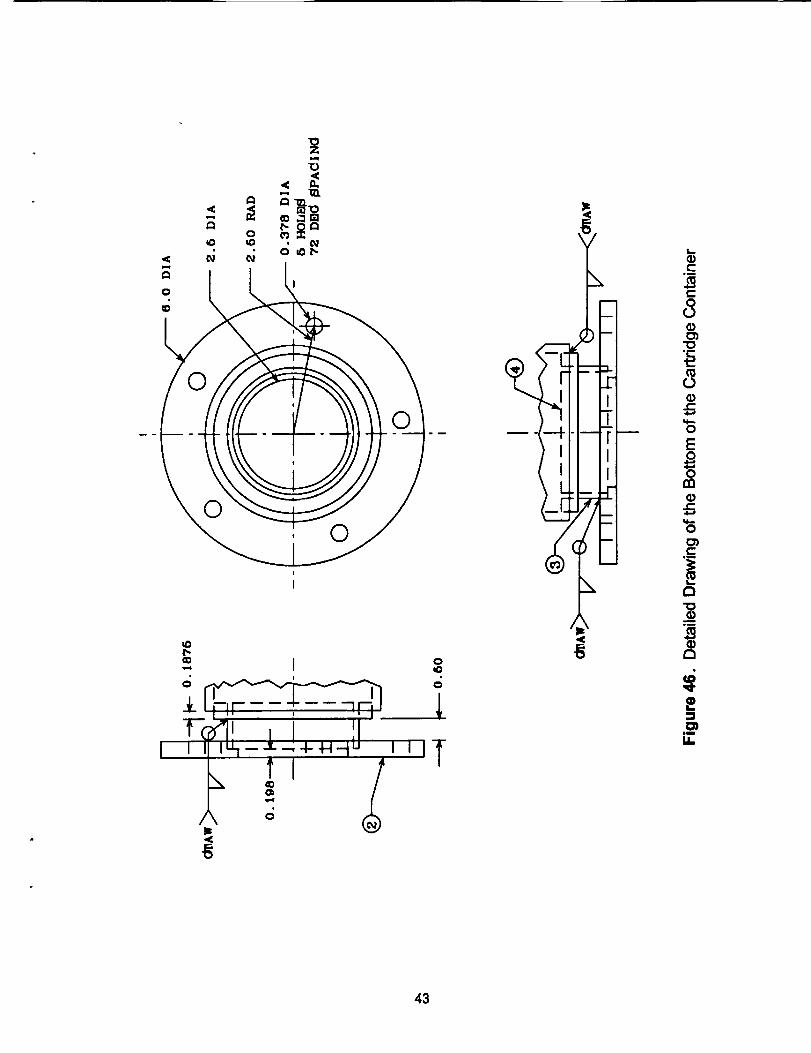
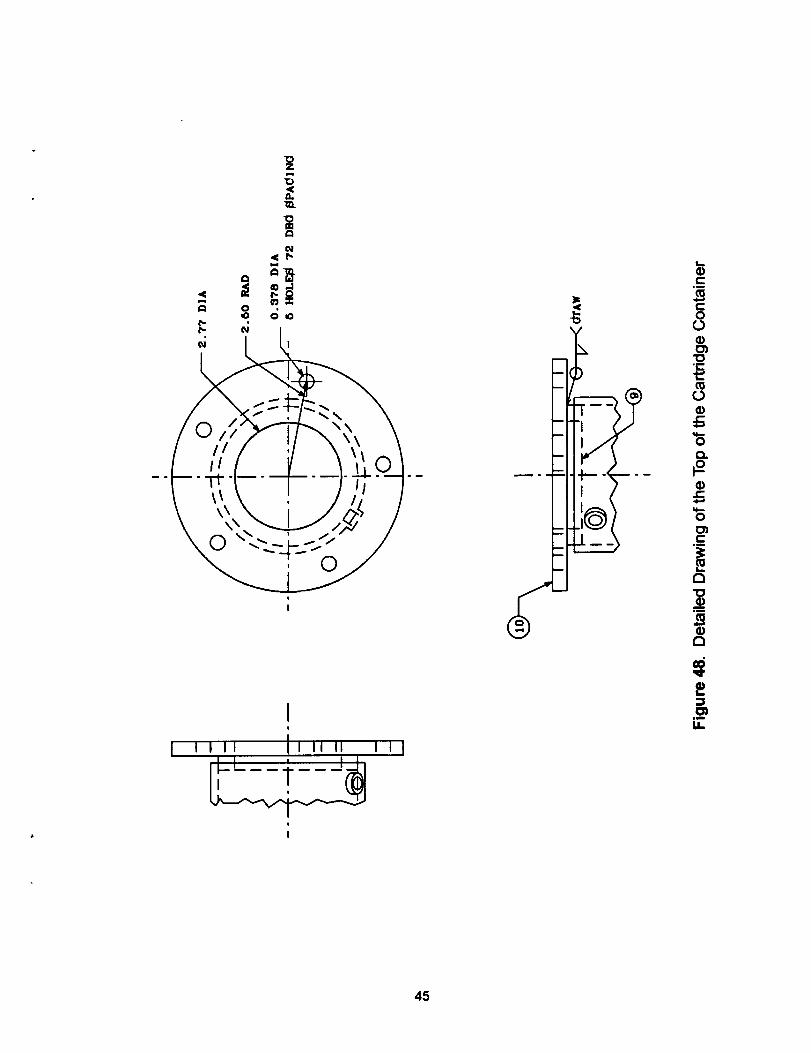
Smoke Cartridge Container and P/enum Chamber. The smoke cartridge is placed
in the cartridge retainer, which is mounted inside the cartridge container using stand-
offs (Figure 2). Smoke exits the cartridge container through a 0.93 inch inside diametertube in the container cap. The cap is nozzled to reduce pressure losses. The igniterwires run through a fitting in the container cap. An igniter stand-off holds the cartridge
firmly in place.
A rupture disk is placed in ,--EXIT TUBE SMOKE CARTRIDGE
the bottom of the cartridge con- _ .... CONTAINER 7
tainer. This rupture disk rapidly __ _/,..--¢_:_
releases the smoke in the
event of an excessive pressure
buildup in the cartridge con-
tainer. The rupture disk is de- _' k_,.__,_/_,1,_k_..___Jsigned to rupture at pressures
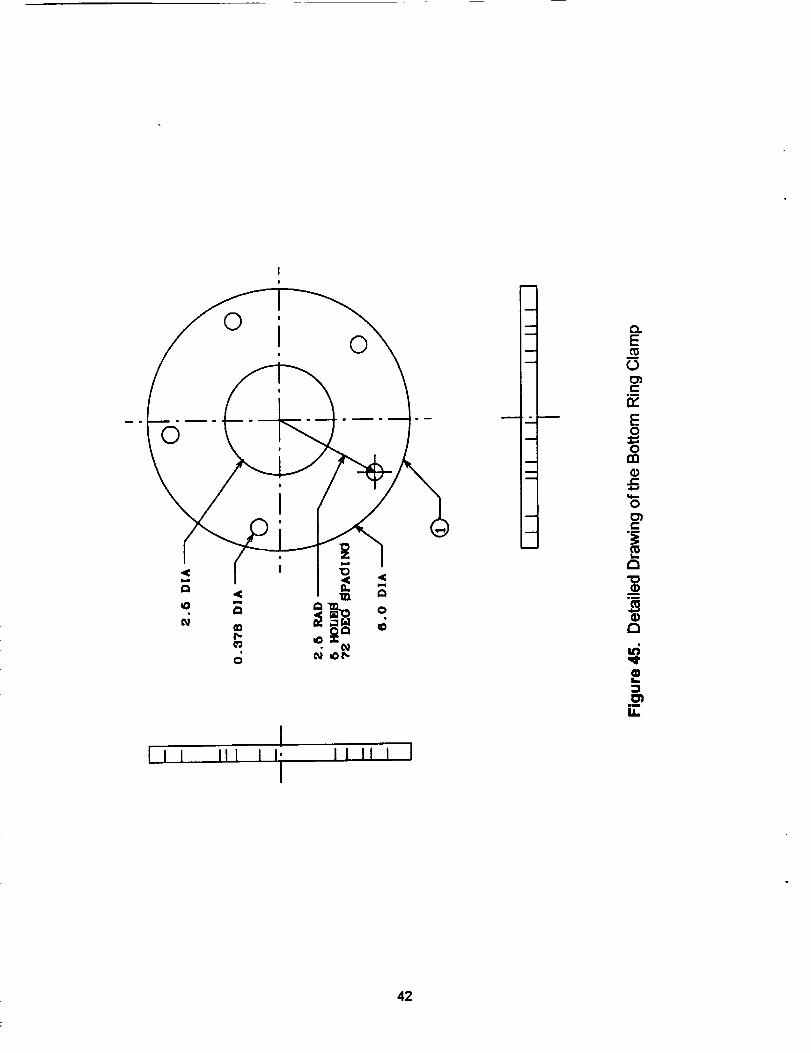
between 55 and 75 psid 2. FITTING DISKA ring clamp is used to
hold the rupture disk and rup- Figure 2. Smoke Cartridge Container and Cap
ture disk gaskets in place. One ring is welded to the bottom of the cartridge container;
the other ring is bolted to it using five 3/8" X 1-1/4" SAE Grade 9, fine thread bolts, nuts,
and washers. The rupture disk and two gaskets are sandwiched between the two rings.
A ring clamp connects the cartridge container to its cap. One ring is welded to the
container; the other is welded to the cap. The two rings are bolted together with five
bolts. An O-ring is placed between the two rings to prevent leaks.
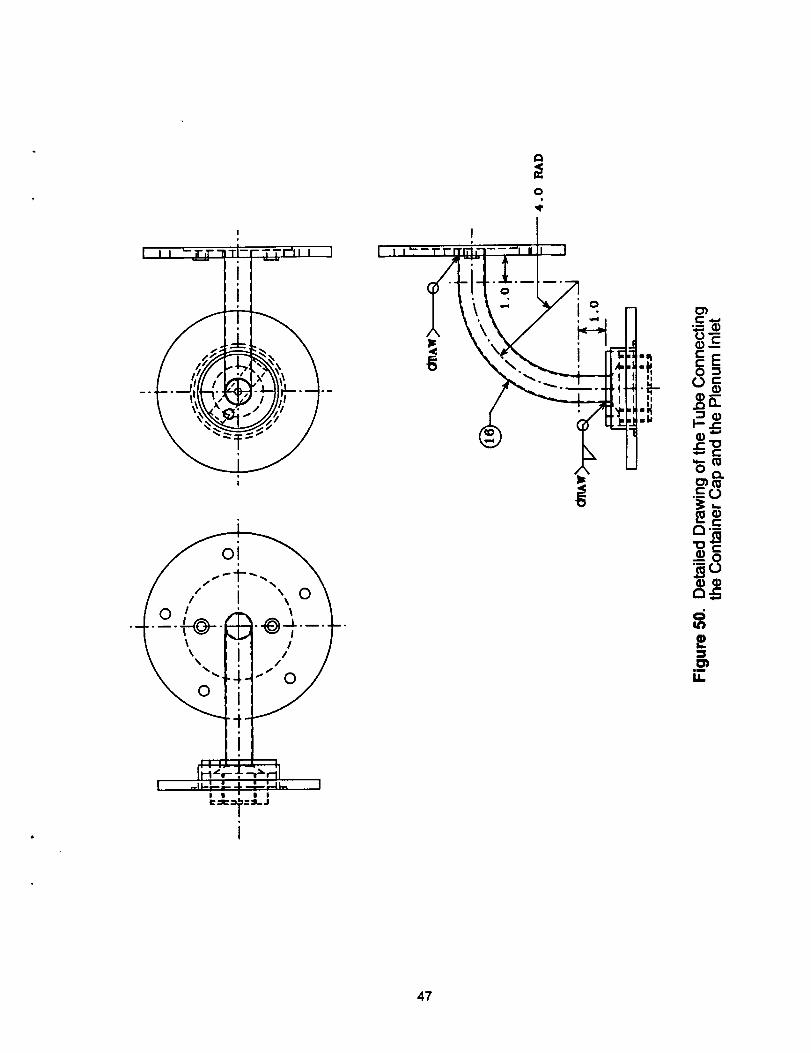
A 0.93 inch inside diameter tube with a
_ 4.0" radius, 90° bend connects the con-
o tainer cap with the inlet plate of the plenum
PLENUM chamber. The tube is welded to both theINLET PLATE t_ container cap and the plenum inlet plate.
Figure 3 shows how the exit tube (Figure 2)
0.93" I.D. connects the smoke cartridge container toTUBE _ the plenum chamber inlet plate. All welds
are tungsten inert gas (TIG) welds; theIGNITER CARTRIDGE CON- exterior welds were sealed with a highOPENING TA/NER CAP temperature sealant to prevent leaks. Also,
the opening for the igniter wires (labeled in
Figure 3) is sealed similarly.
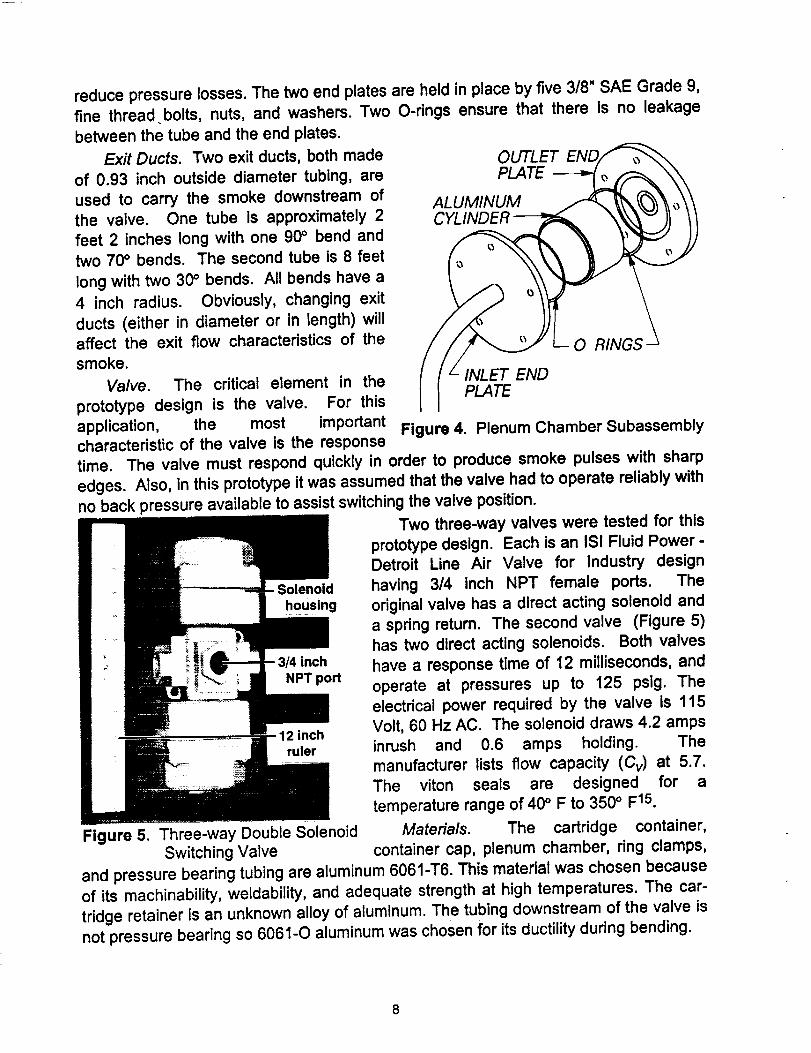
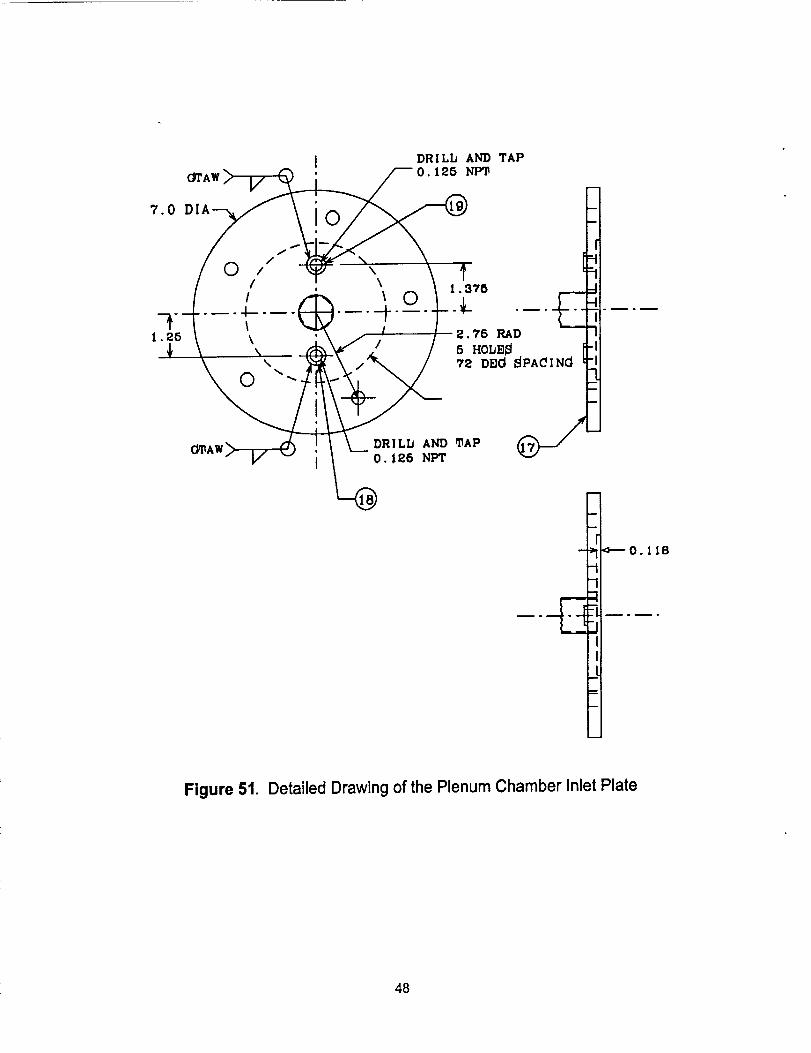
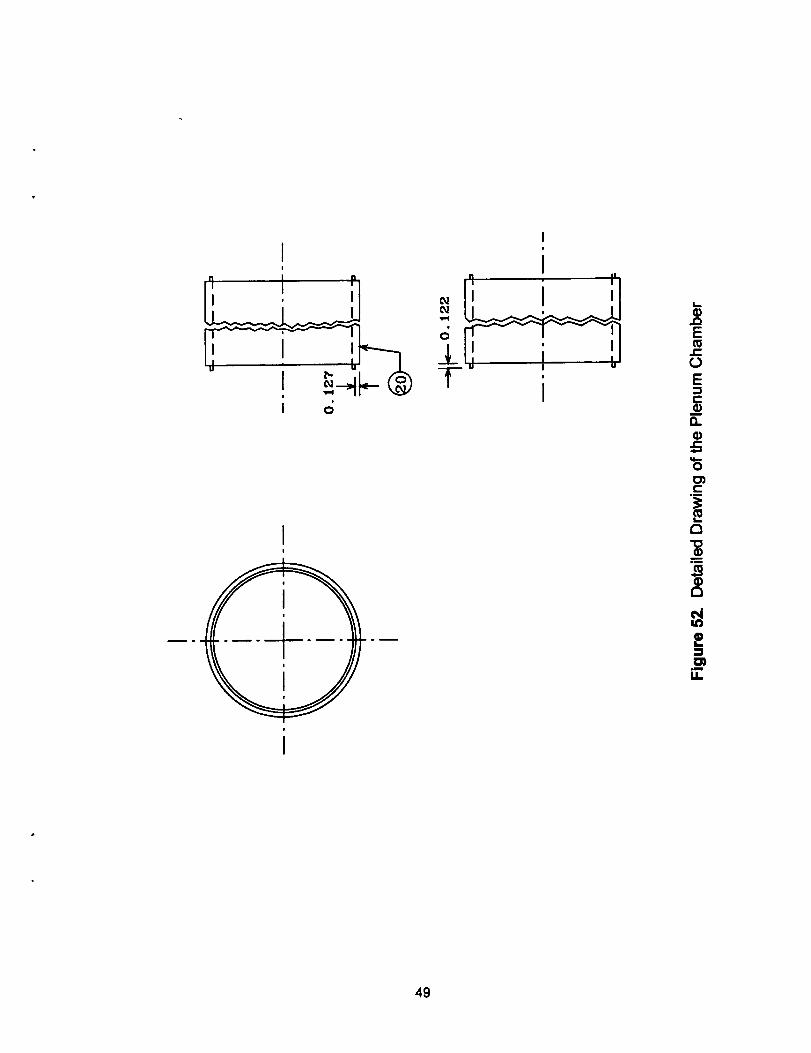
The plenum chamber itself (Figure 4)
o consists of a cylinder and two end plates.
The cylinder making up the walls of the
Figure 3. Container Cap and Plenum plenum chamber is made of aluminum
Inlet Plate Subassembly tubing and different lengths of tubing were
cut to provide a simple and fast way to
change the volume of the plenum chamber, an important parameter for controlling the
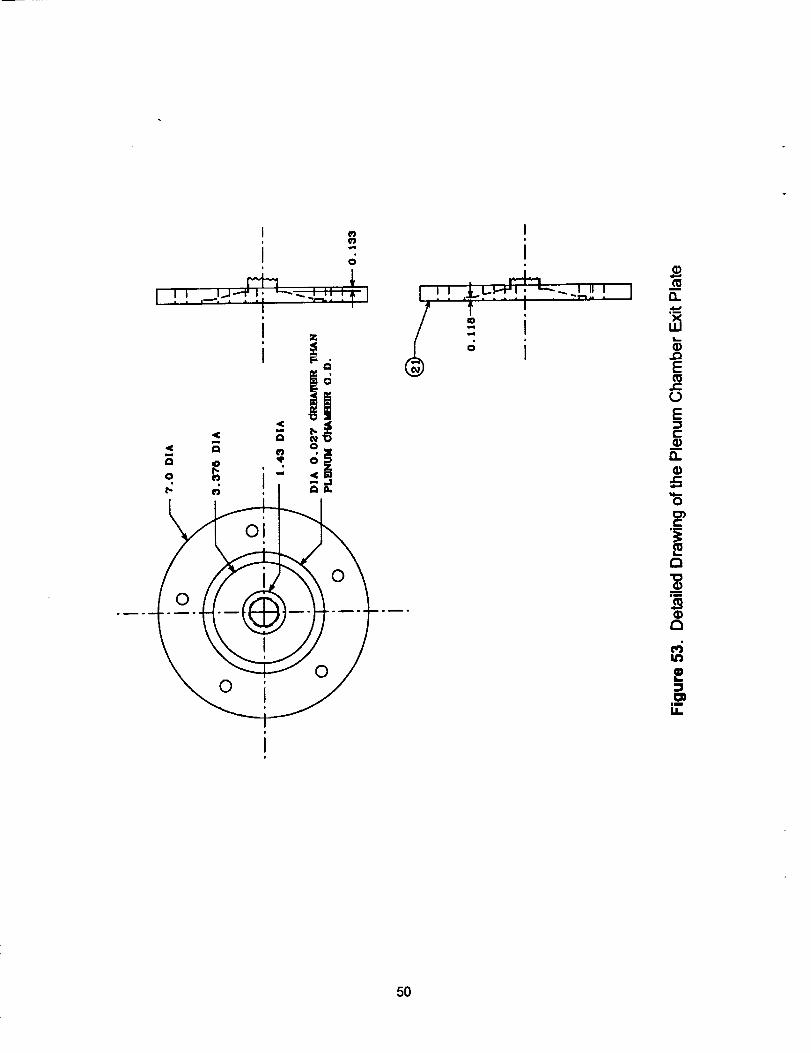
pressure rise in the system as the fast-acting valve opens and closes to produce theintermittent smoke puffs. The exit plate of the plenum chamber is also nozzled to
7
reduce pressure losses. The two end plates are held in place by five 3/8" SAE Grade 9,fine threadbolts, nuts, and washers. Two O-rings ensure that there is no leakage
between the tube and the end plates.
Exit Ducts. Two exit ducts, both made OUTLET END
o, ,no. areused to carry the smoke downstream of ALUMINUM ../.-_,. _'_'_\\the valve. One tube is approximately 2
feet 2 inches long with one 90° bend andtwo 70 ° bends. The second tube is 8 feet
long with two 30 ° bends. All bends have a
4 inch radius. Obviously, changing exit
ducts (either in diameter or in length) willaffect the exit flow characteristics of the
smoke.
Valve. The critical element in the
prototype design is the valve. For this
application, the most important Figure 4. Plenum Chamber Subassemblycharacteristic of the valve is the response
time. The valve must respond quickly in order to produce smoke pulses with sharp
edges. Also, in this prototype it was assumed that the valve had to operate reliably with
no back pressure available to assist switching the valve position.
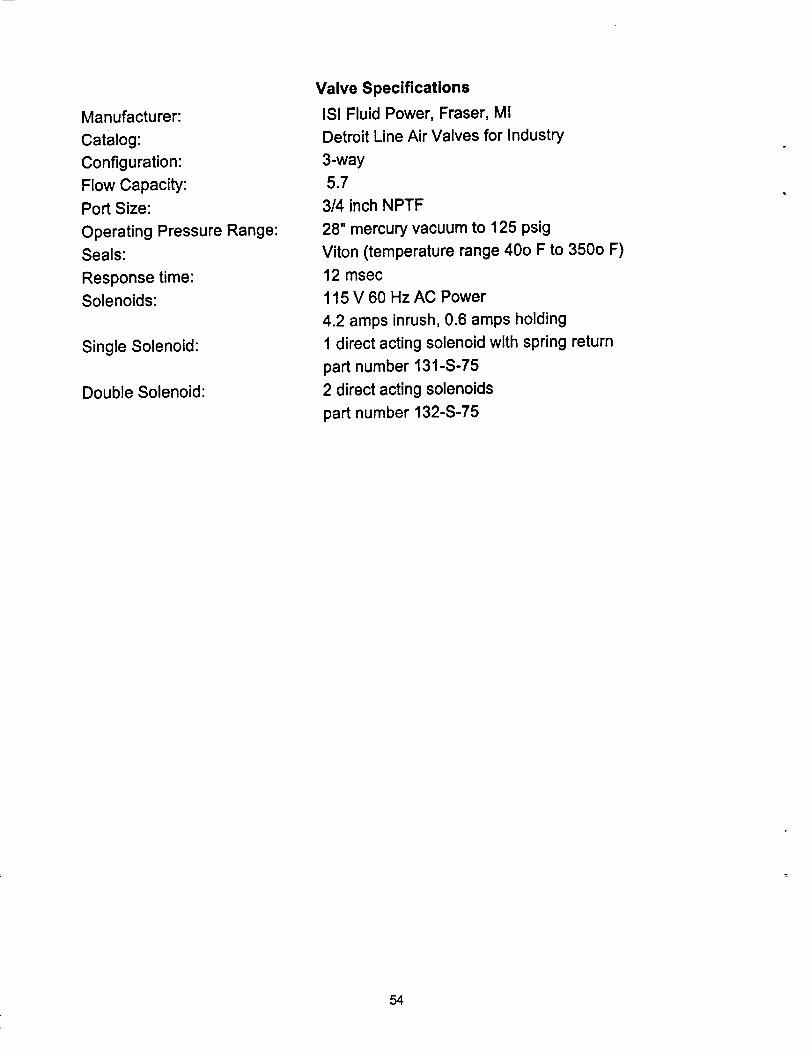
Two three-way valves were tested for this
prototype design. Each is an ISI Fluid Power-
Detroit Line Air Valve for Industry design
|d having 3/4 inch NPT female ports. The
housing original valve has a direct acting solenoid and
a spring return. The second valve (Figure 5)
has two direct acting solenoids. Both valves
inch have a response time of 12 milliseconds, andNPTport operate at pressures up to 125 psig. The
electrical power required by the valve is 115
inch Volt, 60 Hz AC. The solenoid draws 4.2 ampsruler inrush and 0.6 amps holding. The
manufacturer lists flow capacity (Cv) at 5.7.
The viton seals are designed for a
temperature range of 40 ° F to 350 ° F 15.
Figure 5. Three-way Double Solenoid Materials. The cartridge container,
Switching Valve container cap, plenum chamber, ring clamps,
and pressure bearing tubing are aluminum 6061-T6. This material was chosen because
of its machinability, weldability, and adequate strength at high temperatures. The car-
tridge retainer is an unknown alloy of aluminum. The tubing downstream of the valve is
not pressure bearing so 6061-O aluminum was chosen for its ductility during bending.
8
Silicone O-ring cord with a diameter of 1/8" was used to make O-rings; the ends
were joined with silicone adhesive. The rupture disk is cut from 0.002" brass shim
stock; the "rupture disk gasketsare cut from a 1/32" thick sheet
of Garolite.
Determination of Waft
Thicknesses. Because the
system contains a gas mixture
under pressure, wall thick-
nesses are important to guard
against rupture. The important
factors in determining the nec-
essary thicknesses are cylinder
radius (either inside or outside),
pressures encountered, and
strength of the material. For a
cylinder with an inner pressure,
the tangential stress o e is
tensile, with a maximum at theinner wall. This maximum
tensile stress determines the
needed thickness.
NASA has previously found
the maximum temperature at
Po
/ I/ \11
Figure 6. Stresses in a Cylinder Wall
the wall in the cartridge container to be about 230 ° F, using a resistance thermometer.
The maximum pressure in the system before the rupture disk fails is 75 psid. To
ensure a reasonable safety margin, the cylinder thicknesses were sized for a 10 hour
exposure to 500 ° F, and an internal pressure of 150 psid. Aluminum 6061-T6 has a
tensile yield stress of 35,000 psi at standard room temperature. After being exposed to500 ° F for 10 hours, it retains 35% of its tensile strength.
The tangential stress o e at the inner wall of a cylinder is:
Rearranging to solve for rimax:
0"0 =
Ffrol ].,.,_ pofrOl
rol2.1T,j
= ro / ° e_x + 2 Po - Pir#.,_x V Pi + G Omax
Minimum thickness corresponds to maximum inside radius; hence, where ro = ---
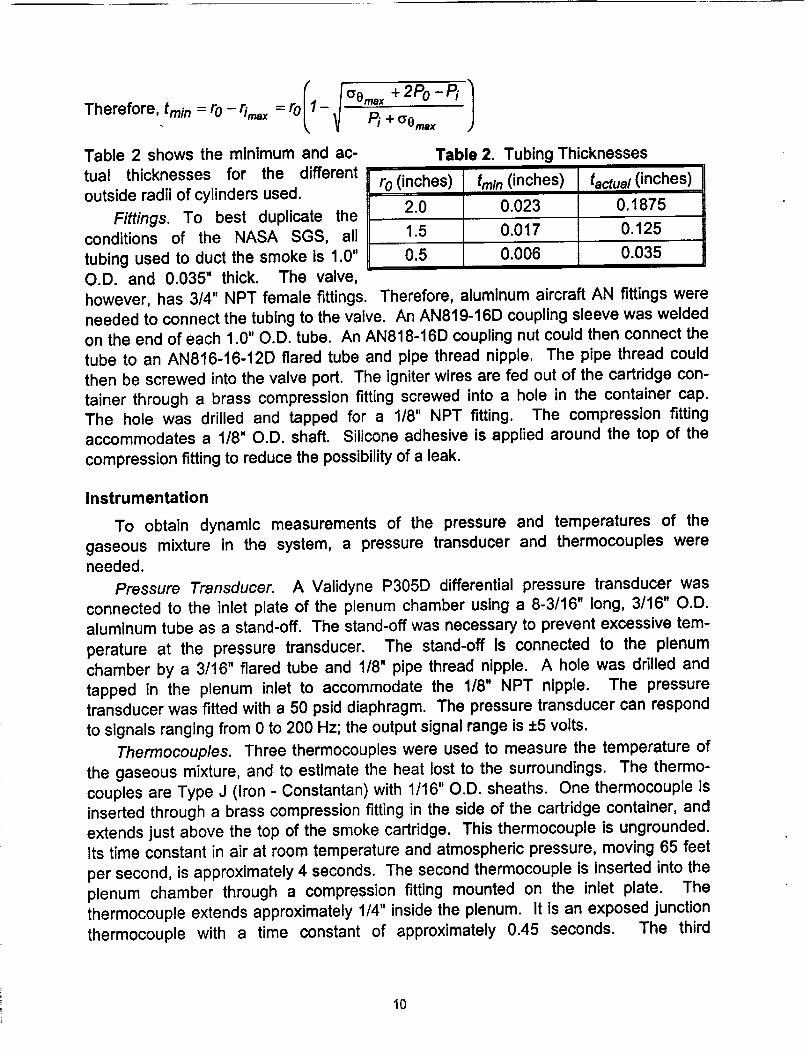
Table 2 shows the minimum and ac- Table 2. Tubing Thicknessestual thicknesses for the differentoutside radii of cylinders used. r0 (inches) trn/n(inches) tactua/(inches)
Fittings. To best duplicate the 2.0 0.023 0.1875
conditions of the NASA SGS, all 1.5 0.017 0.125
tubing used to duct the smoke is 1.0" 0.5 0.006 0.035
O.D. and 0.035" thick. The valve,
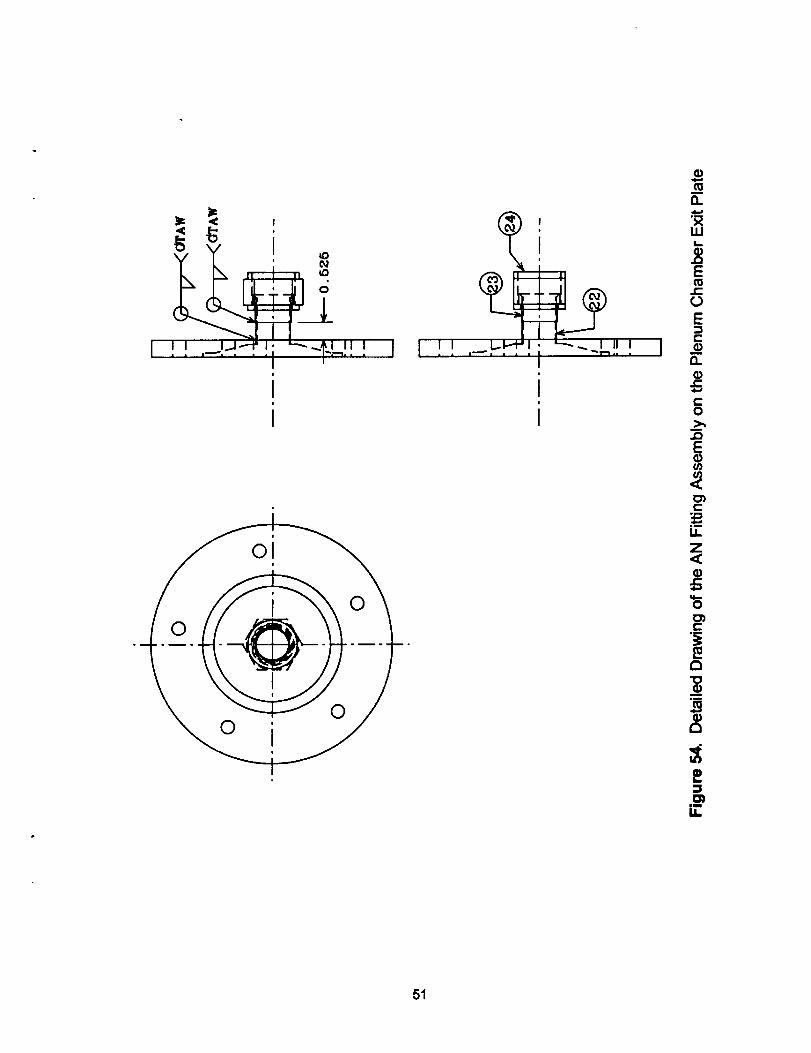
however, has 3/4" NPT female fittings. Therefore, aluminum aircraft AN fittings were
needed to connect the tubing to the valve. An AN819-16D coupling sleeve was welded
on the end of each 1.0" O.D. tube. An AN818-16D coupling nut could then connect the
tube to an AN816-16-12D flared tube and pipe thread nipple. The pipe thread could
then be screwed into the valve port. The igniter wires are fed out of the cartridge con-
tainer through a brass compression fitting screwed into a hole in the container cap.The hole was drilled and tapped for a 1/8" NPT fitting. The compression fitting
accommodates a 1/8" O.D. shaft. Silicone adhesive is applied around the top of the
compression fitting to reduce the possibility of a leak.
Instrumentation
To obtain dynamic measurements of the pressure and temperatures of the
gaseous mixture in the system, a pressure transducer and thermocouples wereneeded.
Pressure Transducer. A Validyne P305D differential pressure transducer wasconnected to the inlet plate of the plenum chamber using a 8-3/16" long, 3/16" O.D.
aluminum tube as a stand-off. The stand-off was necessary to prevent excessive tem-
perature at the pressure transducer. The stand-off is connected to the plenum
chamber by a 3/16" flared tube and 1/8" pipe thread nipple. A hole was drilled and
tapped in the plenum inlet to accommodate the 1/8" NPT nipple. The pressure
transducer was fitted with a 50 psid diaphragm. The pressure transducer can respond
to signals ranging from 0 to 200 Hz; the output signal range is +5 volts.
Thermocouples. Three thermocouples were used to measure the temperature of
the gaseous mixture, and to estimate the heat lost to the surroundings. The thermo-
couples are Type J (Iron - Constantan) with 1/16" O.D. sheaths. One thermocouple is
inserted through a brass compression fitting in the side of the cartridge container, and
extends just above the top of the smoke cartridge. This thermocouple is ungrounded.
Its time constant in air at room temperature and atmospheric pressure, moving 65 feet
per second, is approximately 4 seconds. The second thermocouple is inserted into the
plenum chamber through a compression fitting mounted on the inlet plate. The
thermocouple extends approximately 1/4" inside the plenum. It is an exposed junction
thermocouple with a time constant of approximately 0.45 seconds. The third
10
thermocouple is inserted near the duct exit downstream of the valve. It is located in thecenter of the tube and is also an exposed junction thermocouple.
Fittings. Pipe thread couplings (AN910-1D) were used to connect the pressuretransducer stand-off to the plenum chamber, and to connect the thermocouples to the
cartridge container, plenum chamber, and duct exit. To connect the pressure trans-
ducer stand-off and the thermocouples for the cartridge container and plenum cham-
ber, the couplings were first cut in half. One half-coupling was then welded in place for
each fitting. The couplings cracked during welding, however. As a result, it was neces-
sary to mill the couplings down to a height of approximately 1/8". The remaining parts of
the couplings were used as a guide to drill and tap the cartridge container and plenuminlet with 1/8" NPT holes. To connect the duct exit thermocouple to the tubing, a pipe
thread coupling (AN910-1D) was welded to the tubing. A 1/8" diameter hole was thendrilled into the tube for insertion of the thermocouple.
Data Collection
A Data Translation DT2821-F-16SE analog to digital conversion (A/D) board was
used to collect data with an IBM compatible 286 personal computer. The A/D board has
16 12-bit A/D channels; each channel has a range of volts. The outputs of the pressure
transducer and three thermocouples were sampled on four channels at a sample rate
of 1000 samples/second each, for sixty seconds. This allowed enough time for the car-
tridge to ignite and burn to completion. A computer program which utilized ATLAB, a
software package also produced by Data Translation, was used to control the A/Dboard, as well as to control the valve and ignition of the cartridge. The data was stored
in buffers using direct memory access (DMA), allowing the A/D board to return control
to the computer so it could be used to control the valve. After the data collection was
complete, data from the buffers were written to output files.
Signal Conditioning. The output of Type J thermocouples at a temperature 1300 ° F
above reference (ambient in this case) temperature is only 39.4 millivolts. Therefore,considerable amplification was necessary to obtain decent resolution with the A/D
board. The outputs of the thermocouples were amplified by a factor of approximately250 using operational amplifiers. The output of the pressure transducer has a range of
volts. To maximize resolution, the output was amplified by a factor of approximately 2.0.
A Validyne CD12 transducer indicator is used to supply both excitation voltage and
signal conditioning for the pressure transducer measuring dynamic pressure of the exitsmoke flow. The transducer indicator has a frequency response of 0 to 1000 Hz and its
output range is +10 volts 18 so no additional amplification is needed.
Synchronizing Cartridge Ignition and Data Collection. Cartridge ignition and data
collection are synchronized using one of the two DT2821-F-16SE D/h. output channels
and a solid state relay. Data collection begins when the ignition signal is sent from the
D/h, output. The output of the relay is connected in series with the igniter and a 28 volt
DC power supply. The D/P, output from the A/D board is connected to the input of the
relay. When the D/A output is 0 volts, the relay is open; when the D/A output is 5 volts,
11
the relay is closed and ignition occurs. The maximum response time for the relay is 0.2milliseconds 21.
Valve Control
The valves are controlled using the remaining D/A output channel and solid state
relays. Control of the single solenoid valve is straightforward. A 5 volt signal from the
D/A output causes a relay to energize the solenoid and a 0 volt signal removes
deenergizes the solenoid. Control of the double solenoid valve is slightly more
complicated and a logic circuit is needed to control two relays. A rise in the output
voltage (from 0 to 5 volts) causes one relay to energize its solenoid for 20 milliseconds.
A drop in D/A voltage (from 5 to 0 volts) causes the other relay to energize its solenoidfor 20 milliseconds. The response time of each relay varies from 0 to 8.3 milliseconds
(half of a 60 Hz cycle) depending on the phase of the line power at the time the relay is
signalled 21. This unknown response lag leads to uncertainty in exactly when a valve
closes with this arrangement.
PRESSURE ESTIMATION
Safe use of the intermittent flow visualization system requires information concern-
ing the pressure inside the system as the smoke is pulsed. An alternate flow path must
be provided for the smoke if complete blockage causes any of the following to occur:
1) pressure rises which result in system failure
2) pressure rises which are unsafe
3) smoke exit velocities which are unacceptably high.
Since it was not feasible to obtain experimental data for all possible pulse rates, using
all possible system internal volumes, a model was developed to simulate the pressure
in the system. Experiments were then conducted to validate this mathematical model.
Chemical Reaction
To model the pressure in the system, the compounds present and the amount of
each constituent, as well as their physical states, must be known. Thus, knowledge of
the chemical reaction which produces the smoke is essential. The smoke cartridges
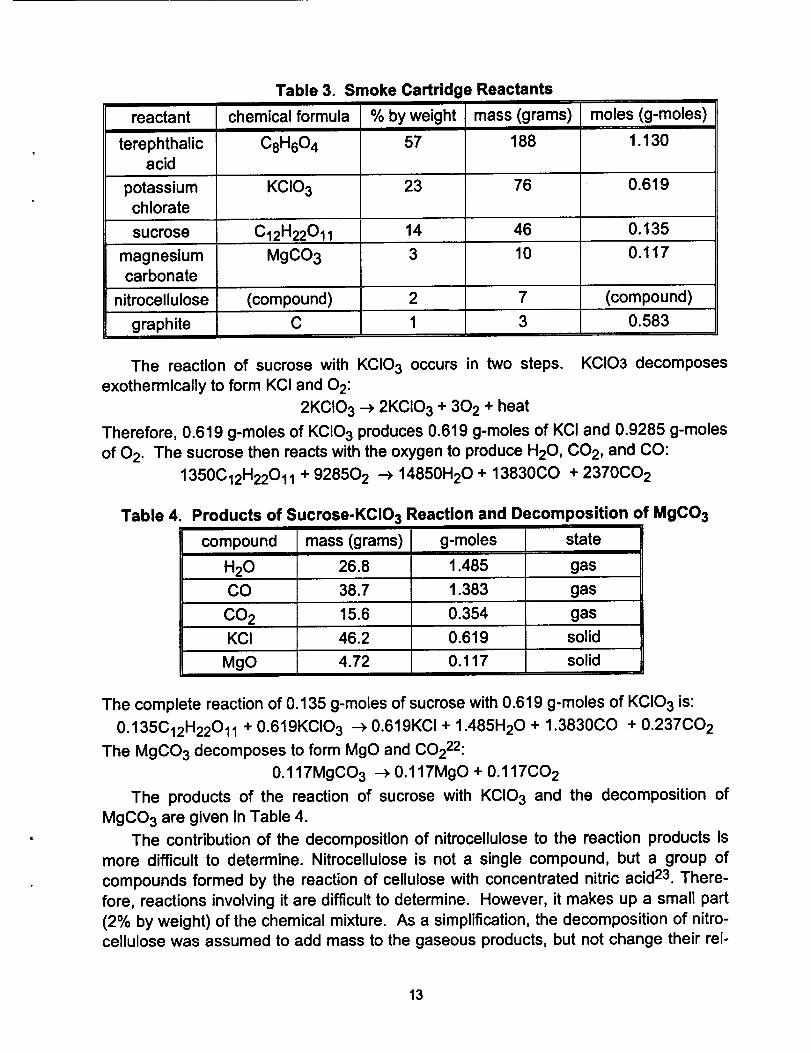
contain 330 grams of a pyrotechnic mixture. The reactants in this mixture are given in
Table 3. When a 28 volt potential is applied to the ignitor, it produces a flame in the
smoke cartridge which starts a chemical reaction. In this reaction, sucrose (the fuel)
and potassium chlorate (the oxidizer) react to produce water vapor (H20), carbon
dioxide (CO2), carbon monoxide (CO), and potassium chloride (KCI). This reaction is
exothermic and gives off heat which causes the terephthalic acid (C8H604) to sublime.
The liberation of gases inside the cartridge causes a pressure increase, forcing themout of the cartridge. Once away from the heat of the reaction, the gases cool. The
terephthalic acid recondenses to form visible, solid particles when it reaches a tempera-ture of 572 ° F.
12
reactant
terephthalicacid
Table 3. Smoke Cartridge Reactants
chemical formula % byweight mass (grams) moles (g-moles)
C8H604 57 188 1.130
graphite C
potassium KCIO 3 23 76 0.619chlorate
sucrose C12H22Oll 14 46 0.135
magnesium MgCO 3 3 10 0.117carbonate
nitrocellulose (compound) 2 7 (compound)
1 3 0.583
The reaction of sucrose with KCIO 3 occurs in two steps. KCIO3 decomposes
exothermically to form KCI and 02:
2KCIO 3 _ 2KCIO 3 + 30 2 + heat
Therefore, 0.619 g-moles of KCIO 3 produces 0.619 g-moles of KCI and 0.9285 g-moles
of 0 2. The sucrose then reacts with the oxygen to produce H20, CO 2, and CO:
The products of the reaction of sucrose with KCIO 3 and the decomposition of
MgCO 3 are given in Table 4.
The contribution of the decomposition of nitrocellulose to the reaction products is
more difficult to determine. Nitrocellulose is not a single compound, but a group of
compounds formed by the reaction of cellulose with concentrated nitric acid 23. There-
fore, reactions involving it are difficult to determine. However, it makes up a small part
(2% by weight) of the chemical mixture. As a simplification, the decomposition of nitro-cellulose was assumed to add mass to the gaseous products, but not change their rel-
13
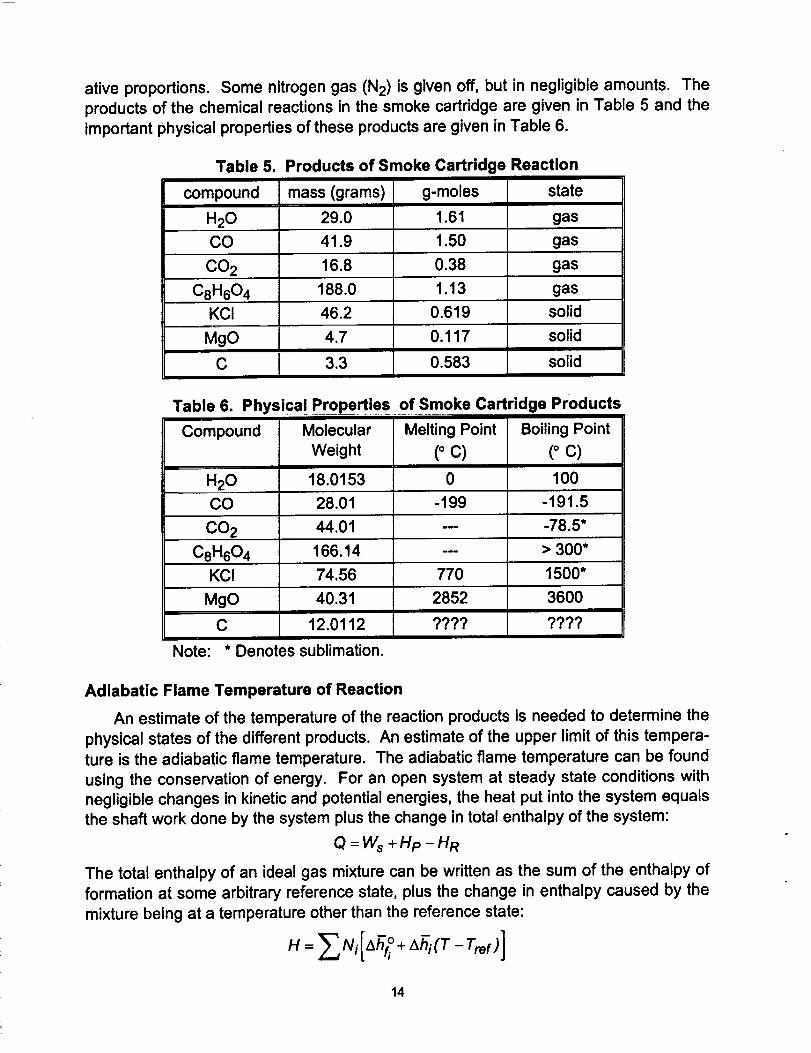
ative proportions. Some nitrogen gas (N2) is given off, but in negligible amounts. The
products of the chemical reactions in the smoke cartridge are given in Table 5 and the
important physical properties of these products are given in Table 6.
Table 5.
compound
H20
Products of Smoke Cartridge Reaction
C8H604
mass (grams)
29.0
CO 41.9
CO 2 16.8
188.0
KCI
MgO
c
46.2
g-moles
1.61
state
gas
1.50 gas
0.38 gas
1.13
0.619
0.117
0.583
gas
solid
solid
solid
Table 6. Physical Properties of Smoke Cartridge Products
Compound
H20
CO
CO 2
C8H604
KCI
MgO
C
Molecular
WeightII
18.0153
28.01
44.01
166.14
74.56
40.31II
12.0112
Note: * Denotes sublimation.
Melting Point
(°C)0
Boiling Point
(°C)100
-199 -191.5
.... 78.5*
--- > 300*
770
2852
????
1500"
3600
????
Adiabatic Flame Temperature of Reaction
An estimate of the temperature of the reaction products is needed to determine the
physical states of the different products. An estimate of the upper limit of this tempera-ture is the adiabatic flame temperature. The adiabatic flame temperature can be found
using the conservation of energy. For an open system at steady state conditions with
negligible changes in kinetic and potential energies, the heat put into the system equals
the shaft work done by the system plus the change in total enthalpy of the system:
Q=Ws +Hp-H R
The total enthalpy of an ideal gas mixture can be written as the sum of the enthalpy of
formation at some arbitrary reference state, plus the change in enthalpy caused by the
mixture being at a temperature other than the reference state:
H=_Ni[_h_+Ahi(T-Tref)]
14
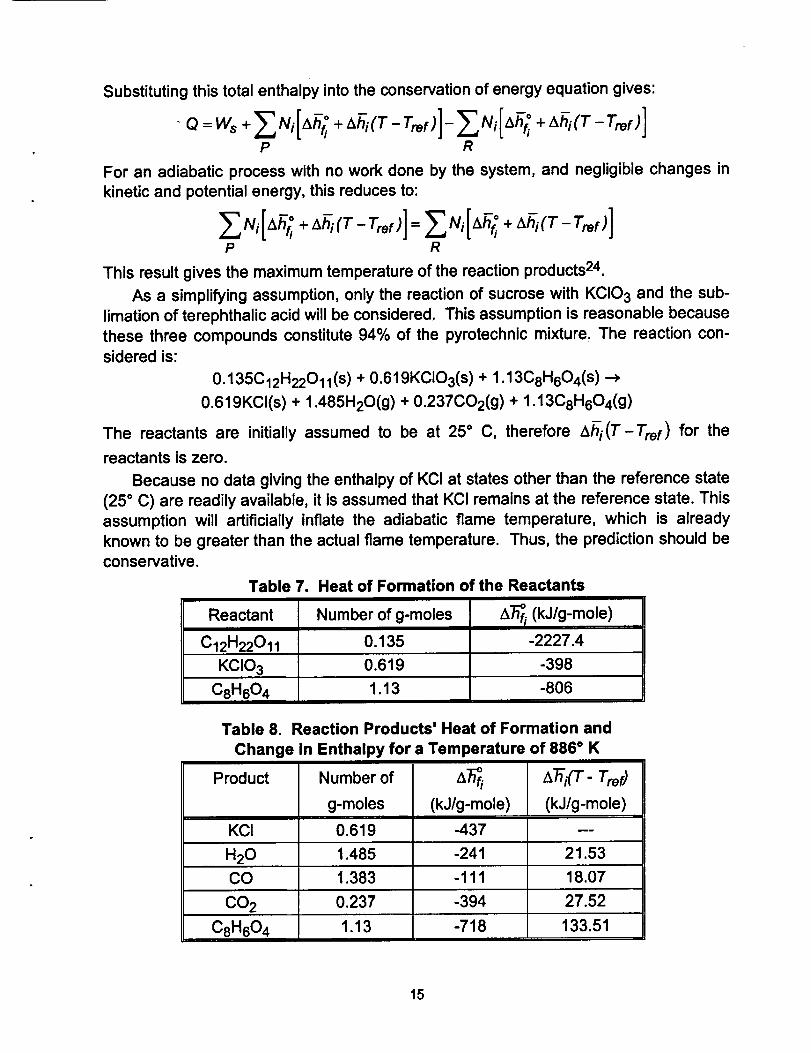
Substituting this total enthalpy into the conservation of energy equation gives:
p R
For an adiabatic process with no work done by the system, and negligible changes in
kinetic and potential energy, this reduces to:
p R
This result gives the maximum temperature of the reaction products 24.
As a simplifying assumption, only the reaction of sucrose with KCIO 3 and the sub-
limation of terephthalic acid will be considered. This assumption is reasonable because
these three compounds constitute 94% of the pyrotechnic mixture. The reaction con-sidered is:
The reactants are initially assumed to be at 25 ° C, therefore z_i(T-Tref) for the
reactants is zero.
Because no data giving the enthalpy of KCI at states other than the reference state
(25 ° C) are readily available, it is assumed that KCI remains at the reference state. This
assumption will artificially inflate the adiabatic flame temperature, which is already
known to be greater than the actual flame temperature. Thus, the prediction should beconservative.
Table 7.
Reactant Number of g-moles
C12H22Oll 0.135
KCIO 3 0.619
C8H604 1.13
Heat of Formation of the Reactants
A_f/(k J/g-mole)
-2227.4
-398
-806
Table 8. Reaction Products' Heat of Formation and
Change In Enthalpy for a Temperature of 886 ° K
Product
KCI
H20
CO
CO 2
C8H604
Number of
g-moles
0.619
(kJ/g-mole) (kJ/g-mole)
-437 ---
1.13
21.531.485 -241
1.383 -111 18.07
0.237 -394 27.52
-718 133.51
15
The temperature of the products at which the sums of the enthalpies of the prod-ucts and reactants are equal is 886 ° K or 613 ° C. Table 7 gives the number of moles
present and the heat of formation at the reference state of each reactant. Table 8 givesthe number of moles present, the heat of formation at the reference state, and the
change in enthalpy for a temperature of 886 ° K for each product24, 25.
Table 6 shows that water, 400
carbon monoxide, carbon
dioxide, and terephthalic acid
are in the gaseous state at ,_613 ° C, while potassium chlo-
ride and magnesium oxide re- _ 300main in the solid state;
hence,the initial assumptionsI.,-
concerning the physical statesof the reaction products are _:
correct. It follows that the _ 200gaseous mixture in the smoke
generating system contains
only water vapor, carbon
monoxide, carbon dioxide, and
terephthalic acid. 100
Thermodynamic Properties
of Terephthalic Acid
The enthalpy of tereph-
thalic acid can be found using a method given by Daubert and Danner 25, The ideal gasheat capacity, shown in Figure 7, is:
J
0 400 800 1200 1600
TEMPERATURE ('K)
Figure 7. Ideal Gas Heat Capacity
of Terephthalic Acid
'where A = 97000, B = 293800, C = 27620, D = 1.6442, and T is the temperature in °K
and the units for ideal gas heat capacity are J/kg-mole"K. These coefficients are valid
for temperatures ranging from 100°K to 1500°K. Assuming the terephthalic acid
behaves as an ideal gas, the change in enthalpy due to a change in temperature can
be found by integrating the ideal gas heat capacity with respect to temperature:
=J'T C°The ideal gas heat capacity with the exponential expanded in series form is:
co = 97000+29380011. 27620 276202 276203 1_"2!T2(1.6442) 3!T3(1.6442) +'"
Or, alternatively:
16
0o=9,ooo 9 8oozE 1 o1Term by term integration leads to:
T2
AH= _ COdT = (97000 * 293800)T (-1) m
7"1 T1
The summation is carried out until the last term alters the sum less than 0.01%.
The enthalpy change due to a change in temperature is called the sensible enthalpy
change. The summation of the sensible enthalpy change with the heat of formation or
enthalpy due to the chemical makeup of the gas gives the total enthalpy for any
temperature.-3
-5
-7...j
-80
.
i
s¢ t I | i t _ I I i I _ I • t t J I I I I J t t 1 ( r ! }
400 800 1200 1600
TEMPERATURE (°K)
Figure 8. Ideal Gas Total Enthalpy
of Terephthalic Acid
The heat of formation of
terephthalic acid at 298 °K
and one atmosphere is
717,890 kJ/kg-mole. The
ideal gas total enthalpy for
terephthalic acid (Figure 8) is
approximated as a third order
polynomial curve. The heat offormation is based on an
arbitrary reference state inwhich elements in their natu-
ral, stable state have an en-
thalpy of 0 at one atmosphereand 25 °C. However,
enthalpy as used in the en-
ergy equation, generally iszero at 0 °K. To obtain an
ideal gas enthalpy for tereph-thalic acid for use in the en-
ergy equation, 741,088 kJ/kg-
mole must be added to the heat of formation plus the sensible enthalpy change so that
the enthalpy equals zero at 0 °K. The enthalpy of terephthalic acid with a value of zero
at the reference state (0 °K) is shown in Figure 9.
Mixture Properties
The properties of a mixture of ideal gases are determined by its composition and
temperature. The composition of the smoke mixture is given in Table 9, along with the
critical temperature and pressure of each component. Since the pressure in the system
17
will be much lower than the 4
critical pressure of all of the
mixture components, the mix-ture can be assumed to _obehave as an ideal gas. ,_, 3
The molecular weight of amixture of ideal gases is equal
to the mass of the mixture
divided by the number of _ 2moles. The mixture molecular
weight is M m = 59.7 atomic
mass units (amu). The gasconstant of a mixture of ideal _ I
gases can be found by dividing
the universal gas constant by
the molecular weight. The gas 0constant of the mixture is R m = 00.139 kJ/kg ° K.
Figure 9.
!
400 800 1200 1600
TEMPERATURE (°K)
Enthalpy of Terephthalic Acid for Use in
Conservation of Energy
Component
C8H604
Mass
(grams)
188
CO2
Table 9. Mixture Composition
Weight Critical Temperature
(oK)1390
Critical Pressure
(%)r
68
(psi)
573
CO 41.9 1541 133 508
H2o 29 11 647 18.03204
16.8 6 304.2 1072
The specific enthalpy of a mixture of ideal gases is dependent on the temperature
and composition of the mixture. The specific enthalpy at any temperature can be found
by summing the contribution of each of the mixture components. The specific enthalpy
on a mass basis is given by:
h m = _ m_hii
where mf/is the mass fraction of the ith component (the mass of the ith component di-
vided by the total mass). The specific enthalpy on a molar basis is given by:
18
where Yi is the mole fraction of the ith component (the number of moles of the ith com-
ponent divided by the total number of moles).
Table 10. Mass Fractions and Mole Fractions for the Smoke Mixture Compounds
0 i , _,_T'_7-,, , I , , , i , i , I , , , i , , , I , i , i , i , I
0 400 800 1200 1600TEMPERATURE (° K)
Figure 10. Specific Enthalpy of Tereph-thalic Acid Used in Conservation of Energy
2000
>.(5 1200:
80_
00
iI
............. • ............................................. i ................... t........ i
_ i,l,i,i,i,l=l,l'l,i,l'i,;,I-I 1
400 800 1200 1600
TEMPERATURE ('K)
Internal Energy of the Mixture
400
0.245
0.325
0.348
0.083
The specific enthalpies of CO, H20,
and CO 2 can be found in tables in most
introductory thermodynamics texts. The
specific enthalpy of terephthalic acidwas discussed earlier. The mass
fractions and mole fractions of the
smoke mixture are given in Table 10.
The specific enthalpy on a molar basisfor the mixture, as well as each
component, is shown in Figure 10. The
enthalpy of the mixture on a mass basis
is the enthalpy on a molar basis divided
by the molecular weight, 59.7 amu.
Another important thermodynamic
property is internal energy, which prop-
erty can be found from enthalpy, the
ideal gas constant, and temperature:
h m = Um + RmT
The internal energy on a mass basis
for the gaseous mixture is shown in
Figure 11.
Figure 11.
Pressure Rise and Exit Velocity Es-timation
The laws of conservation of mass
and energy applied to the control volumeshown in Figure 12, along with
simplifying assumptions which will be dis-
cussed shortly, can be used to estimate
the pressure buildup in the system
caused by shutting off the flow of smoke.The law of conservation of mass can be
expressed as:
19
A_ Ao v
Conservation of energy gives:
w+ f (h+ ep + ek VndA-A,
* ep * *
The
(1)
(2)
1/
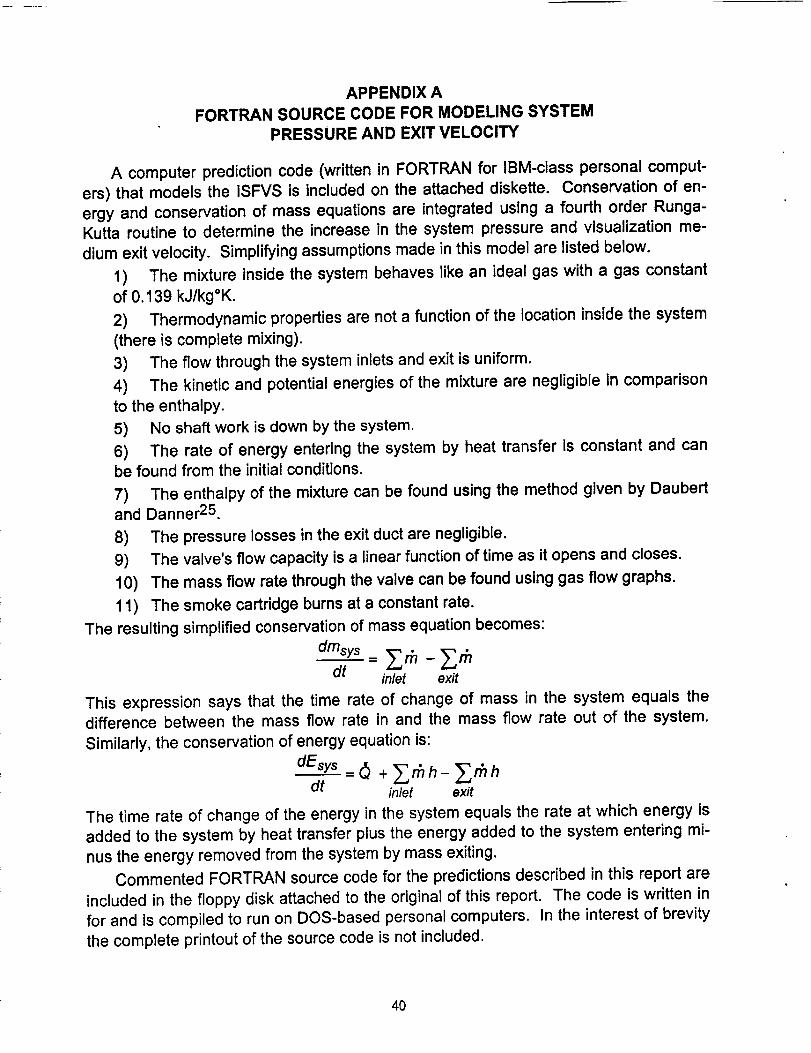
simplifying assumptions are:
The mixture inside the systembehaves as an ideal gas.
Thermodynamic propertiesare not a function of the loca-
tion inside the system (there is
complete mixing).
SYSTEM
BOUNDARY _1-- -- _1 MASS FLOW
----i-PLENUM
CHAMBER
MASS FLOWIN
CARTRIDGECONTAINER
SMOKECARTRIDGE
Figure 12. Thermodynamic Control Volume
(3)
(4)
(5)(6)
(7)(8)(9)(10)
(11)
The flow through the system inlets and exits is uniform.
The kinetic and potential energies of the mixture are negligible compared to
the enthalpy.
No shaft work is done by the system.
The rate of energy entering the system by heat transfer is constant and canbe found from the initial conditions.
The enthalpy of the mixture can be found as outlined previously.
The pressure losses in the exit duct are negligible.
The valve's flow capacity is a linear function of time as it opens and closes.
The mass flow rate through the valve can be found using available gas flowgraphs 26.
The smoke cartridge burns at a constant rate.
Using assumptions 2 through 5 and rearranging, conservation of mass reduces to:
fnsys= _fn-_fninlet exit
Similarly, conservation of energy reduces to:
L-sys= (_+ _fnh- fnh,
inlet exit
where the system energy (Esys) is the specific internal energy multiplied by the mass inthe system: Esys = pu?)
Once the initial conditions have been determined, the two conservation equations
(mass and energy) can be integrated numerically. The initial conditions are found by
measuring the pressure and temperature in the system and the temperature of the
mass entering the system. It is assumed that the system has initially reached a steady
2O
state condition. This assumption requires a constant burn rate in the smoke cartridge.
Although the burn rate is not perfectly constant, the mass flow rate into the system
changes siowly compared to the mass flow rate out of the system as the valve closes
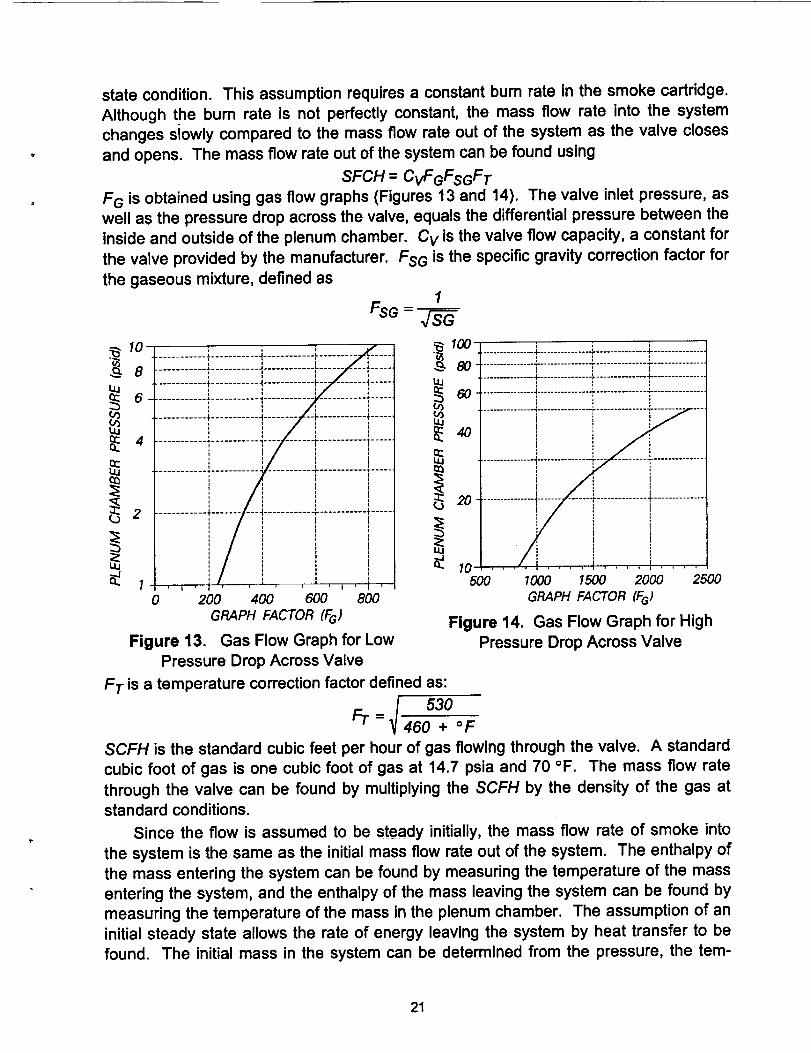
and opens. The mass flow rate out of the system can be found using
SFCH = CvFGFsGF T
F G is obtained using gas flow graphs (Figures 13 and 14). The valve inlet pressure, aswell as the pressure drop across the valve, equals the differential pressure between theinside and outside of the plenum chamber. C v is the valve flow capacity, a constant for
the valve provided by the manufacturer. FSG is the specific gravity correction factor for
the gaseous mixture, defined as1
FSG =_
10 ..... , , ,_
....... _ ........... J ............ L ...............
............ _ ........... j ............ L ......... ,L ......
i I I I& 8 ............ _........... _............ _.....
_ v I a iLU 6 ............ _........... !............ , ........... t,......
Figure 14. Gas Flow Graph for HighPressure Drop Across Valve
F T is a temperature correction factor defined as:
_/ 530.
Fr = 460 + °F
SCFH is the standard cubic feet per hour of gas flowing through the valve. A standard
cubic foot of gas is one cubic foot of gas at 14.7 psia and 70 °F. The mass flow rate
through the valve can be found by multiplying the SCFH by the density of the gas atstandard conditions.
Since the flow is assumed to be steady initially, the mass flow rate of smoke into
the system is the same as the initial mass flow rate out of the system. The enthalpy of
the mass entering the system can be found by measuring the temperature of the mass
entering the system, and the enthalpy of the mass leaving the system can be found by
measuring the temperature of the mass in the plenum chamber. The assumption of an
initial steady state allows the rate of energy leaving the system by heat transfer to be
found. The initial mass in the system can be determined from the pressure, the tem-
21
perature, and the volume; the initial total system energy is obtained from the initialmass and the temperature.
The valve flow capacity is assumed to change linearly with time as it closes or
opens. The gas flow graphs give the mass flow rate through the valve as it cycles.
The exit velocity of the smoke is calculated by dividing the mass flow rate through
the valve by the density of the smoke times the exit area. The density of the exit smoke
is determined by the ambient pressure and the exit temperature of the smoke.
TEST RESULTS
Experimental Procedure
Ten experiments were conducted to obtain the data needed to determine the pres-sure rise estimation initial conditions, and to verify the pressure rise and exit velocity
estimations. The first experiment was used to ensure that the pressure transducer
stand-off would keep the temperature at the pressure transducer from rising above therecommended level, and that no residue would contaminate the pressure transducer.
The next six experiments were used to work out problems involving data collection,
valve reliability, and valve control. The last three experiments validated the pressure
rise and exit velocity predictions for different system volumes.
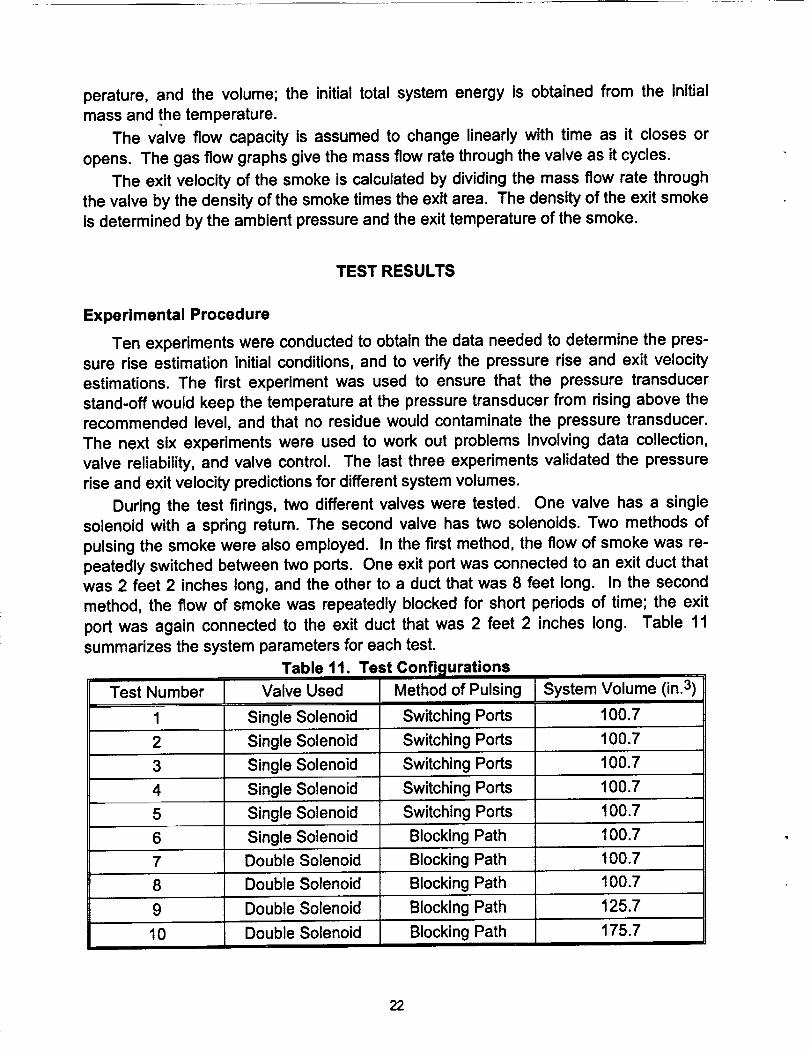
During the test firings, two different valves were tested. One valve has a single
solenoid with a spring return. The second valve has two solenoids. Two methods of
pulsing the smoke were also employed. In the first method, the flow of smoke was re-
peatedly switched between two ports. One exit port was connected to an exit duct thatwas 2 feet 2 inches long, and the other to a duct that was 8 feet long. In the second
method, the flow of smoke was repeatedly blocked for short periods of time; the exit
port was again connected to the exit duct that was 2 feet 2 inches long. Table 11
summarizes the system parameters for each test.
Table 11. Test ConfigurationsTest Number Valve Used Method of Pulsing System Volume (in.3)
2
3
4
5
6
7
8
9
10
Single 100.7
Single
Solenoid Switching Ports
Single Solenoid Switching Ports 100.7
Single Solenoid Switching Ports 100.7
Single Solenoid Switching Ports 100.7
Single Solenoid Switching Ports 100.7
Solenoid Path 100.7
Double Solenoid
Double Solenoid
Double Solenoid
Blocking
Blocking Path
Blocking Path
Blocking Path
Blocking PathDouble Solenoid
100.7
100.7
125.7
175.7
22
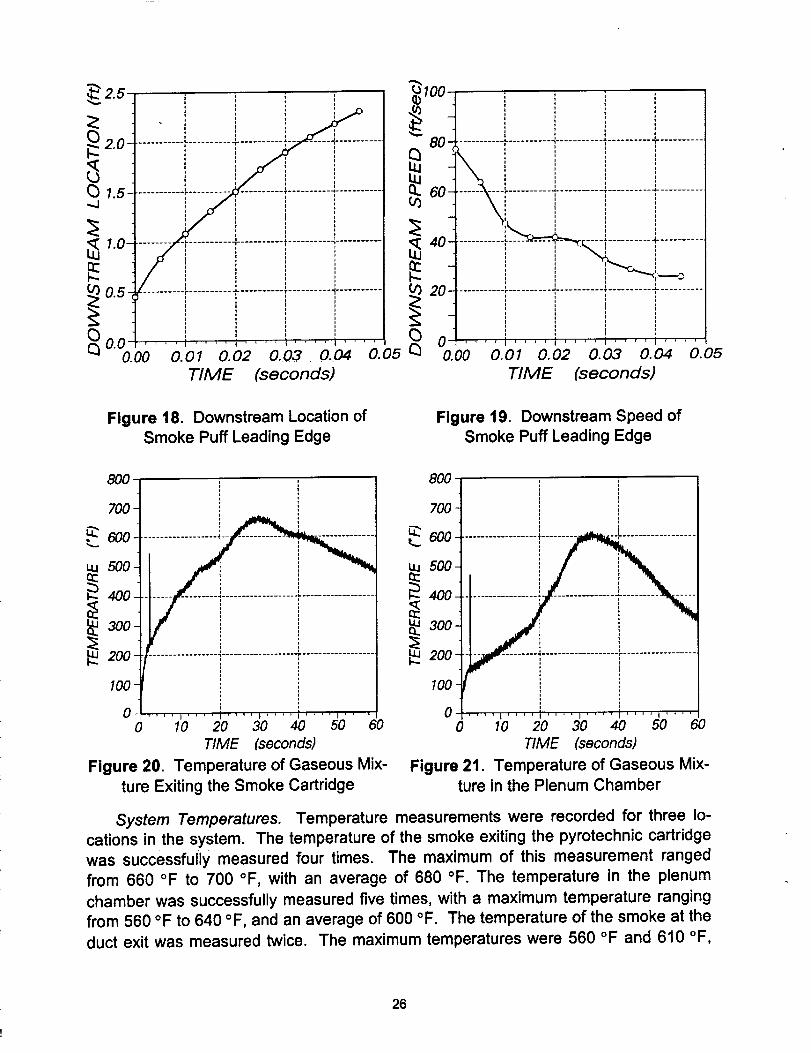
During firings 2 through 8, measurements of differential pressure between the in-
side and outside of the plenum chamber, and temperatures at the smoke cartridge exit,
in the pler_um chamber, and at the duct exit were taken. In tests 9 and 10, dynamic
pressure at the duct exit was measured using a pitot-static probe. Temperature at theduct exit was not measured. All data were taken for a 60 second period at 1000 sam-
ples per second for each channel, beginning with ignition of the smoke cartridge.
During each experiment, the flow of smoke out of the duct was recorded on VHS
video tapes using two cameras, for later analysis using the video imaging system. A
shop fan was used to keep the smoke moving once it left the exit duct.
Experimental Results
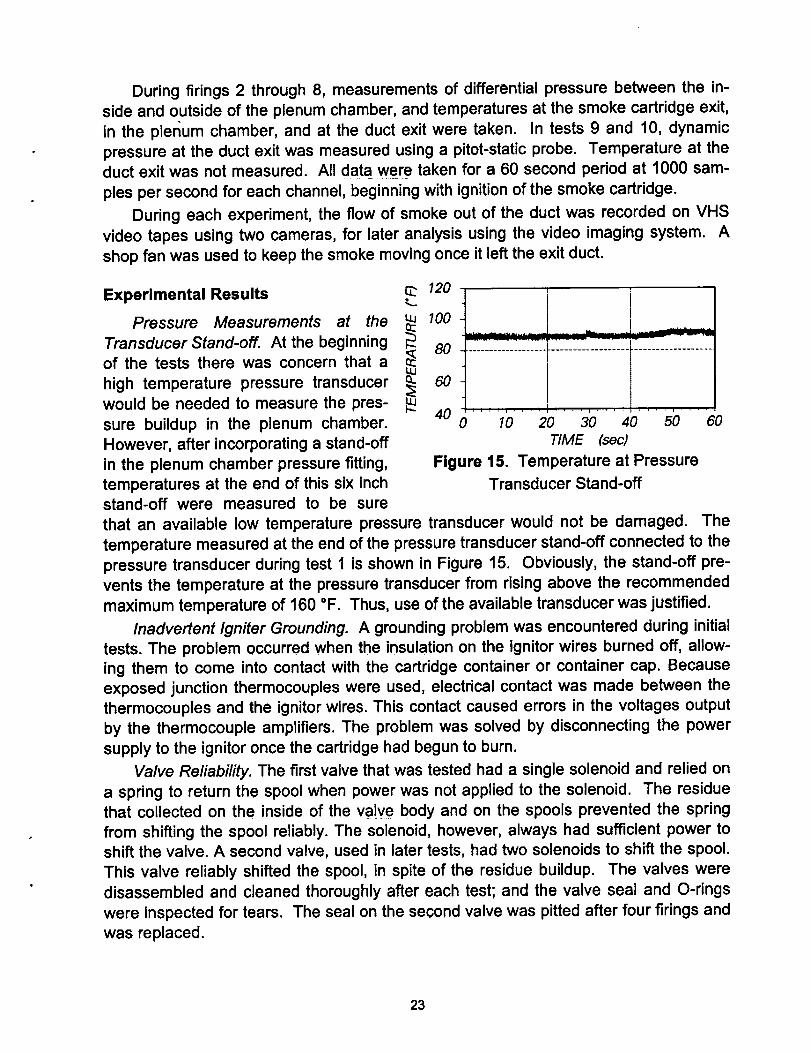
Pressure Measurements at the LuccTransducer Stand-off. At the beginning
of the tests there was concern that a
high temperature pressure transducer C-would be needed to measure the pres-
sure buildup in the plenum chamber.
However, after incorporating a stand-off
in the plenum chamber pressure fitting,temperatures at the end of this six inchstand-off were measured to be sure
120
100
8O
60
jI
k=... _j= ,.. ...... ,I........ "=ll*=J " T _" -
....................................... p ..................
I
40 ..................0 10 20 30 40 50
_ME _e_
Figure 15. Temperature at Pressure
Transducer Stand-off
6O
that an available low temperature pressure transducer would not be damaged. The
temperature measured at the end of the pressure transducer stand-off connected to the
pressure transducer during test 1 is shown in Figure 15. Obviously, the stand-off pre-
vents the temperature at the pressure transducer from rising above the recommended
maximum temperature of 160 °F. Thus, use of the available transducer was justified.
Inadvertent Igniter Grounding. A grounding problem was encountered during initial
tests. The problem occurred when the insulation on the ignitor wires burned off, allow-
ing them to come into contact with the cartridge container or container cap. Because
exposed junction thermocouples were used, electrical contact was made between thethermocouples and the ignitor wires. This contact caused errors in the voltages output
by the thermocouple amplifiers. The problem was solved by disconnecting the power
supply to the ignitor once the cartridge had begun to burn.
Valve Reliability. The first valve that was tested had a single solenoid and relied on
a spring to return the spool when power was not applied to the solenoid. The residuethat collected on the inside of the valve body and on the spools prevented the spring
from shifting the spool reliably. The solenoid, however, always had sufficient power toshift the valve. A second valve, used in later tests, had two solenoids to shift the spool.
This valve reliably shifted the spool, in spite of the residue buildup. The valves were
disassembled and cleaned thoroughly after each test; and the valve seal and O-rings
were inspected for tears. The seal on the second valve was pitted after four firings and
was replaced.
23
(a) t = 0.000 (b) t = 0.010 sec
(c) t = 0.020 sec0
(d) t = 0.030 sec
..J
i TM
192
240
_i| Contrasting pixe/s detected that definethe leading edge of the smoke puff
Centroids of / Centroidal path
leading edge_ /
II II II II
I = I i 1 i I * | _ I i I i
0 32 64 96 12B 160 192 224 256
HORIZONTAL LOCATION (pixels)
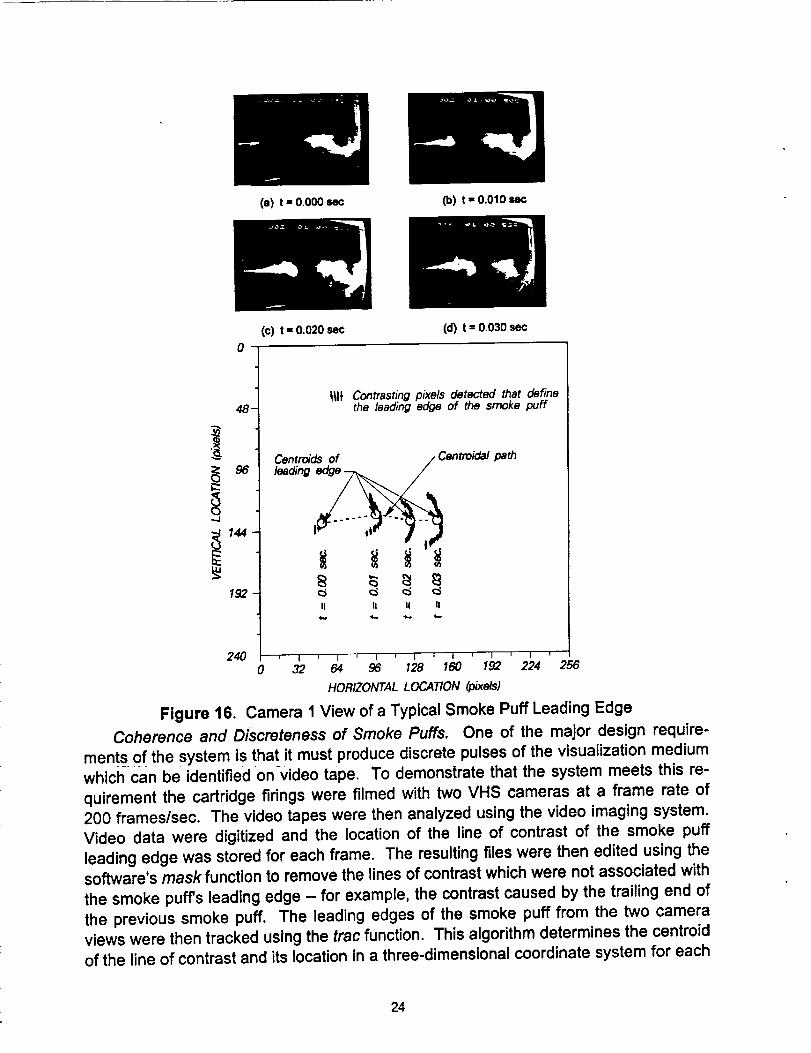
Figure 16. Camera 1 View of a Typical Smoke Puff Leading Edge
Coherence and Discreteness of Smoke Puffs. One of the major design require-
ments of the system is that it must produce discrete pulses of the visualization medium
which can be identified on video tape. To demonstrate that the system meets this re-
quirement the cartridge firings were filmed with two VHS cameras at a frame rate of
200 frames/sec. The video tapes were then analyzed using the video imaging system.
Video data were digitized and the location of the line of contrast of the smoke puff
leading edge was stored for each frame. The resulting files were then edited using thesoftware's mask function to remove the lines of contrast which were not associated with
the smoke puff's leading edge - for example, the contrast caused by the trailing end of
the previous smoke puff. The leading edges of the smoke puff from the two camera
views were then tracked using the trac function. This algorithm determines the centroid
of the line of contrast and its location in a three-dimensional coordinate system for each
24
frame. The resulting file gave the smoke puff's trajectory as a function of time. Each
component was then differentiated numerically with respect to time to find the speed of
the smoke puff in each coordinate direction.
Photographs of four frames from camera 1 of a typical smoke puff, as well as the
resulting masked and centroid files, are shown in Figure 16. The frames shown were
recorded 0.01 seconds apart. Figure 17 shows four frames of the same smoke puff as
seen by camera 2. Because of a limitation of the VCR used when photographing the
frames they do not correspond to those shown in Figure 16. Instead they lag behind by
0.005 seconds. It is clear that the leading edge of the smoke puff was recorded faith-
fully and digitized by the automated video imaging hardware and software. The
location of the smoke puff downstream of the exit duct is shown in Figure 18 and its
speed in the corresponding direction is shown in Figure 19.
(a) t = 0.005 sec (b) t = 0.015 sec
..J
(c) t = 0.025 sec (d) t = 0.035 sec0
! ! ! ! Contrasting pixelsthe leading edge of the smoke puff
48
Centroids of / Centroidal path
144
192 ¢:; ¢5 ¢5II II II II
detected that define
240 , i i 1 i t , i + i
0 32 64 96 128 160 192 224 256
HOR/ZONTAL LOCATION (pixels)
Figure 17. Camera 2 View of a Typical Smoke Puff Leading Edge
................... _--°m ............... b ..................
0 ,,, ........ , .... t
0 10 20 30 40 50 60TIME (seconds)
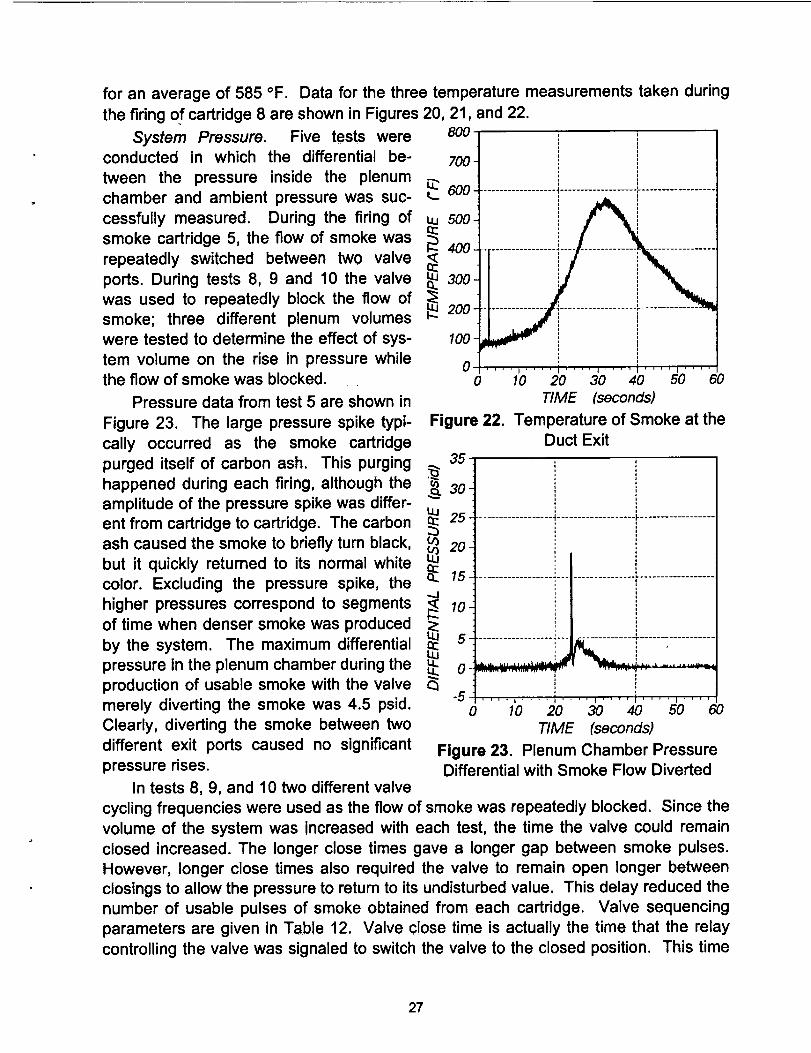
Figure 23. Plenum Chamber PressureDifferential with Smoke Flow Diverted
cycling frequencies were used as the flow of smoke was repeatedly blocked. Since the
volume of the system was increased with each test, the time the valve could remain
closed increased. The longer close times gave a longer gap between smoke pulses.
However, longer close times also required the valve to remain open longer between
closings to allow the pressure to return to its undisturbed value. This delay reduced the
number of usable pulses of smoke obtained from each cartridge. Valve sequencing
parameters are given in Table 12. Valve close time is actually the time that the relay
controlling the valve was signaled to switch the valve to the closed position. This time
27
increment includes the response time of the relay and the valve. The response time of
the relay is uncertain and varies from cycle to cycle up to 8.3 msecs. This uncertaintyis due to its dependence on the phase of the line power when the relay is signaled to
switch the valve. Valve cycle time is the time between signals to close the valve. The
number of cycles is the number of cycles the valve switched at that frequency before
alternating with the other frequency.
Test Number
Table 12. Timing of Valve Sequences
Valve Close Time
(msecs)
,I
Valve Cycle Time
(msecs)
Number of Cycles
8 38 150 12
8 58 200 11
9 40 250 6
9 70 300 5
10 55 300 5
10 35090
35
°130
25 .................. _.........
20 q
_. 15'
_ g
-5
_ 30
6
, !
; ii i
i i
i l
i l
,,,,,....i....,....i....,....0 10 20 30 40 50 60
TIME (seconds)
l .l, _Jl :'lil Ii_.:,.
0 10 20 30 40 50 60TIME (seconds)
Figure 24. Plenum Chamber Pressure
During Test Number 8
Figure 25. Plenum Chamber Pressure
During Test Number 9
Figures 24, 25, and 26 show the pressure data from tests 8, 9, and 10, respectively. It
is evident that blocking the flow of smoke caused only small pressure rises in the sys-
tem. It did not raise the pressure to anywhere near the rupture disk burst pressure of
55 to 75 psid. In fact the worst case pressure rise in test number 8 still left a margin of
approximately half of the design rupture disk burst pressure.
The pressure changes caused by six valve openings during test 9 are shown in
more detail in Figure 27. The pressure begins to rise as the valve closes and then,
when the valve reopens, the pressure decays exponentially until the valve closes again.
28
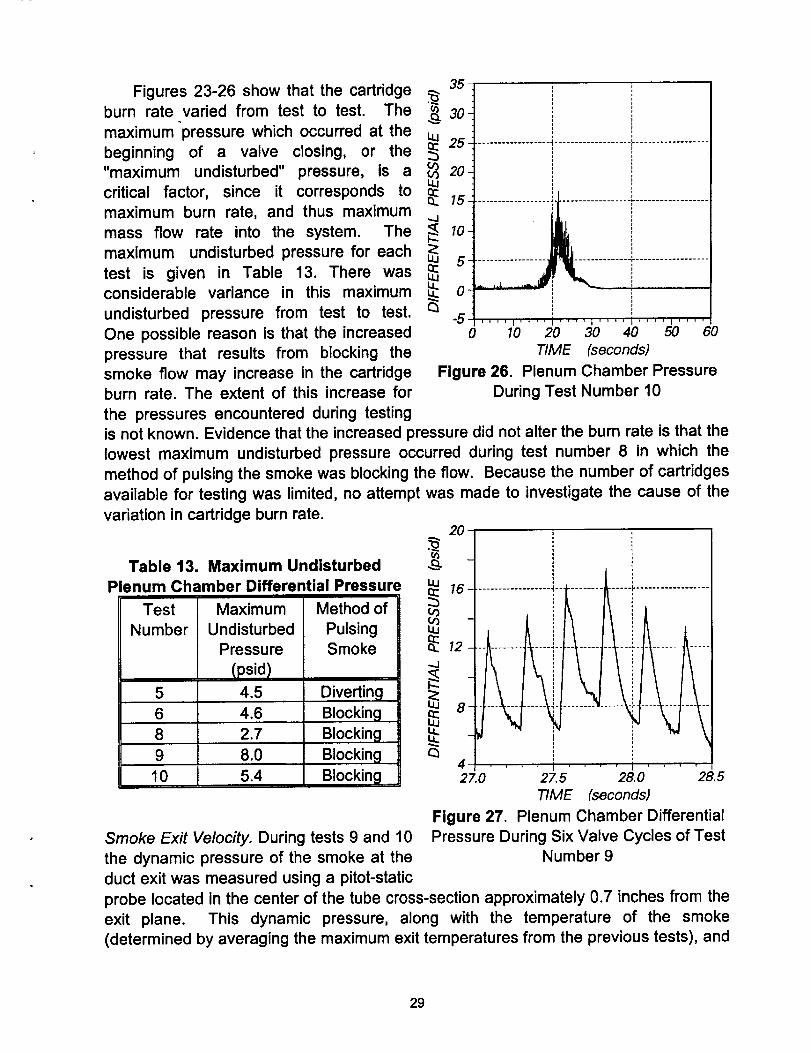
Figures 23-26 show that the cartridge _ 35
burn rate.varied from test to test. The _ 30maximum pressure which occurred at the Lu
25beginning of a valve closing, or the
"maximum undisturbed" pressure, is a _ 20
critical factor, since it corresponds to _. 15maximum burn rate, and thus maximum
mass flow rate into the system. The _ 10
maximum undisturbed pressure for each _ 5
test is given in Table 13. There was _considerable variance in this maximum _ 0
undisturbed pressure from test to test.
One possible reason is that the increased
pressure that results from blocking the
smoke flow may increase in the cartridgeburn rate. The extent of this increase for
the pressures encountered during testing
-5 .... i .... I .... = .... i .... I ....0 10 20 30 40 50 60
TIME (seconds)
Figure 26. Plenum Chamber Pressure
During Test Number 10
is not known. Evidence that the increased pressure did not alter the burn rate is that the
lowest maximum undisturbed pressure occurred during test number 8 in which the
method of pulsing the smoke was blocking the flow. Because the number of cartridges
available for testing was limited, no attempt was made to investigate the cause of the
variation in cartridge burn rate.
Table 13. Maximum Undisturbed
Plenum Chamber Differential Pressure
Test
Number
Maximum
Undisturbed
Pressure
(psid)4.55
6 4.6
8 2.7
9 8.0
Method of
PulsingSmoke
Diverting
Blocking
Blocking
Blocking
Blocking10 5.4
2O
LU 16 .................. !............... _..................
U_ i =i '
27.0 27.5 28.0 28.5
TIME (seconds)
Figure 27, Plenum Chamber Differential
Pressure During Six Valve Cycles of TestNumber 9
Smoke Exit Velocity. During tests 9 and 10
the dynamic pressure of the smoke at the
duct exit was measured using a pitot-static
probe located in the center of the tube cross-section approximately 0.7 inches from the
exit plane. This dynamic pressure, along with the temperature of the smoke
(determined by averaging the maximum exit temperatures from the previous tests), and
29
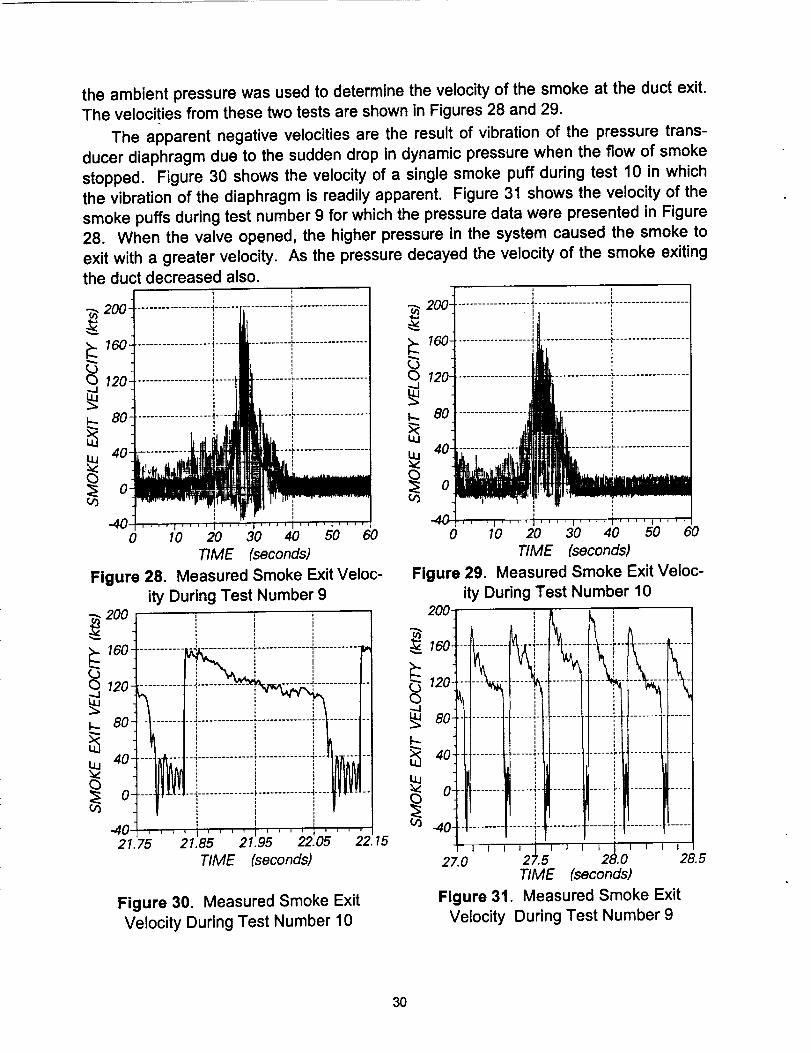
the ambient pressure was used to determine the velocity of the smoke at the duct exit.
The velocities from these two tests are shown in Figures 28 and 29.
The apparent negative velocities are the result of vibration of the pressure trans-
ducer diaphragm due to the sudden drop in dynamic pressure when the flow of smoke
stopped. Figure 30 shows the velocity of a single smoke puff during test 10 in which
the vibration of the diaphragm is readily apparent. Figure 31 shows the velocity of the
smoke puffs during test number 9 for which the pressure data were presented in Figure
28. When the valve opened, the higher pressure in the system caused the smoke to
exit with a greater velocity. As the pressure decayed the velocity of the smoke exitingthe duct decreased also.
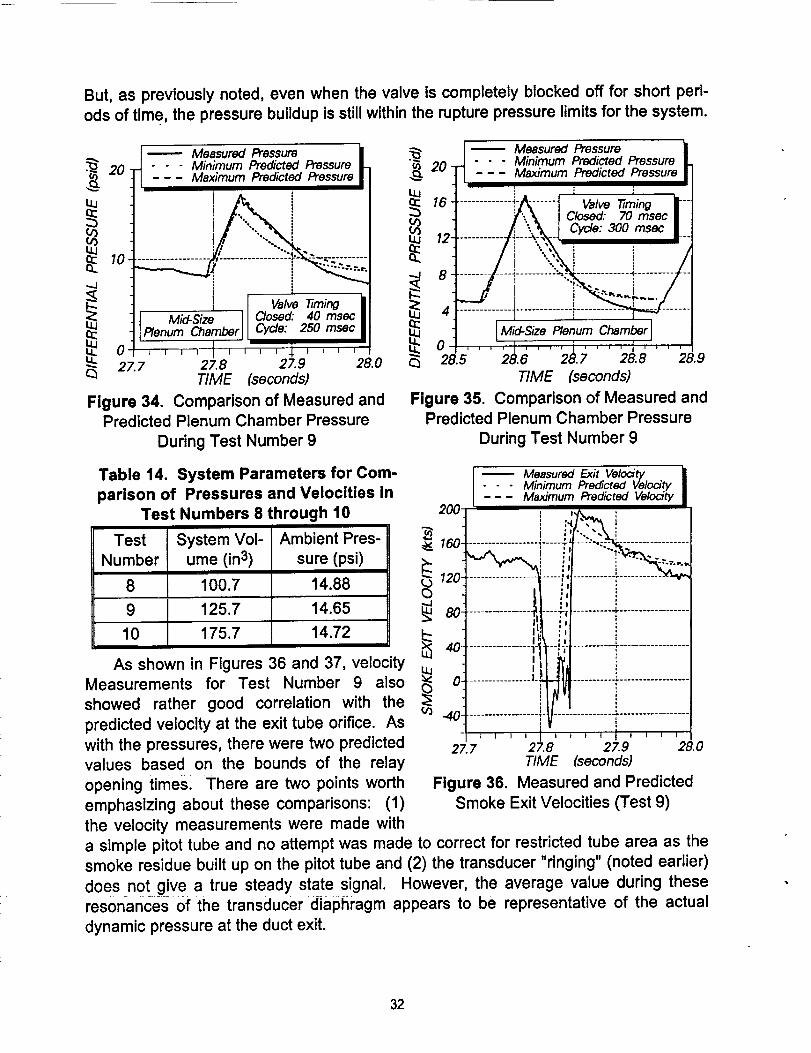
a simple pitot tube and no attempt was made to correct for restricted tube area as the
smoke residue built up on the pitot tube and (2) the transducer "ringing" (noted earlier)
does not give a true steady state signal. However, the average value during theseresonances of the transducer diaphragm appears to be representative of the actual
dynamic pressure at the duct exit.
32
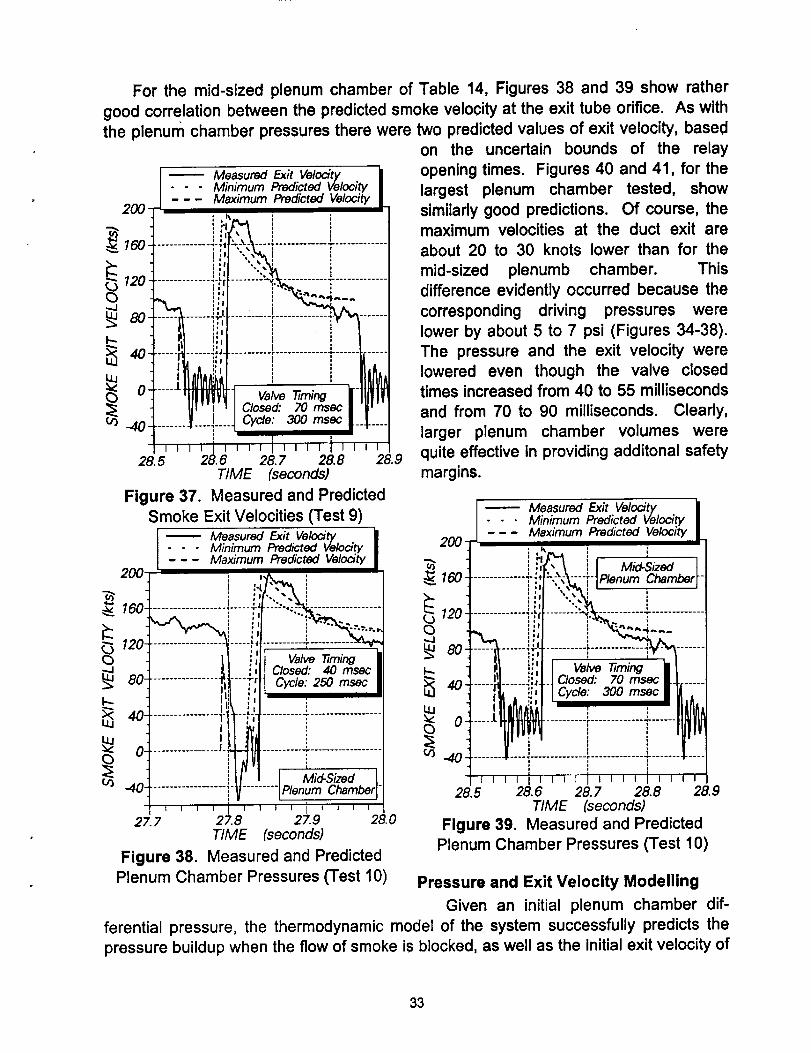
For the mid-sized plenum chamber of Table 14, Figures 38 and 39 show rather
good correlation between the predicted smoke velocity at the exit tube orifice. As with
the plenum chamber pressures there were two predicted values of exit velocity, basedon the uncertain bounds of the relay
MeasuredExit Velocity opening times. Figures 40 and 41, for the---Minimum PredictedVelocity largest plenum chamber tested, show
Maximum Predicted Velocity
200 ._- i similarly good predictions. Of course, the"!}'_ = maximum velocities at the duct exit are
18o................:_r-.-_.\....'r.......... ,,:',,I "..;,_, , , about 20 to 30 knots lower than for the
i i,I "..:,_. i mid-sized plenumb chamber. This120 __rt........ _,"E;. :=:,_ = ,_,--,,,.,.L_ difference evidently occurred because the
80 -----[_ .,,1__' ...... T_"I, lower by about 5 to 7 psi (Figures 34-38).,_l ::,1 ! E I
u_ 40 ......_1...... _i,t_ ........ " ...... |_..... The pressure and the exit velocity wereitt , ::1 i i ti.==llanA_,_l i i Ill/t^= lowered even though the valve closed
o ..... w ' i times increased from 40 to 55 millisecondsIIl"i'] I Closed: 70 rnsec I "i ' - and from 70 to 90 milliseconds. Clearly,
..4o.......--1....i.... I--i-.... larger plenum chamber volumes werei i
28._.9 quite effective in providing additonal safetyT/ME (seconds) margins.
Maximum Predicted VelocityMeasured Exit Velocity 200-Minimum Predicted VelocityMaximum Predicted Velocity
200 -
160
120
k..
Mid-SizedPlenum Chamber
27. 7 27.8 27.9T/ME (seconds)
Figure 38. Measured and PredictedPlenum Chamber Pressures (Test 10)
.0
28.5 28.7 28.8 28.9TIME (seconds)
Figure 39. Measured and Predicted
Plenum Chamber Pressures (Test 10)
Pressure and Exit Velocity Modelling
Given an initial plenum chamber dif-
ferential pressure, the thermodynamic model of the system successfully predicts the
pressure buildup when the flow of smoke is blocked, as well as the initial exit velocity of
33
the smoke after the valve is opened. The model is valid for a variety of system volumesand valve closing sequences and may be used to predict the pressure and exit veloci-ties for system parameters which have not yet been tested.
}JR I Lar[Jest12o...............!if--:::-._--i_,,,;c_,,,ber.
!40 - i ' ' '
_'l I V;,v,,_m,,_'i llA,0 J_l---4 Closed: ,._ msec l---lUll
-40_ ......i..........!............._...........'-2_ ""]--_" i I ' 12j I I I 12_ I I I '23.7 .8 9 24.0
TIME (seconds)
Figure 41. Measured and Predicted
Smoke Exit Velocities (Test 10)
The model does have limitations, of
course. First, there is uncertainty as to what
value of maximum undisturbed pressure should be used as the Initial condition. For the
five tests conducted maximum undisturbed pressures ranged from 2.7 psid to 8.0 psid.
The mean was 5.0 psid, and the standard deviation was 1.7 psid. The sparsity of datamakes it difficult to determine what pressure should be used as an initial condition for
the model. However, as more data are collected in future tests, this problem may bealleviated.
One important case to consider is that
of a system with multiple cartridges burn-
ing at the same time. This approach will
increase the mass flow rate into the sys-tem and, hence, the maximum undis-
turbed pressure. The maximum mass
flow rate into the system is expected to in-
crease in multiples of that encountered
when firing one cartridge according to the
number of cartridges fired. That is, firing
two cartridges simultaneously shoulddouble the maximum undisturbed pres-
sure. The mass flow rate through the
valve is shown in Figure 42 as a function
of plenum chamber differential pressure.
_._6o
_.Lu
(,3
°t , i; i ........
O I l i " I I ! " I I I
0 10 20 30DIFFERENTIAL PRESSURE (psid)
Figure 42. Mass Flow Rate of Smoke
through the Open Valve
To determine the differential pressure to be used as a pressure model initial condition
34
for multiple cartridges, first select the maximum undisturbed differential pressure for
one cartridge and determine the mass flow rate for that pressure. Multiply the singlecartridge mass flow rate by the number of cartridges fired simultaneously and locate the
plenum chamber differential pressure corresponding to that mass flow rate.
Another limitation of the model concerns valves with different flow capacity, or tub-
ing with a smaller inside diameters. The maximum undisturbed pressure data collected
to date are not likely to apply because of the effect of pressure on the cartridge burn
rate. A valve with a lower flow capacity, or smaller tubing, will increase the pressure in
the system, which may in turn increase the burn rate. A valve with a larger flow capacity
will decrease the pressure and the cartridge burn rate will also likely decrease.
Effect of Smoke on the Flow Field
One important issue whenever a seeding medium is used for flow visualization is its
effect on the flow field. The two important factors when determining the extent of the
effect of the seeding medium are its velocity and mass flow rate as it enters the flowfield. Extensive research has been conducted to determine the effect of blowing vor-
tices on aircraft forebodies and swept leading edges, including strakes, especially at
high AOAs. The purpose of these studies was to determine the feasibility and effective-
ness of improving control of the aircraft by controlling the vortical flow by injecting air
into the flow field near the origin of the vortex. In each study an optimum blowing portlocation and orientation was determined to maximize the effectiveness of the blowing
for the configuration being considered. A blowing momentum coefficient defined as:rhV
Cp - qooS
where rh is the mass flow rate of the visualization medium and V is the velocity as it
enters the flow field, was calculated to provide a nondimensional method for comparing
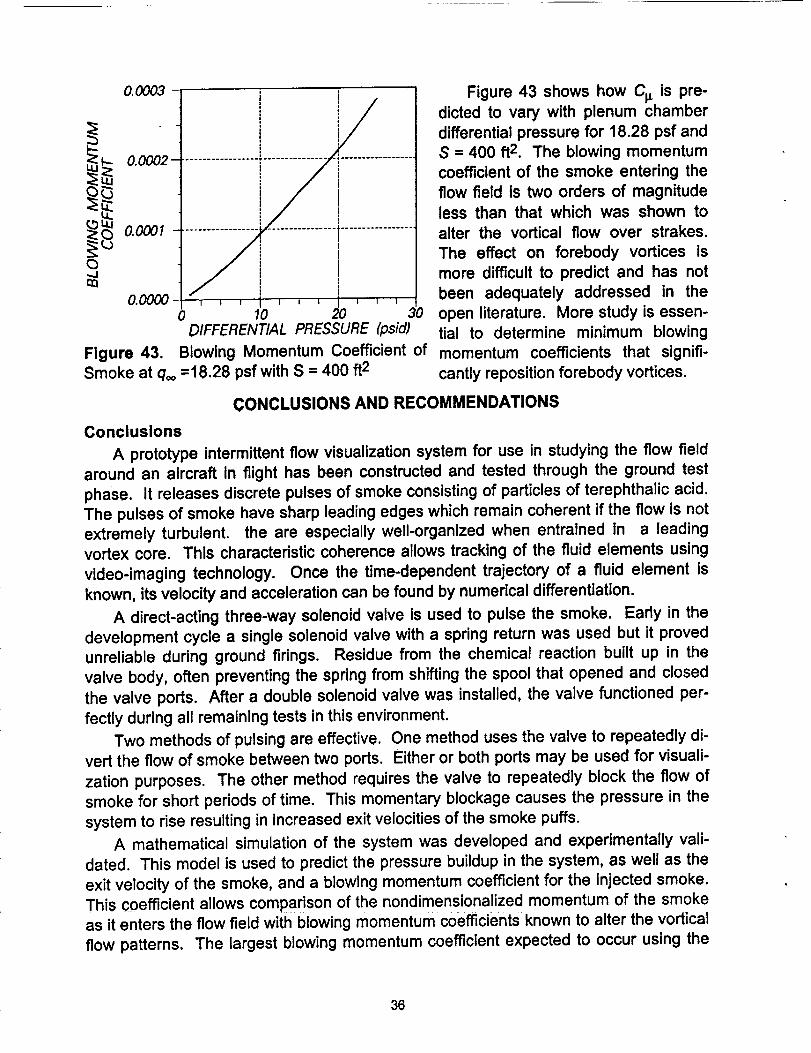
data. Although the visualization medium differs from the air that was used in that it
contains solid particles, and the smoke exit port is not in the optimal location or orienta-
tion for affecting the vortex core, it is appropriate to examine the blowing momentum
coefficient of the smoke to gain some insight into its effect on the flow field.
Bradley and Wray 28 have shown in wind tunnel tests that for aircraft with a strake
configuration, blowing along the strake can strengthen the vortex core and delay vortex
bursting. This is quantifiable in terms of an increased CL. For a the case of blowing the
strake vortex only, on a generic strake configuration with a CI_ of 0.025, CLmax increased
approximately 10%; a C_ of 0.084 caused a CLmax increase of approximately 33%. Awind tunnel study by Skow, et al, 29 has shown that a much lower blowing coefficient is
needed to alter forebody vortices on an F-5F. A C_ of only 0.008 was sufficient tochange the positions of the vortices to a mirror image reflection of the unblown case at
AOAs above 30 °, with 13= 0°. This blowing momentum coefficient caused a reversal in
the direction of the yawing moment. However, the minimum C_ needed to cause thevortex position change was not determined. This critical blowing momentum coefficient
needs to be addressed systematically, both analytically and experimentally, if forebody
vortex control is to be exploited as a component of high AOA control systems.
35
0.0003 -
f- 0.0002-
0.0000 i , , ' 1 , , , I , ' ,0 10 20 J
DIFFERENTIAL PRESSURE (psid)
Figure 43. Blowing Momentum Coefficient ofSmoke at q,_ =18.28 psf with S = 400 ft 2
Figure 43 shows how Cp. is pre-dicted to vary with plenum chamber
differential pressure for 18.28 psf andS = 400 ft2. The blowing momentum
coefficient of the smoke entering the
flow field is two orders of magnitudeless than that which was shown to
alter the vortical flow over strakes.
The effect on forebody vortices is
more difficult to predict and has not
been adequately addressed in the
open literature. More study is essen-
tial to determine minimum blowing
momentum coefficients that signifi-
cantly reposition forebody vortices.
CONCLUSIONS AND RECOMMENDATIONS
Conclusions
A prototype intermittent flow visualization system for use in studying the flow field
around an aircraft in flight has been constructed and tested through the ground test
phase. It releases discrete pulses of smoke consisting of particles of terephthalic acid.
The pulses of smoke have sharp leading edges which remain coherent if the flow is not
extremely turbulent, the are especially well-organized when entrained in a leading
vortex core. This characteristic coherence allows tracking of the fluid elements using
video-imaging technology. Once the time-dependent trajectory of a fluid element is
known, its velocity and acceleration can be found by numerical differentiation.
A direct-acting three-way solenoid valve is used to pulse the smoke. Early in the
development cycle a single solenoid valve with a spring return was used but it proved
unreliable during ground firings. Residue from the chemical reaction built up in the
valve body, often preventing the spring from shifting the spool that opened and closed
the valve ports. After a double solenoid valve was installed, the valve functioned per-
fectly during all remaining tests in this environment.
Two methods of pulsing are effective. One method uses the valve to repeatedly di-
vert the flow of smoke between two ports. Either or both ports may be used for visuali-
zation purposes. The other method requires the valve to repeatedly block the flow of
smoke for short periods of time. This momentary blockage causes the pressure in the
system to rise resulting in increased exit velocities of the smoke puffs.
A mathematical simulation of the system was developed and experimentally vali-
dated. This model is used to predict the pressure buildup in the system, as well as the
exit velocity of the smoke, and a blowing momentum coefficient for the injected smoke.This coefficient allows comparison of the nondimensionalized momentum of the smoke
as it enters the flow field with blowing momentum coefficients known to alter the vortical
flow patterns. The largest blowing momentum coefficient expected to occur using the
36
ISFVS is approximately two orders of magnitude less than that which has been shown
to significantly affect the vortex lift created over leading edge strakes. However, consid-erably smaller blowing momentum coefficients apparently will change forebody vortex
patterns. The minimum blowing momentum coefficients that will reposition forebody
vortices has not been determined, but the largest coefficient expected to occur on the
F-18 HARV when an ISFVS like the prototype is installed is still an order of magnitude
less than the smallest blowing momentum coefficient that has been shown to alter fore-
body vortices significantly. But, considerably more research needs to be done to pin
down this critical parameter for forebody vortices.
The model can be used to predict the effects of altering system parameters, such
as the system volume and valve pulse rate, without actually modifying the system
hardware. This versatility allows users to determine which method of pulsing the
smoke suits their specific purposes.
The model is not without limitation, however. Since only a small number of car-
tridges have been fired and since the burn rates apparently varied considerably be-tween cartridges, the maximum mass flow rate from a given cartridge remains uncer-
tain. Also, the existing prototype only allows firing one cartridge at a time; hence, the
effect of using multiple cartridges (to increase the density of the smoke) for each firing
has not been experimentally verified.
Recommendations
The following recommendations, listed in approximate order of importance, are
made for further testing of the system and the prediction model:
1) Test the system in a steady freestream with a velocity comparable to that of
an aircraft in flight to determine its effect on the sharpness of the smoke puffs.
2) Test the system in a wind tunnel with a delta wing model at high angle of
attack to ensure the increased exit velocity caused by blocking the flow of smoke
repeatedly does not cause the smoke to miss the vortex core.
3) Fire several cartridges without cleaning the valve or other hardware to de-
termine if multiple firings can be conducted in flight.
4) Conduct several tests with identical system parameters to obtain more data
on how the burn rate varies from cartridge to cartridge.
5) Test different exit duct configurations to determine the effect of tubinglength, diameter, and bend radii on the quality of the smoke puffs used for video
imaging.
6) Determine allowable blowing momentum coefficients for using the visualiza-tion medium in different flow conditions.
7) Conduct tests to determine if valve preheating reduce residue buildup.
8) Compare data obtained in flight with predictions from computational fluid dy-namics codes and with wind tunnel results.
37
REFERENCES
1 Scott, W. B., "NASA Adds to Understanding of High Angle of Attack Regime," Avi-ation Week and Space Technology, May 22,1989, pp. 36-42.
2 Richwine, D. M., Curry, R.E., and Tracy, G.V., "A Smoke Generator System forAerodynamic Flight Research," NASA, Edwards, CA, TM 4137, 1989.
3 United States Statutory Invention Registration No. H233, March 3, 1987.4 Weast, R. C., CRC Handbook of Chemistry and Physics, 63rd ed., CRC Press
Inc., Boca Raton, FL, 1982.5 Windholtz, M., ed. The Merck Index: An Encyclopedia of Chemicals and Drugs, 9th
ed., Merck and Co., Inc., Rahway, NJ, 1976, p. 1180.6 "ExpertVision User's Manual," Motion Analysis Corporation, Santa Rosa, CA, 1989.7 Morris, S.L., "A Video-Based Experimental Investigation of Wing Rock," Ph.D. Dis-
sertation, Texas A&M University, College Station, Texas, August 1989, pp. 119-132.
8 Nelson, R.C., "Flow Visualization of High Angle of Attack Vortex Wake Structures,"
AIAA Paper 85-0102, Jan. 1985.9 Rae, W.H., Jr., and Pope, Alan, Low-Speed Wind Tunnel Testing, 1st ed., John
Wiley & Sons, New York, 1984, pp. 129-140.10 Merzkirch, W., Flow Visualization, 1st ed., Academic Press, New York, 1974, pp.
13-17.
11 Crowder, J.P., "Flow Visualization Techniques Applied to Full Scale Vehicles," Flow
Visualization IV Proceedings of the Fourth International Symposium on Flow Visual-ization, 1st ed., Hemisphere Publishing Corporation, New York, 1987, pp. 21-22.
12 Fennell, L.J., "Vortex Breakdown - Some Observations in Flight on the HPl15 Air-craft," NASA Reports and Memoranda N3805, September 1978.
13 Maltby, R.L. and Keating, R.F.A., "Smoke Techniques for Use in Low Speed Wind
Tunnels," AGARDograph No. 70, North Atlantic Treaty Organization, 1962.14 Del Frate, J., High Alpha Technology Program Workshop, NASA Ames Research
Center-Dryden Flight Research Facility, Edwards, California, November 1,1989.15 "Detroit Line Air Valves for Industry," ISi Fluid Power Inc., Fraser, MI, 1988.16 "Military Standardization Handbook: Metallic Materials and Elements for Aero-
space Vehicle Structures MIL-HNDBK-5C, U. S. Department of Defense, Washing-ton, DC, 1978.
17 Crandall, S. H., et al, An Introduction to the Mechanics of Solids, McGraw-Hill,Inc., New York, 1978, pp 293-299.
18 "validyne Short Form Catalog No. VI," Validyne Engineering Corporation,Northridge, CA, 1981.
19 "The Temperature Handbook," Omega Engineering, Inc., Stamford, CT, 1989.20 "User Manual for DT 2821 Series," 8th ed., Data Translation, Inc., Marlboro, MA,
1988 ....
21 "Potter & Brumfield Input/Output Modules," Potter & Brumfield, Princeton, IN, 1990.22 Conkling, J. A., Chemistry of Pyrotechnics Basic Principles and Theory, Marcel
Dekker, Inc., New York, 1985.. ........23 Kennan, C. W., et al, General College Chemistry, 5th ed., Harper and Row, New
York, 1976, p. 703.
38
24 Black, W. Z. and Hartley, J. G., Thermodynamics, Harper and Row, New York,1985.
25 Daubert, T.E. and Danner, R.P., Data Compilation Tables of Properties of Pure
Compounds, Amedcan Institute of Chemical Engineers, New York, 1985.26 "Red Hat Flow Book," Automatic Switch Company, Florham Park, NJ, 1989.27 Benedict, R. P., Fundamentals of Pipe Flow, John Wiley and Sons, New York,
1969, p. 40928 Bradley, R. G. and Wray, W. O., "A Conceptual Study of Leading-Edge-Vortex En-
hancement by Blowing," AIAA Journal of Aircraft, Vol. 11, No. 1, January 1974,pp. 33-38.
29 Skow, A. M., et al, "Control of Forebody Vortex Orientation to Enhance DepartureRecovery of Fighter Aircraft," AIAA Journal of Aircraft, VoI. 19, No. 10, October1982, pp. 812-819.
3o "The Procedure Handbook of Arc Welding," 12th ed., The Lincoln Electric Com-pany, Cleveland, OH, 1973, pp. 16.1-1 -- 16.1-29.
31 "User Manual for ATLAB," 2nd ed., Data Translation, Inc., Marlboro, MA, 1988.
39
APPENDIX AFORTRAN SOURCE CODE FOR MODELING SYSTEM
PRESSUREAND EXIT VELOCITY
A computer prediction code (written in FORTRAN for IBM-class personal comput-
ers) that models the ISFVS is included on the attached diskette. Conservation of en-
ergy and conservation of mass equations are integrated using a fourth order Runga-Kutta routine to determine the increase in the system pressure and visualization me-
dium exit velocity. Simplifying assumptions made in this model are listed below.
1) The mixture inside the system behaves like an ideal gas with a gas constant
of 0.139 kJ/kg°K.
2) Thermodynamic properties are not a function of the location inside the system
(there is complete mixing).
3) The flow through the system inlets and exit is uniform.
4) The kinetic and potential energies of the mixture are negligible in comparison
to the enthalpy.
5) No shaft work is down by the system.
6) The rate of energy entering the system by heat transfer is constant and canbe found from the initial conditions.
7) The enthalpy of the mixture can be found using the method given by Daubertand Danner 25.
8) The pressure losses in the exit duct are negligible.
9) The valve's flow capacity is a linear function of time as it opens and closes.
10) The mass flow rate through the valve can be found using gas flow graphs.
11) The smoke cartridge burns at a constant rate.
The resulting simplified conservation of mass equation becomes:
=T,rh- T.rhdt inlet exit
This expression says that the time rate of change of mass in the system equals the
difference between the mass flow rate in and the mass flow rate out of the system.
Similarly, the conservation of energy equation is:
dEeys =_ + _rhh- _rhhdt inlet exit
The time rate of change of the energy in the system equals the rate at which energy is
added to the system by heat transfer plus the energy added to the system entering mi-
nus the energy removed from the system by mass exiting.
Commented FORTRAN source code for the predictions described in this report are
included in the floppy disk attached to the original of this report. The code is written infor and is compiled to run on DOS-based personal computers. In the interest of brevity
the complete printout of the source code is not included.
4O
APPENDIX B
DETAILED DRAWINGS OF INTERMI'n'ENT SMOKE FLOW VISUALIZATION
GENERATOR PROTOTYPE
An exploded isometric of the prototype intermittent flow visualization system smoke
generator is shown in Fig. 44. Detailed drawings of all parts of the smoke generator
are shown in Figs. 45 through 54, followed by a parts list in Table 15. The circled
numbers on the three-views correspond to the numbers on the parts list. All
dimensions are in inches. Welding symbols follow the convention of the American
Welding Society. GTAW indicates gas tungsten arc weld, also known as TIG weld.
PLENUMEXIT
PLENUMCHAMBER
PLENUMINLET PLATE
RING
IGNITER
FITTING 1" O.D.TUBE
CAP
CARTRIDGECONTAINER
GAROLITE
RUPTUREDISK
CLAMPS
HOLE FOR3/8" BOLT
Figure 44. Exploded Isometric View of the Prototype ISFVS
Also included at the end of this appendix are specifications for the two types of
Pub&: reporting burden lot this collection of tnformatlorJ is o,tllmotad to average 1 hour per rolponse, includin 0 the time for revlewtnglnstrtc.t, ions. searching existing data sourcas,
! 9athurln9 and maJntelnk_ 9 the dab needed, and completing and reviewing the collection of Information. 8end comments rigaJ'dlng this bursaR estlmlde or any other aspect o! thls
collection ot |nforma_ion. Including lugge|tlons for reducing this burdan. !o Walhtngton Headquartem _Services, DIrectorMe for information Operations and Reports, 1215 Jeffemon
i. AGENCY USE ONLY (Leave blank) 2. REPORT DATE 3. REPORT TYPE AND DATES COVERED
June 1993 Contractor Report4. TITLE AND SUBTITLE 5. FUNDING NUMBERS
Preliminary Design of an Intermittent Smoke Flow Visualization System
6. AUTHOR(S)
Donald T. Ward and ]ames H. Myatt
7. PERFORMING ORGANIZATION NAME(S) AND ADDRESS(ES)
Aerospace Engineering Division
Texas Engineering Experiment Station
Texas A & M University
College Station, Texas 77843-3141
9. SPONSORING/MONITORING AGENCY NAME(S) AND ADDRESS(ES)
NASA Dryden Flight Research FacilityEO. Box 273
Edwards, California 93523-0273
11. SUPPLEMENTARY NOTES
WU 533-02-35
NAG-2651
8. PERFORMING ORGANIZATION
REPORT NUMBER
TEES AERO TR 91-1
10. SPONSORING/MONITORING
AGENCY REPORT NUMBER
NASA CR-186027
H-1917
NASA Dryden TechnicalMonitor. John Del Frate
12a. DISTRIBUTIONIAVAILABILI'I'Y STATEMENT
Unclassified _ Unlimited
Subject Category 05
i
13. ABSTRACT (Maximum 200 worde)
12b. DISTRIBUTION CODE
A prototype intermittent flow visualization system has been designed to study vortex flow field dynamics has
been constructed and tested through its ground test phase. It produces discrete pulses of dense white smoke
consisting of particles ofterephthalic acid by the pulsing action of a fast-acting three-way valve. The trajectories
of the smoke pulses can be tracked by a video imaging system without intruding in the flow around in flight. Twomethods of pulsing the smoke were examined. The simplest and safest approach is to simply divert the smoke
between the two outlet ports on the valve; this approach should be particularly effective if it were desired to inject
smoke at two locations during the same test event. The second approach involves closing off one of the outlet
ports to momentarily block the flow. The second approach requires careful control of valve dwell times to avoidexcessive pressure buildup within the cartridge container and does also increase the velocity of the smoke injected
into the flow. The flow of the smoke has been blocked for periods ranging from 30 to 80 milliseconds, depending
on the system volume and the length of time the valve is allowed to remain open between valve closings.