90
PRELIMINARY ENGINEERING REPORT for WATER SYSTEM EVALUATION OWNER: TOWN OF WILLIAMSBURG GMS, Inc. Consulting Engineers

PRELIMINARY ENGINEERING REPORT for WATER SYSTEM EVALUATION
OWNER: TOWN OF WILLIAMSBURG GMS, Inc. Consulting Engineers

PRELIMINARY ENGINEERING REPORT
FOR
WATER SYSTEM EVALUATION
PROJECT NO. 12061.100
APRIL 2013 FINAL: JUNE 2013
OWNER:
TOWN OF WILLIAMSBURG 1 JOHN STREET
WILLIAMSBURG, CO 81226
PREPARED BY:
GMS, INC. CONSULTING ENGINEERS
611 NORTH WEBER, SUITE 300 COLORADO SPRINGS, COLORADO 80903
TELEPHONE: (719) 475-2935
TELEFAX: (719) 475-2938
© 2013 GMS, Inc.

TABLE OF CONTENTS
Section I - Introduction ................................................................................................................1
A. Purpose and Scope.........................................................................................................1 B. Planning Area..................................................................................................................3
Section II - Existing Setting .........................................................................................................7 A. Historical Background Information ...................................................................................7 B. Location...........................................................................................................................8 C. Water Resources.............................................................................................................8 D. Physiography.................................................................................................................10 E. Topography ...................................................................................................................10 F. Soils ..............................................................................................................................10 G. Floodplain......................................................................................................................15 H. Wetlands .......................................................................................................................15 I. Climate ..........................................................................................................................18 J. Vegetation .....................................................................................................................18 K. Wildlife...........................................................................................................................19 L. Air Quality and Noise.....................................................................................................19 M. Energy Production and Consumption ............................................................................20 N. Population .....................................................................................................................20 O. Land Use and Development ..........................................................................................24 P. Public Facilities and Services ........................................................................................26 Q. Federal, State or Other Activities in the Planning Area ..................................................26 R. Regional Water Supply System .....................................................................................27 Section III - Existing Water System Facilities ............................................................................32 A. Background ...................................................................................................................32 B. Water Supply.................................................................................................................32 C. Water Treatment ...........................................................................................................33 D. Treated Water Storage ..................................................................................................34 E. Transmission and Distribution System Piping ................................................................34 F. Water Meters.................................................................................................................37 G. Operations and Maintenance.........................................................................................38 Section IV - Historic and Projected Water Consumption............................................................40 Section V - Future Water supply Requirements.........................................................................44 Section VI - Evaluation of Existing Facilities..............................................................................46 A. Water Quality.................................................................................................................46 B. Water Storage ...............................................................................................................48 C. Distribution System........................................................................................................50 D. Meters ...........................................................................................................................58 Section VII - Existing Financial Status of the Water Fund..........................................................60

Section VIII - Water System Needs and Recommended Improvements....................................65 Section IX - Financial Impacts of the Recommended Improvements.........................................73 Section X - Plan of Action .........................................................................................................79
LIST OF FIGURES
Figure 1 - Location Map ..............................................................................................................4 Figure 2 - Planning Area Map .....................................................................................................5 Figure 3 - Soils Map..................................................................................................................12 Figure 4a - Floodplain Map .......................................................................................................16 Figure 4b - Floodplain Map .......................................................................................................17 Figure 5 - Existing Water Distribution System Map ............................................... Back of Report Figure 6 - Proposed Water System Map ............................................................... Back of Report
LIST OF TABLES
Table 1 - Historic Population (People).......................................................................................22 Table 2 - Regional Population Projections.................................................................................24 Table 3 - Historic Water System Production and Consumption .................................................41 Table 4 - 2012 Baseline Water Use Parameters .......................................................................43 Table 5 - Existing and Projected Demands ...............................................................................43 Table 6 - Calculated Fire Hydrant Flows ...................................................................................56 Table 7 - Recommended New Fire Hydrant Locations/Flows ....................................................58 Table 8 - Water Rates...............................................................................................................60 Table 9 - Water System Revenues............................................................................................62 Table 10 - Water System Expenditures.....................................................................................63 Table 11 - Priority One Improvements - Replacement Problem Areas ......................................67 Table 12 - Priority Two Improvements - Upgrade Low Pressure Areas .....................................68 Table 13 - Priority Three Improvements - Additional Fire Hydrants/Line Work ..........................69 Table 14 - Priority Four Improvements - Additional Line Valves, Blow-Offs and Air Vacuum/Release Valves...........................................................................................70 Table 15 - Priority Five Improvements - Decommission Master Meters.....................................71 Table 16 - Summary of Project Costs .......................................................................................71 Table 17 - Potential Project Financing Scenario........................................................................77 Table 18 - Plan of Action and Implementation Schedule ...........................................................79
LIST OF APPENDICES
Appendix A - Construction Cost Estimates

F:\WPDATA\Williamsburg\Water\12 WSImp\Reports\PER\Report.doc 1
SECTION I
INTRODUCTION
A. PURPOSE AND SCOPE
The Town of Williamsburg is located in Fremont County, Colorado. It was incorporated as a
statutory town in 1888. The town provides general municipal services including a central
potable water distribution system. Central wastewater service is not provided. Historically
and continuing today, wastewater treatment is provided through the use of individual
sewage disposal systems (ISDSs) consisting of primarily of septic tanks and leach fields.
The water supply historically provided to the community was through the use of ground
water wells located within the town.
In 1980, the town entered in an Intergovernmental Agreement (IGA) for treatment and
conveyance of its water supply. This agreement, officially titled “Water Facilities
Agreement”, created a regional water system that provides for a common raw water supply,
water treatment and treated water transmission services by the City of Florence. The
original parties to this agreement were the City of Florence, the Town of Williamsburg and
the Town of Coal Creek. In 1994, the Town of Rockvale joined the regional water system.
Each party in the regional system retains its own water rights and owns and maintains its
own water distribution system. Also served by the regional system are the East Florence
Water Association and the ADX Florence Federal Correctional Complex (also referred to as
the Supermax facility). The regional water system is operated by the City of Florence
acting as the lead party for the common water system. A regional water committee made
up of two members of each party to the agreement provides advisory direction to the City of
Florence who owns and maintains the regional system. The regional water system facilities
were originally constructed in 1981 and 1982. The system has undergone numerous
upgrades and modifications since that time.
The Town of Williamsburg’s water service area consists exclusively of rural residential
customers. The town has grown significantly in population since the regional system was
created. Williamsburg’s water distribution system also grew with the land development
associated with the population boom.
F:\WPDATA\Williamsburg\Water\12 WSImp\Reports\PER\Report.doc 2
In general, water system extensions to the Williamsburg distribution system that were made
by the area's developers did not follow any specific design or construction standards. This
has resulted in a current water distribution system that is generally considered to be
substandard, undersized and experiences frequent failures. Due to the shallow depth of
bedrock in several areas, piping was installed at minimal depths. Pipe sizes installed are
typically too small to adequately serve the number of customer taps connected to a
pipeline. Pipe materials used were inconsistent and varied. Pipe trench bedding is often
discovered by town maintenance staff to include trash, rubble and debris. Single line
extensions that dead end are common. Pipelines were typically not looped, resulting in a
predominately branched distribution system. A minimal number of line valves were
installed making it necessary to shut down large segments of the service area to facilitate
repairs. Fire hydrants are few and extremely limited in flow delivery rates due to the nature
of the substandard piping system. Low water pressures and low delivery rates are common
in the outer most reaches of the system, especially at higher elevations. No records were
kept as to the locations, sizes and material of the piping installed.
The purpose of this Preliminary Engineering Report (PER) is to evaluate the existing
potable water distribution system, identifying current deficiencies within the Town of
Williamsburg’s water distribution system. This report represents an update to the town's
2009 PER. Recommended improvements are presented in this report to mitigate the
problems inherent in this troublesome distribution system. Also presented in this report is
an evaluation of the financial health of the town’s water fund. The financial impacts of the
recommended water system improvements are also presented along with the evaluation of
potential project funding scenarios.
The scope of this report is limited primarily to the town’s water distribution system. The
water supply, water treatment, treated water transmission and storage services provided by
the regional system have been considered and evaluated in the preparation of this report;
however, no recommended changes to the existing regional water system have been
made.
F:\WPDATA\Williamsburg\Water\12 WSImp\Reports\PER\Report.doc 3
B. PLANNING AREA
The Town of Williamsburg is located in south central Colorado within the Upper Arkansas
River Basin. The community lies southeast of the City of Florence in the foothills that abut
the Wet Mountains and San Isabel National Forest. The general location of the community
can be seen on Figure 1 with respect to its relationship to neighboring communities, the
Arkansas River, U.S. Highway 50 and the Interstate 25 corridor as well as the cities of
Pueblo and Colorado Springs. The base mapping has been taken from the U.S. Geological
Survey’s base map for the State of Colorado.
The town consists of three square miles, being Sections 23 and 24 of Township 19 South,
Range 70 West, and Section 19 of Township 19 South, Range 69 West of the 6th Principal
Meridian. The planning area with respect to potable water service is the east half of the
Town of Williamsburg. This consists of most of Section 19 and the east quarter of Section
24. The remaining west half of the town is not developed. It consists of steep mountain
terrain lying higher than the developed east portion of the town. The western area is not
considered to be serviceable by the existing water system. The general planning area can
be seen as shown on Figure 2 - Planning Area Map. Base mapping for Figure 2 has been
compiled from the Florence, Florence Southeast, Williamsburg and Cañon City, U.S.
Geological Survey Quadrangle maps. The figure depicts the area’s county roads and state
highways as well as Williamsburg’s relationship to the City of Florence. The base mapping
depicting the Williamsburg area was revised in 1976, prior to the formation of the regional
water system and associated recent growth of the town. Thus, the base map shows only
the old central portion of town and not the houses and roadways associated with the
development that occurred in the 1980s and 1990s. Figure 2 has been annotated to reflect
the town's boundaries, the existing developed service area, and portions of the regional
water transmission system including the location of the Coal Creek water storage tank.
The original Town of Williamsburg supported significant development associated with the
coal mining boom occurring in the area at the turn of the last century. The community’s
population, much like many of the old mining towns in Colorado, burgeoned with a peak
population of 556 people in the year 1910. With the decline in the coal mining industry, the


F:\WPDATA\Williamsburg\Water\12 WSImp\Reports\PER\Report.doc 6
town’s population steadily declined down to 72 people in 1980. Few remnants of the boom
town remained at that time. One of the historic remaining structures is the Williamsburg
School which is currently privately owned and has been converted into apartments. With
the formation of the regional water system in 1980, the town rapidly grew from 72 people to
253 people in 1990, and continued on to a peak population in 2000 of approximately 714.
The growth and associated water demand exceeded the town’s water rights. Water made
available to each individual party by the regional water system is contractually limited in the
Water Facilities Agreement to the amount of water rights held by each individual party. In
1999, the City of Florence, the lead entity in the regional water system, filed an injunction in
county court to have the Town of Williamsburg stop issuing new water taps because the
volume of water delivered to Williamsburg had exceeded its water rights. As a result, the
Town of Williamsburg imposed a water tap moratorium in 2000 until sufficient water rights
were adjudicated in water court for the existing water services. In a 2010 Water court
Decree, the town officially secured sufficient water rights to support the 273 water taps.
Currently, a slight surplus of water rights allows the town to issue 12 new water taps.
Development that may occur within the town will likely consist of infilling on many of the
existing platted, unoccupied lots. No new development west of the existing service area (as
depicted on Figure 2) is not anticipated due to the rough terrain, lack of roads and no water
service being practically available.

F:\WPDATA\Williamsburg\Water\12 WSImp\Reports\PER\Report.doc 7
SECTION II
EXISTING SETTING
A. HISTORICAL BACKGROUND INFORMATION
The general front range of Colorado including the Fremont County area was first explored
in 1806 when Zebulon Pike conducted an expedition within the region that included
exploring the Arkansas River. John Fremont led five expeditions throughout the region
between 1842 and 1853 in his efforts to establish a viable route through the mountains as
well as collecting information on the area’s vegetation and diverse animal population. In
1862, the discovery of oil within the region added to the robust industrial development that
was occurring. Coal was discovered in Fremont County in the early part of the civil war
(1861-1865). Coal mining became the primary driving force behind the development of
Williamsburg and its neighboring communities of Rockvale, Coal Creek and Florence. The
continuation of the Denver and Rio Grande Railroad up the Arkansas River Valley was
reportedly due to the area’s thriving coal mining industry. Fremont County became an
incorporated county on November 1, 1861.
The Town of Williamsburg was officially incorporated on April 6, 1888. In the late 1890s
and early 1900s, Coal Creek, Florence, Rockvale and Williamsburg were among the most
important industrial towns in Colorado. Florence had eight ore mills that processed gold ore
from the Cripple Creek - Victor mining district. Coal mines, oil wells and smelting industries
were also in operation. The territorial prison was built within Cañon City in 1871. In 1877,
the territorial prison became the Colorado State Penitentiary. The ADX Florence Supermax
correctional complex located south of Florence opened in November 1994. In addition to
the Colorado Department of Corrections and the Federal Bureau of Prisons, major
employers within Fremont County include the local school districts and Holcim, Ltd. which
manufacturers Portland cement. Long after the coal mining industry had subsided, this
diversification of employment opportunities has enabled rural Fremont county to maintain its
population base. However, with the loss of the coal mining industry, the Town of
Williamsburg experienced a severe population decline in the 1920s continuing through
1980. In the 1980s and 1990s, the population of Williamsburg burgeoned in size as a
retirement community and bedroom community to Cañon City and Florence.

F:\WPDATA\Williamsburg\Water\12 WSImp\Reports\PER\Report.doc 8
B. LOCATION
The Town of Williamsburg and its service area are located in southeast Fremont County.
As can be seen on Figure 2, the City of Florence is located 1.5 miles to the northeast of the
center of Williamsburg. As shown on Figure 1, Cañon City lies approximately six miles to
the northwest with the City of Pueblo lying approximately 30 miles to the east of
Williamsburg. The majority of the community is located in the Oak Creek drainage basin
south of Florence.
County Road 13A enters the east side of town and becomes Quincy Street. Quincy Street
connects to County Road 11A running north/south through the town and extends south
through Williamsburg to Rockvale. County Road 85A extends south from the center of
town to the Town of Coal Creek. State Highway 115 interconnects Cañon City to Florence
and is routed northeasterly across U.S. Highway 50 through Penrose, extending onto
Colorado Springs. U.S. Highway 50 represents the major transportation corridor along the
Arkansas Valley. In this area, the highway is located to the north of the Arkansas River. As
can be seen on Figure Nos. 1 and 2, the Arkansas River lies immediately north of the City
of Florence. Figure 2 highlights the general topography, the county roadway network, State
Highways 115 and 67 and the Arkansas River’s relationship to the community. The Cañon
City quadrangle map which includes most of the Town of Williamsburg was last updated in
1976. Thus, it does not reflect the significant amount of land development that occurred in
the 1980s and 1990s. Current road configurations within the community are shown on
Figure 5 - Existing Water System found in the back of this report.
C. WATER RESOURCES
The Town of Williamsburg does not have a central wastewater collection system or
wastewater treatment facilities. The town’s constituents rely upon ISDS systems for
wastewater service.
The developed portion of the community lies within Section 19 and east half of Section 24
as outlined in Figure 2. This developed portion of the town is located in the Oak Creek
drainage basin which is tributary to the Arkansas River. The creek is an ephemeral stream,
flowing only as a result of precipitation events. Oak Creek runs north, parallel to County

F:\WPDATA\Williamsburg\Water\12 WSImp\Reports\PER\Report.doc 9
Road 11A bisecting the community on its way to its confluence with the Arkansas River. In
this area of the state, surface water sources from the Arkansas River represent the primary
source of water supply. Some ground water wells are also used for water supply.
The town holds a 0.665 cubic foot per second (cfs) direct flow right that has a priority date
of December 31, 1890. The water is diverted from the Arkansas River at what is referred to
as the Williamsburg pipe. This water right has been pooled with other water rights of the
parties to the regional water system. The town also owns 140 shares of Union Ditch water
rights, recently changed in Water Court Case 99CW149 for municipal use of 0.224 cfs with
a November 30, 1861 priority date. Other members of the regional water system include
the City of Florence, the Town of Coal Creek and the Town of Rockvale. Although the
rights are pooled, each member is limited to a treated water supply based on the individual
member’s current water rights. Currently surface water is conveyed to the City of
Florence’s newly constructed South Water Treatment Plant, treated and then transmitted by
Florence to the regional water system from which Williamsburg draws. This activity is
undertaken as a result of an Intergovernmental Agreement (IGA) between Coal Creek,
Rockvale, Williamsburg and the City of Florence. Further discussion of the regional water
system and its associated water rights is presented later in this report.
With the community relying upon ISDS systems for its wastewater treatment and disposal,
return flows to the Arkansas River Basin come about as a result of leach field drainage into
the area soils. Under Regulation 32, the Water Quality Control Commission has designated
this segment of the Upper Arkansas River as stream segment No. 3 which is defined as the
main stream of the Arkansas River from a point immediately above the confluence with the
Lake Creek to the inlet of Pueblo Reservoir. Stream classifications for this segment of the
Arkansas River consist of:
Aquatic life: Cold, Class 1
Recreation: Class E
Water Supply
Agriculture

F:\WPDATA\Williamsburg\Water\12 WSImp\Reports\PER\Report.doc 10
D. PHYSIOGRAPHY
Fremont County falls within the Upper Great Plains province. The plains occur as relatively
narrow protrusions extending along the Arkansas River. Within this area, they are bounded
by the Wet Mountains on the west and extend downgradient to the Arkansas River. The
plains are gently sloping to rolling and are mainly underlain by limestone, shale and
sandstone. They have been dissected into narrow deep canyons along the major
drainageways. Within the Williamsburg area, with its upstream tributary area backing onto
the Wet Mountains, the plains are characterized by long slopes and in the immediate area
of Williamsburg, are bisected by Oak Creek and drop gently toward the northeast.
E. TOPOGRAPHY
The topography within the planning area generally slopes from the southwest to northeast.
The immediate drainage is tributary to Oak Creek. The highest elevation within the town’s
service area (as depicted on Figure 2) is at the south end of Rockrimmon Road near the
southwest corner of Section 19 with an elevation of approximately 5,470 feet. The lower
elevations occur at the northern end of Oak Creek as it extends through town where
elevations approach 5,300 feet. All drainage within the service area is directed to Oak
Creek which extends generally north through the community. The western half of the Town
of Williamsburg is bisected by a narrow ridge rising 300 to 400 feet above the developed
portion of town. This ridge is shown on Figure 2.
F. SOILS
The United States Department of Agriculture through the Natural Resources Conservation
Service (NRCS) in corporation with the Colorado Agricultural experiment station and the
U.S. Department of Interior, Bureau of Land Management has compiled a detailed soil
survey of Fremont County. The most recent documentation was issued effective as of
December 1995. This data is also available on NRCS’ website. The consultant has
reviewed both a hard copy of the study as well as the website data. Figure 3 is taken from
the NRCS website and reflects the data contained on Sheet No. 27 of the soil survey of the
Fremont County area. The developed east half of the incorporated town has been outlined

F:\WPDATA\Williamsburg\Water\12 WSImp\Reports\PER\Report.doc 11
on an aerial photo base map to show the delineation of the various soil classifications of the
area. The soil type information is relevant as it relates to residential development and the
constructability of water mains within the area. The following soil groups have been
identified by NRCS’ mapping as existing within the east half of the Town of Williamsburg.
Soil groups are listed in order of the predominance of the soil group within the developed
portion of town. The following provides general information in terms of the characteristics of
these different soil classifications.
50 - Kim loam, cool, 3% to 8% slopes
This soil group represents approximately 25% of the soils within the community. This deep,
well drained soil is on fans and fan terraces. It formed in alluvium and wind-deposited fine
sands and silt. The soil is typically loam to a depth of 60-inches or more. Permeability is
moderate in the Kim soil. Runoff is medium to rapid and the hazard of water erosion is
moderate to very high. The soil is well suited to homesite development.
64 - Louviers-Travessilla Complex, 20% to 50% slopes
This soil group covers approximately 22% of the Williamsburg planning area, primarily
located around Bear Gulch, Cedar Ridge and the south end of Rockrimmon Road. These
soils are on hills, ridges, hogbacks and canyon sides. This unit is about 40% Louviers soil
and 35% Travessilla soil. The Louviers soil is on side slopes and on the scarp side of
hogbacks. The Travessilla soil is on canyon rims, ridges and the upper parts of side slopes
and in areas of weather-resistance bedrock on hogbacks. The Louviers soil is shallow and
well drained. It formed in residuum derived dominantly from shale and siltstone. The
surface layer is typically light brownish gray, very channery clay loan about 3-inches thick.
The substratum is mainly clay about 13-inches thick. Shale bedrock is at a depth of about
16 inches. Permeability is slow in the Louviers soil. Runoff is very rapid and the hazard of
water erosion is very high. The Travessilla soil is shallow and well drained. It formed in
residuum derived dominantly from sandstone. The surface layer is typically light brown
channery loam about 4-inches thick. The substratum is channery loam about 10-inches
thick. Sandstone bedrock is at a depth of about 14-inches. Permeability is moderate in the


F:\WPDATA\Williamsburg\Water\12 WSImp\Reports\PER\Report.doc 13
Travessilla soil. Runoff is rapid and the hazard of water erosion is very high. The unit is
poorly suited to homesite development. The main constructability limitations are the slope
and the depth to bedrock.
81 - Otero fine sandy loan, 3% to 8% slopes
This soil covers approximately 14% of the planning area. This deep, well drained soil is on
side slopes and fans. It is formed in alluvium and eolian sands. The surface layer is
typically dark grayish brown fine sandy loam about 2-inches thick. The substratum to a
depth of 60-inches or more is sandy loam. Permeability is moderately rapid in the Otero
soil. Runoff is slow to rapid and the hazard of water erosion is slight to high. The soil is
well suited to homesite development.
105 - Shanta loam, dry, 0% to 3% slopes
This soil type comprises approximately 11% of the town and is located along on the west
bank of Oak Creek. This deep, well drained soil is on stream terraces. It formed in
alluvium. The surface layer is typically grayish brown loan about 27-inches thick. The
substratum to a depth of 60-inches or more is stratified sandy clay loam, loam and silty clay
loam. Permeability is moderate in the Shanta soil. Runoff is slow and the hazard of water
erosion is slight. The soil is well suited to homesite development in areas where flood
protection is provided.
121 - Ustic Torriorthents-Sedillo Complex, 15% to 40% slopes
This soil complex comprises approximately 8% of the soils within the planning area of
Williamsburg. These soils are on fan terrace edges and hills. The steep terrace edges are
formed by deep dissection of the fan terraces by streams. The unit is 70% Ustic
Torriorthents and 20% Sedillo soil. The Ustic Torriorthents are on the middle and lower
side slopes and the Sedillo soil is on crests and the upper side slopes of terrace edges.
The Ustic Torriorthents are shallow to deep and are well drained. They form in residuum
and colluvium derived dominantly from thinly bedded sandstone, siltstone and shale.
Slopes range from 15% to 40%. The soils are covered by a thin mantle of cobbly alluvium
and colluvium. The texture of the underlying material is variable, but it ranges from very

F:\WPDATA\Williamsburg\Water\12 WSImp\Reports\PER\Report.doc 14
fine sandy loam to silt clay. The characteristics of the Ustic Torriorthents are variable, but
in the deeper areas the surface layer is typically dark grayish brown, very gravelly loam
about 2-inches thick. The upper 25-inches of the substratum is gravelly clay loan. The
lower part to a depth of 42-inches is gravelly loam. Weathered sandstone is at a depth of
about 42-inches. Permeability is moderate to slow in the Ustic Torriorthents. Runoff is
rapid or very high and the hazard of water erosion is high or very high. The Sedillo soil is
deep and well drained. It formed in gravelly and cobbly alluvium derived dominantly from
granite. In areas of landslide deposits, the soil formed in material weathered from
sandstone and shale. The surface layer is typically dark brown, extremely cobbly loam
about 4-inches thick. In many areas that have landslide deposits, the surface is bouldery.
The upper part of the subsoil is extremely cobbly sandy clay loam about 6-inches thick.
The next 25-inches of the subsoil is mainly extremely stony loam. The lower part of the
subsoil and the substratum to a depth of 60-inches or more are loam. Permeability is
moderate in the Sedillo soil. Runoff is rapid or very rapid and the hazard of water erosion is
high or very high. The unit poorly suited to homesite development. The main limitation is
the slope.
72 - Midway-Cascajo Complex, 10% to 40% slopes
This soil complex makes up 6% of the community and is found primarily on the east bank of
Oak Creek. These soils are on moderately sloping to steep ridges, knobs, hills and edges
of fan terraces that are deeply dissected by streams. The unit is about 60% Midway soil
and 20% Cascajo soil. The Midway soil is mainly on the steeper side slopes. The Cascajo
soil is mainly on knobs and hills and along the crests of terrace edges. The Midway soil is
shallow and well drained. It formed in residuum derived dominantly from shale. Slopes
range from 15% to 40%. The surface layer is typically grayish brown, very gravelly clay
loam about 3-inches thick. The upper 4-inches of the underlying material is clay. The lower
part to a depth of 15-inches is extremely shaly clay. Weathered shale is at a depth of about
15 inches. Permeability is slow in the Midway soil. Runoff is rapid and the hazard of water
erosion is high. The Cascajo soil is deep and excessively drained. It formed in gravelly
and sandy alluvium. Slopes range from 10% to 40%. The surface layer is typically very
dark grayish brown with very gravelly sandy loam about 6-inches thick. The upper 15-
inches of the underlying material is extremely cobbly sandy loam. The lower part to a depth
of 60-inches or more is extremely cobbly sand. Permeability is moderately rapid or rapid in

F:\WPDATA\Williamsburg\Water\12 WSImp\Reports\PER\Report.doc 15
the Cascajo soil. Runoff is medium to very high. The unit is poorly suited to homesite
development. The main limitations are the depth to shale bedrock and the slope.
G. FLOODPLAIN
The planning area of Williamsburg generally slopes from the southwest to the northeast.
Drainage is channelized to Oak Creek which runs through the center of the community from
north to south. Oak Creek is an ephemeral stream.
The Federal Emergency Management Agency (FEMA) has developed Flood Insurance
Rate Maps (FIRM) for Fremont County and the Town of Williamsburg. FIRM maps for
Williamsburg, dated January 6, 2012, show the 100-year floodplain of Oak Creek being
approximately 150 feet wide at the north town limit line; however, the Quincy Avenue bridge
represents a constriction to the 100-year flow resulting in flow over the road and a
significant backwater condition. At Quincy Avenue, the floodplain is approximately 600 feet
wide. Iron Horse Drive south of Quincy Avenue, and a portion of the east half of Wilmont
Circle are within the FEMA 100-year floodplain. Based on aerial photography,
approximately 20 residential houses are in the 100-year floodplain of Oak Creek. The 100-
year floodplain of West Oak Creek is also delineated within the FIRM maps. No existing
residential homes appear to be within this delineated floodplain.
Proposed water system improvements within these delineated floodplains consist of
pipeline installations within town rights-of-way. No changes will be made within the
established floodways. Water distribution system improvements recommended within this
report are not specifically intended to benefit those customers within the delineated 100-
year floodplain of Oak Creek. FEMA floodplain mapping for Oak Creek and West Oak
Creek are shown on the following Figures 4a and 4b.
H. WETLANDS
The U.S. Fish and Wildlife Survey National Wetlands Inventory Mapping was reviewed to
determine the types and locations of wetlands within the planning area. The mapping
indicates a wetland associated with the main stem of Oak Creek. Otherwise, no wetlands


F:\WPDATA\Williamsburg\Water\12 WSImp\Reports\PER\Report.doc 18
are delineated within the town limits or its immediate perimeter. The wetlands of Oak Creek
are classified as Riverene, Intermittent, Sreambed. Any proposed improvements within the
potential wetlands areas would be conducted under a Section 404 Nationwide Permit No.
12 for utilities work in coordination with the U.S. Army Corps of Engineers.
I. CLIMATE
Within the community, summers are characterized by hot days and cool evenings. Winter
seasons have moderate to cold temperatures. The valley bottom closer to Florence along
the Arkansas River tends to be colder as a result of cold air drainage along the valley as
opposed to the lower slopes of the adjacent mountains. Based upon data obtained from
the National Weather Service, NOAA through the Colorado Climate Center, the nearest
weather station is located in Cañon City (Station 051294). That station is sited
approximately seven miles northwest of the Town of Williamsburg. The average annual
temperature reported at the station is 67.9°F. The lowest average temperature occurs in
January and is approximately 49.7°F. The highest average temperature occurs in July and
is 89.2°F. Temperatures in the Town of Williamsburg would be slightly lower due to its
elevation and location as opposed to that of Cañon City. Precipitation for the period from
1948 through 2012 averaged 12.63 inches annually. Recent precipitation for the years
2005, 2008, 2010 and 2012 have been below average. Average snowfall is 36.2 inches per
year. Lake evaporation in this area based upon the Climatic Atlas of the United States
averages 38 inches per year. Winds prevail from the west and southwest. Sun shines
approximately 80% of the time in the summer and 75% of the time in the winter.
J. VEGETATION
The Town of Williamsburg is situated adjacent to the streambed of Oak Creek in the valley
bottom and the adjacent rolling foothills in an area located southwest of the City of
Florence. A portion of the southeast quadrant of town, being south of County Road 13A
and east of County Road 85A, has been significantly impacted by coal mining activities
occurring in the late 1800s and early 1900s. Vegetation of the area is also impacted by the
magnitude of rock outcroppings and shallow shale together with the minimal annual rainfall
received. These factors all combine to influence the nature of the vegetation community
within the area. The area can best be characterized as semi-arid, containing native
F:\WPDATA\Williamsburg\Water\12 WSImp\Reports\PER\Report.doc 19
grasses and scattered areas of clusters of pinion and juniper. Cottonwoods line the banks
of Oak Creek. The native grasses generally include such varieties as Bluegrama, Western
Wheatgrass, Needle and Thread, Scribner Needle grass, Sideoats Grama together with
limited amounts of Mountain Mahogany and Gamble Oak. Only limited lawns are
maintained within the community as a result of the combination of the poor soil conditions,
the semi-arid nature of the area and the cost of potable water.
K. WILDLIFE
A combination of both the magnitude of development within the community coupled with its
topography impacts to a significant degree available habitat for wildlife. The local drainage
bottoms provide enhanced habitat for area wildlife. The area is frequented by cottontail and
jackrabbits, scaled quail, mourning doves and a host of a smaller variety of songbirds
common to the foothills of Colorado. Mule deer can be found within the areas as well as
coyotes and to a lesser degree red fox. No rare or endangered species are known to exist
within the planning area.
L. AIR QUALITY AND NOISE
The planning area consists of the east half of the Town of Williamsburg’s corporate
boundaries. The town is a rural community with primarily residential land uses located in
Fremont County. Fremont County has been incorporated into one of the Colorado
Department of Public Health and Environment, Air Pollution Control Division’s designated
regions. The closest air quality monitoring station is sited in Cañon City. The primary
constituent monitored at the Cañon City location is particulate matter, specifically particulate
matter 10 micrometers in diameter and smaller. This particulate matter is labeled PM10.
Cañon City took action beginning in 1988 to address street sweeping issues and
maintenance of gravel roads which prior to that time had been responsible for the
generation of fugitive dust which was impacting PM10 compliance. At the monitoring
location, the most recent available data shows generally good compliance with established
particulate matter standards. Air quality in the Williamsburg area is generally viewed as
good. Air quality is envisioned to continue into the foreseeable future at acceptable levels.

F:\WPDATA\Williamsburg\Water\12 WSImp\Reports\PER\Report.doc 20
The noise generated within the community is limited to those normal domestic activities that
occur within a rural residential community with limited to no commercial activity. No
significant noise generation occurs within the community. The road network in the
immediate area consists of county and state highways, none of which are major
transportation corridors. Thus, they represent limited noise and air quality impacts. Overall
the planning area does not contain any significant noise or air quality problems nor are any
anticipated in the future.
M. ENERGY PRODUCTION AND CONSUMPTION
The constituents located within the Town of Williamsburg enjoy the availability of electrical
power as provided by Black Hills Energy. Central gas is available in some areas of town;
however, residents primarily rely upon propane as the primary source for heating. The
community’s roots lie in coal production. Currently, the only actively permitted coal mine in
Fremont County is the North Field Coal Mine. This mine was issued a mining permit in
2005; however, no active mining appears to have been conducted. In 2010 the mining
company applied for a permit from the County Planning Commission for a loadout facility.
This underground mine is located one-half mile west of the intersection of County Roads
11A and 79 in Section 13, Township 19 South, Range 70 West. The coal mine will extract
high quality coal from seams between 300 and 800 feet deep. Production is estimated at
1,000 tons per day. The coal product would be transported off-site by truck to the proposed
loadout facility. Fracking activities in the area are also programmed for the extraction of oil
and gas.
N. POPULATION
Fremont County’s population base has been significantly influenced by the presence of
both state and more recently, federal correctional facilities. A territorial prison was built in
Cañon City in 1871. Six years later the prison became the Colorado State Penitentiary.
The old original facility in Cañon City is still utilized today; however, substantial correctional
facility expansions undertaken by the Colorado Department of Corrections have occurred to
the east of Cañon City, north of Florence, lying south of U.S. Highway 50. The correctional
facility presence within the county has been bolstered with the construction of the ADX
Florence Federal Correctional Complex located south of Florence, in close proximity to
Williamsburg. This facility, referred to as Supermax, contains four out of five security levels

F:\WPDATA\Williamsburg\Water\12 WSImp\Reports\PER\Report.doc 21
for federal facilities. The facility was constructed in the early 1990s and opened in
November 1994. This stable employment base coupled with tourism, agriculture and
energy related production enables the region to maintain a stable population base. Overall
the area supports 13 different correctional facilities. More than half the jobs in Fremont
County stem from the corrections industry. In 2000, nine state correctional facilities were
located in Cañon City employing 1,554 individuals and three federal facilities were located
near Florence employing 993 people. These state and federal facilities collectively hold
approximately 9,000 inmates.
The Town of Williamsburg is located in Fremont County. The county is within Planning
District No. 13. The District encompasses the eastern mountain counties of Lake, Chaffee,
Fremont and Custer. This region of the state had a population base in 2000 of 74,142.
The base population increased by 2,063 people as reported in the 2010 census. The
increase amounted to a population gain of 2.8%. The following data represents the
previous 12 census periods for Fremont County. Also included are population estimates for
the year 2011 as provided by the State Demographer’s office. Historic census counts are
also presented for the incorporated communities of Florence, Coal Creek, Rockvale and
Williamsburg, all of which are partners in the regional water system.

F:\WPDATA\Williamsburg\Water\12 WSImp\Reports\PER\Report.doc 22
TABLE 1
TOWN OF WILLIAMSBURG
HISTORIC POPULATION (PEOPLE)
Census Year
Fremont County
(People)
City of Florence
(People) 1)
Town of Coal Creek (People ) 1)
Town of Rockvale (People) 1)
Town of Williamsburg (People) 1)
1900 15,638 3,728 698 870 337
1910 18,181 2,712 676 1,413 556
1920 17,883 2,629 618 1,249 402
1930 18,896 2,475 435 710 155
1940 19,742 2,632 261 575 97
1950 18,366 2,773 195 380 65
1960 20,196 2,821 206 413 57
1970 21,942 2,846 225 359 75
1980 3) 28,676 2,987 190 338 72
1990 32,273 2,990 157 321 253
2000 46,145 3,653 303 426 3) 714
2010 46,824 3,881 343 487 662
2011 2) 47,375 3,887 343 497 663
1) This data pertains to the incorporated town boundaries and does not include out-of-town water customers 2) Estimates based on information provided by the Colorado Department of Local Affairs, State Demographer's Office,
November 2012. 3) Regional service area formed in 1980 to serve Florence, Coal Creek and Williamsburg. Rockvale added in 1994.
Upon reviewing the population data for Fremont County as well as Florence, a few general
observations can be made. The county population remained fairly stable for the first half of
the last century followed by steady consistent growth since 1950. A dramatic increase
occurred between 1990 and 2000, in part, influenced by yet again the correctional industry
as a result of the Federal Bureau of Prisons opening new U.S. penitentiaries in 1990 and
1994 as well as the Federal correctional complex. Of note, within the 2010 census data is
an institutionalized county population of 8,704. The City of Florence has also shown very
stable yet slightly increasing population trends since 1930. Williamsburg’s population
initially peaked in 1910, fell dramatically in the 1920s as a result of the decline in the mining
industry, and continued to decline steadily until 1980. The decrease in population over this
period is also characteristic of smaller communities loosing their population base to the
larger communities that provide more services and have more job opportunities and

F:\WPDATA\Williamsburg\Water\12 WSImp\Reports\PER\Report.doc 23
economic activity. The formation of the regional water system in 1980 opened up the town
for development. Residential rural subdivision development within Williamsburg happened
quickly. From 1980 to 1990 the town population grew by 350% up to 253 people. In the
1990s growth continued with an increase of 282% raising the population to 714 people.
The growth ended in 2000 as a result of the town implementing a water tap moratorium.
The effect is reflected in the town’s 7.1% population loss through 2011.
The State Demographer’s office compiles population forecast for both counties and
regions. They do not compile any statistical projections for individual communities or
unincorporated portions of individual counties. Population forecasts are based on regional
statistical data for births, deaths and migration into and out of an area. The most recent
population projection data available from the State Demographer’s office, dated November
2012, projects the long-term countywide population to increase at a steady rate through
2035. According to the Demographer’s projections, the population for Fremont County over
the period from 2010 to 2035 is projected to increase by 37.4%, rising by 7.4% from 2010
to 2015; 7.5% from 2015 to 2020; 6.9% from 2020 to 2025; 6.0% from 2025 to 2030; and
5.1% from 2030 to 2035.
The population base within the town is influenced by factors other than county and regional
growth rates. Major factors that have influenced the base population of the community are
the availability of potable water as well as the relatively stable retirement base and
correctional facility employment. General and professional employment opportunities are
also made available in the nearby cities of Cañon City, Florence and Pueblo.
Water supply availability for the town was limited by the water rights held by the town. This
condition halted the issuance of water taps in 2000 until sufficient water rights could be
secured. Countywide growth rate projection percentages are relatively strong. This would
be expected to positively affect the population base of the Town of Williamsburg based on
adequate water supplies being available to support growth. Additional town water rights
were adjudicated in 2010. The 2011 agreement with the City of Florence allowed for twelve
additional water taps based on an evaluation of the town's existing water rights. With an
existing population density of 2.43 people per household, this will allow for 29 additional
people in town. This additional population is reflected in the town's 2015 population
forecast.

F:\WPDATA\Williamsburg\Water\12 WSImp\Reports\PER\Report.doc 24
A recent Water Court filing by the town would provide rights for 94 additional taps or 228
people. This is presumed to become available after 2015. Therefore, population
projections for 2020 through 2035 are based on the State Demographer's office countywide
growth rates. Rockvale does not have water rights limitations and thus is projected to
increase in population at a rate equal to the countywide growth rate. Coal Creek is in the
process of acquiring additional rights to support growth and is currently limited by the
Regional Water Supplier to 50 additional taps. This is sufficient to support Coal Creek's
growth to 2035 based on countywide projections.
The following table has been developed to present population projections for the City of
Florence, the Town of Williamsburg as well as Rockvale and Coal Creek.
TABLE 2
TOWN OF WILLIAMSBURG
REGIONAL POPULATION PROJECTIONS 1)
Year City of
Florence (People) 2)
Town of Coal Creek (People ) 2)
Town of Rockvale (People) 2)
Town of Williamsburg (People) 3)
2011 3,887 343 497 663
2015 4,114 363 526 692
2020 4,422 390 565 744
2025 4,729 417 605 796
2030 5,012 442 641 843
2035 5,267 465 673 886
1) Does not include regional service to the East Florence Water Association and the Federal correctional complex. 2) Based on countywide growth rate projections as prepared by the Colorado Division of Local Government,
Demography Office, November 2012. Does not include out-of-town service populations. 3) Currently limited to a total of 285 water taps. Refer to discussion in this report for future growth limitations.
O. LAND USE AND DEVELOPMENT
The Town of Williamsburg reflects the land use patterns of a typical rural community. As a
result of the decline in coal production within the region, commercial activities have slowly
been lost. Land use now reflects a residential use pattern throughout the community.
Given the close proximity of major commercial centers such as Florence, Cañon City and

F:\WPDATA\Williamsburg\Water\12 WSImp\Reports\PER\Report.doc 25
Pueblo, commercial activities are not projected to be a major factor within future land use
activities within Williamsburg.
The older portion of the community has been developed with typical small lots laid out in a
traditional block grid. More recent development has incorporated large residential lots into
the community. These larger residential lots are more suitable for on-site ISDS systems.
The development boom that occurred in the 1980s and 1990s consisted of several
individual subdivisions being added adjacent to county roads. The town does not have a
master plan or development standards. Thus, the growth appears to have occurred without
macro level planning or overall impact assessments on the community. Roadway, drainage
and water system improvements were installed to minimal standards. Development along
Oak Creek is within the 100-year floodplain of the creek, specifically along Iron Horse Road
and the east half of Wilmont Circle.
According to town representatives, there are several vacant platted lots that could be built
upon. Several larger parcels within the planning area of the town are suitable for future
residential subdivision activity and development. Future projections are for the continuation
of current land use practices consisting primarily of residential development. This potential
growth capability is now available with the lifting of the long-standing water tap moratorium.
Currently the town can issue up to 12 new water taps. When the currently filed Water
Rights Conversion is adjudicated, the town can issue an additional 94 taps beyond the
current approved 12 taps.
The west half of the town, consisting of Section 23 and the west half of Section 24 as
shown on Figure 2, could potentially be developed. The terrain is rugged. The area is not
serviceable from the town’s existing water system as it lies much higher in elevation. Thus,
adequate water pressures would not be available from the town’s water system. A
separate water pressure zone or multiple zones would be required along with booster
pumping and storage facilities. There are no known plans for developing these areas. For
these reasons, the west half of the Town of Williamsburg is not included in the planning
area of this study. In the event development activity is proposed in the future in this portion
of the Town’s limits, the Town would need to adopt adequate standards and design criteria
for any water distribution system extension, booster stations, storage facilities and
associated water rights. Those costs should be incurred by the developers proposing to

F:\WPDATA\Williamsburg\Water\12 WSImp\Reports\PER\Report.doc 26
plat and develop this portion of the community. The Town should seek technical assistance
at the time of such activities occurring to ensure that the system extensions meet
acceptable standards and will not create long term maintenance issues for the community.
P. PUBLIC FACILITIES AND SERVICES
The Town of Williamsburg is a statutory town created under the Colorado Revised Statues.
The town was incorporated in 1888. The town as an incorporated statutory entity provides
the general public with the services for which it is empowered including potable water,
street maintenance, drainage, municipal parks and related activities. The town is projected
into the foreseeable future to continue to provide the current services it provides to its
constituents. Private organizations provide the remainder of the public services to the
Town of Williamsburg. Black Hills Energy provides electricity. Natural gas service is
available in some areas of the town and is provided by Atmos Energy. Most residents,
however, rely on propane as the primary source for heating fuel. Several propane dealers
service the area including Exxon, All Star, Mar Gas, San Isabel Coop and Blue Flame Gas.
CenturyLink Telephone provides telephone service. Cablevision service is available in the
area as provided by Optimum Communications. Town roadways and drainage culverts
within Williamsburg are maintained by the town. County Roads 11A, 13A and 85A are
maintained by the Fremont County Road and Bridge Department.
Q. FEDERAL, STATE OR OTHER ACTIVITIES IN THE PLANNING AREA
At this time no federal or state projects exist or are being undertaken directly within
Williamsburg’s existing town limits. The existence of state and federal correctional facilities
within the region offer excellent opportunities for a solid employment base, but are not
directly contributing to the need for the town to upgrade its existing water distribution
system. Improvements to the regional water system are ongoing based on
recommendations made in the 2002 Florence Regional Water System Master Plan as
prepared by The Engineering Company, Fort Collins, Colorado. The Master Plan included
13 recommended projects for the regional system. Currently five of these projects have
been completed including the construction of the Town of Florence’s new South Water
Treatment Plant. The Master Plan’s recommended project No. 9 consists of an internal
water transmission line within the Town of Williamsburg's system. This is a generalized

F:\WPDATA\Williamsburg\Water\12 WSImp\Reports\PER\Report.doc 27
recommendation that does not have a specific defined project or scope. Although
recommended within the regional system’s master plan, costs for this project would be the
responsibility of the Town of Williamsburg as the improvements lie outside of the regional
transmission system. The recommended internal transmission main was included in the
Master Plan to address specific water pressure and delivery problems within Williamsburg’s
distribution system. Recommended distribution system improvements to address pressure
and flow delivery problems in the Williamsburg system are contained within this report.
The Fremont County Commissioners approved a permit for the North Field Coal Mine in
2007. A railroad loadout facility was approved in 2010. The mine facility is located one-half
mile west of the intersection of County Roads 11A and 79. This location lies one-half mile
north of the Town of Williamsburg. The town has not been requested to provide a water
supply for these proposed facilities. No provisions within the recommended improvements
have been made to accommodate a water supply to the North Field Coal Mine facilities.
R. REGIONAL WATER SUPPLY SYSTEM
The Town of Williamsburg’s water system was historically supplied by ground water wells.
A May 1977 water system feasibility study by CE Tech recommended a regional water
supply system be established. In 1980, the town entered into an agreement with the City of
Florence and the Town of Coal Creek to form a regional water supply system. This Water
Facilities Agreement established the ability of the three communities to cooperate and
contract with each to provide regional water service and share costs associated with a
regional water system including construction, operations and maintenance, and debt
service. The agreement was consummated on April 7, 1980.
All three parties to the agreement made available existing individual water rights to the
regional water system for diversion, treatment and pumping. Water rights, however, remain
under the ownership of each community. Each community is limited to a service supply
based on the quantities and priorities of their individual water rights. Each community can
add new water services within or outside of the community, just as long as the added
demand is covered by the water rights of the individual community and the added demand
does not jeopardize the service to other parties of the agreement. Water distribution
system facilities within each community’s service area remain under the ownership and

F:\WPDATA\Williamsburg\Water\12 WSImp\Reports\PER\Report.doc 28
responsibility of the respective community. For the Town of Williamsburg, the points of
delineation between the regional water system and the town’s distribution system are the
master meter vaults where treated water is delivered to the town’s distribution system.
Williamsburg has four points of connection to the regional water system. These master
meter vaults are owned by the City of Florence with the cost for their maintenance and
repairs being the responsibility of the town.
The City of Florence, being the largest of the three communities in the initial regional water
system, took the lead role in the construction of the regional facilities. The city secured a
Farmers Home Administration (FmHA) loan and grant in 1981 to finance the construction of
the collection, treatment, storage and transmission improvements. The improvements were
designed and construction inspection was provided by Gilbert, Meyer & Sams, Inc. All
regional water facilities are owned and operated by the City of Florence. All costs incurred
by the City of Florence for pumping, treatment, repairs and debt service are shared
between the four parties to the Water Facilities Agreement. Debt service is assessed using
a debt retirement tap factor based on the number of taps in each community. Operational
and maintenance costs are assessed to each community based on its proportionate share
of pumping and treatment costs according to the amount of water used by each party.
Operation and maintenance cost computations are prepared annually and adjusted each
year for deviations in budgeted amounts of the prior year.
The first addendum to the water facilities agreement was approved by all three original
communities on May 18, 1981. The purpose of the addendum was to address water rights
issues and provide unified support for the filing of three proceedings with the Division 2
Water Court. Water Court Case filing 80CW91 was for conditional surface water rights from
the Arkansas River in the amount of 100 cfs. The adjudicated decree on this conditional
water right dated February 11, 1985 was for 7.6 cfs. The second filing, Case 80CW92, was
for storage rights for the proposed Oak Creek Reservoir in the amount of 2,250 acre feet.
This conditional storage right decree was adjudicated on May 26, 1982. The third filing was
Case 80CW93 for an alternate point of diversion and change of use of the surface and
ground water rights of the three individual parties; and an augmentation plan for the
Arkansas River. This addendum also defined water rights exchanges and purchases
between the three parties as well as made provisions for individual parties to acquire, lease
and use outside water rights. This addendum included a directive to pursue construction of

F:\WPDATA\Williamsburg\Water\12 WSImp\Reports\PER\Report.doc 29
the regional water system facilities concurrently with the filing of the water rights cases as
listed above. This provision in the addendum created a backup scenario such that if water
rights of an individual party (specifically Williamsburg and Coal Creek) had not cleared
water court, water rights from other parties (Florence) would be made available and at a
rate equivalent to that charged by the Southeast Water Conservancy District (SEWCD).
Although sold at the low SEWCD rate, actual water provided has historically come from
Florence’s direct flow rights because SEWCD water cannot be used by nonmembers of the
District.
Addendum No. 2 to the water facilities agreement defined annual costs assessed to
Williamsburg and Coal Creek for treatment and transmission using costs from the previous
year as the basis. This second addendum was approved in January 1984. The third
addendum dated October 9, 1984 established a regional water committee as an advisory
board to assist each community on water policy and in the negotiation of agreements.
Subsequently a set of bylaws was established for the regional water committee. The third
addendum also included provisions to use actual water sales data for water assessments if
there is a master meter failure. The fourth addendum dated May 2, 1994 added the Town
of Rockvale to the regional water system.
The original Agreement on Water Fees was approved and signed by the three parties to the
regional water system on November 9, 1982. The agreement established a uniform
method for charging and allocating tap fees for new water taps within the service area.
Assessment of water fees by each community is to provide 51% of the fee to the regional
investment fund. This fund is to be used for capital improvements and major repairs of the
regional water system. The remaining 49% of the tap fee remains within the water fund of
the town that collected the tap fee. The agreement on water fees was amended six times
between 1983 and 2002, primarily to revise the tap fees. The 1988 fourth addendum
defined a major repair cost threshold at $2,500 with major repairs being paid for from the
regional investment fund and not from the annual operation and maintenance budget. The
Town of Rockvale was added to this agreement in 1994 by addendum No. 5.
The third major agreement consummated between the parties of the regional water system
was the Southfield Water Facilities Agreement. This agreement was approved on
December 5, 1988. The agreement was made to construct regional facilities to make water

F:\WPDATA\Williamsburg\Water\12 WSImp\Reports\PER\Report.doc 30
available for use in the regional water system. The agreement refers to two water project
phases. The Phase 1 water project was the installation of a new pipeline from Adobe and
Mineral Creek’s headwaters to the Town of Florence’s south reservoirs. The Florence
Southfield Water Treatment Plant (WTP) was constructed in Phase 2 of the water project.
This agreement also established a separate regional plant investment fund separate from
the original regional investment fund. The Town of Rockvale was added to this agreement
by addendum No. 1 in 1994.
In 2004, with the completion of the City of Florence’s new Southfield WTP, new bonds were
issued to cover the debt of the facility as well as to pay off previous bonds issued for
construction of the regional system. Currently the Towns of Williamsburg, Coal Creek and
Rockvale are assessed a debt fee on a per tap basis for the Southfield WTP project and a
facilities debt retirement factor for the regional water system at a combined rate of $22.86
per tap per month. The annual operation and maintenance assessment is based on actual
water usage. Cost computations are conducted annually in May. For 2012, the Town of
Williamsburg was assessed a rate for pumping, treatment and transmission in the amount
of $2.67 per 1,000 gallons delivered. Cost computations in May 2012 indicated that the
actual cost for operation and maintenance was slightly higher for the previous year. The
supplemental assessment for 2012 of $334.58 is billed to the Town of Williamsburg over a
12-month period to make up for the 2011 deficit in operation and maintenance costs.
The water rights component and history of the regional water system are quite complex.
The 2010 water rights filing 10CW063 with the Water Court has yet to be adjudicated. This
discussion focuses primarily on water rights associated with the Town of Williamsburg.
Basically, the town is entitled to a delivered water supply volume that does not exceed its
water rights. Water Court Case 80CW93 was filed with the Division 2 Water Court at the
time of the formation of the regional water system. The filing was for an alternate point of
diversion of surface water and ground water rights for each of the three original parties as
well as a change of use (to municipal use) and approval of an associated augmentation
plan. The filing was adjudicated by decree in 1982. With this, the Town of Williamsburg’s
ground water rights were changed to a new right referred to as the Williamsburg pipeline
right. This right is in the amount of 0.665 cfs having a diversion point at the Florence WTP
diversion works and a priority date of December 31, 1890. Note that the diversion point
was changed by Case 87CW120 in 1987 to the Minnequa Canal. Because this 1890 right

F:\WPDATA\Williamsburg\Water\12 WSImp\Reports\PER\Report.doc 31
is almost never in priority from March through November, water supply is provided during
these months from the Florence Union Ditch Rights. Up until 2010, Williamsburg paid a
nominal $11.00 per acre-foot for this supplemental supply based on the original water
facility agreement provisions. Williamsburg’s 1890 water right has historically yielded on
average only 37 acre-feet per year. Williamsburg also holds a 1969 ground water supply
right of 0.445 cfs and a 1974 direct flow right to Chandler Creek of 0.445 cfs (plus an
additional 0.445 cfs of conditional rights). However, these rights are very junior and cannot
be relied upon. Thus, they are not considered further.
Water Court Case 99CW149 was filed in Division 2 Water Court in 1999. The filing
requested a change in use of the town's Union Ditch water rights from agricultural to
municipal. The filing included shares owned by the City of Florence, Coal Creek and
Williamsburg. This case was adjudicated in Water Court on July 19, 2010. Following the
2010 decree, an evaluation by Martin and Wood Water Consultants, dated January 6, 2011,
determined that the these additional water rights were sufficient to support 285 water taps
for the Town of Williamsburg. The 2000 water tap moratorium was established at a
maximum of 273 taps. Thus, the additional adjudicated rights made up for the town's water
rights deficiencies and provided capacity for 12 additional taps. The additional 12 taps as
agreed to with the City of Florence, were approved by town resolution in April 2011.
Williamsburg owns an additional 46 shares of Union Ditch Water Rights. These shares
require a change of use decree by the Water Court. The change of use has been filed with
the Court in Case No. 10CW063 in September 2010. The decree on this filing is pending.
According to the January 6, 2011 water rights evaluation, once adjudicated, the additional
water rights would provide the town the capacity for 94 additional water taps.
This is only a summary of the town’s water rights situation. The full picture of the regional
water system is much more complex.

F:\WPDATA\Williamsburg\Water\12 WSImp\Reports\PER\Report.doc 32
SECTION III
EXISTING WATER SYSTEM FACILITIES
A. BACKGROUND
A field review of the Town of Williamsburg’s existing water system was undertaken in the
course of this study effort. A list of information requested on the town’s water system was
provided to town representatives in advance of an on-site meeting. An on-site review of the
system was conducted in conjunction with the collection of the requested data by the
consultant. Figure 5 in the back of this study has been compiled from the information
available with respect to the existing water distribution system. Figure 2 shows the location
of a portion of the regional water system including the Coal Creek regional storage tank
which is currently not used.
The town's water system was originally constructed well over a century ago during the coal
mining boom of the region and the incorporation of the town. The system was supplied by
two shallow wells along the west side of Oak Creek. With the formation of the Regional
System in 1980 and the subsequent construction of the regional treated water transmission
system, the town abandoned its original water supply facilities. The new source of water to
the town resulted with burgeoning growth within the town limits during the 1980s and
1990s. Two major problems occurred during this growth period. The town did not have in
place any water system design or construction standards. Thus, the distribution system
installations to support new residential houses were, in general, constructed to the
minimum or below minimum industry standards. Secondly, the town sold water taps in
excess of what could be supported by the town’s water rights. This resulted with the 2000
court imposed water tap moratorium.
B. WATER SUPPLY
The Town of Williamsburg does not have any water supply facilities that contribute to the
Regional Water System. The town has pooled its water rights with other parties in the
Regional Water System Agreement. The physical water supply is obtained from a diversion
off the Arkansas River via the Minnequa Canal to the Florence North Reservoir, and from
the Adobe Creek, Mineral Creek and Newlin Creek pipelines to the Florence Southfield
F:\WPDATA\Williamsburg\Water\12 WSImp\Reports\PER\Report.doc 33
Reservoirs. The town's water rights consist of a 0.665 cubic foot per second (cfs) Union
Ditch right, supplied by the Arkansas River as adjudicated in Division 2 Water Court Case
No. 80CW93, with an appropriation date of December 31, 1890. This a relatively junior
right that is often out of priority from March through November. The town is also party to
7.6 cfs of water rights from the Arkansas River adjudicated under Case No. 80CW91 with
an August 26, 1980 appropriation. This very junior right is typically only available under a
free river condition (no calls on the river). Water Court Case No. 80CW93 provides a 7%
augmentation credit to Florence, Coal Creek and Williamsburg for Union Ditch diversions
above 2.0 cfs. Water Court Case No. 80CW92 was awarded to Florence, Coal Creek and
Williamsburg for storage rights. This Court adjudication was intended to accommodate the
construction of the Oak Creek Reservoir proposed to be located just north of town;
however, the geotechnical investigation of the reservoir site found that construction costs
would be prohibitive.
The adjudication of Water Court Case 99CW149 changed the use of 140 Union Ditch
shares to municipal use. This raised the 2000 water tap moratorium limit of 273 taps up to
285 taps, providing the town with the ability to issue 12 additional water taps. The pending
Water Court Case 10CW063 is intended to change the use of 46 Union Ditch shares owned
by the town. This is estimated to provide water rights for 94 additional water taps within the
Town of Williamsburg.
C. WATER TREATMENT
Water treatment of the town’s water supply is provided by the regional water system. It is
operated by the City of Florence. An evaluation of the water treatment facilities was not
conducted within this study. An evaluation of water quality provided from the regional
system has been reviewed and is discussed later in this report. In general, water treatment
provided to the town’s raw water is adequate to meet drinking water standards as regulated
by the CDPHE. Disinfection contact time provided in the regional transmission piping
extending from the two WTPs to the town’s distribution system connections appear to be
adequate.
F:\WPDATA\Williamsburg\Water\12 WSImp\Reports\PER\Report.doc 34
D. TREATED WATER STORAGE
Treated water storage for the Town of Williamsburg is primarily provided by the regional
water system. The primary regional system storage tank supporting the town’s pressure
zone is located at the South Field WTP. The new tank holds 2 MG and is located
approximately 3.4 miles southeast of town. It is 16 feet higher in elevation than the Coal
Creek tank, rendering the Coal Creek tank problematic. Figure 2 depicts the Coal Creek
regional storage tank located south of the Town of Coal Creek, west of County Road 13.
The Coal Creek tank has been removed from service.
E. TRANSMISSION AND DISTRIBUTION SYSTEM PIPING
The Town of Williamsburg's water distribution system is shown on Figure 5 in the back of
this report. The map was compiled by the consultant and reviewed by town representatives
to confirm accuracy as best possible. Due to the unregulated installation of most of the
system in the 1980s and 1990s, locations of the distribution system facilities shown on
Figure 5 are approximate only. Pipe sizes, materials and valves are indicated on the
system map where they are known.
Treated water is provided by the regional system's pumping and transmission system. The
regional system's piping in close proximity to Williamsburg is shown on Figure 2. A 10-inch
transmission main extends south in County Road CR85A (Quincy Street) and continues
northeast in CR13A (Central Avenue) to Scutti Drive extending to the regional system's
North WTP. The water supply to the town is provided at four metered connections to the
transmission main as shown on Figure 5. Master Meter No. 1 is located at Quincy Street
and Central Avenue and services all of the town west of Oak Creek. Master Meter No. 2 is
located at Scutti Drive and Central Avenue and serves the northeast quadrant of town.
Master Meter No. 3 is located at Quincy Street and Capistrano Drive and feeds the south
end of town. The fourth connection to the regional system is Master Meter No. 4 located at
Quincy Street and Main Street. It feeds the central portion of the town's distribution system.
The regional transmission main and four town meter vaults are owned by the regional
system and maintained by the City of Florence. Repair costs at the master meter
connections are invoiced to the town. The master meters had radio read registers installed
in 2003.
F:\WPDATA\Williamsburg\Water\12 WSImp\Reports\PER\Report.doc 35
The town’s distribution system consists of approximately 9.2 miles of piping ranging from 2
inches to 6 inches diameter in size. Approximately 5% of the distribution system is 6-inch
diameter, 40% - 4-inch, 15% - 3-inch and 25% - 2-inch in size. Approximately 15% of the
distribution system pipe size is not known and is assumed to be 4 inches in diameter. The
largest pipe segment is a 6-inch diameter main extending east from Master Meter No. 1,
across Oak Creek and continuing east in Copper Creek and Rockrimmon Road to its
intersection with Wilmont Road. Pipe materials are typically polyvinylchloride (PVC);
however, the type, pressure class and joint types vary. Pipes typically were installed at 4 to
5 feet deep and are located in the shoulder of the roadway. Some areas, however, are
reported to have as little as 1 foot of cover on the pipeline. Piping in Central Avenue,
Quincy Street and Churchill are reported to be under the pavement.
The town's water system for the most part is not looped. Water mains extend outward from
the core of town or Master Meters in a branching fashion. Refer to Figure 5 located in the
back of the report. The lack of looping results in reduced flows and pressures during
elevated demand conditions as well as potential water quality related issues.
Williamsburg’s service area is contained within the regional system's pressure zone D.
This pressure zone is fed from the 2 MG South Field WWTP storage tank which has a high
water surface elevation of approximately 5,604 feet above msl. Topography with service
area within the town ranges from a low of 5,335 msl on the north end of Iron Horse Road, to
a high of 5,460 msl on the south end of Rockrimmon Road. Based on a hydraulic grade
line of 5,604, available static service pressures within the distribution system range from 62
to 117 pounds per square inch (psi). The majority of the town’s service area has a static
pressure in the 75 to 95 psi range. These relatively high pressures combined with the
questionable piping installations likely contribute to the system’s ongoing pipe breaks.
Due to the long dead end and small diameter pipelines common throughout the system,
service pressures drop off significantly during high demand conditions. The installation of a
booster pump station was begun by the town, but never completed. A buried concrete vault
was installed adjacent to the 6-inch main extending east from Master Meter No. 1. The
booster system would have been used to increase pressures in the distribution system on
the west side of Oak Creek. It is not known why this project was not completed.

F:\WPDATA\Williamsburg\Water\12 WSImp\Reports\PER\Report.doc 36
Problem areas within the distribution system have been identified by town representatives.
Pipe breaks are frequent within the distribution system. From November 2011 through
August 2012, the town recorded eleven pipe breaks. These occurred primarily at glued
PVC pipe joints that pulled apart. These breaks have been most common in Wilmont Road
and Rockrimmon Road.
Low pressure conditions are common along the southern portions of Rockrimmon Road,
Bear Gulch Road and Cedar Ridge Road. Static pressure calculations suggest that 58 to
68 psi of pressure would be available; however, as can be seen on Figure 5, the long
deadend pipelines serving these areas are small diameter and serve too many customers,
resulting in low service pressures during high demand conditions.
The 4-inch pipeline in Copper Creek Road is concrete encased across Oak Creek. This
piping is reported to be thin wall PVC with glued joints. This pipeline is reported to require
on average, three repairs for breaks every year. Service taps in some areas are reported to
fail due to the thin wall PVC in which the tap is made. No specific areas were identified.
A valve at the intersection of Central and Main Street is reported to be broken. The 2-inch
dead end line serving Bluff Road also serves the town park for irrigation. When conducting
park irrigation, services along Bluff Road have minimal to no service pressure. This
phenomenon also occurs throughout the distribution system when the fire department
draws fire flow from a hydrant. Again, these pressure problems are primarily related to the
lack of looping of the system and the system’s small diameter pipelines. Only five existing
fire hydrants have calculated flow rates above 500 gpm. These are hydrants Nos. 1, 2, 11,
16 and 23 as shown on Figure 5 in the back of this report.
Valving within the town’s extensive distribution system is somewhat lacking. Only those
valves known to exist are shown on Figure 5 located in the back of this report. The large
spacing between distribution system valves limits the ability of the town operator to shut
down a segment of the distribution system for maintenance and repairs, thus requiring large
areas to be taken out of service for these activities. The need for additional valving within
the distribution system has been identified in conjunction with additional piping

F:\WPDATA\Williamsburg\Water\12 WSImp\Reports\PER\Report.doc 37
recommendations. This will enhance operational flexibility to maintain the existing
components of the system.
Currently the town has 27 fire hydrants located throughout the distribution system. These
fire hydrants are shown on Figure 5 located in the back of this report. Fire protection is
provided by the Florence Fire Protection District, a volunteer fire department, with a station
in Williamsburg. Most hydrants are modern 6-inch barrel type hydrants; however, a few
smaller three or four inch barrel hydrants are located within the system. The Town’s
hydrants have numerous manufacturers making it difficult to maintain an adequate
inventory of spare parts.
F. WATER METERS
The Town of Williamsburg requires the installation of meters for all active customers on the
water system. Water service is typically extended from the water main in the street to a
meter pit, typically located at or near the property line between the main and the customer.
All services are ¾-inch in size with a ¾-inch meter. The only exception to this sizing is a 2-
inch metered service to the town park. The town does not have any large volume or
commercial users. In 2006 and 2007, the Town of Williamsburg conducted a
comprehensive meter system replacement program. The old meters were replaced with an
Automatic Reading and Billing (ARB) meter system having touch read transmitters located
on the underside of the meter pit lid. The new meters were installed with new meter setters
having a cartridge type double check valve in the setter. This provides individual backflow
protection for the distribution system at each customer’s service. New meter pits were also
installed. Some customers have individual pressure reducing valves on their service
located inside the home due to the relatively high pressures provided in some areas of the
distribution system. The new ARB meter system was financed by the meter vendor. The
new meters and meter pits were installed by town staff. The ARB system provides the
town’s operational staff with the ability to read all meters remotely using a touch read data
collector. Water meter readings are then downloaded directly into the town’s new billing
software. This upgrade has resulted in a dramatic savings in the time required by the town
staff to read customer meters and generate billing statements. The quantity of
unaccounted-for-water, the difference between the quantity of water provided by Florence

F:\WPDATA\Williamsburg\Water\12 WSImp\Reports\PER\Report.doc 38
and the total metered water sales, dropped dramatically with the installation of the new
meters.
Service line materials in the town’s water system are primarily Schedule 40 or 80 PVC
extending from the main line to the meter. Some older service lines are galvanized iron
pipe. From the meter pit to the customer’s building, service lines are typically PVC, copper
or older galvanized iron pipe. Curb stops on the service lines have been installed on only
approximately 30% of the services. The service line is owned and maintained by the town
from the main up to the meter pit. From the meter pit to the building being served, the
service line is owned by the customer and is the customer’s responsibility to maintain.
The town had 266 water service accounts in January 2013. These are billed accounts
consisting of both active and inactive users. The town had been under a water service
moratorium from 2000 to 2011 with a maximum of 273 taps allowed. In 2011, the town was
allowed to issue up to 12 additional water taps. In January 2013, the town had a total of
247 active accounts, 19 inactive but billed accounts, and 7 inactive nonbilled accounts. All
customers are metered except for the Town Hall and Town Shop. All customers are billed
for water service, except for the two town services and the town park. Therefore, there are
a total of 263 billed water users. All customers are charged for water system debt service
within the base rate (except for the town services). The town’s monthly water rate structure
consists of a two-step rate plan. The base rate is for the first 5,000 gallons and includes the
regional water system debt service. A surcharge per 1,000 gallons is assessed for usage
above the minimum of 5,000 gallons. Additional details and discussion of the water rate
structure is presented in the financial assessment section of this report.
Treated water supply meter readings associated with the four regional system master
meters are recorded by the City of Florence and are the basis of the billings for monthly
treatment and pumping charges assessed to the town.
G. OPERATIONS AND MAINTENANCE
The operation of public water systems is regulated by the Colorado Department of Public
Health and Environment (CDPHE). The town water operator holds a Class 1 Distribution
Certification. In accordance with regulation No. 100, the town’s water system requires a

F:\WPDATA\Williamsburg\Water\12 WSImp\Reports\PER\Report.doc 39
Colorado water distribution system class “1” certification. A water treatment operator
certification is not required by the town. The regional water system operator of responsible
charge retains this certification for treatment provided to the town’s water supply.
A review of the water system conducted by the consultant shows that the overall system is
in relatively poor operating condition. A significant portion of the distribution system is
considered to be substandard based on reports by town representatives following activities
related to pipe repairs; however, specific problem segments are not known with the
exception of those previously discussed.
The following schedule is a list of routine operation and maintenance activities conducted.
• Conduct distribution system bacteriological and chlorine testing
(by regional system) ........................................................................................... Monthly
• Read and record user meter readings ................................................................. Monthly
• Conduct system flushing ................................................................................ As needed
• Respond to and repair pipe breaks.................................................................As Needed
• Equipment maintenance and service............................................................As Required
• Conduct water quality testing (by regional system).......Per CDPHE monitoring schedule

F:\WPDATA\Williamsburg\Water\12 WSImp\Reports\PER\Report.doc 40
SECTION IV
HISTORIC AND PROJECTED WATER CONSUMPTION
An assessment of historic and projected water demands for the Town of Williamsburg is
presented in this section. Historic flow data consisting of regional system treated water supply
and water sales are used to establish the baseline water use parameters for the town. These
parameters were used to project future demands on the water system based on service area
population projections.
Monthly water sales totals were provided by the town for the period from February 2011 through
December 2012. The total number of water system taps has remained constant at 273 since
2000. Of this total there are 7 inactive, nonbilled taps, 244 active billed taps, 19 inactive billed
taps, 2 town unmetered services and the town park’s service. The following table presents a
total of the monthly water supply delivered to the town from the regional system and the monthly
water sales for the period from February 2011 through December 2012.

F:\WPDATA\Williamsburg\Water\12 WSImp\Reports\PER\Report.doc 41
TABLE 3
TOWN OF WILLIAMSBURG
HISTORIC WATER SYSTEM PRODUCTION AND CONSUMPTION
2011 2012
Month Delivered,
MG 1) Sales, MG 1)
Delivered, MG 1)
Sales, MG 1)
January 6) 6) 1.42 1.01
February 1.11 1.14 1.27 1.04
March 1.38 0.92 1.58 1.17
April 1.59 1.49 1.88 1.45
May 2.00 1.49 2.17 1.85
June 2.83 2.66 2.98 2.33
July 2.94 2.42 3.10 2.40
August 2.88 2.40 2.77 2.14
September 1.95 1.64 2.24 1.73
October 1.64 1.30 6) 2.01 1.37
November 1.32 1.14 1.69 6) 1.02
December 1.31 0.99 1.50 0.91
Total, MG 1) 20.95 17.60 24.62 18.43 gpd 2) 62,710 52,691 67,452 50,506
Unaccounted-for-water, % 3) 16.0 25.1
Service Population 663 663
gpcd, total 4) 95 102
gpcd, sales 5) 79 76
1) MG = million gallons 2) gpd = average gallons per day 3) Unaccounted-for-water = water delivered minus water sales divided by delivered. This represents water
which is not accounted for 4) gpcd = gallons per capita per day of water delivered to town from regional water system and includes
the unaccounted-for-water 5) gpcd = gallons per capita per day of water sales 6) Data not available
As presented in the above table, unaccounted-for-water represents water that is delivered by
the regional water system into the town’s distribution system that is not measured by the town’s
customer meters. Unaccounted-for-water within the town’s water system declined significantly
in 2006 with the installation of the new service meters. For the period from February 2011 to
December 2012, unaccounted-for-water averaged 21%. Unaccounted-for-water is primarily
attributed to unmetered uses such as fire hydrant usage and pipeline leaks and breaks within

F:\WPDATA\Williamsburg\Water\12 WSImp\Reports\PER\Report.doc 42
the town’s distribution system. These factors are not quantifiable. An unaccounted-for-water
value of 15% to 20% is not unreasonable. Values of 30% to 40% are not uncommon. The
American Water Works Association recommends an unaccounted-for-water goal of 10% with
proactive efforts taken to reach this goal. For the Town of Williamsburg, unaccounted-for-water
percentages for 2011 and 2012 at 16.0% and 25.1%, respectively, reflect relatively low values
considering the condition of the town’s distribution system. Unfortunately, losses of this
magnitude reflect a financial impact on the community. All water passing through the master
meters into the town's distribution system is paid for on a per 1,000 gallon basis to the City of
Florence. Thus, with losses as high as 25%, such reflects 25% of the water invoice received
from the City of Florence that has not been sold and generated any revenue, but in turn, has
been lost within the system.
Based on the 2011 estimated service area population, the per capita water sales was 79 gallons
per capita per day (gpcd) in 2011 (11 months only), and 76 gpcd for 2012. These per capita
daily average rates of sale are relatively low for a community similar to Williamsburg with no
high water usage commercial customers or industrial users. The low per capita water sales rate
is an indication of the community’s high water rate structure and minimal outdoor irrigation use.
For the purpose of this report, water use projections are based on the average daily water sales
in 2012. As previously indicated, unaccounted-for-water within the system has averaged 21%
over the twenty-three months of record. This value is expected to drop with the distribution
system improvements recommended in this study. Therefore an unaccounted-for-water value
of 15% is used for the town's water use projections. The maximum month water delivery
occurred in July 2012, totaling 3.10 million gallons. This represents a maximum month factor of
151% of average. Maximum day demand conditions occur during the summertime when
conditions are dry and outdoor water usage is elevated. Daily water sales data is not available.
Based on the maximum month demand factor of 151%, the maximum day demand peaking
factor is estimated at 225% of average day demand. This is a fairly typical value for a
community of this size with limited outdoor water use. The highest demand condition that
stresses a system the most is the peak hour demand that occurs typically for a short period of
time during the maximum day demand condition. Typical peak hour demand factors for a
community of this size range from 3.0 to 4.0 times the average day demand. For the purpose of
this evaluation, a peak hour demand of 325% of average day has been selected as being
representative of this condition.

F:\WPDATA\Williamsburg\Water\12 WSImp\Reports\PER\Report.doc 43
The following table is a summary of the baseline water use parameters used in this report for
the Town of Williamsburg’s water system in projecting future water demand conditions.
TABLE 4
TOWN OF WILLIAMSBURG
2012 BASELINE WATER USE PARAMETERS
Parameter Value
Average daily water Delivered, gpd 2) 59,419 Average daily water Sales, gpd 1) 50,506 Unaccounted-for-water, % 3) 15.0 Maximum monthly water usage, % 4) 151 Maximum daily water usage, % 4) 225 Peak hour water usage, % 4) 325 Service Area Population, 2012 663 Per Capita Water Delivered, gpcd 2) 89.6 Per Capita Water Sales, gpcd 1) 76.2
1) Based on 2012 metered water sales data 2) Based on a projected reduced unaccounted-for-water value of 15.0% 3) Based on an assumed reduction in unaccounted-for-water from 23.0% to 15% with improvements
recommended in this study 4) Percent of average daily water delivered by regional water system.
Using the baseline water use parameters presented in the above table and population
projections from Table 2, the existing and estimated future water demand requirements from the
regional water system are presented in the following table.
TABLE 5
TOWN OF WILLIAMSBURG
EXISTING AND PROJECTED DEMANDS 1)
Condition Population Average Day Demand 2), gpd
Maximum Day Demand 3), gpd
Peak Hour Demand 4), gpm
Existing - 2012 663 59,419 133,700 134 Future - 2015 692 62,000 139,500 140 Future - 2020 744 66,700 150,000 151 Future - 2025 796 71,300 160,500 161 Future - 2030 843 75,600 170,000 171 Future - 2035 886 79,400 178,700 179
1) Water delivered by regional water system 2) Average day demand = gpcd of delivered water x population 3) Maximum day demand at 225% of average day demand. 4) Peak hour demand at 325% of average day, divided by 1,440

F:\WPDATA\Williamsburg\Water\12 WSImp\Reports\PER\Report.doc 44
SECTION V
FUTURE WATER SUPPLY REQUIREMENTS
The regional water system’s raw water supply, treatment, pumping and transmission facilities
serve the City of Florence and the Towns of Williamsburg, Coal Creek and Rockvale, as well as
several additional large customers who are not a party to the regional water system agreement.
Figure 2 depicts only a portion of the regional system transmission piping as it loops to the
southwest to serve Williamsburg, Coal Creek and Rockvale.
The regional system has two water treatment plants, the North WTP with a capacity of 1.3
million gallons per day (mgd) and the South Field WTP rated at 6 mgd. The system serves
multiple pressure zones. The Town of Williamsburg is served by regional pressure zone D.
Water storage in this zone is provided by the South Field WTP storage tank with a capacity of
2.0 MG. The South Field WTP storage tank is located approximately 3.4 miles southeast of
Williamsburg at the WTP reservoir site.
The regional water system 2002 master plan recommended Williamsburg construct an internal
water transmission line to tie together and loop the long dead end piping extending from the
north end of Bear Gulch Road to the center of town. A second recommended master plan
project for Williamsburg consists of the addition of a booster pump station and transmission
main for a future pressure zone serving the high ridge area west of Bear Gulch Road. These
are considered to be relatively low priority improvements. New regional system transmission
mains are also recommended extending from the South Field WTP storage tank through Coal
Creek, then looping south through Williamsburg. As indicated in the master plan, with the
construction of the 2.0 MG South Field WTP storage tank and the proposed transmission main
extensions, adequate fire flow volumes and flows will be provided to the Town of Williamsburg.
This assumes adequate town distribution facilities are available.
Projected water demands for the Town of Williamsburg are presented in Table 5. Existing
average day supply requirements of 59,400 gallons per day (gpd) are projected to increase to
79,400 gpd in 2035. This increase is driven by the overall growth projections for Fremont
County. Once sufficient water rights are secured to supply growth, water demands within the
regional system would be expected to increase at the projected countywide growth rate. The
town's water tap moratorium limiting the town to 273 taps was increased to 285 taps in 2011. A

F:\WPDATA\Williamsburg\Water\12 WSImp\Reports\PER\Report.doc 45
2010 water rights filing is expected to provide an additional 94 taps once adjudicated. This is
assumed to occur after 2015.
Water system demands for the regional water system were projected out to the year 2020 within
the Regional System Master Plan when prepared in 2002. Demand projections were based on
population projections available at that time. Regional system improvements have been
recommended to accommodate growth and associated water demand increases.
Implementation of those improvements are the responsibility of the regional water system
committee and the City of Florence. For the purpose of this study, it is assumed that the
regional system will not fall behind in system capacity improvements needed to meet the future
demands for the Town of Williamsburg.
The Town of Williamsburg has recently converted 140 shares of Union Ditch water rights in
water court under Case No. 99CW149, together with the City of Florence and Town of Coal
Creek's Union Ditch shares. The amount of water to be provided as a result of the conversion
of the town’s Union Ditch shares has resulted in the ability to serve 285 residential taps. These
shares are adequate to cover the town’s existing 273 taps with a surplus of 12 additional taps to
allow for some growth. Williamsburg is currently in the process of converting 46 additional
shares of Union Ditch rights under Division 2 Water Court Case 10CW063. Once adjudicated,
these rights will provide for approximately 94 additional customer taps.

F:\WPDATA\Williamsburg\Water\12 WSImp\Reports\PER\Report.doc 46
SECTION VI
EVALUATION OF EXISTING FACILITIES
In evaluating the adequacy and performance of a water system, it is necessary to consider the
various discrete elements of the system and how these elements perform together. The Town
of Williamsburg’s water system is not a typical free-standing system with a self contained
supply, treatment, storage and distribution system components. The town does not have either
a raw water supply or treatment facilities. Treated water is pumped into the regional system’s
transmission and storage facilities. The town is connected to the regional transmission system
at four metered locations. The water system components owned by the town, for which it is
solely responsible, consist only of the town’s distribution system. This section of the report does
not conduct an evaluation of the regional system’s facilities. The regional system appears to be
well operated and managed, with a master plan in place that addresses future needs. This
section looks at the treated water quality provided by the regional system, regional system
storage as it applies to the town, and the town’s distribution and metering systems.
Recommended water system improvements to the town’s facilities are then drawn from this
review.
A. WATER QUALITY
The town’s treated water supply is provided by the regional system’s water treatment
plants. The source water is a combination of surface water supplies that include diversions
of the Minnequa Canal, Newlin Creek, Adobe Creek, Mineral Creek and the Town of
Rockvale’s wells. The treated water quality provided to the town is considered to be
excellent. Water quality sampling of the treated water leaving the water treatment plants for
regulated contaminants and WTP operations are conducted by the City of Florence. Water
quality sampling for the Town of Williamsburg’s distribution system for bacteria and
disinfection byproducts are conducted by the Florence staff. Lead and copper sampling of
customer taps is conducted by the town staff. The required sampling frequency varies for
each water quality parameter.
Water quality data has been obtained from town representatives consisting of the annual
Consumer Confidence Reports for water provided by the regional water system. The
annual reports indicate that none of the Environmental Protection Agency’s (EPA’s)

F:\WPDATA\Williamsburg\Water\12 WSImp\Reports\PER\Report.doc 47
regulated maximum contaminant levels (MCLs) have been exceeded. In fact, common
drinking water contaminants normally present in drinking water were well below detectable
levels. Concentrations of barium, fluoride and radionuclides were detected at low levels,
well below their MCLs. Nitrate averaged 0.12 mg/l, which is well below the 10.0 mg/l MCL.
Sodium has averaged 15 mg/l, which is very low. Overall, treated water quality is
considered to be excellent.
Raw water turbidity removal for pathogen protection is the primary treatment objective of
the two regional WTPs. In 2012, the maximum single treated water turbidity measurement
was 0.099 nephelometric turbidity units (NTUs). Water treatment plant filtration
effectiveness is demonstrated if 95% of the turbidity samples each month are less than 0.30
NTU.
The 1998 Stage-1 Disinfection/Disinfection Byproducts Rule, which applies to service
populations less than 10,000, establishes a maximum residual disinfection level for chlorine
in the distribution system at 4.0 mg/l. In order to demonstrate compliance with this rule, the
Town of Williamsburg is required to conduct quarterly distribution system disinfection
measurements and submit these reports to the State. Sampling is conducted by the City of
Florence. Maximum limits established by the Rule are 0.080 mg/l for total trihalomethanes
(TTHM), and 0.060 mg/l for five surrogate haloacidic acids (HAA5). The 2012 monitoring
results for these parameters found concentrations of 0.0142 mg/l of TTHM and 0.0279 mg/l
of HAA5, substantially under one-half of the established limits. Therefore, the Rule would
allow the regional system to conduct reduced monitoring of these contaminants.
Distribution system sampling for total coliform and E. coli conducted monthly by the
Florence staff consistently result in an “absent” result, indicating that the distribution system
is free of bacteriological contamination.
As required by the Lead and Copper Rule, the town staff conducts sampling of selected
customer taps every three years. The 90th percentile action level for lead is 0.015 mg/l and
1.3 mg/l for copper. The 2010 results of this sampling survey found concentrations well be
low the regulated 90th percentile for each parameter.

F:\WPDATA\Williamsburg\Water\12 WSImp\Reports\PER\Report.doc 48
B. WATER STORAGE
Treated water storage for the Town of Williamsburg is provided by the regional water
system with one storage tank located in Williamsburg’s pressure zone. The regional
system tank consists of the South Field WTP storage tank with a capacity of 2.0 MG.
Although this tank is located a considerable distance southeast of town, it is connected by
means of the regional system’s relatively large diameter looped piping system. The
regional storage tank is sited above the town’s service area and functions as a conventional
gravity storage tank in that it provides pressure to the system as a result of its vertical
relationship to it. The tank floats on the system, pressurizing it and meeting water demands
as required.
Distribution storage serves several purposes. Total storage needs must be evaluated with
consideration given to each individual storage component. The three primary purposes of
water storage are:
1. Equalization storage to meet hourly variations in demand.
2. Fire storage to store water for firefighting.
3. Emergency storage to provide a reserve supply for emergency use.
The South Field WTP storage tank, sized at 2.0 MG, was recommended within the regional
system master plan in 2002. This storage tank has been constructed and, according to the
master plan, was sized to accommodate equalization, fire and emergency storage
requirements for the regional system’s pressure zone D through the year 2020.
Instantaneous demands placed on a water system are not uniform throughout any given
day. The system must be able to supply the peak demands that occur on an hourly basis
throughout the day. Water storage is a means whereby the equalization of these
heightened demands can be obtained without placing the demand directly on pumping or
treatment facilities. Equalization storage for a community the size of Williamsburg typically
ranges from 15 to 30% of maximum day demand. As developed earlier in this study, the
future 2035 maximum day demand on the system is estimated at 178,700 gallons per day
(gpd). Thus, the equalization storage requirement for the town is between 26,800 and
53,600 gallons.

F:\WPDATA\Williamsburg\Water\12 WSImp\Reports\PER\Report.doc 49
The second component of storage is fire flow. Fire protection within the town is provided by
the Florence Fire Protection District. The needed fire storage is estimated using the
Insurance Service Office (ISO) guidelines. An ISO evaluation of the town’s fire protection
system was not available for preparation of this report. ISO evaluates the fire protection
capabilities of a community within three different categories consisting of: communications,
the fire department and the water system. From this evaluation, a community is given a fire
suppression classification ranging from 1 to 10. The evaluation of the water system
accounts for 40% of the grading. Needed fire flow for residential housing having a typical
separation of greater than 100 feet is 500 gpm per ISO criteria. With the smaller diameter
dead end piping provided within the town’s distribution system, this fire flow rate is not
available within the majority of the town’s distribution system. As presented later in this
section, existing available fire flow from the town’s existing fire hydrants averages 339 gpm.
In the determination of the required fire storage component, the needed fire flow of 500
gpm is increased by the maximum day demand flow of 178,700 gpd (124 gpm) and
decreased by the projected maximum pumping rate into the system. For the regional
system, values for total pumping capacity into the system are approximately 10 MGD, or
7,000 gpm. With the assumption that only one major fire would be occurring within the
regional water system, this production capacity of the regional system WTP is sufficient to
meet the fire flow demands of the Town of Williamsburg without consideration given to fire
storage requirements.
The third factor is sizing storage is an emergency reserve. The reserve has been
considered within the regional water system master plan at a level of 24 hours of
emergency reserve for the entire regional system.
Therefore, it appears that adequate storage has been considered in sizing of the existing
storage facility for not only the main portion of the Town of Williamsburg, but for the entire
regional system.

F:\WPDATA\Williamsburg\Water\12 WSImp\Reports\PER\Report.doc 50
C. DISTRIBUTION SYSTEM
As presented in Section III of this report, the town’s distribution system consists of
approximately 9.2 miles of piping ranging in size from 2-inches to 6-inches in diameter.
Figure 2 shows the configuration of the town prior to joining the regional water system in
1980, prior to the rapid development that occurred in the 1980’s and 1990’s. Figure 2
defines the older areas of town with structures centered around John Street and Central
Avenue, and south along Churchill Street. The 1980 population totaled 72 people. Thus,
these areas contain the older, pre-1980 distribution system piping. No piping problems are
reported by the town in these older areas, thus, the piping in these areas is considered to
be in a relatively good serviceable condition.
The majority of the remaining system is relatively new, being installed from 1980 to 2000.
Due to the apparent lack of design and construction standards, and any apparent
construction oversight, distribution system extensions in the newer developments were, in
general, installed in a poor, substandard manner. Pipe sizes in many areas are too small.
Pipe looping is close to nonexistent. In fact, looping appears to have been likely avoided to
save on costs. A good example is in the Wilmont Circle area where a loop could have been
completed with only a few feet of additional piping. Pipe looping is not easily accomplished
in some areas due to shallow bedrock conditions and steep topography.
Pipe bedding uncovered during pipe repairs has been reported at times to consist of
construction debris and unacceptable material. This condition likely contributes to some of
the pipe breaks. It is not thought to be a wide-spread problem. The typical depth of cover
on the piping is 4 to 5 feet; however, this typical depth of cover has been compromised in
some locations where bedrock was encountered. The town has indicated that the depth of
cover is only 1 foot in some isolated areas.
Service pressures drop dramatically in the long, undersized dead-end pipelines during high
demand or fire flow conditions. This limits both service and fire hydrant flow rates.

F:\WPDATA\Williamsburg\Water\12 WSImp\Reports\PER\Report.doc 51
Poor historical records have been kept by the town as to pipeline locations, sizes, materials,
depths and valving. Thus, much of the existing water system map, Figure 5, was compiled
from available freehand drawings and operator interviews.
The 2002 regional system master plan includes two recommended projects directly related
to the Town of Williamsburg. These are conceptual projects. The first is a pipeline, internal
to the Williamsburg distribution system, which would improve system pressures by tying
together the north end of Bear Gulch Road to the center of town. The second conceptual
recommendation is a new booster pump station and pipeline to serve a high pressure zone
associated with development of the ridge above Bear Gulch Road. A detailed assessment
of the town’s distribution system conducted by the consultant found that the internal pipeline
project would provide only limited improvement to the system’s pressure problems;
however, the number of service points off of the regional system should be reduced from 4
to 1. The booster pump station and pipeline project is very conceptual and is intended to
accommodate the future development of the Bear Gulch Ridge area. This master plan
recommendation is not included in the recommended water system improvements of this
report; however, a plugged pipe stub is proposed for the future Bear Creek ridge pipeline at
the intersection of Copper Creek Road and Churchill Street. The elimination of multiple
master meters is included in a lower priority group of recommended improvements.
The suggestion has been made by some that the town’s existing distribution system should
be entirely replaced. This is a costly approach and would likely result in the replacement of
existing pipeline segments in good condition. If the existing distribution system was kept as
is, the frequency of pipe breaks would likely diminish over time as the most vulnerable
substandard installations would break and be repaired using a higher construction
standard. This process has been taking place by the town in addressing pipeline breaks
over the last decade. This approach unfortunately is time consuming and costly.
Improvements to enhance service and fire flow pressures with looping and pipe upsizing
will result in system pressures being more consistent and not fluctuating as dramatically as
they currently do. Thus, the existing piping that has not been replaced will not be as
stressed as it has been in the past. Following this rationale, the recommended approach to
upgrading the town’s distribution system is, in order of priority:

F:\WPDATA\Williamsburg\Water\12 WSImp\Reports\PER\Report.doc 52
• Replace identified problematic pipe segments
• Address identified pressure problem areas with looping and/or pipe upsizing
• Address low fire flow conditions at identified locations
• Add fire hydrants in locations that are not currently within the existing fire protection
coverage area
• Add system valves to assist with the isolation of piping segments for repair and
maintenance
• Add additional pipe blow-offs on pipe dead ends and air release valves at high points,
where necessary
• Eliminate multiple regional master meters with larger diameter piping to connect the
fragmented service areas of the town
This improvement approach builds on the existing distribution system to address water
delivery deficiencies in the most cost efficient manner; however, future pipe breaks within
the existing distribution system components that have not been replaced are likely to
continue, but should occur at a much less frequent rate. Recognizing this potential, the
water system budget needs to make an allowance to pay for pipe breaks within an
emergency reserve fund.
Problem areas identified by town staff consist of the following. Refer to Figure 5 in the back
of this report for the existing distribution system configuration and Figure 6 in the back of
this report for the proposed water system improvements.
1. Bluff Road. This 900-foot segment of 2-inch piping serves 4 houses and the town
park’s irrigation service. When irrigating the park, little or no pressure is available to
houses on Bluff Road. Available fire flow calculated at fire hydrant 11.5 on the south
end of Main Street, parallel to Bluff Road, is only 200 gpm (with a 20 psi residual). The
solutions to address these deficiencies consist of relocating the park irrigation service
to the new proposed 10-inch main extending west across Oak Creek, replacing the 2-
inch pipe in Bluff Road with a 4-inch line and looping the south end of the new main in
Bluff road to Main Street.

F:\WPDATA\Williamsburg\Water\12 WSImp\Reports\PER\Report.doc 53
2. Rockrimmon Road. This 2,150-foot segment of 4-inch dead end piping serves 35
houses at the highest elevations within the town's developed service area. At the
south end of the road, low service pressures occur during elevated demand conditions.
The calculated available fire flow at hydrant 25, at the south end of Rockrimmon, is
only 175 gpm. This line cannot easily be looped back into the town’s distribution
system. The solution to the pressure problem in Rockrimmon, as well as most of the
western half of town, starts with the replacement of the existing 6-inch main extending
from Master Meter No. 1 to Churchill Street with a 10-inch diameter main. The pipeline
in Rockrimmon needs to be replaced with an 8-inch main extending from the
intersection with Churchill Street west to Wilmont Road, then south to Boulder Court
and with a 6-inch main from Boulder Court south to fire hydrant 25.
3. Bear Gulch Road South and Cedar Ridge Road. Similar to Rockrimmon Road, the
customer's served from the water main located in these two roads experience low
service pressures at the southern ends. Calculated available fire flow at hydrant 22 on
Cedar Ridge Road is only 125 gpm. The solution to this low pressure problem includes
looping the ends of these two mains together, as well as the upsizing of the existing
pipelines in Smith Gulch Road and Wilmont Road to 8-inch mains.
The following pressure problem areas were identified by the consultant by modeling the
distribution system to determine available fire flows to existing hydrants. The discussion of
hydrant flows is presented later in this section.
4. Southeast quadrant of town's service area. This area, bounded by Central Avenue on
the north and Quincy Street on the west, serves approximately 20 houses on a dead
end feed from a single point, Master Meter No. 3. Pipe sizes are not known in this area
and are presumed to be 4-inch diameter. The extensive length of piping has the
potential to exhibit stagnant water conditions, negatively impacting water quality. The
solution to enhance service pressures and system flow circulation for water quality
purposes is to loop the dead end pipelines. The north end of Needham Place can be
looped to Scutti Drive near Master Meter No. 2. The north end of Capestrano Drive
can be looped to John Street. Both of these loops require crossing county road
CR13A, Central Avenue.

F:\WPDATA\Williamsburg\Water\12 WSImp\Reports\PER\Report.doc 54
5. Northeast quadrant of town's service area. This area, north of Central Avenue around
Scutti Drive, serves approximately 28 houses from a single point at Master Meter No.
2. The long 4-inch main in Oak Creek Road stops short of looping back to Scutti Drive.
This long dead end main has the potential for stagnant water conditions. Calculated
fire flows at the four hydrants in this area are limited due to the 4-inch main and its
length. The loop in Oak Creek Drive should be completed to provide better circulation
for water quality purposes. The 4-inch main in Scutti Drive from Central Avenue to Oak
Creek Drive needs to be replaced with an 8-inch main to provide adequate pressures
during high demand conditions and to improve fire flows to hydrants in this area.
6. Wilmont Circle area. This is another area served by undersized, unlooped distribution
piping. A single 3-inch line serves approximately 37 houses in this area. Service
pressures are drastically reduced during high demand conditions. Calculated available
fire flows to hydrants 13, 14 and 15 are severely limited due to pipe sizing and non-
looping. As shown on Figure 6, the solution includes a new 4-inch main in Quincy
Street extending from Wilmont Circle east to Churchill Street, looping Wilmont Circle
south to Quincy Street and Churchill Street to North Wilmont Circle. Service pressures
and fire flow at the three existing hydrants in this area are dramatically improved with
these improvements.
7. Ironhorse Road South. This long 4-inch diameter dead end pipeline serves
approximately 11 houses. Calculated available fire flow to hydrant 12 is limited. The
solution consists of either upsizing this line or looping the end west to Robbins Street.
A 6-inch diameter loop to Robbins Street is recommended as it provides better fire flow
to hydrant 12, as well as reinforces service pressures in Robbins Street.
8. Copper Creek Road. Piping in Copper Creek Road consists of parallel 4-inch and 6-
inch pipelines extending west from Master Meter No. 1. The two lines function
independently with the 4-inch serving the Wilmont Circle area and the 6-inch extending
west to serve the entire service area west of Churchill Street, as well as the Robbins
Street-Benton Road area. This 6-inch pipeline serves approximately 176 houses.
Service pressures are significantly reduced during high demand conditions. Available
fire flow calculations for the west half of town found that these two parallel lines, if
connected at the west end, are still undersized. The existing 6-inch main is reported to

F:\WPDATA\Williamsburg\Water\12 WSImp\Reports\PER\Report.doc 55
be problematic with frequent breaks. It is reported to consist of PVC piping with
solvent weld (glued) joints. A single 10-inch line is recommended to replace these two
existing parallel lines.
9. Wilmont Road and Smith Gulch Road. Wilmont Road from Rockrimmon Road to Smith
Gulch Road has a 3-inch pipeline. This line serves approximately 63 houses and 6 fire
hydrants to the west. It is severely undersized. The existing 4-inch line in Smith Gulch
is also undersized to provide sufficient flows to existing hydrants. The solution is to
replace the two small diameter pipelines with 8-inch piping.
The above recommended improvements will dramatically improve service pressures
throughout the distribution system under peak demand conditions, improve water circulation
to mitigate potential stagnant water conditions, and will improve available fire flow rates to
existing and proposed fire hydrants.
The 27 existing fire hydrants within the town’s service area provide fire protection to
buildings and structures. Fire hydrants need to be exercised annually to assure that they
are in good working condition. Within the existing distribution system, available fire flows to
existing hydrants were determined by calculating the pressure loss in the pipelines from the
feed point at the connection to the regional system to the individual hydrant. A 20 psi
minimum residual pressure was maintained at the hydrant in the flow determination. This is
a typical minimum hydrant pressure maintained by a fire pumper truck. Calculated existing
hydrant flow rates range from 125 gpm up to 1,100 gpm, averaging 339 gpm for all 27
hydrants. A distribution system hydraulic model was used to determine available fire flows
to existing hydrants with the proposed distribution system improvements in place. The
resulting increases in flow were significant as shown in the following Table 6. Calculated
fire flow deliveries more than doubled averaging 769 gpm for the existing 27 hydrants. All
but five of the existing hydrants were able to provide the recommended minimum 500 gpm
flow rate. The five existing hydrants that fell short of the 500 gpm level were increased into
the range of 325 to 450 gpm. This is considered acceptable due to the extensive piping
that would be required to marginally improve their flow rates.

F:\WPDATA\Williamsburg\Water\12 WSImp\Reports\PER\Report.doc 56
TABLE 6
TOWN OF WILLIAMSBURG
CALCULATED FIRE HYDRANT FLOWS
Hydrant No. Location Existing
Flow, gpm Improvements
(See List Below) Improved Flow,
gpm
1 John & Central 725 None 725 2 Scutti & Oak Creek 550 A 1500 3 Cory 375 A 525 4 Pinon Ridge - North 325 A, B 600 5 Pinon Ridge & Oak Creek 350 A, B 825 6 Oak Creek - East 275 A, B 950 7 Btwn Capestrano & Needham 325 C, D 700 8 Quale Run - East 225 C, D 375 9 Quale Run - West 225 C, D 675 10 Needham & Central 225 C, D 1500 11 Qunicy & Capistrano 1000 None 1000
11.5 Main - South End 200 E 625 12 Iron Horse - South 425 F, G 875 13 Iron Horse - North 175 F, H, I 625 14 North Wilmont 175 F, H, I 600 15 North Wilmont & Quincy 250 F, H, I 1025 16 Churchill & Copper Creek 1100 F 1500 17 Linda Vista & Wilmont 175 F, J 575 18 Smith Gulch & Wilmont 175 F, J, K 1050 19 Smith Gulch & Bear Gulch 150 F, J, K 625 20 Bear Gulch South of Sage 175 F, J, K 450 21 Bear Gulch & Sage 150 F, J, K 325 22 Cedar Ridge 125 F, J, K, L 350 23 Rockrimmon & Cobble 600 F 1100 24 Boulder 250 F, M 425 25 Rockrimmon - South 175 F, M, N 550 26 Needham south of Quale Run 250 C, D 675 Maximum, gpm 1100 1500 Minimum, gpm 125 325 Average, gpm 339 769
Recommended Improvements: A - New 8" in Scutti - Central to Oak Creek H -Loop Wilmont/Quincy/Churchill B - Loop Oak Creek to Scutti I - New 4" in Quincy - Churchill to Wilmont East C - Loop Needham to Scutti J - New 8" in Wilmont - Rockrimmon to Smith Gulch D - Loop Capestrano to John K - New 8" in Smith Gulch - Wilmont to Bear Gulch E - New 4" in Bluff L - Loop to Bear Gulch to Cedar Ridge F - New 10" in Copper Creek - M - New 8" in Rockrimmon - Churchill to Boulder Master Meter No. 1 to Churchill N - New 6" in Rockrimmon - Boulder south G - Loop Iron Horse to Robbins

F:\WPDATA\Williamsburg\Water\12 WSImp\Reports\PER\Report.doc 57
Existing fire hydrant locations within the town were reviewed for coverage area. The review
was based on a coverage area having a 300-foot radius from the hydrant location. This is a
typical coverage distance which is based on a maximum reasonable fire hose laying length.
When 600-foot diameter circles are drawn around each hydrant, the determination was
made that at several locations within the town, adequate fire hydrant coverage is not
available. These gaps in hydrant coverage area were compared to aerial photography of
the town to determine where additional fire hydrants are needed to cover existing
structures.
Several subdivisions are made up of large lots with some of the houses being from 200 to
600 feet back from the roadway. Thus, it is not practical to provide a fire hydrant within 300
feet of all structures because it would require an individual hydrant for many houses. In
consideration of existing house spacing and setbacks, the criteria used to determine the
recommendation for a new hydrant was expanded to a 400-foot radius from a hydrant.
Also, a new hydrant is not recommended for a single structure lying outside of the 400-foot
radius criteria. As a result, 16 new fire hydrants are recommended to be installed in the
areas containing existing structures to fill the gaps in the existing fire protection coverage
area. These 16 proposed new fire hydrant locations are shown on Figure 6 in the back of
this report. Most of the recommended new hydrants are provided with sufficient fire flow
rates with the proposed distribution system improvements previously recommended to
address pressure and circulation problems. Five of the recommended new hydrants,
however, require short new pipeline extensions or upsizing of existing small diameter
piping. The recommended new fire hydrants are listed in the following Table 7.

F:\WPDATA\Williamsburg\Water\12 WSImp\Reports\PER\Report.doc 58
TABLE 7
TOWN OF WILLIAMSBURG
RECOMMENDED NEW FIRE HYDRANT LOCATIONS/FLOWS
Hydrant Location Improved Flow, gpm
101 Cory Ln. - North end 400 102 Not Used 103 Central Ave. & Scutti Dr. 1500 1) 104 Central Ave. & Pikeview Ave. 825 1) 105 Copper Creek Rd. & Santa Fe Ave. 1500 106 North Wilmont Cir & Churchill St. 850 107 Cobble Ct. 600 1) 108 Rockrimmon Rd. - North of Boulder Ct. 950 109 Rockrimmon Rd. - South of Boulder Ct. 700 110 Cedar Ridge Rd.- South of Smith Gulch 500 111 Bear Gulch Rd. South 900 1) 112 Bluff Rd. & Main St. 1500 113 Robbins St. 925 114 Ridgway Ct. 450 115 Linda Vista 450 116 Wilmont Rd. - South of Smith Gulch 1150 117 Sage Ct. 350 1)
1) Requires short new pipeline or upsize of existing pipeline.
D. METERS
The four master meters associated with the town’s treated water supply are read and
recorded to track total treated water provided to the town. Treated water flow data is read
and recorded by the City of Florence and used for monthly billings of treated water
provided. These meters are considered to be in good operating condition.
In accordance with the regional water system agreement for service, the regional water
system has requested that the town reduce the number of master meter service points from
the existing four meters to one meter. This requires tying the segmented service areas of
the town together. A review of the magnitude of water delivered through each master meter
was made. Their locations are shown on Figure 5 located in the back of this report. Over
the last two years, Master Meter No. 1 provided 46% of the total delivered flow while Master
Meter Nos. 2, 3 and 4 provided 14%, 5% and 35%, respectively. The logical approach is to
maintain the regional system connection at Master Meter No. 1, eliminating Master Meter

F:\WPDATA\Williamsburg\Water\12 WSImp\Reports\PER\Report.doc 59
Nos. 2, 3 and 4. Distribution system piping improvements that would provide for the
elimination of the additional master meters would be required. An 8-inch diameter main
extending east from Master Meter No. 1 in Central Avenue to Scutti Drive would allow for
decommissioning Master Meter No. 2. To the south, decommissioning of Master Meter No.
4 requires an 8-inch main extending in Quincy Street from Master Meter No. 1 to Master
Meter No. 2. This line would continue south in Quincy Street to Capistrano Drive in order to
eliminate Master Meter No. 3. The Regional Water System is requiring backflow prevention
devices on connections to the Regional System's transmission mains. A double check
valve assembly is appropriate for such an application. This will require the replacement of
the Master Meter No. 1 vault as space is not available in the existing vault. Reducing the
master meter connections with the regional system to a single point will simplify the meter
reading of the water delivered to the town; however, a single delivery point creates a certain
vulnerability, especially with no distribution system storage available within the town. If the
master meter were to fail or need to be taken out of service, the town would be out of water.
Therefore, the consultant recommends maintaining the connection at Master Meter No. 4 in
place for use as a backup connection point for emergency use. The meter in this vault
would be removed, but could be re-installed under an emergency backup condition.
All of the town’s water customers are metered for individual water use. New meters were
installed throughout the distribution system in 2006 and 2007. The metering system is an
automatic reading and billing system whereby meters are read using a hand held touch
read receiver followed by downloading the meter data into the town’s billing software. This
new meter system greatly enhances the efficiency of the town's meter reading activities.
Currently, the town’s metering system is considered to be in good operating condition.

F:\WPDATA\Williamsburg\Water\12 WSImp\Reports\PER\Report.doc 60
SECTION VII
EXISTING FINANCIAL STATUS OF THE WATER FUND
The Town of Williamsburg adopts a formal budget for each fiscal year for its operating funds,
including the general fund, the roads and highways fund, conservation trust fund and the water
fund. An annual audit of the town’s financial statements is not conducted. An annual audit
exemption is filed each year with the state. Such is allowed by Colorado law for communities
having an annual budget of less than $500,000 if the audit exemption is compiled by an
independent accountant. It is not known when the last formal audit was conducted for the Town
of Williamsburg. The town’s fiscal year runs concurrent with the calendar year.
From the data available within the town’s audit exemption filings and budgets, an assessment
with respect to water fund related revenues and expenditures has been made. These financial
statements provide general data which is sufficient to evaluate the financial health of the water
fund. Annual financial data of the town’s water fund has been provided by the town in the form
of the 2008 to 2011 audit exemptions and the 2009, 2011 and 2013 budgets. The budgets also
include the estimated revenues and expenditures for the previous year and the actual revenues
and expenditures for two years previous to the budget.
The town assesses monthly water charges to all water connections to the system, whether
active or not, excluding three town related connections. The primary source of water utility
revenue is generated from charges assessed for water sales. The town’s current water rate
schedule is summarized in the following table:
TABLE 8
TOWN OF WILLIAMSBURG
WATER RATES
Rate Description Monthly Charge
Base Rate $49.00 for zero to first 5,000 gallons
Surcharge Use Rate $3.50 per 1,000 gallons above 5,000 gallons
1) Rates imposed on town declared emergency.

F:\WPDATA\Williamsburg\Water\12 WSImp\Reports\PER\Report.doc 61
The above water rates were last adjusted in August 2011. The town’s tap fee schedule for a
new ¾” water service is $5,600 for in-town service. Outside town limit tap fees are two times
the in-town fee. In addition, a new service is also charged a $25 application fee and a $3,000
system development fee. No new taps appear to have been issued since the implementation of
the year 2000 water tap moratorium, even though the ability to issue 12 new taps was approved
in 2011. From the town’s water tap fee, 51% of the fee is conveyed to the regional water
system’s capital improvements fund. All existing taps are ¾” in size. The exception is the 2” tap
to the town park which is seldom used due to the system pressure problems that its use causes.
The tap fee is for access to the distribution system. The customer must pay the town $1,000 for
the installation cost of the service from the main up to and including the meter and meter pit.
The customer is then responsible to extend the new service from the meter to the building. The
town clerk issues monthly billings for water service.
The town assesses a property tax mil levy. The mil levy for 2012 was 2.239 mils. The
assessed valuation of the town in 2012 was $3,028,209. Thus, the general property tax
revenue for 2012 to be collected in 2013 is estimated to total $6,777. Property tax revenues are
channeled into the general fund and are not used within the water fund.
Article X, Section 20 of the Colorado Constitution, commonly known as the Taxpayer’s Bill of
Rights (TABOR) establishes, taxing, spending, revenue and debt limitations for the State of
Colorado and all local governments, including enterprise funds, which are defined as
government owned businesses. Revenues received which are in excess of the fiscal year’s
spending limits must be refunded. This limits the ability of an enterprise fund to receive state
tax generated grant funds. The town has not introduced a proposed ballot measure to override
the revenue limitations of TABOR. Thus, the town is not currently authorized by its constituents
to accept state grant funds generated from state taxes for the purpose of conducting water
system improvements. This ballot measure action needs to be undertaken by the town and
approved by the residents of Williamsburg to provide the town with greater flexibility in securing
funding for the water system improvements recommended within this report.
In order to assess the overall financial health of the water fund, revenues and expenditures
within the fund were reviewed. The following table is a summary of the water fund revenues.
The fiscal data presented reflects reported revenues as presented in the 2008 and 2010 audit
exemptions. Revenues presented in the 2011 and 2013 budgets indicate actual revenues for
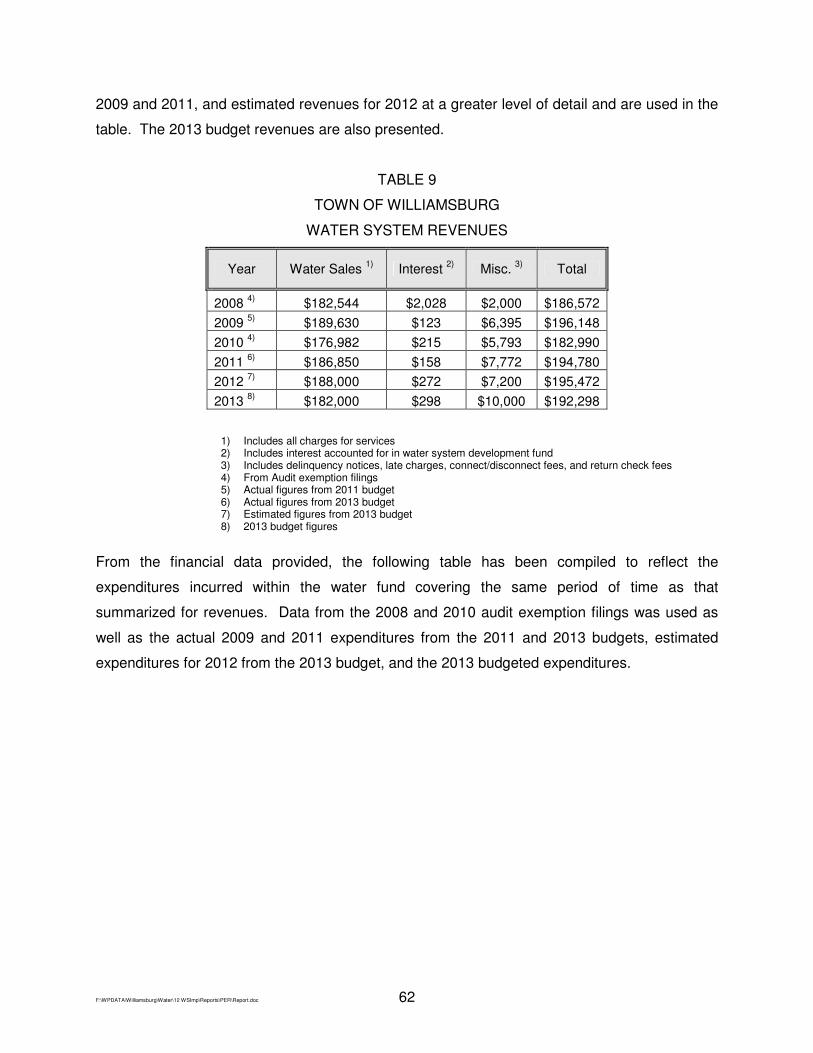
F:\WPDATA\Williamsburg\Water\12 WSImp\Reports\PER\Report.doc 62
2009 and 2011, and estimated revenues for 2012 at a greater level of detail and are used in the
table. The 2013 budget revenues are also presented.
TABLE 9
TOWN OF WILLIAMSBURG
WATER SYSTEM REVENUES
Year Water Sales 1) Interest 2) Misc. 3) Total
2008 4) $182,544 $2,028 $2,000 $186,572 2009 5) $189,630 $123 $6,395 $196,148 2010 4) $176,982 $215 $5,793 $182,990 2011 6) $186,850 $158 $7,772 $194,780 2012 7) $188,000 $272 $7,200 $195,472 2013 8) $182,000 $298 $10,000 $192,298
1) Includes all charges for services 2) Includes interest accounted for in water system development fund 3) Includes delinquency notices, late charges, connect/disconnect fees, and return check fees 4) From Audit exemption filings 5) Actual figures from 2011 budget 6) Actual figures from 2013 budget 7) Estimated figures from 2013 budget 8) 2013 budget figures
From the financial data provided, the following table has been compiled to reflect the
expenditures incurred within the water fund covering the same period of time as that
summarized for revenues. Data from the 2008 and 2010 audit exemption filings was used as
well as the actual 2009 and 2011 expenditures from the 2011 and 2013 budgets, estimated
expenditures for 2012 from the 2013 budget, and the 2013 budgeted expenditures.

F:\WPDATA\Williamsburg\Water\12 WSImp\Reports\PER\Report.doc 63
TABLE 10
TOWN OF WILLIAMSBURG
WATER SYSTEM EXPENDITURES
Year Admin 1) Water 2)
Purchase Salaries & Benefits
Oper. Maint. & Supplies 3) Meters 9)
Water Share Lease
Total
2008 4) $0 $142,000 $16,501 $19,450 $7,694 - $185,645 2009 5) $8,128 $108,145 $20,578 $8,156 $36,139 $342 $181,488 2010 4) $3,265 $119,152 $28,213 $2,587 $0 - $153,217 2011 6) $4,876 $135,422 $27,481 $2,211 $1,452 $351 $171,793 2012 7) $9,215 $148,489 $34,000 $11,700 $1,452 $351 $205,207 2013 8) $9,310 $138,459 $36,700 $5,500 $1,600 $375 $191,944
1) Administration includes insurance, accounting/legal fees, contract services and general administrative expenditures 2) Payment to regional system for water delivery, treatment, pumping and debt assessment 3) Includes repairs, maintenance, supplies, water testing and utilities 4) From Audit exemption filings 5) Actual figures from 2011 budget 6) Actual figures from 2013 budget 7) Estimated figures from 2013 budget 8) 2013 budget figures 9) Payment for new meters, including 2009 meter program loan payoff
A comparison of annual total revenues and expenditures presented in the above tables shows
revenues exceeding expenditures for the period reviewed with the exception of the year 2012.
The deficit resulted, in part, from the purchase of used truck for the water system. Water sales
revenues have been fairly consistent since 2008. The base water rate was increased in 2008
from $41 to $49 per month. The incremental usage rate per 1,000 gallons over the minimum
was increased in 2011 from $3.00 to $3.50 per 1,000 gallons. The debt expense for the 2006-
2007 meter replacement program was paid off in 2009. Debt payments to the regional water
system for capital improvement projects have been included in the monthly water charges
assessed by the City of Florence and are included under water purchases in the expenditure
table. The Florence assessments represent, on average, 72% or more of the town's total water
system expenditures. Depreciation of the town’s water system is not considered in the annual
audit exemption filings or the annual budgets.
The water system revenue table does not provide information with respect to retained earnings.
The 2011 audit exemption filing indicates that the water fund ended the year with $79,082 in
cash and cash equivalents, plus a total of $101,644 in investment instruments. The investment
instrument amount represents the town's emergency reserve fund collected when the
F:\WPDATA\Williamsburg\Water\12 WSImp\Reports\PER\Report.doc 64
development fees are assessed. These funds are currently tracked as the system development
fund. The 2013 budget indicates that the 2012 year end estimated reserves from the system
development fund plus the water fund cash reserves totaled $160,059. This total does not
reflect an emergency reserve amount.
As presented previously, the town currently serves 273 users. Over the last two years, the town
has had an average of 19 billed customers with zero water usage. These are, however, billed
the minimum monthly water rate. The town also has 7 inactive customers that are not billed.
Three water services are town related accounts that are not billed. Consequently there are 263
billable accounts. Revenues in 2013 for water sales as listed in the above table are projected to
be $182,000 in total billed water sales. Thus, the average monthly water bill for 2013 is
projected to be $57.67 taking into account the 263 billable users. Water fund expenses in 2013
are projected to total $191,944. Given the total of 263 billed users and prorating the 2013
budgeted annual operating costs to a monthly operating cost, results in an average monthly cost
of $60.82 per billable user per month to cover: basic operations and maintenance;
administrative expenses; and the regional water system charges for water delivery; treatment;
pumping and the regional system's debt service.
As previously discussed, the recommended water system improvements consist of replacing
known problem areas and addressing water delivery problem areas rather than a wholesale
replacement of the entire water system. Therefore, some existing pipelines that were installed
with substandard construction methods would be expected to still exist in the system and would
likely fail in the future, requiring repair. The town's system development fund currently stands at
approximately $101,644. These funds are available as an emergency reserve. This fund
should be maintained at a minimum of $40,000. The 2012 year end water fund reserves totaled
approximately $68,151 as indicated in the 2013 budget. With the system development fund
maintaining a minimum of $40,000 as an emergency reserve, this would indicate that the town
has approximately $100,000 available as a local cash participation toward the costs associated
with the implementation of the improvements recommended within this study.

F:\WPDATA\Williamsburg\Water\12 WSImp\Reports\PER\Report.doc 65
SECTION VIII
WATER SYSTEM NEEDS AND RECOMMENDED IMPROVEMENTS
The physical components of the Town of Williamsburg's water system have been evaluated
within this report. The identified needs are primarily related to the sizing and configuration of
the existing distribution system. The 2000 water tap moratorium has been resolved by
converting and adjudicating town held water rights. The town is now in compliance with the
regional water system agreement to provide sufficient water rights to cover the water supplied to
the town. Additional rights are also being sought for conversion in Water Court to allow for town
growth above the current limit of 12 additional taps over the existing number of taps.
Typically water system improvements are prioritized into the categories of protection of public
health, public safety, system reliability, and operations and maintenance. The identified
deficiencies of the town's water distribution system stem primarily from substandard design and
construction. The existing system’s piping is undersized, poorly installed in areas, and not
looped. An insufficient number of fire hydrants and line valves have also been identified. These
deficiencies and necessary improvements generally fall into the categories of system reliability
and public safety. Currently low service pressures under high demand or fire flow conditions
make the town's distribution system vulnerable to cross connection contamination. This
vulnerability has been addressed, in part, within the town's meter replacement project which
included the installation of double check valves in the new meter yokes. However, the cross-
connection vulnerability remains a concern from potential pipe break conditions. Thus, the
recommended improvements to enhance system pressures can also be categorized as a public
health protection improvement.
As previously indicated, the suggestion has been made that the town's entire distribution system
be replaced. This approach, however, would likely result with the replacement of a sizable
percentage of the system that would be considered in good serviceable condition and would
border on cost prohibitive. The approach taken in the assessment of the needed water system
improvements is to: start with the existing piping system and address the deficiencies of
specific problematic piping segments; followed by addressing pressure problem areas; then
enhancing fire protection coverage; adding system valving; and finally tying the fragmented
sections of the distribution system together and eliminating the multiple regional system feed
points. This is considered to be the most cost effective approach to upgrading the town's water

F:\WPDATA\Williamsburg\Water\12 WSImp\Reports\PER\Report.doc 66
system. Within this approach, continued, yet less frequent pipe failures should be expected in
the existing piping segments remaining in service. The need for an emergency reserve fund to
address this anticipated maintenance issue is discussed in the financial section of this report.
System components of water supply, treatment, transmission and storage are owned and
operated by the regional water system and are considered to be in good operating condition.
Infilling growth within the community will be accommodated by the existing water system's
components. Any potential new development occurring either inside or outside of the town
boundaries where a water system extension would be required, should be undertaken on the
basis of the developer constructing the needed system water extensions per industry standards
at the developer's expense. The town should provide adequate criteria for the design, material
and installation requirements for any system extensions. All aspects of an extension should be
subject to the town’s review and approval. The town needs to develop and adopt water system
design and construction standards. Upon completion of new, developer installed water system
facilities, once acceptable to the town, these new facilities would be dedicated to the town. The
recommended water system improvements presented within this report are not intended for the
purpose of supporting future developments of the town, but are required to enable the town to
provide safe, reliable service pressures and fire protection within its existing service area.
The distribution system's recommended improvements identified in this report have been
grouped into five priorities. The first priority is to address specific problem areas within the
distribution system that are known to be substandard. This category includes only one identified
pipeline segment consisting of the installation of a new 10-inch main extending from Master
Meter No. 1 at the intersection of Quincy Street and Central Avenue extending west across Oak
Creek and continuing west in Copper Creek Road to Churchill Street. This first priority of work
also includes a new meter and meter pit service to the town park.
The second priority of recommended improvements includes 13 new and replacement pipeline
segments necessary to improve system pressures and flow circulation throughout the existing
service area.
The third priority grouping of recommended improvements addresses improving fire flow
deliveries to existing hydrants with five short pipeline segments as well as the installation of 16
new hydrants necessary to provide sufficient fire protection coverage throughout town.

F:\WPDATA\Williamsburg\Water\12 WSImp\Reports\PER\Report.doc 67
The fourth priority grouping includes the addition of four distribution system valves in existing
piping necessary to isolate segments of piping for repair as necessary, a new blow-off at the
east end of Central Avenue for system flushing, and four air vacuum release valves at high
points in the existing piping system. Air vacuum release valves are necessary to prevent air
binding problems within the system.
The fifth priority grouping consists of tying together the fragmented segments of the town's
distribution system and eliminating three of the four regional system's service points and
associated master meters. The remaining service point would be Master Meter No. 1. This
meter vault will need to be replaced to accommodate the backflow prevention device required
by the Regional System. The consultant recommends that Master Meter No. 4 be taken offline
by removing the meter, but remain serviceable for emergency use if Master Meter No. 1 fails or
needs to be taken out of service for repair.
The following table presents the project cost estimates for these five priorities of recommended
improvements. Each has been costed as if it was a freestanding project. Detailed pipeline cost
estimates are presented in Appendix A in the back of this report.
TABLE 11
TOWN OF WILLIAMSBURG
PRIORITY ONE IMPROVEMENTS - REPLACE PROBLEM AREAS
Item Location Description 1) Total Cost
a. Copper Creek Rd. - MM#1 to Churchill New 10" Piping $124,450 Subtotal preliminary cost $124,450 Project contingencies @ 15% 18,668 Engineering design/contract administration 15,315 Construction observation based on 45 calendar days (stand alone project) 33,000
Other Engineering 2) 56,000 Administrative expenses (Advertising, Legal Counsel, Bond Counsel, Audit) (stand alone) 11,000 Priority One - Total preliminary construction cost estimate $258,433
1) Refer to Appendix A in the back of this report for detailed construction cost estimate. 2) Other engineering costs include: Easement/right-of-way evaluations, geotechnical investigation
including borings, Environmental Report, reproduction, CDBG funding, Drinking Water Revolving Fund funding, Advance Planning grant, CDPHE approvals, Technical Managerial Financial Capacity Assessment and Permits.

F:\WPDATA\Williamsburg\Water\12 WSImp\Reports\PER\Report.doc 68
TABLE 12
TOWN OF WILLIAMSBURG
PRIORITY TWO IMPROVEMENTS - UPGRADE LOW PRESSURE AREAS
Item Location Description 1) Total Cost
a. Scutti Dr. - Central to Oak Creek New 8" Piping $45,300 b. Oak Creek - Loop to Scutti New 4" Piping $8,720 c. Needham Pl. - Loop to Scutti New 6" Piping $37,940 d. Capestrano Dr. - Loop to John New 6" Piping $29,300 e. Bluff Rd. New 4" Piping $54,280 f. Iron Horse South - Loop to Robbins New 6" Piping $30,100 g. Churchill - Loop to North Wilmont Cir. New 4" Piping $24,780 h. Quincy St. - Churchill to Wilmont Cir east New 4" Piping $62,180 i. Rockrimmon - Churchill to Wilmont Rd. New 10" Piping $65,660 j. Wilmont Rd. - Rockrimmon to Smith Gulch New 8" Piping $63,720 k. Smith Gulch Rd. - Wilmont to Bear Gulch New 8" Piping $71,690 l. Rockrimmon Rd. - Wilmont to south end New 8" and 6" Piping $113,230
m. Cedar Ridge Rd. - Loop to Bear Gulch New 4" Piping $24,080 Subtotal preliminary cost $630,980 Project contingencies @ 15% 94,647 Engineering design/contract administration 56,600 Construction observation based on 120 calendar days (stand alone project) 88,000 Other Engineering 2) 68,000 Administrative expenses (Advertising, Legal Counsel, Bond Counsel, etc.) (stand alone) 13,000 Priority Two - Total preliminary construction cost estimate $951,227
1) Refer to Appendix A in the back of this report for detailed construction cost estimates. 2) Other engineering costs include: Easement/right-of-way evaluations, geotechnical investigation
including borings, Environmental Report, reproduction, CDBG funding, Drinking Water Revolving Fund funding, Advance Planning grant, CDPHE approvals, Technical Managerial Financial Capacity Assessment and Permits.

F:\WPDATA\Williamsburg\Water\12 WSImp\Reports\PER\Report.doc 69
TABLE 13
TOWN OF WILLIAMSBURG
PRIORITY THREE IMPROVEMENTS - ADDITIONAL FIRE HYDRANTS/LINE WORK
Item Location Description 1) Total Cost
a. Cory Ln. - North end New Hydrant $4,000 b. Central Ave. & Scutti Dr. New Hydrant and Piping $33,831 c. Central Ave. & Pikeview Ave. New Hydrant and Piping $24,936 d. Copper Creek Rd. & Santa Fe Ave. Hydrant included in Priority 1 $0 e. North Wilmont Cir & Churchill St. Hydrant included in Priority 2 $0 f. Cobble Ct. New Hydrant and Piping $25,100 g. Rockrimmon Rd. - North of Boulder Ct. Hydrant included in Priority 2 $0 h. Rockrimmon Rd. - South of Boulder Ct. Hydrant included in Priority 2 $0 i. Cedar Ridge Rd.- South of Smith Gulch New Hydrant $4,000 j. Bear Gulch Rd. South New Hydrant and Piping $21,800 k. Bluff Rd. & Main St. Hydrant included in Priority 2 $0 l. Robbins St. New Hydrant $4,000
m. Ridgway Ct. New Hydrant $4,000 n. Linda Vista New Hydrant $4,000 o. Wilmont Rd. - South of Smith Gulch Hydrant included in Priority 2 $0 p. Sage Ct. New Hydrant and Piping $25,160
Subtotal preliminary cost $150,827 Project contingencies @ 15% 22,624 Engineering design/contract administration 18,340 Construction observation based on 60 calendar days (stand alone project) 44,000 Other Engineering 2) 45,000 Administrative expenses (Advertising, Legal Counsel, Bond Counsel, etc.) (stand alone) 13,000 Priority Three - Total preliminary construction cost estimate $293,791
1) Refer to Appendix A in the back of this report for detailed construction cost estimates. 2) Other engineering costs include: Easement/right-of-way evaluations, Environmental Report,
reproduction, CDBG funding, Drinking Water Revolving Fund funding, Advance Planning grant, CDPHE approvals, Technical Managerial Financial Capacity Assessment and Permits.

F:\WPDATA\Williamsburg\Water\12 WSImp\Reports\PER\Report.doc 70
TABLE 14
TOWN OF WILLIAMSBURG
PRIORITY FOUR IMPROVEMENTS - ADDITIONAL LINE VALVES, BLOW-OFFS AND AIR
VACUUM/RELEASE VALVES
Item Location Description 1) Total Cost
a. Central Ave - east end New Blowoff $2,000 b. Oak Creek Dr. New Line Valve and ARV $6,400 c. Capestrano Dr. New Line Valves $3,200 d. Needham Pl. New ARV $4,800 e. Quincy St. & Central Ave. New Line Valve $1,600 f. Rockrimmon Rd. New ARV $4,800 g. Cobble Ct. New ARV $4,800
Subtotal preliminary cost $27,600 Project contingencies @ 15% 4,140 Engineering design/contract administration 6,350 Construction observation based on 30 calendar days (stand alone project) 22,000
Other Engineering 2) 45,000 Administrative expenses (Advertising, Legal Counsel, Bond Counsel, etc.) (stand alone) 11,000 Priority Four - Total preliminary construction cost estimate $116,090
1) Refer to Appendix A in the back of this report for detailed construction cost estimates. 2) Other engineering costs include: Easement/right-of-way evaluations, geotechnical investigation including
borings, Environmental Report, reproduction, CDBG funding, Drinking Water Revolving Fund funding, Advance Planning grant, CDPHE approvals, Technical Managerial Financial Capacity Assessment and Permits

F:\WPDATA\Williamsburg\Water\12 WSImp\Reports\PER\Report.doc 71
TABLE 15
TOWN OF WILLIAMSBURG
PRIORITY FIVE IMPROVEMENTS - DECOMMISSION MASTER METERS
Item Location Description 1) Total Cost
a.
Remove and replace Master Meter #1 including new vault with double check backflow prevention device $32,000
b. Decommission Master Meter #2 New 8" Pipeline $82,860
Remove meter, vault, and plug piping $6,000 c. Decommission Master Meter #4 New 8" Pipeline $44,560 Remove meter, vault, and plug piping $6,000 d. Decommission Master Meter #3 New 6" Pipeline $127,880 Remove meter, vault, and plug piping $6,000
Subtotal preliminary cost $305,300 Project contingencies @ 15% 45,795 Engineering design/contract administration 32,057 Construction observation based on 45 calendar days (stand alone project) 32,800 Other Engineering 2) 68,000 Administrative expenses (Advertising, Legal Council, Bond Council, etc.) (stand alone) 11,000 Priority Five - Total preliminary construction cost estimate $494,952
1) Refer to Appendix A in the back of this report for detailed construction cost estimates. 2) Other engineering costs include: Easement/right-of-way evaluations, geotechnical investigation including
borings, Environmental Report, reproduction, CDBG funding, Drinking Water Revolving Fund funding, Advance Planning grant, CDPHE approvals, Technical Managerial Financial Capacity Assessment and Permits.
The following is a summary of the total project costs associated with the improvements
recommended herein for the four priorities as freestanding projects.
TABLE 16
TOWN OF WILLIAMSBURG
SUMMARY OF PROJECT COSTS
Description Total Costs
Priority One - Replace Problem Areas $258,433 Priority Two - Upgrade Low Pressure Areas 951,227 Priority Three - Additional Fire Hydrants 293,791 Priority Four - Additional Line Valves, Blowoffs, and Air Release Valves 116,090 Priority Five - Decommission Master Meters 494,952 Grand Total Estimated Project Costs $2,114,492
The total cost for all five priorities undertaken as individual free standing projects is estimated to
be $2,114,492. A combined water project consisting of all priorities represents an opportunity to
F:\WPDATA\Williamsburg\Water\12 WSImp\Reports\PER\Report.doc 72
reduce the overall project cost. Soft cost savings in construction observation, engineering
design, construction administration, other engineering, bond counsel, legal counsel, advertising
and audit expenses are estimated to total approximately $388,625. Thus, the estimated
combined project cost would be $1,725,867. The first four priorities of improvements are
considered to be essential for a reliable and safe water distribution system. The fifth priority is
not necessary to meet these goals, but will provide the town with a whole, freestanding
distribution system that is not reliant on the regional system to deliver water through the town.
Thus, the recommendation is made that consideration be given to conducting all of the
improvements recommended within this report.
Operational and maintenance cost impacts will result with the proposed improvements;
however, the overall impact is expected to be positive. Current activities related to distribution
system repairs will be reduced with the installation of new and replacement piping, and the
resulting more consistent pressures within the entire system.
F:\WPDATA\Williamsburg\Water\12 WSImp\Reports\PER\Report.doc 73
SECTION IX
FINANCIAL IMPACTS OF THE RECOMMENDED IMPROVEMENTS
The recommended water system improvements contained within this study address the water
system needs of the Town of Williamsburg through a comprehensive replacement and
rehabilitation program associated with the town’s water distribution system. Recommended
distribution system improvements have been grouped into five priorities consisting of:
replacement of problem pipeline segments; improvements to upgrade low pressure areas;
additional fire hydrants; system valves; and tying the distribution system together. The first four
priorities of work represent significant deficiencies within the town’s distribution system. The
fifth priority of work, tying the distribution system together and eliminating three of the four
regional system master meters, is highly recommended. The estimated total cost of the five
priorities of construction as freestanding projects is $2,114,492. Due to the duplication of soft
costs, if all priorities were combined into a single project, an estimated savings of $388,625
would be realized, thus reducing the combined project cost to approximately $1,726,000.
The second scenario is that of a project consisting of only the first four priorities of work and
retaining the multiple points of regional system service. These first four priorities of work if
conducted as a single project, realizing the individual priority savings in soft costs, represent an
estimated project cost of $1,394,000.
The CDPHE Drinking Water Construction Grants program historically provided grant funds for
projects listed on the Division’s priority list for water providers serving populations of less than
5,000 people. Financial need is determined by the Department of Local Affairs (DOLA) criteria.
The Town of Williamsburg's water system related needs are included on this eligibility list. Due
to the state’s revenue shortfalls over the past few years, funding for the CDPHE Drinking Water
Construction Grants program has been denied or rescinded by the state legislature. With the
passage of Referendum C in November 2005, this program received $1,500,000 in August of
2006 for use statewide. The program has not been funded by the State Legislature since then.
Funding will not occur within the State's 2012 nor the 2013 fiscal years.
USDA Rural Development has been a program that was utilized frequently in the past; however,
at this point given their 40-year amortization schedule and corresponding interest rates, limited
grant availability, coupled with extensive frontend expenditures, this funding sources has fallen

F:\WPDATA\Williamsburg\Water\12 WSImp\Reports\PER\Report.doc 74
out of favor. As this is considered to be the funding source of last resort, the town would be
much better served pursuing other state related programs.
Several other funding programs exist which have proven recently to be much more attractive to
communities within the implementation of their infrastructure improvement projects. The
following details the other programs.
The State of Colorado in their administration of the Community Development Block Grant
(CDBG) program and the Energy and Mineral Impact Assistance (EMIA) program utilize
different funding guidelines than those of Rural Development. The state does not utilize
average water rates as a firm guideline around which additional debt burden has to be incurred
as does Rural Development. The following highlights the general criteria of the state programs.
The CDBG’s Public Facilities program, based on federal guidelines, requires that more than
51% of the community fall within the low to moderate income category to be eligible for this
funding source. CDBG still uses the 2000 census income data to establish eligibility for this
criteria. Data for the Town of Williamsburg shows that 56.3% of the population base falls within
the low to moderate income category. Based upon the low to moderate income percentage
within the community, the town would qualify for CDBG assistance. Administrative costs for this
source of funding are higher as there are significant regulatory requirements that must be
addressed. CDBG administrative costs have been included in the project cost estimates
presented in this report. A typical CDBG assistance contract under the small cities program on
a project of this nature historically fell in the range of $100,000 to $300,000. The upper limit has
been increased to $600,000. DOLA in their administration of this funding source over the last
few years has established a December 1st application deadline. Thus, this source of funding
represents a viable approach for the town. CDBG assistance does, however, carry Davis-
Bacon wage requirements. These requirements mandate minimum predetermined wages for
various job classifications. The impact of Davis-Bacon wages has been integrated into the cost
estimates prepared for the recommended improvements.
Another DOLA administered program that has been used in the past by the town is DOLA’s
Energy and Mineral Impact Assistance (EMIA) program. This program has loan funds available
at an interest rate of 5% with a 20-year amortization schedule. Grant funds are also available.
Competition for this funding is statewide. Applications run on a cyclical basis. Maximum grant

F:\WPDATA\Williamsburg\Water\12 WSImp\Reports\PER\Report.doc 75
amounts on this form of assistance have been significantly increased beyond the prior $500,000
cap. DOLA has now structured their program such that three tiers of funding levels exist. Tier II
consists of a funding bracket extending from $200,000 to $2,000,000 in requested assistance.
This would be the tier that could potentially be sought by the town. A local match is desired at a
minimum of 25%, preferably 50% of the project's costs unless extenuating circumstances exist.
Administration requirements associated with this funding source are minimal. Given the
magnitude of funds that would be requested, the application would normally be considered
within DOLA's scheduled committee cycle. The recent practice of transferring available funding
within the EMIA program to the State's general fund to cover shortfalls has been discontinued.
The EMIA program is now receiving applications on December 1st, April 1st and August 1st. This
is a viable program for the community to pursue.
Another potential funding source is the use of the Colorado Water Resources and Power
Development Authority's (CWR&PDA) Drinking Water Revolving Fund (DWRF) as a key
component of the funding package, specifically the Disadvantaged Communities Program
(DCP). This was a 3-year pilot program had funds available starting in January 2005. Its
success has resulted in its extension. The program historically provided loan funds only, but in
the recent past, loan forgiveness (grant) funds have also been available through this program.
The next funding cycle has a June 15th submission deadline for the application. Within that
funding cycle, loan forgiveness will be considered. The forthcoming June 15th cycle has limited
loan forgiveness funds available statewide. Given the nature of the improvements proposed for
Williamsburg, the work will fall in a Category Five classification. Given both the limited
availability of loan forgiveness funds coupled with the town's water improvement classification,
no loan forgiveness proceeds will be available. This eliminates the needs to be forced into the
June 15th cycle in which a significant number of applications will occur. Applications are
accepted on a cyclical basis with the forthcoming submission deadline in August.
Two eligibility categories have been established for this program. Category One is for
communities with a population of less than 5,000 with a median household income between
80% and 61% of the Colorado statewide median household income (includes metropolitan
areas). The Colorado Department of Local Affairs staff have changed their methodology on the
determination of median household income. Staff is now taking data secured through the
American Community Survey (ACS) organization for communities within Colorado. The most
recent data, 2011, shows the state median household income level at $57,685. Thus, Category

F:\WPDATA\Williamsburg\Water\12 WSImp\Reports\PER\Report.doc 76
One represents income levels between $46,148 and $35,188. Eligible entities in this category
can obtain 30-year loans for water projects of up to $2,000,000 at 50% of the direct loan rate
which is currently at 2.0%. Thus, 50% of the direct loan rate is 1.0%. Category Two is for
similar size communities with a median household income at or less than $35,188 and offers a
0% loan rate.
American Community Survey data for the Town of Williamsburg documents a year 2011 median
household income of $41,250 with a margin of error of ±$9,012, or 21.85%. Thus, the town
would qualify for the Category One interest rate loan funds of 1.0%. With the income data
margin of error being greater than 20%, the town would be encouraged to conduct an income
survey to determine if Williamsburg could qualify for the Category Two, 0% loan funds.
One of the current criteria established within the loan covenants for this funding source is that
the town’s water rate structure be established such that a minimum of 10% of excess revenues
exist over and above the actual loan payment amount. The unique administrative related costs
with this funding source including bond counsel, local legal counsel, an Environmental Report
and a Technical, Managerial and Financial (TMF) Capacity Assessment have been included
within the project cost estimates. This program historically did not require Davis-Bacon wages.
Given the federal government's administrative changes that occurred in 2008, this program now
requires Davis-Bacon wages. The impact of Davis-Bacon wages has been integrated into the
cost estimates prepared for the project.
The following table has been developed to depict potential funding scenarios for the
implementation of two project scenarios. The scenarios shown are based on a DWRF direct
loan administered by the CWR&PDA at the current loan rate of 1% coupled with an estimated
EMIA grant. DOLA historically has not provided CDBG and EMIA funding on the same project.
The following table provides potential costs for two different project scenarios.

F:\WPDATA\Williamsburg\Water\12 WSImp\Reports\PER\Report.doc 77
TABLE 17
TOWN OF WILLIAMSBURG
RECOMMENDED WATER SYSTEM IMPROVEMENTS
POTENTIAL PROJECT FINANCING SCENARIOS
Component Scenario One (Priorities 1 - 4)
Scenario Two (Priorities 1 - 5)
Project Cost $1,394,000 $1,726,000 CWR&PDA Loan 1) $604,000 $826,000 Local Town Cash Contribution $100,000 $100,000 EMIA Grant 2) $690,000 7) $800,000 7)
Current Average Expense 3) (EDU/mo) $60.82 $60.82 New Debt Service 4) (EDU/mo) $7.41 $10.14 Reserve Requirement 5) (EDU/mo) $0.74 $1.01
Average Monthly Water Bill 6) (EDU/mo) $68.96 $71.97
1) The DWRF DCP loan amount. 2) Estimate of potential grant through the DOLA-EMIA program. 3) Current expense based on 2013 budgeted expenses of $191,944 divided by 12 months and 263 billable
EDUs. 4) A DWRF loan with a 30-year amortization period and a 1% loan rate with an annual payment of $23,404
for Scenario No. 1 and $32,006 for Scenario No. 2. 5) New debt service's mandatory reserve requirement based on 10% of new loan amount. 6) Sum of the three monthly EDU amounts representing the average water bill. 7) An CDBG grant could be pursued which would lower the grant funding from that shown.
The project funding projected in the above table is based on a 1%, 30-year loan by CWR&PDA
for each scenario combined with $100,000 of local cash match and an Energy and Mineral
Impact Assistance grant. The local cash match component of the potential funding package is
shown at $100,000 from the Water System Development Fund and the Water System
Enterprise Fund.
Based on the 2013 budgeted expenses in the water utility, water rates would need to be
increased. The average monthly water bill per EDU is $57.67 per month based on 2013
budgeted sales revenues of $182,000. This average monthly water bill compares with the
average 2010 statewide monthly household water bill of $47.33 as reported by the Colorado
Department of Local Affairs. Thus, under the above scenarios water rate increases of
approximately $11.29 (Scenario No. One with Priorities 1-4) to $14.30 (Scenario No. Two with
Priorities 1-5) per EDU per month would be required to support the new debt burden and
associated reserve. Of note is that the projected rate increases shown above includes $3.15 in
the form of an increase to bring the average monthly income per user per month up to the

F:\WPDATA\Williamsburg\Water\12 WSImp\Reports\PER\Report.doc 78
budgeted expenses per user per month. Thus, with respect to Scenario No. 1, the actual rate
increase required as a result of implementing the project is $8.15, whereas the corresponding
rate increase necessary to implement Scenario No. 2 is $11.15. The resulting average monthly
household water bill would remain above the 2010 statewide average for both scenarios.
The above funding figures are projections only. The actual loan amount will depend upon the
outcome of the discussions held with the funding agency, the funding level at which this agency
is willing to participate in the project, and the amount of loan the town desires to pursue.
Through the use of available funding sources, the project can be made a reality.

F:\WPDATA\Williamsburg\Water\12 WSImp\Reports\PER\Report.doc 79
SECTION X
PLAN OF ACTION A plan of action and schedule has been developed for the water improvements recommended
herein. The following table has been developed based upon the normal progression of a project
of this nature. The table is based on utilizing CWR&PDA loan funds combined with DOLA-EMIA
grant funds and a local cash match.
TABLE 18
PLAN OF ACTION AND IMPLEMENTATION SCHEDULE
Scheduled Event Date
Submit Preliminary Engineering Report to Town May 2013
Submit PER to CDPHE July 2013
Respond to CDPHE PER comments August 2013
Submit CWR&PDA funding application August 2013
Submit DOLA-EMIA grant application August 2013
Obtain CWR&PDA funding commitment October 2013
Obtain DOLA-EMIA funding commitment November 2013
Authorize design preparation December 2013
Submit plans and specifications to CDPHE for review March 2014
Obtain CDPHE approval May 2014
Advertise project for bid May 2014
Bid opening June 2014
Project award June 2014
Initiate construction July 2014
Completion of construction November 2014
The above schedule realistically represents the required timeline for implementation of the
recommended improvements. Significant activity must occur prior to the initiation of design and
construction. This activity focuses on securing the necessary funds together with completing,
submitting to, and obtaining approvals from the CDPHE on various submittals including the
PER, environmental report, and plans and specifications. Time has been allotted in the
schedule for CDPHE's review time for the submittals.

F:\WPDATA\Williamsburg\Water\12 WSImp\Reports\PER\Report.doc 80
This plan of action and schedule is a dynamic activity that will require modifications and
refinements as the project evolves. A delay in one activity will result in subsequent delays in
following activities. Securing adequate funding in a timely manner will be crucial not only to
maintaining the schedule, but ultimately in implementing the needed improvements.

AP
PE
ND
IX A
- C
ON
STR
UC
TIO
N C
OS
T E
STI
MA
TES


