33
Preliminary fourth quarter/Full year report 2017 15 February 2018
Preliminary fourth quarter/Full year report2017
15 February 2018
4Q17 Odfjell Group
2 | P a g e
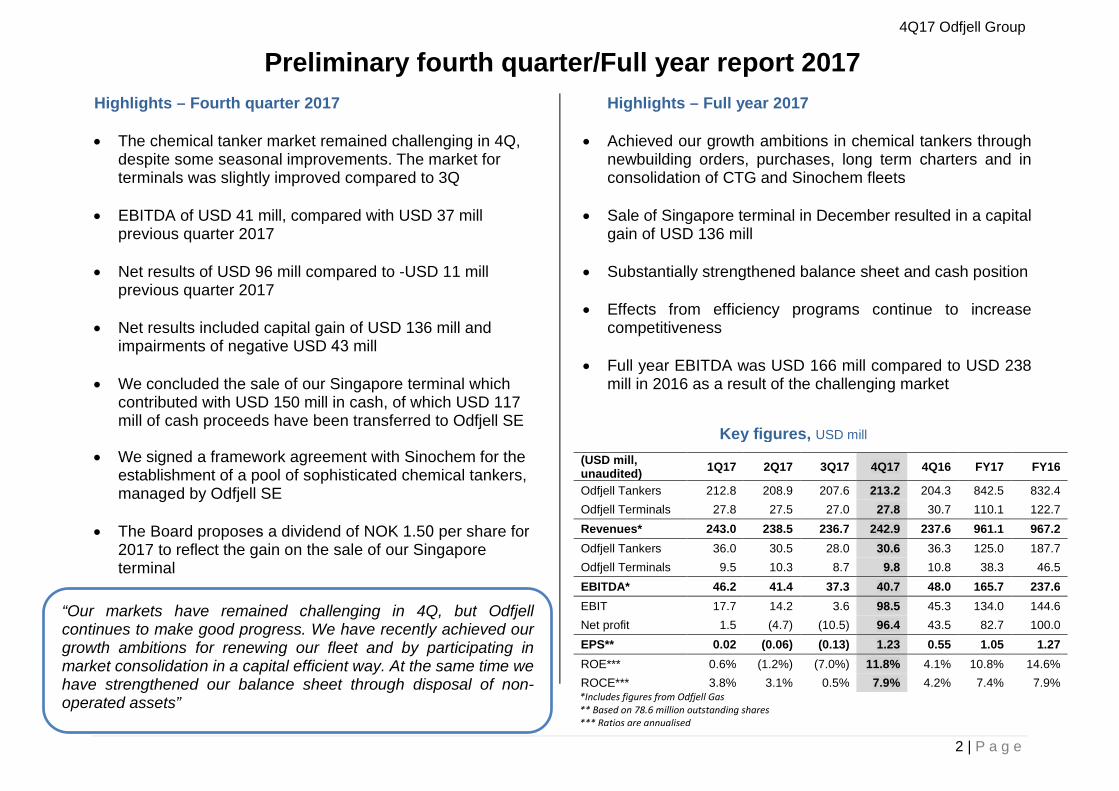
“Our markets have remained challenging in 4Q, but Odfjell continues to make good progress. We have recently achieved our growth ambitions for renewing our fleet and by participating in market consolidation in a capital efficient way. At the same time we have strengthened our balance sheet through disposal of non-operated assets” *Includes figures from Odfjell Gas
** Based on 78.6 million outstanding shares*** Ratios are annualised
Highlights – Fourth quarter 2017
• The chemical tanker market remained challenging in 4Q,despite some seasonal improvements. The market forterminals was slightly improved compared to 3Q
• EBITDA of USD 41 mill, compared with USD 37 millprevious quarter 2017
• Net results of USD 96 mill compared to -USD 11 millprevious quarter 2017
• Net results included capital gain of USD 136 mill and impairments of negative USD 43 mill
• We concluded the sale of our Singapore terminal whichcontributed with USD 150 mill in cash, of which USD 117mill of cash proceeds have been transferred to Odfjell SE
• We signed a framework agreement with Sinochem for theestablishment of a pool of sophisticated chemical tankers,managed by Odfjell SE
• The Board proposes a dividend of NOK 1.50 per share for2017 to reflect the gain on the sale of our Singaporeterminal
Highlights – Full year 2017
• Achieved our growth ambitions in chemical tankers throughnewbuilding orders, purchases, long term charters and inconsolidation of CTG and Sinochem fleets
• Sale of Singapore terminal in December resulted in a capitalgain of USD 136 mill
• Substantially strengthened balance sheet and cash position
• Effects from efficiency programs continue to increasecompetitiveness
• Full year EBITDA was USD 166 mill compared to USD 238mill in 2016 as a result of the challenging market
(USD mill, unaudited) 1Q17 2Q17 3Q17 4Q17 4Q16 FY17 FY16
Odfjell Tankers 212.8 208.9 207.6 213.2 204.3 842.5 832.4 Odfjell Terminals 27.8 27.5 27.0 27.8 30.7 110.1 122.7 Revenues* 243.0 238.5 236.7 242.9 237.6 961.1 967.2 Odfjell Tankers 36.0 30.5 28.0 30.6 36.3 125.0 187.7 Odfjell Terminals 9.5 10.3 8.7 9.8 10.8 38.3 46.5 EBITDA* 46.2 41.4 37.3 40.7 48.0 165.7 237.6 EBIT 17.7 14.2 3.6 98.5 45.3 134.0 144.6 Net profit 1.5 (4.7) (10.5) 96.4 43.5 82.7 100.0 EPS** 0.02 (0.06) (0.13) 1.23 0.55 1.05 1.27 ROE*** 0.6% (1.2%) (7.0%) 11.8% 4.1% 10.8% 14.6% ROCE*** 3.8% 3.1% 0.5% 7.9% 4.2% 7.4% 7.9%
Preliminary fourth quarter/Full year report 2017
Key figures, USD mill
4Q17 Odfjell Group
3 | P a g e
Prospects
• We expect 1Q18 timecharter results to be marginallybetter than 4Q17
• We expect the challenging markets to continue into2018, but we also expect that 2018 will be a turningpoint due to improving fundamentals
• We expect Odfjell Terminals 2018 results to be in linewith results in 2017, however without the contributionfrom the divested Singapore terminal
4Q17 Odfjell Group
4 | P a g e
Proportionate method
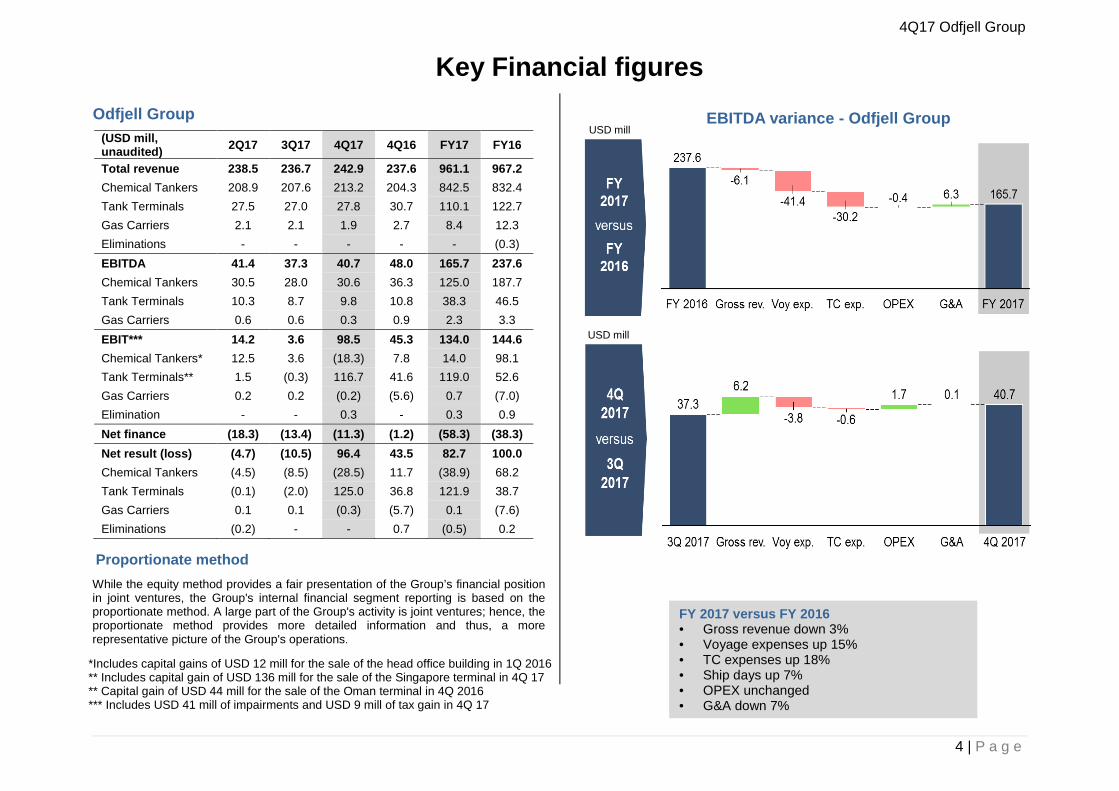
EBITDA variance - Odfjell Group
*Includes capital gains of USD 12 mill for the sale of the head office building in 1Q 2016** Includes capital gain of USD 136 mill for the sale of the Singapore terminal in 4Q 17** Capital gain of USD 44 mill for the sale of the Oman terminal in 4Q 2016*** Includes USD 41 mill of impairments and USD 9 mill of tax gain in 4Q 17
(USD mill, unaudited) 2Q17 3Q17 4Q17 4Q16 FY17 FY16
Total revenue 238.5 236.7 242.9 237.6 961.1 967.2 Chemical Tankers 208.9 207.6 213.2 204.3 842.5 832.4 Tank Terminals 27.5 27.0 27.8 30.7 110.1 122.7 Gas Carriers 2.1 2.1 1.9 2.7 8.4 12.3 Eliminations - - - - - (0.3)EBITDA 41.4 37.3 40.7 48.0 165.7 237.6 Chemical Tankers 30.5 28.0 30.6 36.3 125.0 187.7 Tank Terminals 10.3 8.7 9.8 10.8 38.3 46.5 Gas Carriers 0.6 0.6 0.3 0.9 2.3 3.3 EBIT*** 14.2 3.6 98.5 45.3 134.0 144.6 Chemical Tankers* 12.5 3.6 (18.3) 7.8 14.0 98.1 Tank Terminals** 1.5 (0.3) 116.7 41.6 119.0 52.6 Gas Carriers 0.2 0.2 (0.2) (5.6) 0.7 (7.0) Elimination - - 0.3 - 0.3 0.9 Net finance (18.3) (13.4) (11.3) (1.2) (58.3) (38.3) Net result (loss) (4.7) (10.5) 96.4 43.5 82.7 100.0 Chemical Tankers (4.5) (8.5) (28.5) 11.7 (38.9) 68.2 Tank Terminals (0.1) (2.0) 125.0 36.8 121.9 38.7 Gas Carriers 0.1 0.1 (0.3) (5.7) 0.1 (7.6) Eliminations (0.2) - - 0.7 (0.5) 0.2
Key Financial figures Odfjell Group
While the equity method provides a fair presentation of the Group’s financial position in joint ventures, the Group's internal financial segment reporting is based on the proportionate method. A large part of the Group's activity is joint ventures; hence, the proportionate method provides more detailed information and thus, a more representative picture of the Group's operations.
FY 2017 versus FY 2016 • Gross revenue down 3%• Voyage expenses up 15%• TC expenses up 18%• Ship days up 7%• OPEX unchanged• G&A down 7%
USD mill
USD mill

4Q17 Odfjell Group
5 | P a g e
¹ The Odfix index is a weighted time-charter earnings index for a selection of vessels ² The Opex index includes owned and bareboat chartered vessels 3 Including effect from bunker adjustment clauses
Odfjell Tankers EBITDA improved slightly during 4Q17 relative to 3Q17 despite a continued challenging market. This development was driven by increased gross revenue due to increased trading days and stronger contributions from our regional fleets. This was partly offset by increased voyage expenses and time-charter costs. CoA levels were stable during 4Q and we have managed to renew and grow our CoA portfolio for 2018.
ODFIX was down 5.3% in 4Q17. This was mainly caused by lower revenues on the largest deep sea chemical tankers on top of some spill-over effect from Hurricane Harvey negatively affecting TCE rates on vessels loading in the US Gulf region.
Odfjell Tankers will take delivery of 12 modern and eco-friendly vessels during 1Q 2018 and this is expected to contribute positively to our results in the coming quarters.
Chemical Tankers (USD mill) 2Q17 3Q17 4Q17 4Q16 FY17 FY16
Revenues 208.9 207.6 213.2 204.2 842.5 832.4 Gross Result 47.5 45.3 47.1 54.8 193.1 259.6 EBITDA 30.5 28.0 30.6 36.3 125.0 187.7 EBIT 12.5 3.6 (18.3) 8.4 14.0 98.1 Bunker cost per tonne (USD) ³ 377 383 398 342 387 350
Indices 30.09.17 31.12.17 31.12.16 Odfix (1990=100)¹ 120 113 125 Opex (2002=100)² 122 123 123
Average bunker prices paid were USD 347 per tonne in fourth quarter, up from USD 334 per tonne the previous quarter.
We have 64% of our bunker exposure covered through bunker adjustment clauses and we do not have any remaining financial hedging for bunkers
Outlook 1Q18 We expect 1Q18 timecharter results to be marginally better than 4Q17.
EBITDA variance – Chemical tankers
Chemical Tankers
USD mill

4Q17 Odfjell Group
6 | P a g e
Framework agreement with Sinochem Odfjell SE signed a framework agreement with Sinochem Shipping in November whereby Odfjell will take 4 x 40,900 dwt chemical tankers on long-term bareboat charters. Odfjell holds purchase options for the vessels. These vessels will together with Sinochem’s own 4x 40,900 dwt vessels form a pool of 8 x 40,900 dwt sophisticated chemical tankers managed exclusively by Odfjell SE.
These vessels will replace a large part of our maturing chartered-in fleet with modern and more efficient tonnage, which is expected to contribute positively to Odfjell results due to lower bunker consumption and lower timecharter-in cost for Odfjell SE.
The transaction is subject to satisfactory completion of competition law assessment and customary closing conditions.
Odfjell SE volume and voyage days Odfjell SE carried 2.9 million tonnes during 4Q which was largely in line with 3Q volumes. Volume development into 4Q was slightly impacted by Hurricane Harvey with repositioning and fixture activity in end-3Q having a spill-over effect into 4Q. Total voyage days in 4Q was 6,961 days of which 149 off-hire days, this was an increase from 6,788 days from the previous quarter with 154 off-hire days.
Fleet growth programme Odfjell SE did not take delivery of any new vessels associated with the newbuilding programme in 4Q. Three vessels on timecharter were redelivered to its owners.
The four vessels on bareboat charters from Sinochem are expected to be delivered during 2018 once the transaction is completed. In the meantime the vessels will be on commercial management with Odfjell SE.
Yard Tanks DWT 2017 2018 2019 2020 Hudong Stainless 49,000 - - 3 3 AVIC Stainless 25,000 2 3 - - Shin-Kurush Stainless 35,500 - 1 1 - Undisclosed Stainless 36,000 - - 1 1 Sinochem* - 4 - - Total 2 8 5 4
Large super segregator fleet by owner and age
* Subject to satisfactory completion of competition law assessment and customary closingconditions

4Q17 Odfjell Group
7 | P a g e
Source: Odfjell SE
Market development The chemical tanker market improved in the second half of 4Q driven by seasonally stronger demand for chemicals and also a Benzene arbitrage contributing to a tighter market on traditional back-haul routes from Asia to US and Europe. A somewhat stronger product tanker market driven by increased refinery utilisation from Hurricane Harvey also eased competition for cargoes.
The global deep-sea fleet based on vessels larger than 18,000 dwt grew by 22 vessels in 4Q as 29 vessels were delivered and 7 vessels were scrapped. The slippage of deliveries into 2018 also helped contribute to slightly less competition than expected during the quarter.
Market outlook The chemical tanker market is expected to remain challenging in the coming quarters before gradually picking up towards the end of 2018. Volume demand is expected to outpace supply growth in 2018 before an expected recovery could gain pace from 2019. We further believe that tonne-mile demand will outgrow fundamental volume demand.
Key drivers expected to support demand is large expansions of export oriented chemical plants in the US and Middle East for various liquid chemicals starting from 2018 and peaking in 2019. Further support to seaborne chemical tanker trade is expected to be driven by shutdown of small, inefficient and pollutive chemical plants in China, as a part of its environmental policies, and expected strong global GDP growth.
Chemical tanker demand and supply outlook
4Q17 Odfjell Group
8 | P a g e
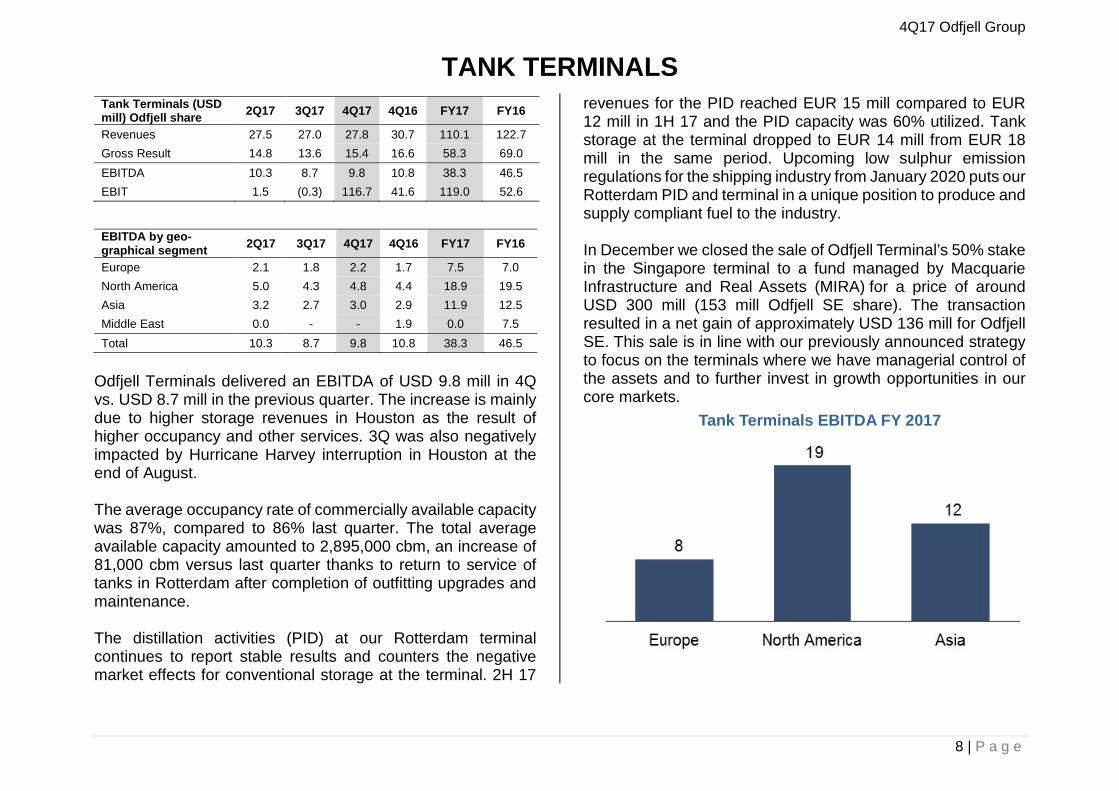
Tank Terminals EBITDA FY 2017
Odfjell Terminals delivered an EBITDA of USD 9.8 mill in 4Q vs. USD 8.7 mill in the previous quarter. The increase is mainly due to higher storage revenues in Houston as the result of higher occupancy and other services. 3Q was also negatively impacted by Hurricane Harvey interruption in Houston at the end of August.
The average occupancy rate of commercially available capacity was 87%, compared to 86% last quarter. The total average available capacity amounted to 2,895,000 cbm, an increase of 81,000 cbm versus last quarter thanks to return to service of tanks in Rotterdam after completion of outfitting upgrades and maintenance.
The distillation activities (PID) at our Rotterdam terminal continues to report stable results and counters the negative market effects for conventional storage at the terminal. 2H 17
revenues for the PID reached EUR 15 mill compared to EUR 12 mill in 1H 17 and the PID capacity was 60% utilized. Tank storage at the terminal dropped to EUR 14 mill from EUR 18 mill in the same period. Upcoming low sulphur emission regulations for the shipping industry from January 2020 puts our Rotterdam PID and terminal in a unique position to produce and supply compliant fuel to the industry.
In December we closed the sale of Odfjell Terminal’s 50% stake in the Singapore terminal to a fund managed by Macquarie Infrastructure and Real Assets (MIRA) for a price of around USD 300 mill (153 mill Odfjell SE share). The transaction resulted in a net gain of approximately USD 136 mill for Odfjell SE. This sale is in line with our previously announced strategy to focus on the terminals where we have managerial control of the assets and to further invest in growth opportunities in our core markets.
Tank Terminals (USD mill) Odfjell share 2Q17 3Q17 4Q17 4Q16 FY17 FY16
Revenues 27.5 27.0 27.8 30.7 110.1 122.7 Gross Result 14.8 13.6 15.4 16.6 58.3 69.0 EBITDA 10.3 8.7 9.8 10.8 38.3 46.5 EBIT 1.5 (0.3) 116.7 41.6 119.0 52.6
EBITDA by geo-graphical segment 2Q17 3Q17 4Q17 4Q16 FY17 FY16
Europe 2.1 1.8 2.2 1.7 7.5 7.0 North America 5.0 4.3 4.8 4.4 18.9 19.5 Asia 3.2 2.7 3.0 2.9 11.9 12.5 Middle East 0.0 - - 1.9 0.0 7.5 Total 10.3 8.7 9.8 10.8 38.3 46.5
TANK TERMINALS

4Q17 Odfjell Group
9 | P a g e
Gas Carriers We have launched a process to sell our remaining gas carriers and the vessels are classified as assets held for sale
Gas Carriers (USD mill) Odfjell share 2Q17 3Q17 4Q17 4Q16 FY17 FY16
Revenues 2.1 2.1 1.9 2.7 8.4 12.3 Gross Result 0.6 0.7 1.0 1.1 4.7 3.6 EBITDA 0.6 0.6 0.3 0.9 2.3 3.3 EBIT 0.2 0.2 (0.2) (5.6) 0.7 (7.0)
4Q17 Odfjell Group
10 | P a g e
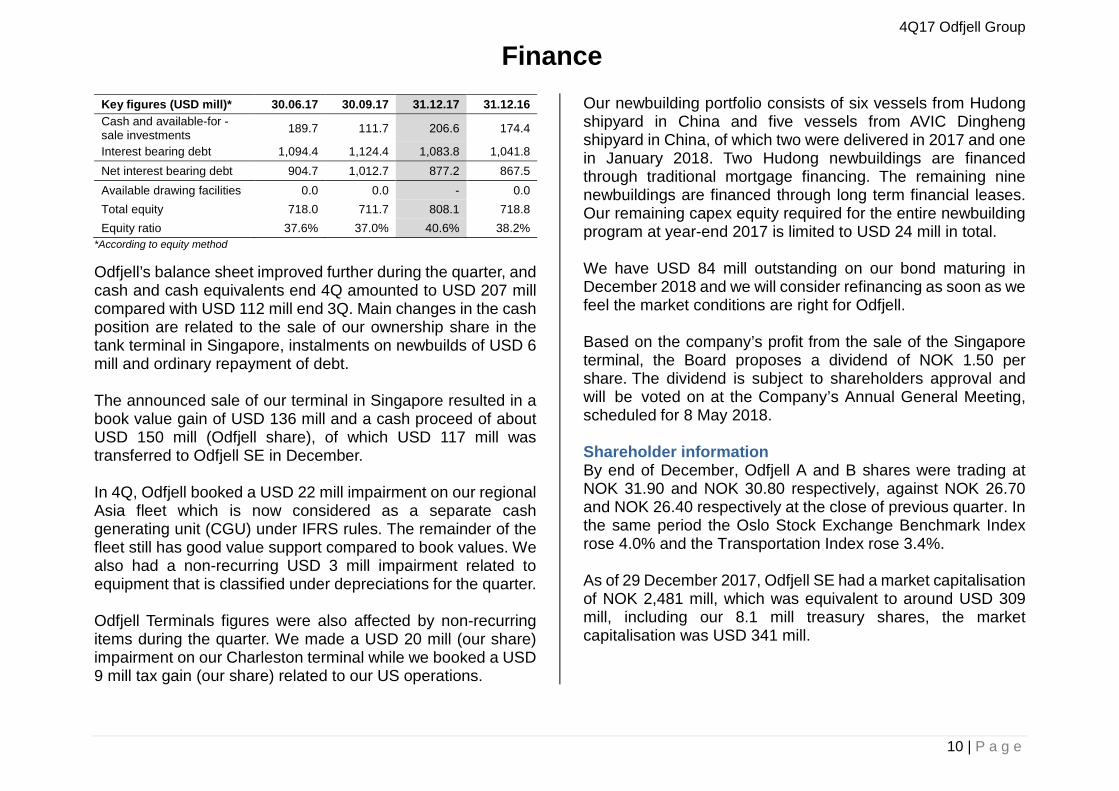
*According to equity method
Odfjell’s balance sheet improved further during the quarter, and cash and cash equivalents end 4Q amounted to USD 207 mill compared with USD 112 mill end 3Q. Main changes in the cash position are related to the sale of our ownership share in the tank terminal in Singapore, instalments on newbuilds of USD 6 mill and ordinary repayment of debt.
The announced sale of our terminal in Singapore resulted in a book value gain of USD 136 mill and a cash proceed of about USD 150 mill (Odfjell share), of which USD 117 mill was transferred to Odfjell SE in December.
In 4Q, Odfjell booked a USD 22 mill impairment on our regional Asia fleet which is now considered as a separate cash generating unit (CGU) under IFRS rules. The remainder of the fleet still has good value support compared to book values. We also had a non-recurring USD 3 mill impairment related to equipment that is classified under depreciations for the quarter.
Odfjell Terminals figures were also affected by non-recurring items during the quarter. We made a USD 20 mill (our share) impairment on our Charleston terminal while we booked a USD 9 mill tax gain (our share) related to our US operations.
Our newbuilding portfolio consists of six vessels from Hudong shipyard in China and five vessels from AVIC Dingheng shipyard in China, of which two were delivered in 2017 and one in January 2018. Two Hudong newbuildings are financed through traditional mortgage financing. The remaining nine newbuildings are financed through long term financial leases. Our remaining capex equity required for the entire newbuilding program at year-end 2017 is limited to USD 24 mill in total.
We have USD 84 mill outstanding on our bond maturing in December 2018 and we will consider refinancing as soon as we feel the market conditions are right for Odfjell.
Based on the company’s profit from the sale of the Singapore terminal, the Board proposes a dividend of NOK 1.50 per share. The dividend is subject to shareholders approval and will be voted on at the Company’s Annual General Meeting, scheduled for 8 May 2018.
Shareholder information By end of December, Odfjell A and B shares were trading at NOK 31.90 and NOK 30.80 respectively, against NOK 26.70 and NOK 26.40 respectively at the close of previous quarter. In the same period the Oslo Stock Exchange Benchmark Index rose 4.0% and the Transportation Index rose 3.4%.
As of 29 December 2017, Odfjell SE had a market capitalisation of NOK 2,481 mill, which was equivalent to around USD 309 mill, including our 8.1 mill treasury shares, the market capitalisation was USD 341 mill.
Key figures (USD mill)* 30.06.17 30.09.17 31.12.17 31.12.16 Cash and available-for -sale investments 189.7 111.7 206.6 174.4
Interest bearing debt 1,094.4 1,124.4 1,083.8 1,041.8 Net interest bearing debt 904.7 1,012.7 877.2 867.5 Available drawing facilities 0.0 0.0 - 0.0Total equity 718.0 711.7 808.1 718.8Equity ratio 37.6% 37.0% 40.6% 38.2%
Finance
4Q17 Odfjell Group
11 | P a g e
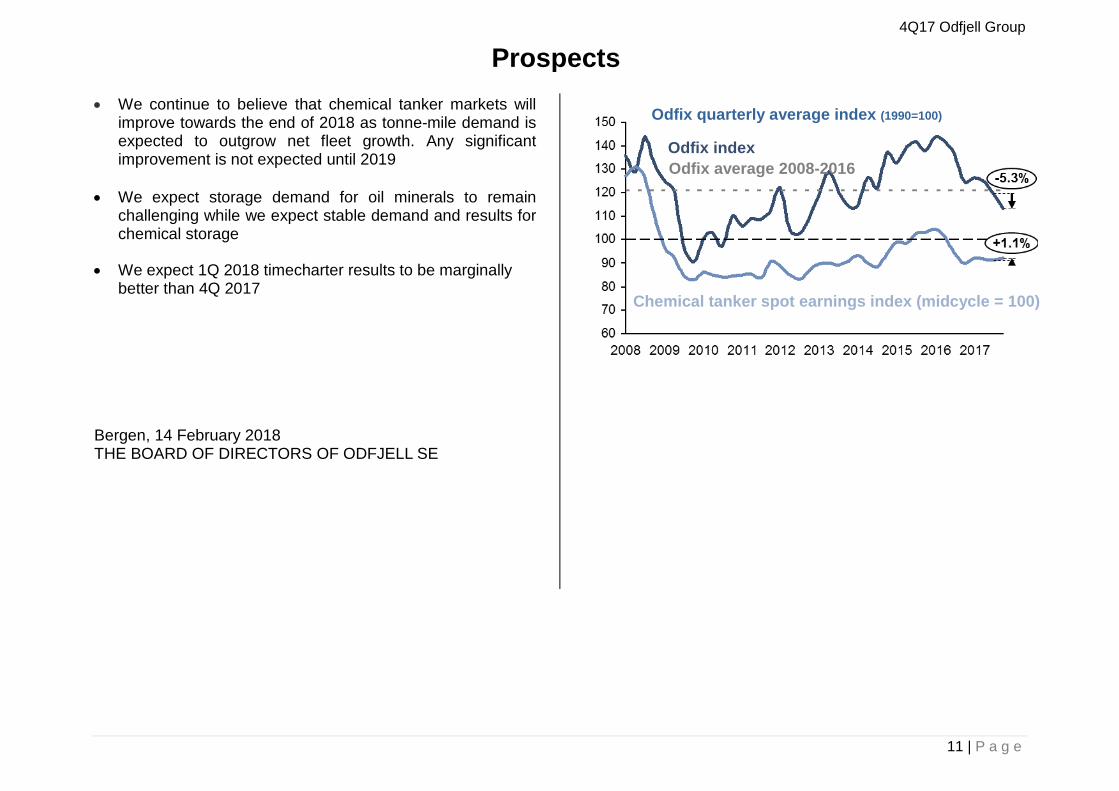
• We continue to believe that chemical tanker markets willimprove towards the end of 2018 as tonne-mile demand isexpected to outgrow net fleet growth. Any significantimprovement is not expected until 2019
• We expect storage demand for oil minerals to remainchallenging while we expect stable demand and results forchemical storage
• We expect 1Q 2018 timecharter results to be marginallybetter than 4Q 2017
Bergen, 14 February 2018 THE BOARD OF DIRECTORS OF ODFJELL SE
ProspectsProspects
Odfix quarterly average index (1990=100)
Chemical tanker spot earnings index (midcycle = 100)
Odfix index Odfix average 2008-2016
4Q17 Odfjell Group
12 | P a g e
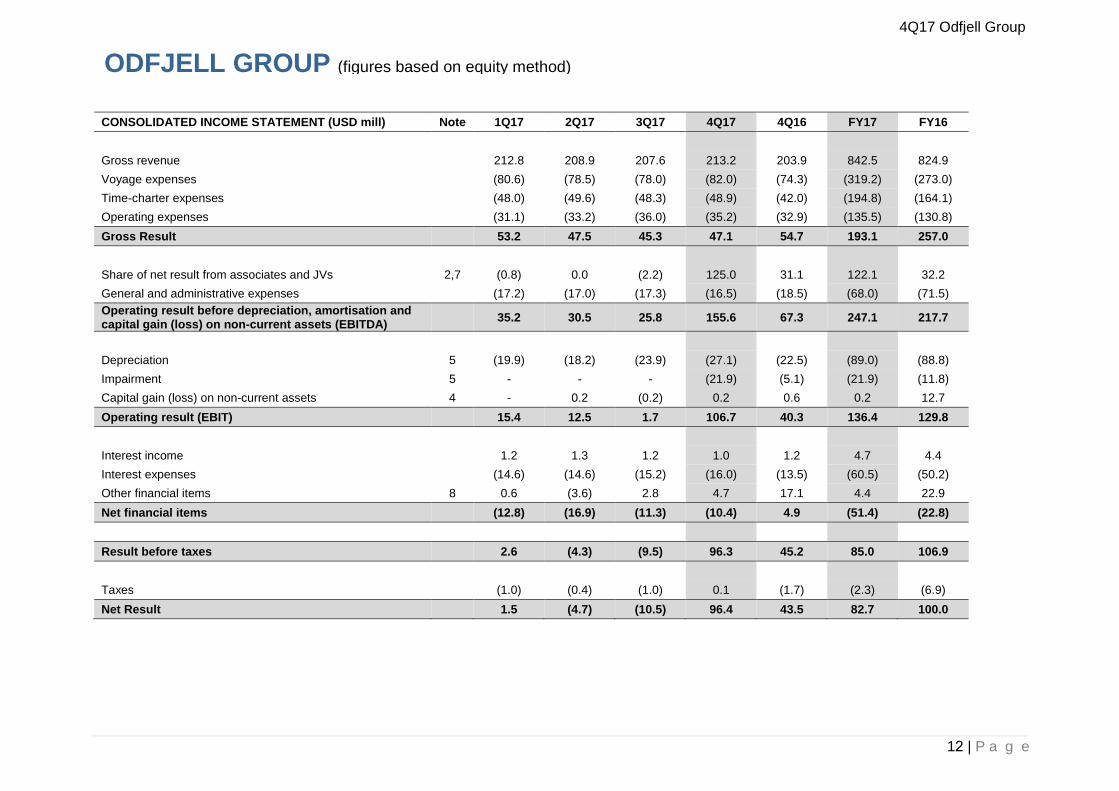
CONSOLIDATED INCOME STATEMENT (USD mill) Note 1Q17 2Q17 3Q17 4Q17 4Q16 FY17 FY16
Gross revenue 212.8 208.9 207.6 213.2 203.9 842.5 824.9 Voyage expenses (80.6) (78.5) (78.0) (82.0) (74.3) (319.2) (273.0) Time-charter expenses (48.0) (49.6) (48.3) (48.9) (42.0) (194.8) (164.1) Operating expenses (31.1) (33.2) (36.0) (35.2) (32.9) (135.5) (130.8) Gross Result 53.2 47.5 45.3 47.1 54.7 193.1 257.0
Share of net result from associates and JVs 2,7 (0.8) 0.0 (2.2) 125.0 31.1 122.1 32.2 General and administrative expenses (17.2) (17.0) (17.3) (16.5) (18.5) (68.0) (71.5) Operating result before depreciation, amortisation and capital gain (loss) on non-current assets (EBITDA) 35.2 30.5 25.8 155.6 67.3 247.1 217.7
Depreciation 5 (19.9) (18.2) (23.9) (27.1) (22.5) (89.0) (88.8) Impairment 5 - - - (21.9) (5.1) (21.9) (11.8) Capital gain (loss) on non-current assets 4 - 0.2 (0.2) 0.2 0.6 0.2 12.7 Operating result (EBIT) 15.4 12.5 1.7 106.7 40.3 136.4 129.8
Interest income 1.2 1.3 1.2 1.0 1.2 4.7 4.4 Interest expenses (14.6) (14.6) (15.2) (16.0) (13.5) (60.5) (50.2) Other financial items 8 0.6 (3.6) 2.8 4.7 17.1 4.4 22.9 Net financial items (12.8) (16.9) (11.3) (10.4) 4.9 (51.4) (22.8)
Result before taxes 2.6 (4.3) (9.5) 96.3 45.2 85.0 106.9
Taxes (1.0) (0.4) (1.0) 0.1 (1.7) (2.3) (6.9) Net Result 1.5 (4.7) (10.5) 96.4 43.5 82.7 100.0
ODFJELL GROUP (figures based on equity method)

4Q17 Odfjell Group
13 | P a g e
CONSOLIDATED STATEMENT OF COMPREHENSIVE INCOME 1Q17 2Q17 3Q17 4Q17 4Q16 FY17 FY16
Net other comprehensive income to be reclassified to profit or loss in subsequent periods: Cash-flow hedges changes in fair value 0.7 0.6 0.6 (1.6) 1.4 0.3 3.9 Cash-flow hedges transferred to profit and loss statement (0.6) (0.3) (1.0) (0.8) 0.2 (2.7) 1.4 Net unrealised gain/(loss) on available-for-sale-investments - 0.1 - (0.8) - (0.7) 1.3 Share of comprehensive income on investments accounted for using equity method 2.7 12.2 5.0 3.2 (5.4) 23.1 (6.1)
Net other comprehensive income not being reclassified to profit or loss in subsequent periods: Net actuarial gain/(loss) on defined benefit plans - - - 0.3 (0.3) 0.3 (0.3) Other comprehensive income 2.8 12.6 4.6 0.3 (4.1) 20.3 0.2
Total comprehensive income 4.3 7.9 (5.9) 96.7 39.4 103.0 100.2
Earnings per share (USD) – basic/diluted 0.02 (0.06) (0.13) 1.23 0.55 1.05 1.27
Net result and total comprehensive income is allocated 100% to the owners of the parent.

4Q17 Odfjell Group
14 | P a g e
Equity and liabilities – USD mill Note 31.03.17 30.06.17 30.09.17 31.12.17 31.12.16 Paid in equity 199.0 199.0 199.0 199.0 199.0 Other equity 524.3 518.9 512.7 609.0 519.8 Total equity 723.4 718.0 711.7 808.1 718.8 Non-current liabilities 12.1 11.9 11.8 9.6 11.3 Derivatives financial instruments 6 31.0 23.1 8.0 - 29.4Non-current interest bearing debt 3 883.5 907.0 995.3 845.3 837.6Total non-current liabilities 926.6 942.1 1,015.1 855.0 878.2 Current portion interest bearing debt 3 191.7 162.4 129.1 238.5 204.2 Current interest bearing debt 3 - 25.0 - - - Derivative financial instruments 6 10.9 5.4 4.9 23.8 12.9 Current liabilities 56.3 59.0 62.7 66.8 68.5 Total current liabilities 258.9 251.8 196.6 329.2 285.6 Total equity and liabilities 1,908.8 1,911.9 1,923.4 1,992.2 1,882.7
Assets - USD mill Note 31.03.17 30.06.17 30.09.17 31.12.17 31.12.16 Ships 5 1,211.6 1,250.3 1,329.0 1,293.5 1,227.8 Other non-current assets 5 11.2 10.5 9.6 8.4 11.9 Investments in associates and JVs 7 340.8 335.2 339.9 349.5 337.6 Loan to associates and JVs 1.8 - - - 1.8 Derivative financial instruments 6 - - - 3.3 - Non-current receivables 10.5 12.2 11.1 12.0 10.2 Total non-current assets 1,576.0 1,608.2 1,689.7 1,666.6 1,589.2 Current receivables 85.9 80.6 88.4 83.4 81.1 Bunkers and other inventories 15.2 18.5 19.2 20.9 17.9 Derivative financial instruments 6 1.0 0.8 0.5 - 1.8Available-for-sale investments 10.0 10.0 10.0 - 9.9Loan to associates and JVs 13.9 13.9 13.9 14.8 13.6Cash and cash equivalents 202.3 179.7 101.7 206.6 164.5Total current assets 328.2 303.6 233.8 325.6 288.9 Assets held for sale 4.6 - - - 4.6 Total assets 1,908.8 1,911.9 1,923.4 1,992.2 1,882.7
CONS OLIDATED STATEMENT OF FINANCIAL POSITION

4Q17 Odfjell Group
15 | P a g e
1) Sale of treasury shares in accordance with Long Term Incentive program for senior management, expensed with NOK 5.3 million in 1Q2017. The net amount, reducedwith withholding tax, has been used to buy Treasury shares.
(USD mill) Paid in equity Exchange rate differences
Cash-flow hedge reserves
Available for sale reserve
Pension remeasurement
OCI associates and JVs
Retained equity
Total other equity
Total equity
Equity as at 1.1.2016 201.8 (3.0) (4.9) (0.6) 17.3 (13.0) 447.8 443.5 645.3 Other comprehensive income - - 5.3 1.3 (0.3) (6.1) - 0.2 0.2 Net result - - - - - - 100.0 100.0 100.0 Repurchase treasury shares (2.8) - - - - - (22.4) (22.4) (25.1) Other adjustments - 3.0 - - (15.9) - 11.2 (1.6) (1.6) Equity as at 31.12.2016 199.0 - 0.4 0.7 1.1 (19.1) 536.7 519.8 718.8
Equity as per 1.1.2017 199.0 - 0.4 0.7 1.1 (19.1) 536.7 519.8 718.8 Other comprehensive income - - (2.4) (0.7) 0.3 23.1 - 20.3 20.3 Net result - - - - - - 82.7 82.7 82.7 Dividend payment - - - - - - (13.6) (13.6) (13.6) Sale of treasury shares 1) - - - - - - 0.2 0.2 0.2 Other adjustments - - - - - - (0.3) (0.3) (0.3) Equity as at 31.12.2017 199.0 - (2.0) - 1.4 4.0 605.7 609.1 808.1
CONSOLIDATED STATEMENT OF CHANGES IN EQUITY
4Q17 Odfjell Group
16 | P a g e
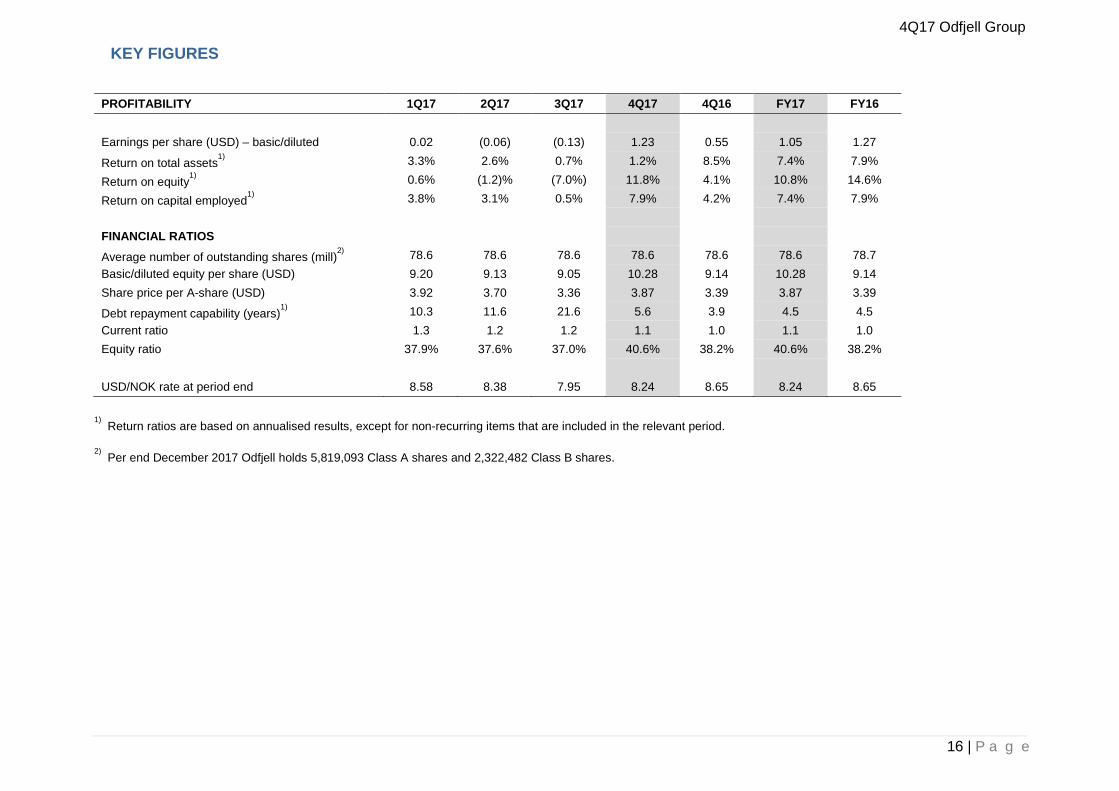
PROFITABILITY 1Q17 2Q17 3Q17 4Q17 4Q16 FY17 FY16
Earnings per share (USD) – basic/diluted 0.02 (0.06) (0.13) 1.23 0.55 1.05 1.27
Return on total assets1) 3.3% 2.6% 0.7% 1.2% 8.5% 7.4% 7.9%
Return on equity1) 0.6% (1.2)% (7.0%) 11.8% 4.1% 10.8% 14.6%
Return on capital employed1) 3.8% 3.1% 0.5% 7.9% 4.2% 7.4% 7.9%
FINANCIAL RATIOS Average number of outstanding shares (mill)
2) 78.6 78.6 78.6 78.6 78.6 78.6 78.7 Basic/diluted equity per share (USD) 9.20 9.13 9.05 10.28 9.14 10.28 9.14 Share price per A-share (USD) 3.92 3.70 3.36 3.87 3.39 3.87 3.39
Debt repayment capability (years)1) 10.3 11.6 21.6 5.6 3.9 4.5 4.5
Current ratio 1.3 1.2 1.2 1.1 1.0 1.1 1.0 Equity ratio 37.9% 37.6% 37.0% 40.6% 38.2% 40.6% 38.2%
USD/NOK rate at period end 8.58 8.38 7.95 8.24 8.65 8.24 8.65
1)Return ratios are based on annualised results, except for non-recurring items that are included in the relevant period.
2)Per end December 2017 Odfjell holds 5,819,093 Class A shares and 2,322,482 Class B shares.
KEY FIGURES
4Q17 Odfjell Group
17 | P a g e
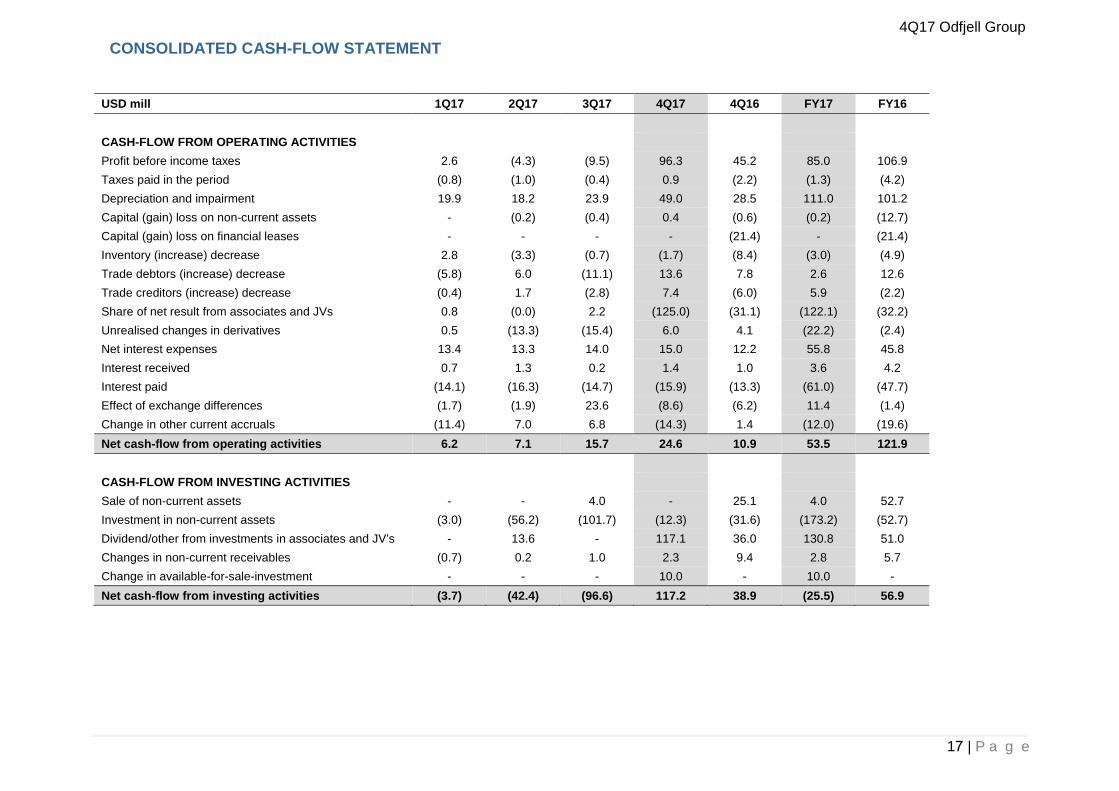
USD mill 1Q17 2Q17 3Q17 4Q17 4Q16 FY17 FY16
CASH-FLOW FROM OPERATING ACTIVITIES Profit before income taxes 2.6 (4.3) (9.5) 96.3 45.2 85.0 106.9 Taxes paid in the period (0.8) (1.0) (0.4) 0.9 (2.2) (1.3) (4.2) Depreciation and impairment 19.9 18.2 23.9 49.0 28.5 111.0 101.2 Capital (gain) loss on non-current assets - (0.2) (0.4) 0.4 (0.6) (0.2) (12.7) Capital (gain) loss on financial leases - - - - (21.4) - (21.4)Inventory (increase) decrease 2.8 (3.3) (0.7) (1.7) (8.4) (3.0) (4.9)Trade debtors (increase) decrease (5.8) 6.0 (11.1) 13.6 7.8 2.6 12.6Trade creditors (increase) decrease (0.4) 1.7 (2.8) 7.4 (6.0) 5.9 (2.2)Share of net result from associates and JVs 0.8 (0.0) 2.2 (125.0) (31.1) (122.1) (32.2)Unrealised changes in derivatives 0.5 (13.3) (15.4) 6.0 4.1 (22.2) (2.4)Net interest expenses 13.4 13.3 14.0 15.0 12.2 55.8 45.8Interest received 0.7 1.3 0.2 1.4 1.0 3.6 4.2 Interest paid (14.1) (16.3) (14.7) (15.9) (13.3) (61.0) (47.7) Effect of exchange differences (1.7) (1.9) 23.6 (8.6) (6.2) 11.4 (1.4) Change in other current accruals (11.4) 7.0 6.8 (14.3) 1.4 (12.0) (19.6) Net cash-flow from operating activities 6.2 7.1 15.7 24.6 10.9 53.5 121.9
CASH-FLOW FROM INVESTING ACTIVITIES Sale of non-current assets - - 4.0 - 25.1 4.0 52.7 Investment in non-current assets (3.0) (56.2) (101.7) (12.3) (31.6) (173.2) (52.7) Dividend/other from investments in associates and JV’s - 13.6 - 117.1 36.0 130.8 51.0 Changes in non-current receivables (0.7) 0.2 1.0 2.3 9.4 2.8 5.7 Change in available-for-sale-investment - - - 10.0 - 10.0 - Net cash-flow from investing activities (3.7) (42.4) (96.6) 117.2 38.9 (25.5) 56.9
CONSOLIDATED CASH-FLOW STATEMENT
4Q17 Odfjell Group
18 | P a g e
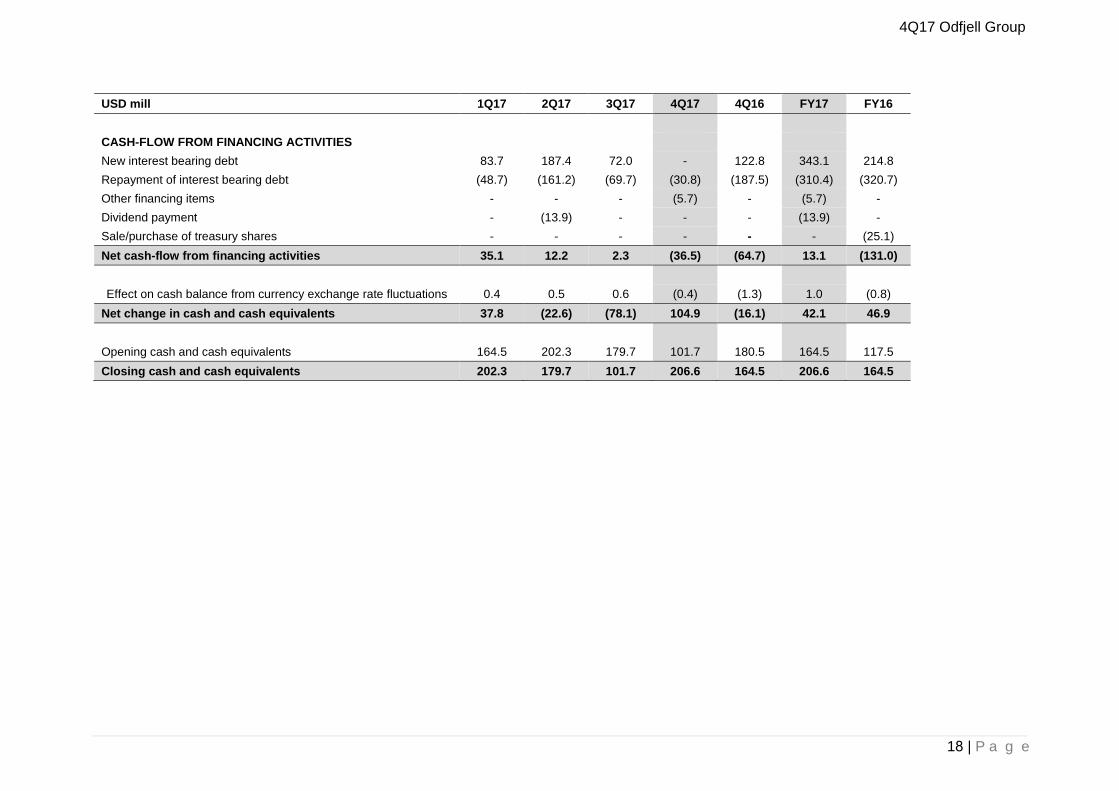
USD mill 1Q17 2Q17 3Q17 4Q17 4Q16 FY17 FY16
CASH-FLOW FROM FINANCING ACTIVITIES New interest bearing debt 83.7 187.4 72.0 - 122.8 343.1 214.8 Repayment of interest bearing debt (48.7) (161.2) (69.7) (30.8) (187.5) (310.4) (320.7) Other financing items - - - (5.7) - (5.7) - Dividend payment - (13.9) - - - (13.9) - Sale/purchase of treasury shares - - - - - - (25.1) Net cash-flow from financing activities 35.1 12.2 2.3 (36.5) (64.7) 13.1 (131.0)
Effect on cash balance from currency exchange rate fluctuations 0.4 0.5 0.6 (0.4) (1.3) 1.0 (0.8) Net change in cash and cash equivalents 37.8 (22.6) (78.1) 104.9 (16.1) 42.1 46.9
Opening cash and cash equivalents 164.5 202.3 179.7 101.7 180.5 164.5 117.5 Closing cash and cash equivalents 202.3 179.7 101.7 206.6 164.5 206.6 164.5
4Q17 Odfjell Group
19 | P a g e
Note 1 – Accounting principles
Odfjell SE is ultimate parent company of the Odfjell Group. Odfjell SE is a public listed company traded on the Oslo Stock Exchange. The company’s address is Conrad Mohrsv. 29, Bergen, Norway.
Basis of preparation and changes to the Group’s accounting policies The interim consolidated financial statements ended 31 December 2017 for the Odfjell Group and have been prepared in accordance with International Accounting Standard IAS 34 “Interim Financial Reporting”. The interim financial statements do not include all the information and disclosures required in the annual financial statements, and should be read in conjunction with the Group’s annual financial statements as at 31 December 2016. The interim financial statements are unaudited.
New standards, interpretations and amendments adopted by the Group The accounting principles used in the preparation of these financial statements are consistent with those used in the annual financial statements for the year ended 31 December 2016. A number of new standards and amendments to standard and interpretations are not yet effective, and have not yet been applied in preparing consolidated financial statements. The Group’s assessment of the impacts on these new standards is set out below.
IFRS 9 Financial Instruments IFRS 9 addresses the classification, measurement and de-recognition of financial assets and financial liabilities and introduces new rules for hedge accounting. Preliminary assessment indicates that we do not expect any material impact on the Group’s financial assets and liabilities.
IFRS 15 Revenue from contracts with customers The new revenue standard will replace IAS 18 which covers contracts for goods and services and IAS 11 which covers construction contracts. The new standard is based on the principle that revenue is recognised when control of a good or service transfers to a customer – so the notion of control replaces the existing notion of risks and rewards. Based on impact analysis performed, the Group does not expect there to be a material impact on its consolidated financial statements from this standard. The standard is applicable for financial years commencing on or after 1 January 2018.
IFRS 16 Leases Under ‘IFRS 16 leases’ lessees no longer distinguish between a finance lease (on balance sheet) and an operating lease (off balance sheet). Instead, for virtually all lease contracts the lessee recognises a lease liability reflecting future lease payments and a ‘right-of-use’ asset. The new model is based on the rationale that economically a lease contract is equal to acquiring the right to use an asset with the purchase price paid in instalments. The only exceptions are short-term and low-value leases. Lessees recognize interest expense on the lease liability and a depreciation charge on the ‘right-of-use’ asset. Compared to the accounting for operating leases under IAS 17, this does not only change the presentation within the income statement (under IAS 17 lease payments are presented as a single amount within operating expenses) but also the total amount of expenses recognised in each period. Straight-line depreciation of the right-of-use asset and application of the effective interest rate method to the lease liability will result in a higher total charge to profit or loss in the initial periods, and decreasing expenses during the latter part of the lease term. The new IFRS 16 is mandatory from 1 January 2019. Applying the IFRS 16 will have an impact on the Financial Statements for lessee arrangements which exists on 1 January 2019 as estimated per tables below.
Notes to the consolidated financial statements
4Q17 Odfjell Group
20 | P a g e
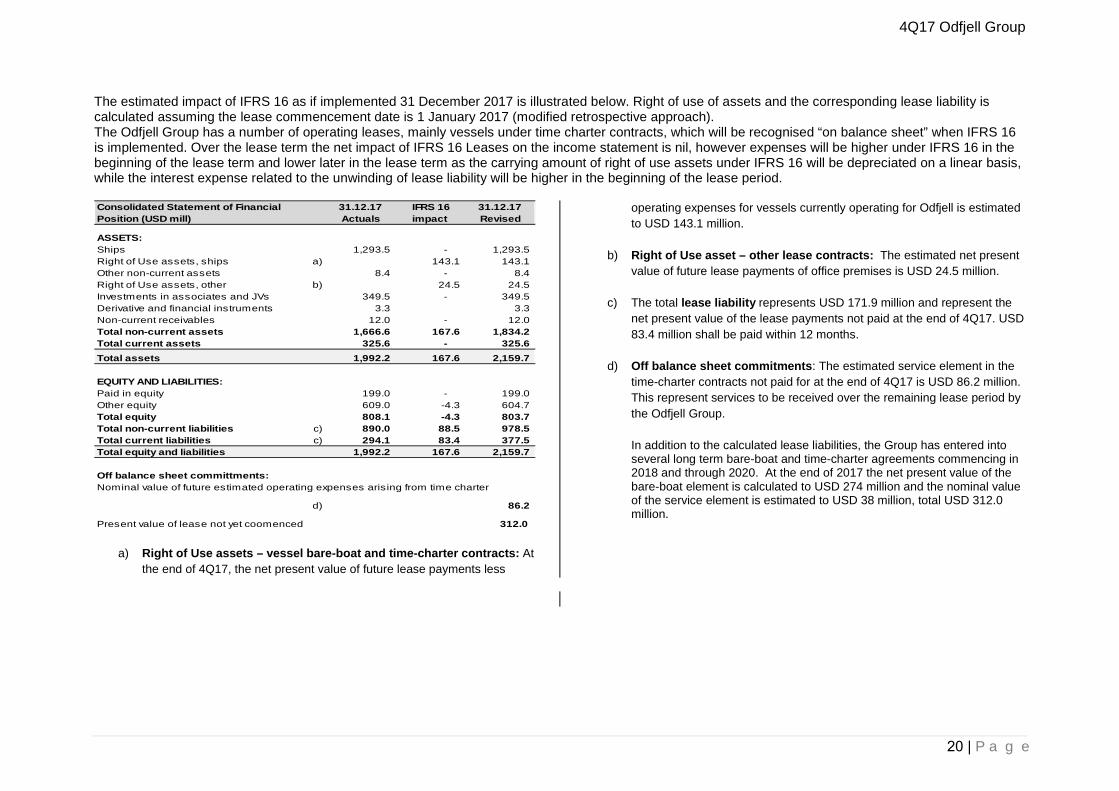
The estimated impact of IFRS 16 as if implemented 31 December 2017 is illustrated below. Right of use of assets and the corresponding lease liability is calculated assuming the lease commencement date is 1 January 2017 (modified retrospective approach). The Odfjell Group has a number of operating leases, mainly vessels under time charter contracts, which will be recognised “on balance sheet” when IFRS 16 is implemented. Over the lease term the net impact of IFRS 16 Leases on the income statement is nil, however expenses will be higher under IFRS 16 in the beginning of the lease term and lower later in the lease term as the carrying amount of right of use assets under IFRS 16 will be depreciated on a linear basis, while the interest expense related to the unwinding of lease liability will be higher in the beginning of the lease period.
a) Right of Use assets – vessel bare-boat and time-charter contracts: Atthe end of 4Q17, the net present value of future lease payments less
operating expenses for vessels currently operating for Odfjell is estimated to USD 143.1 million.
b) Right of Use asset – other lease contracts: The estimated net presentvalue of future lease payments of office premises is USD 24.5 million.
c) The total lease liability represents USD 171.9 million and represent thenet present value of the lease payments not paid at the end of 4Q17. USD83.4 million shall be paid within 12 months.
d) Off balance sheet commitments: The estimated service element in thetime-charter contracts not paid for at the end of 4Q17 is USD 86.2 million.This represent services to be received over the remaining lease period bythe Odfjell Group.
In addition to the calculated lease liabilities, the Group has entered intoseveral long term bare-boat and time-charter agreements commencing in2018 and through 2020. At the end of 2017 the net present value of thebare-boat element is calculated to USD 274 million and the nominal valueof the service element is estimated to USD 38 million, total USD 312.0million.
Consolidated Statement of Financial Position (USD mill)
31.12.17 Actuals
IFRS 16 impact
31.12.17 Revised
ASSETS: Ships 1,293.5 - 1,293.5 Right of Use assets, ships a) 143.1 143.1 Other non-current assets 8.4 - 8.4 Right of Use assets, other b) 24.5 24.5 Investments in associates and JVs 349.5 - 349.5 Derivative and financial instruments 3.3 3.3 Non-current receivables 12.0 - 12.0 Total non-current assets 1,666.6 167.6 1,834.2 Total current assets 325.6 - 325.6 Total assets 1,992.2 167.6 2,159.7
EQUITY AND LIABILITIES:Paid in equity 199.0 - 199.0 Other equity 609.0 -4.3 604.7 Total equity 808.1 -4.3 803.7 Total non-current liabilities c) 890.0 88.5 978.5 Total current liabilities c) 294.1 83.4 377.5 Total equity and liabilities 1,992.2 167.6 2,159.7
Off balance sheet committments:
d) 86.2
Present value of lease not yet coomenced 312.0
Nominal value of future estimated operating expenses arising from time charter

4Q17 Odfjell Group
21 | P a g e
e) Reclassify the lease expense: Total operating lease expense during theperiod is USD 194.8 million, of which USD 5.6 million is short term lease,i.e. less than 12 months from commencement date. Remaining USD 189.2million represent time-charter and bare-boat expense included in calculationof right of use of assets and hence reclassified under IFRS 16.
f) Service element of time charters: IFRS 16 only applies to the bare-boatelement of time-charters. The service element for time-charter ships areestimated to USD 6.500 per day and classified as operating expense.
g) The Odfjell Group leases office premises in different areas. The lease ofthese premises exceeds 12 months and capitalized as right of use of assets
and thus USD 2.6 million is removed from General and administrative expenses.
h) Depreciation of the right-of-use assets: The lease of assets is subject fora straight-line depreciation over the lease term. The lease term (‘useful life’)is the non-cancellable period including option to extend the lease period ifthe option is reasonable certain to be exercised.
i) Interest expense on the lease liability: The lease liabilities are discountedwith 5%.
j) Net cash flow from operations increases with USD 105.1 million which isthe negative net result before tax of USD 4.3 million and added backdepreciation of USD 109.4 million.
k) Net cash flow from investments: During the year four new time charterships are contracted, where the net present value of future bareboatelement is calculated at USD 32.4 million. There is no cash outflow, henceno impact on the cash flow statement.
l) Net cash flow from financing of USD 105.1 million represents therepayment of the lease liability. The net impact on the cash flow statementis nil.
The table below illustrate how the right of use of assets and lease liability is estimated to change during 2018:
Consolidated income statement (USD mill)
2017 Actuals
IFRS 16 impact
2017 Revised
Gross revenue 842.5 0.0 842.5Voyage expenses (319.2) 0.0 (319.2)Time-charter expenses e) (194.8) 189.2 (5.6)Operating expenses f) (135.5) (75.2) (210.7)Gross result 193.1 114.0 307.1Share of net result from JV 122.1 0.0 122.1General and administrative g) (68.0) 2.6 (65.4)EBITDA 247.1 116.6 363.8Capital gain / loss 0.2 0.0 0.2Depreciation, capital gain/loss h) (110.8) (109.4) (220.2)Net financial items i) (51.4) (11.4) (62.8)Taxes (2.3) 0.0 (2.3)Net result 82.7 (4.3) 78.4
Consolidated cash flow statement (USD mill)
2017 Actuals
IFRS 16 impact
2017 Revised
Net cash flow from operations j) 51.9 105.1 157.0Net cash flow from investments k) (29.6) 0.0 (29.6)Net cash flow from financing l) 18.8 (105.1) (86.3) Effect on cash balance from FX 1.0 0.0 1.0
Net change in cash and cash equivalents 42.1 0.0 42.1 Opening Cash and cash equivalents 164.5 0.0 164.5
Closing Cash and cash equivalents 206.6 0.0 206.6
Estimated changes assets 1Q18 2Q18 3Q18 4Q18Opening balance 167.6 142.0 118.8 99.0
Depreciation 25.6 23.2 19.8 16.6
Closing balance 142.0 118.8 99.0 82.4
Estimated changes liabilities 1Q18 2Q18 3Q18 4Q18Opening balance 171.9 147.1 124.4 104.9
Instalments 24.8 22.7 19.5 16.4
Closing balance 147.1 124.4 104.9 88.5
4Q17 Odfjell Group
22 | P a g e
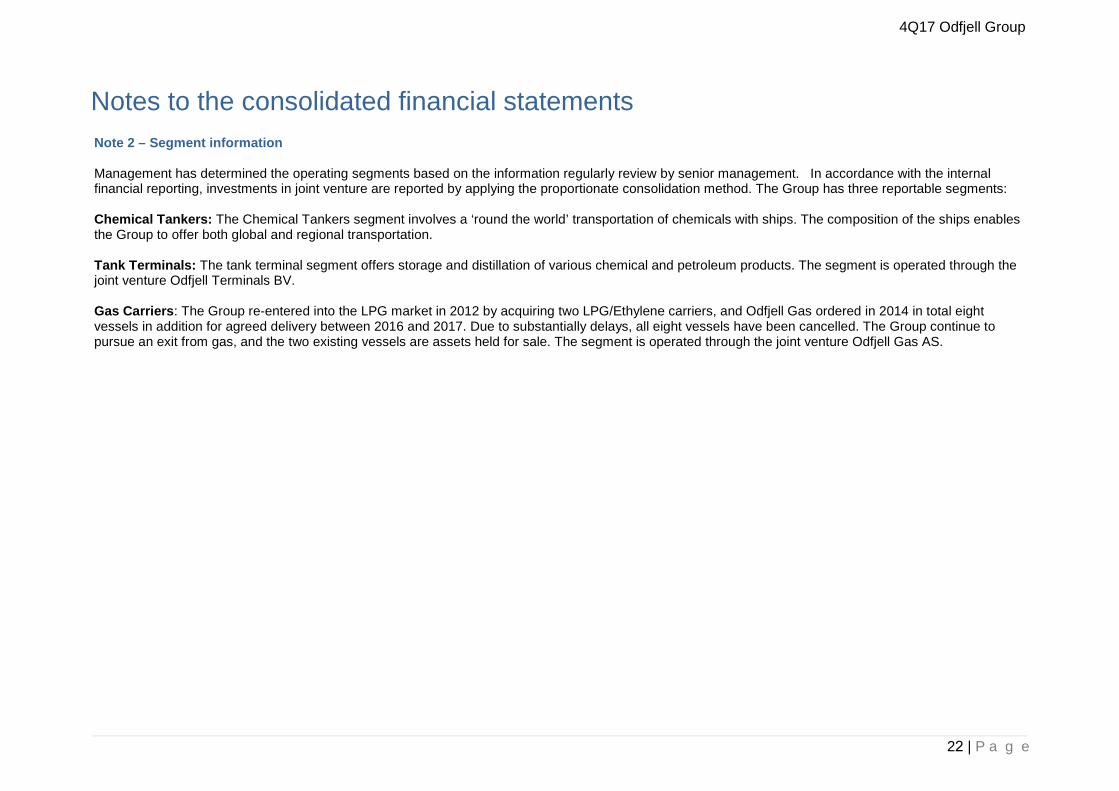
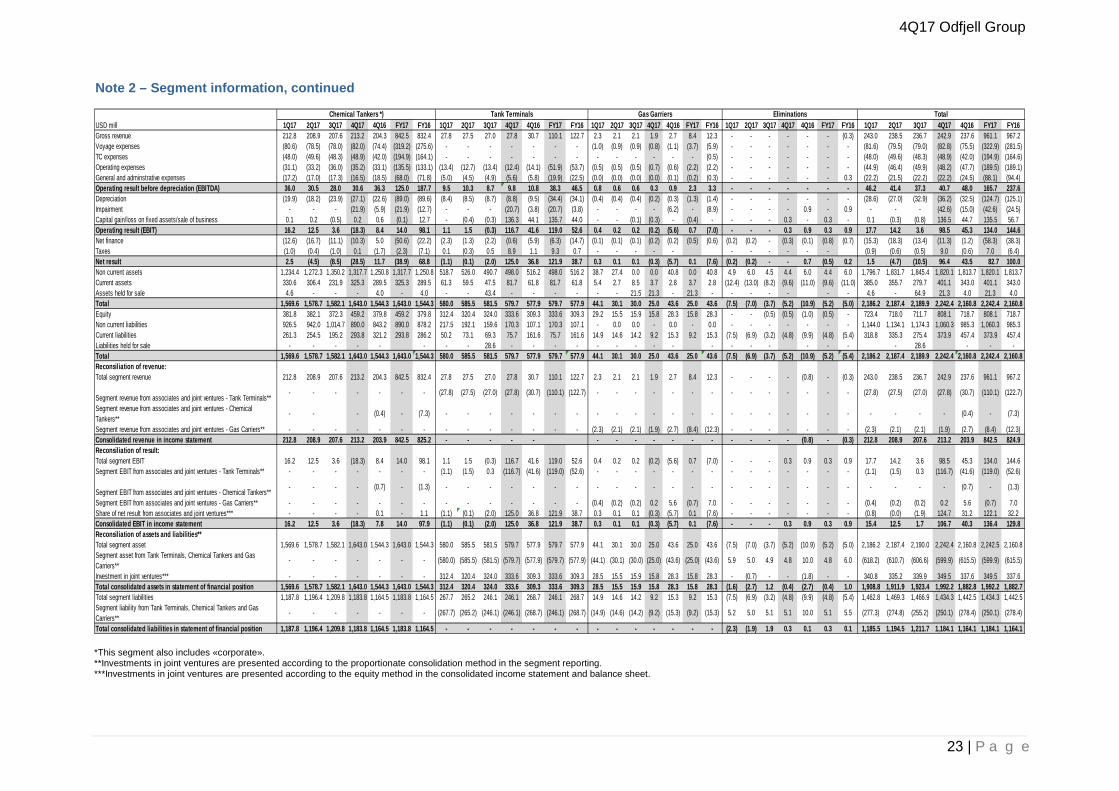
Note 2 – Segment information
Management has determined the operating segments based on the information regularly review by senior management. In accordance with the internal financial reporting, investments in joint venture are reported by applying the proportionate consolidation method. The Group has three reportable segments:
Chemical Tankers: The Chemical Tankers segment involves a ‘round the world’ transportation of chemicals with ships. The composition of the ships enables the Group to offer both global and regional transportation.
Tank Terminals: The tank terminal segment offers storage and distillation of various chemical and petroleum products. The segment is operated through the joint venture Odfjell Terminals BV.
Gas Carriers: The Group re-entered into the LPG market in 2012 by acquiring two LPG/Ethylene carriers, and Odfjell Gas ordered in 2014 in total eight vessels in addition for agreed delivery between 2016 and 2017. Due to substantially delays, all eight vessels have been cancelled. The Group continue to pursue an exit from gas, and the two existing vessels are assets held for sale. The segment is operated through the joint venture Odfjell Gas AS.
Notes to the consolidated financial statements
4Q17 Odfjell Group
23 | P a g e
*This segment also includes «corporate».**Investments in joint ventures are presented according to the proportionate consolidation method in the segment reporting.***Investments in joint ventures are presented according to the equity method in the consolidated income statement and balance sheet.
USD mill 1Q17 2Q17 3Q17 4Q17 4Q16 FY17 FY16 1Q17 2Q17 3Q17 4Q17 4Q16 FY17 FY16 1Q17 2Q17 3Q17 4Q17 4Q16 FY17 FY16 1Q17 2Q17 3Q17 4Q17 4Q16 FY17 FY16 1Q17 2Q17 3Q17 4Q17 4Q16 FY17 FY16Gross revenue 212.8 208.9 207.6 213.2 204.3 842.5 832.4 27.8 27.5 27.0 27.8 30.7 110.1 122.7 2.3 2.1 2.1 1.9 2.7 8.4 12.3 - - - - - - (0.3) 243.0 238.5 236.7 242.9 237.6 961.1 967.2Voyage expenses (80.6) (78.5) (78.0) (82.0) (74.4) (319.2) (275.6) - - - - - - - (1.0) (0.9) (0.9) (0.8) (1.1) (3.7) (5.9) - - - - - - - (81.6) (79.5) (79.0) (82.8) (75.5) (322.9) (281.5)TC expenses (48.0) (49.6) (48.3) (48.9) (42.0) (194.9) (164.1) - - - - - - - - - - - - - (0.5) - - - - - - - (48.0) (49.6) (48.3) (48.9) (42.0) (194.9) (164.6)Operating expenses (31.1) (33.2) (36.0) (35.2) (33.1) (135.5) (133.1) (13.4) (12.7) (13.4) (12.4) (14.1) (51.9) (53.7) (0.5) (0.5) (0.5) (0.7) (0.6) (2.2) (2.2) - - - - - - - (44.9) (46.4) (49.9) (48.2) (47.7) (189.5) (189.1)General and adminstrative expenses (17.2) (17.0) (17.3) (16.5) (18.5) (68.0) (71.8) (5.0) (4.5) (4.9) (5.6) (5.8) (19.9) (22.5) (0.0) (0.0) (0.0) (0.0) (0.1) (0.2) (0.3) - - - - - - 0.3 (22.2) (21.5) (22.2) (22.2) (24.5) (88.1) (94.4)Operating result before depreciation (EBITDA) 36.0 30.5 28.0 30.6 36.3 125.0 187.7 9.5 10.3 8.7 9.8 10.8 38.3 46.5 0.8 0.6 0.6 0.3 0.9 2.3 3.3 - - - - - - - 46.2 41.4 37.3 40.7 48.0 165.7 237.6Depreciation (19.9) (18.2) (23.9) (27.1) (22.6) (89.0) (89.6) (8.4) (8.5) (8.7) (8.8) (9.5) (34.4) (34.1) (0.4) (0.4) (0.4) (0.2) (0.3) (1.3) (1.4) - - - - - - - (28.6) (27.0) (32.9) (36.2) (32.5) (124.7) (125.1)Impairment - - - (21.9) (5.9) (21.9) (12.7) - - - (20.7) (3.8) (20.7) (3.8) - - - - (6.2) - (8.9) - - - - 0.9 - 0.9 - - - (42.6) (15.0) (42.6) (24.5)Capital gain/loss on fixed assets/sale of business 0.1 0.2 (0.5) 0.2 0.6 (0.1) 12.7 - (0.4) (0.3) 136.3 44.1 135.7 44.0 - - (0.1) (0.3) - (0.4) - - - - 0.3 - 0.3 - 0.1 (0.3) (0.8) 136.5 44.7 135.5 56.7Operating result (EBIT) 16.2 12.5 3.6 (18.3) 8.4 14.0 98.1 1.1 1.5 (0.3) 116.7 41.6 119.0 52.6 0.4 0.2 0.2 (0.2) (5.6) 0.7 (7.0) - - - 0.3 0.9 0.3 0.9 17.7 14.2 3.6 98.5 45.3 134.0 144.6Net finance (12.6) (16.7) (11.1) (10.3) 5.0 (50.6) (22.2) (2.3) (1.3) (2.2) (0.6) (5.9) (6.3) (14.7) (0.1) (0.1) (0.1) (0.2) (0.2) (0.5) (0.6) (0.2) (0.2) - (0.3) (0.1) (0.8) (0.7) (15.3) (18.3) (13.4) (11.3) (1.2) (58.3) (38.3)Taxes (1.0) (0.4) (1.0) 0.1 (1.7) (2.3) (7.1) 0.1 (0.3) 0.5 8.9 1.1 9.3 0.7 - - - - - - - - - - - (0.9) (0.6) (0.5) 9.0 (0.6) 7.0 (6.4)Net result 2.5 (4.5) (8.5) (28.5) 11.7 (38.9) 68.8 (1.1) (0.1) (2.0) 125.0 36.8 121.9 38.7 0.3 0.1 0.1 (0.3) (5.7) 0.1 (7.6) (0.2) (0.2) - - 0.7 (0.5) 0.2 1.5 (4.7) (10.5) 96.4 43.5 82.7 100.0Non current assets 1,234.4 1,272.3 1,350.2 1,317.7 1,250.8 1,317.7 1,250.8 518.7 526.0 490.7 498.0 516.2 498.0 516.2 38.7 27.4 0.0 0.0 40.8 0.0 40.8 4.9 6.0 4.5 4.4 6.0 4.4 6.0 1,796.7 1,831.7 1,845.4 1,820.1 1,813.7 1,820.1 1,813.7Current assets 330.6 306.4 231.9 325.3 289.5 325.3 289.5 61.3 59.5 47.5 81.7 61.8 81.7 61.8 5.4 2.7 8.5 3.7 2.8 3.7 2.8 (12.4) (13.0) (8.2) (9.6) (11.0) (9.6) (11.0) 385.0 355.7 279.7 401.1 343.0 401.1 343.0Assets held for sale 4.6 - - - 4.0 - 4.0 - - 43.4 - - - - - - 21.5 21.3 - 21.3 - - - - - - - 4.6 - 64.9 21.3 4.0 21.3 4.0Total 1,569.6 1,578.7 1,582.1 1,643.0 1,544.3 1,643.0 1,544.3 580.0 585.5 581.5 579.7 577.9 579.7 577.9 44.1 30.1 30.0 25.0 43.6 25.0 43.6 (7.5) (7.0) (3.7) (5.2) (10.9) (5.2) (5.0) 2,186.2 2,187.4 2,189.9 2,242.4 2,160.8 2,242.4 2,160.8Equity 381.8 382.1 372.3 459.2 379.8 459.2 379.8 312.4 320.4 324.0 333.6 309.3 333.6 309.3 29.2 15.5 15.9 15.8 28.3 15.8 28.3 - - (0.5) (0.5) (1.0) (0.5) - 723.4 718.0 711.7 808.1 718.7 808.1 718.7Non current liabilities 926.5 942.0 1,014.7 890.0 843.2 890.0 878.2 217.5 192.1 159.6 170.3 107.1 170.3 107.1 - 0.0 0.0 - 0.0 - 0.0 - - - - - - - 1,144.0 1,134.1 1,174.3 1,060.3 985.3 1,060.3 985.3Current liabilities 261.3 254.5 195.2 293.8 321.2 293.8 286.2 50.2 73.1 69.3 75.7 161.6 75.7 161.6 14.9 14.6 14.2 9.2 15.3 9.2 15.3 (7.5) (6.9) (3.2) (4.8) (9.9) (4.8) (5.4) 318.8 335.3 275.4 373.9 457.4 373.9 457.4Liabilities held for sale - - - - - - - - 28.6 - - - - - - - - - - - - - - - - - 28.6 - - -Total 1,569.6 1,578.7 1,582.1 1,643.0 1,544.3 1,643.0 1,544.3 580.0 585.5 581.5 579.7 577.9 579.7 577.9 44.1 30.1 30.0 25.0 43.6 25.0 43.6 (7.5) (6.9) (3.7) (5.2) (10.9) (5.2) (5.4) 2,186.2 2,187.4 2,189.9 2,242.4 2,160.8 2,242.4 2,160.8Reconsiliation of revenue:Total segment revenue 212.8 208.9 207.6 213.2 204.3 842.5 832.4 27.8 27.5 27.0 27.8 30.7 110.1 122.7 2.3 2.1 2.1 1.9 2.7 8.4 12.3 - - - - (0.8) - (0.3) 243.0 238.5 236.7 242.9 237.6 961.1 967.2
Segment revenue from associates and joint ventures - Tank Terminals**- - - - - - - (27.8) (27.5) (27.0) (27.8) (30.7) (110.1) (122.7) - - - - - - - - - - - - - - (27.8) (27.5) (27.0) (27.8) (30.7) (110.1) (122.7)
Segment revenue from associates and joint ventures - Chemical Tankers**
- - - (0.4) - (7.3) - - - - - - - - - - - - - - - - - - - - - - - - - (0.4) - (7.3)
Segment revenue from associates and joint ventures - Gas Carriers** - - - - - - - - - - - - - - (2.3) (2.1) (2.1) (1.9) (2.7) (8.4) (12.3) - - - - - - - (2.3) (2.1) (2.1) (1.9) (2.7) (8.4) (12.3)Consolidated revenue in income statement 212.8 208.9 207.6 213.2 203.9 842.5 825.2 - - - - - - - - - - - - - - - - (0.8) - (0.3) 212.8 208.9 207.6 213.2 203.9 842.5 824.9Reconsiliation of result:Total segment EBIT 16.2 12.5 3.6 (18.3) 8.4 14.0 98.1 1.1 1.5 (0.3) 116.7 41.6 119.0 52.6 0.4 0.2 0.2 (0.2) (5.6) 0.7 (7.0) - - - 0.3 0.9 0.3 0.9 17.7 14.2 3.6 98.5 45.3 134.0 144.6Segment EBIT from associates and joint ventures - Tank Terminals** - - - - - - - (1.1) (1.5) 0.3 (116.7) (41.6) (119.0) (52.6) - - - - - - - - - - - - - - (1.1) (1.5) 0.3 (116.7) (41.6) (119.0) (52.6)
Segment EBIT from associates and joint ventures - Chemical Tankers**- - - - (0.7) - (1.3) - - - - - - - - - - - - - - - - - - - - - - - - - (0.7) - (1.3)
Segment EBIT from associates and joint ventures - Gas Carriers** - - - - - - - - - - - - - - (0.4) (0.2) (0.2) 0.2 5.6 (0.7) 7.0 - - - - - - - (0.4) (0.2) (0.2) 0.2 5.6 (0.7) 7.0Share of net result from associates and joint ventures*** - - - - 0.1 - 1.1 (1.1) (0.1) (2.0) 125.0 36.8 121.9 38.7 0.3 0.1 0.1 (0.3) (5.7) 0.1 (7.6) - - - - - - - (0.8) (0.0) (1.9) 124.7 31.2 122.1 32.2Consolidated EBIT in income statement 16.2 12.5 3.6 (18.3) 7.8 14.0 97.9 (1.1) (0.1) (2.0) 125.0 36.8 121.9 38.7 0.3 0.1 0.1 (0.3) (5.7) 0.1 (7.6) - - - 0.3 0.9 0.3 0.9 15.4 12.5 1.7 106.7 40.3 136.4 129.8Reconsiliation of assets and liabilities**Total segment asset 1,569.6 1,578.7 1,582.1 1,643.0 1,544.3 1,643.0 1,544.3 580.0 585.5 581.5 579.7 577.9 579.7 577.9 44.1 30.1 30.0 25.0 43.6 25.0 43.6 (7.5) (7.0) (3.7) (5.2) (10.9) (5.2) (5.0) 2,186.2 2,187.4 2,190.0 2,242.4 2,160.8 2,242.5 2,160.8Segment asset from Tank Terminals, Chemical Tankers and Gas Carriers**
- - - - - - - (580.0) (585.5) (581.5) (579.7) (577.9) (579.7) (577.9) (44.1) (30.1) (30.0) (25.0) (43.6) (25.0) (43.6) 5.9 5.0 4.9 4.8 10.0 4.8 6.0 (618.2) (610.7) (606.6) (599.9) (615.5) (599.9) (615.5)
Investment in joint ventures*** - - - - - - - 312.4 320.4 324.0 333.6 309.3 333.6 309.3 28.5 15.5 15.9 15.8 28.3 15.8 28.3 - (0.7) - - (1.8) - - 340.8 335.2 339.9 349.5 337.6 349.5 337.6Total consolidated assets in statement of financial position 1,569.6 1,578.7 1,582.1 1,643.0 1,544.3 1,643.0 1,544.3 312.4 320.4 324.0 333.6 309.3 333.6 309.3 28.5 15.5 15.9 15.8 28.3 15.8 28.3 (1.6) (2.7) 1.2 (0.4) (2.7) (0.4) 1.0 1,908.8 1,911.9 1,923.4 1,992.2 1,882.8 1,992.2 1,882.7Total segment liabilities 1,187.8 1,196.4 1,209.8 1,183.8 1,164.5 1,183.8 1,164.5 267.7 265.2 246.1 246.1 268.7 246.1 268.7 14.9 14.6 14.2 9.2 15.3 9.2 15.3 (7.5) (6.9) (3.2) (4.8) (9.9) (4.8) (5.4) 1,462.8 1,469.3 1,466.9 1,434.3 1,442.5 1,434.3 1,442.5Segment liability from Tank Terminals, Chemical Tankers and Gas Carriers**
- - - - - - - (267.7) (265.2) (246.1) (246.1) (268.7) (246.1) (268.7) (14.9) (14.6) (14.2) (9.2) (15.3) (9.2) (15.3) 5.2 5.0 5.1 5.1 10.0 5.1 5.5 (277.3) (274.8) (255.2) (250.1) (278.4) (250.1) (278.4)
Total consolidated liabilities in statement of financial position 1,187.8 1,196.4 1,209.8 1,183.8 1,164.5 1,183.8 1,164.5 - - - - - - - - - - - - - - (2.3) (1.9) 1.9 0.3 0.1 0.3 0.1 1,185.5 1,194.5 1,211.7 1,184.1 1,164.1 1,184.1 1,164.1
Chemical Tankers *) Tank Terminals Gas Garriers Eliminations Total
Note 2 – Segment information, continued

4Q17 Odfjell Group
24 | P a g e
Note 3 – Net interest bearing liabilitiesUSD mill 31.03.17 30.06.17 30.09.17 31.12.17 31.12.16 Loans from financial institutions – floating interest rate 425.7 447.5 459.3 388.1 515.2 Financial leases 145.9 196.5 260.8 257.9 147.2 Bonds 318.2 269.3 282.3 206.3 181.1 Current portion interest bearing debt 191.7 162.4 129.1 238.5 204.2 Debt transaction fees (6.3) (6.4) (7.1) (6.8) (6.0) Subtotal interest bearing debt 1,075.1 1,069.4 1,124.4 1,083.8 1,041.8 Current interest bearing debt - 25.0 - - - Total interest bearing debt 1,075.1 1,094.4 1,124.4 1,083.8 1,041.8 Cash and cash equivalent (202.3) (179.7) (101.7) (206.6) (164.5) Available for sale investments (10.0) (10.0) (10.0) - (9.9)Net interest bearing debt 862.8 904.7 1,012.7 877.2 867.5
USD mill 1Q17 2Q17 3Q17 4Q17 FY16 New interest bearing debt 83.7 187.4 72.0 - 214.8Repayment of interest bearing debt (48.7) (161.2) (69.7) (30.8) (320.7)
In June 2017 Odfjell SE completed a new unsecured bond issue of NOK 500 million with maturity date in June 2022. In conjunction with the bond issue the company has purchased NOK 327 million of the outstanding bonds maturing in December 2018.
4Q17 Odfjell Group
25 | P a g e
Note 4 – Transactions with related parties
In the normal course of the conduct of its business, the Group enters into a number of transactions with related parties. Odfjell considers these arrangements to be on reasonable market terms.
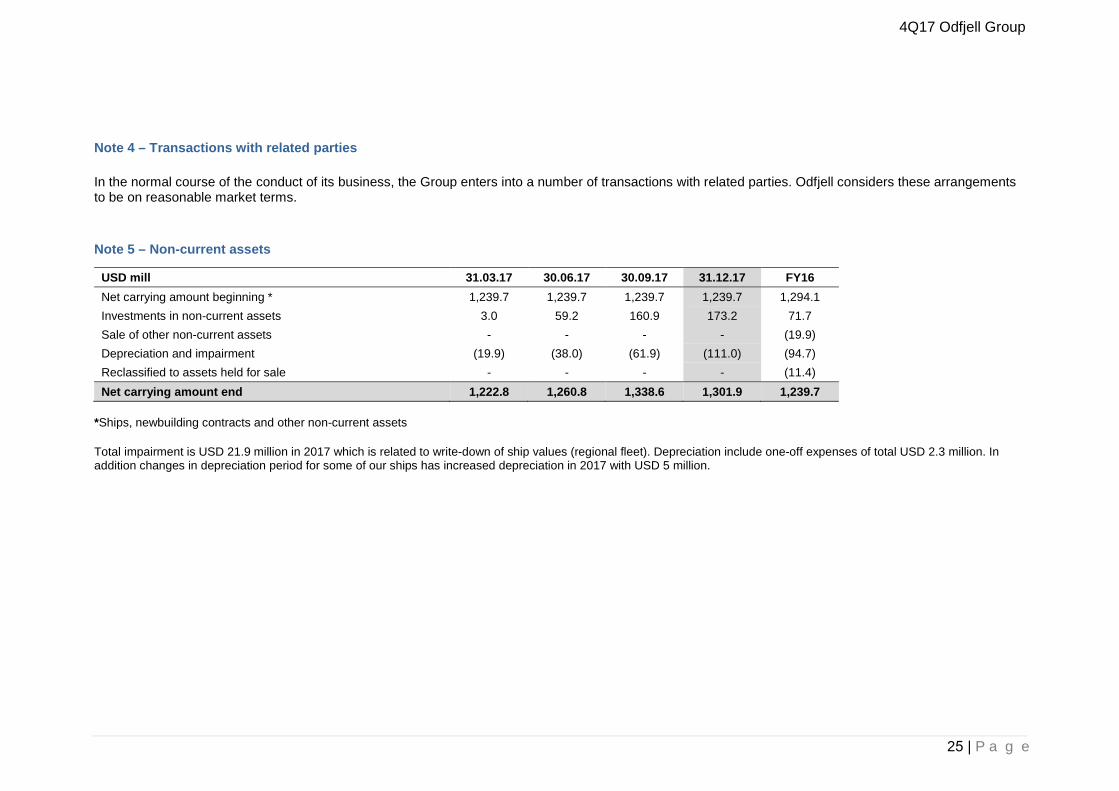
Note 5 – Non-current assets
USD mill 31.03.17 30.06.17 30.09.17 31.12.17 FY16 Net carrying amount beginning * 1,239.7 1,239.7 1,239.7 1,239.7 1,294.1 Investments in non-current assets 3.0 59.2 160.9 173.2 71.7 Sale of other non-current assets - - - - (19.9) Depreciation and impairment (19.9) (38.0) (61.9) (111.0) (94.7) Reclassified to assets held for sale - - - - (11.4) Net carrying amount end 1,222.8 1,260.8 1,338.6 1,301.9 1,239.7
*Ships, newbuilding contracts and other non-current assets
Total impairment is USD 21.9 million in 2017 which is related to write-down of ship values (regional fleet). Depreciation include one-off expenses of total USD 2.3 million. In addition changes in depreciation period for some of our ships has increased depreciation in 2017 with USD 5 million.

4Q17 Odfjell Group
26 | P a g e
Note 6 – Fair value and financial instruments
The Group classifies fair value measurements using a fair value hierarchy that reflects the significance of the inputs used in making the measurement. The measurement used by Odfjell is either level 1 or 2, where level 1 is quoted prices (unadjusted) in active markets for identical assets or liabilities that the entity an access at the measurement date, and level 2 are inputs other than quoted prices that are observable for the asset or liability, either directly or indirectly. For some non-derivative financial assets and liabilities we consider carrying amount to be the best estimate of fair value due to short maturity date and valid terms, i.e. current receivables and payables.
During 2017 there have been no transfers between levels of the fair value hierarchy. The Group accounts for transfers between levels of the fair value hierarchy from the date of the event or change in circumstances that caused the transfer.
Assets and liabilities which are measured at fair value in the Consolidated Statement of Financial Position and their level of the fair value hierarchy were as follows:
USD mill 31.12.17 Level 1
31.12.17 Level 2
31.12.16 Level 1
31.12.16 Level 2
Recurring fair value measurement Financial assets at fair value: Available-for-sale investments - - 9.9 - Derivative instruments – non hedging - 3.3 - 1.8Financial liabilities at fair value: Derivative instruments – non hedging - 21.9 - 40.8Derivative instruments – hedging - 2.0 - 1.5
4Q17 Odfjell Group
27 | P a g e
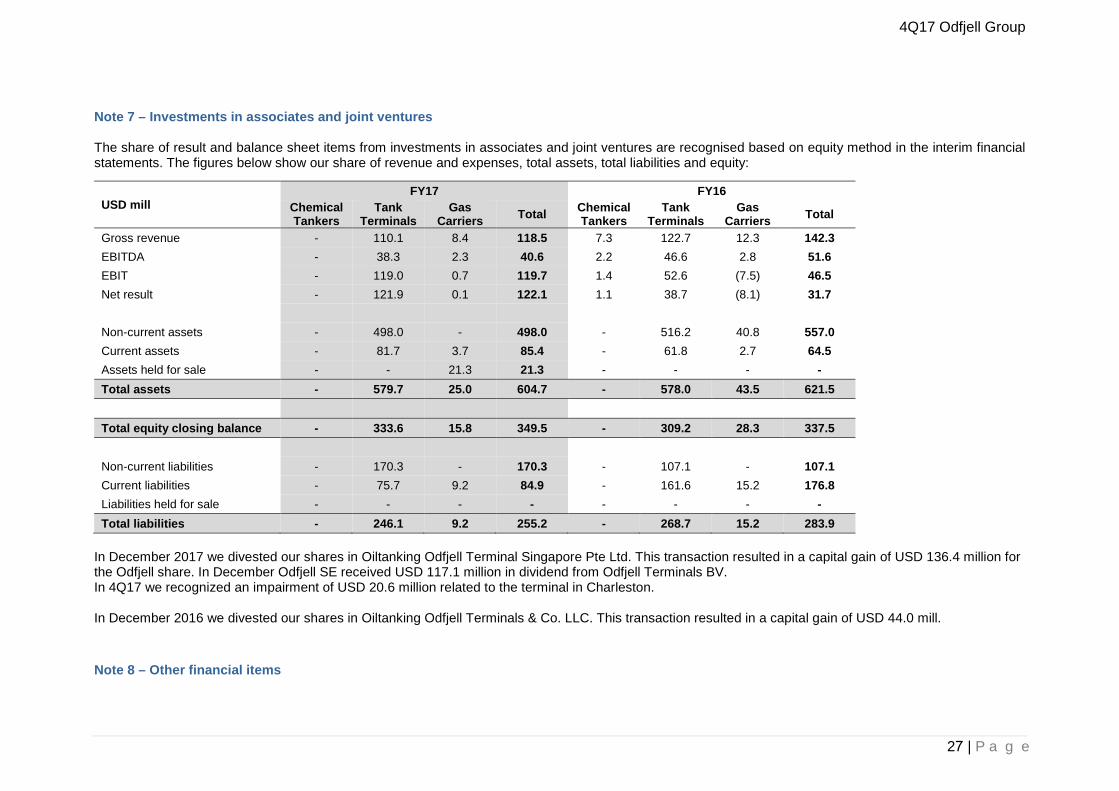
Note 7 – Investments in associates and joint ventures
The share of result and balance sheet items from investments in associates and joint ventures are recognised based on equity method in the interim financial statements. The figures below show our share of revenue and expenses, total assets, total liabilities and equity:
USD mill FY17 FY16
Chemical Tankers
Tank Terminals
Gas Carriers Total Chemical
Tankers Tank
Terminals Gas
Carriers Total
Gross revenue - 110.1 8.4 118.5 7.3 122.7 12.3 142.3 EBITDA - 38.3 2.3 40.6 2.2 46.6 2.8 51.6 EBIT - 119.0 0.7 119.7 1.4 52.6 (7.5) 46.5 Net result - 121.9 0.1 122.1 1.1 38.7 (8.1) 31.7
Non-current assets - 498.0 - 498.0 - 516.2 40.8 557.0 Current assets - 81.7 3.7 85.4 - 61.8 2.7 64.5 Assets held for sale - - 21.3 21.3 - - - - Total assets - 579.7 25.0 604.7 - 578.0 43.5 621.5
Total equity closing balance - 333.6 15.8 349.5 - 309.2 28.3 337.5
Non-current liabilities - 170.3 - 170.3 - 107.1 - 107.1Current liabilities - 75.7 9.2 84.9 - 161.6 15.2 176.8Liabilities held for sale - - - - - - - - Total liabilities - 246.1 9.2 255.2 - 268.7 15.2 283.9
In December 2017 we divested our shares in Oiltanking Odfjell Terminal Singapore Pte Ltd. This transaction resulted in a capital gain of USD 136.4 million for the Odfjell share. In December Odfjell SE received USD 117.1 million in dividend from Odfjell Terminals BV. In 4Q17 we recognized an impairment of USD 20.6 million related to the terminal in Charleston.
In December 2016 we divested our shares in Oiltanking Odfjell Terminals & Co. LLC. This transaction resulted in a capital gain of USD 44.0 mill.
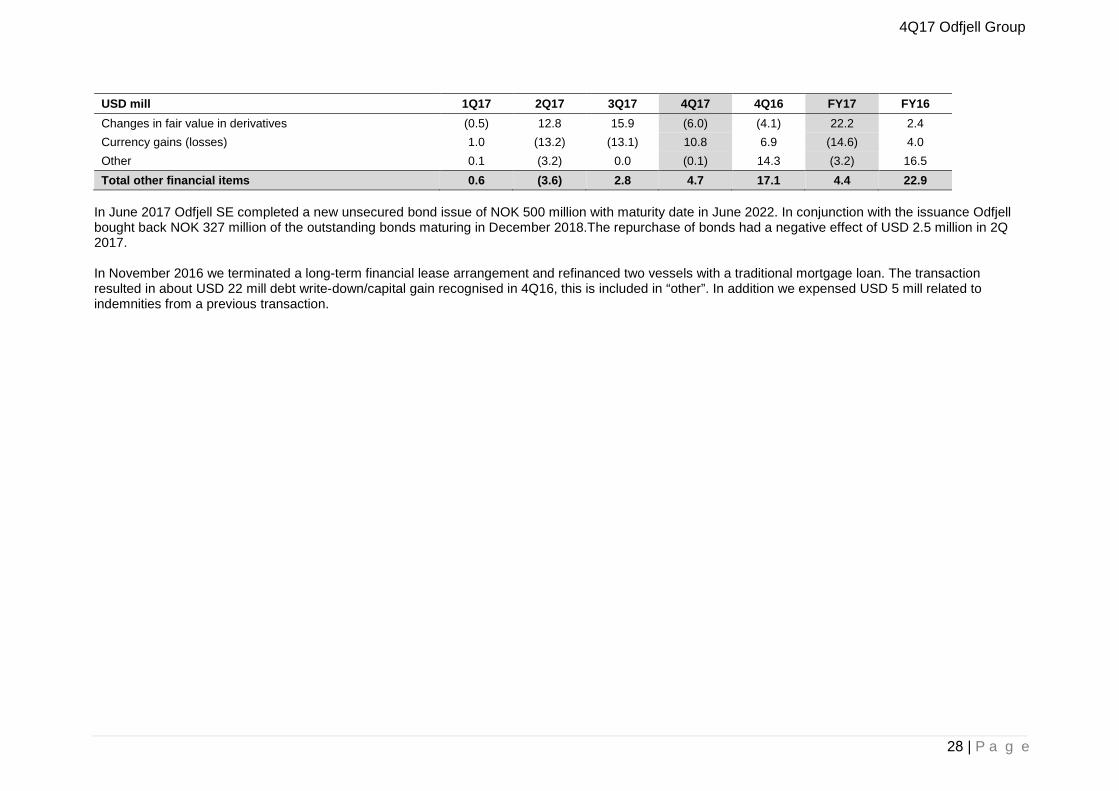
Note 8 – Other financial items
4Q17 Odfjell Group
28 | P a g e
USD mill 1Q17 2Q17 3Q17 4Q17 4Q16 FY17 FY16 Changes in fair value in derivatives (0.5) 12.8 15.9 (6.0) (4.1) 22.2 2.4 Currency gains (losses) 1.0 (13.2) (13.1) 10.8 6.9 (14.6) 4.0 Other 0.1 (3.2) 0.0 (0.1) 14.3 (3.2) 16.5 Total other financial items 0.6 (3.6) 2.8 4.7 17.1 4.4 22.9
In June 2017 Odfjell SE completed a new unsecured bond issue of NOK 500 million with maturity date in June 2022. In conjunction with the issuance Odfjell bought back NOK 327 million of the outstanding bonds maturing in December 2018.The repurchase of bonds had a negative effect of USD 2.5 million in 2Q 2017.
In November 2016 we terminated a long-term financial lease arrangement and refinanced two vessels with a traditional mortgage loan. The transaction resulted in about USD 22 mill debt write-down/capital gain recognised in 4Q16, this is included in “other”. In addition we expensed USD 5 mill related to indemnities from a previous transaction.
4Q17 Odfjell Group
29 | P a g e
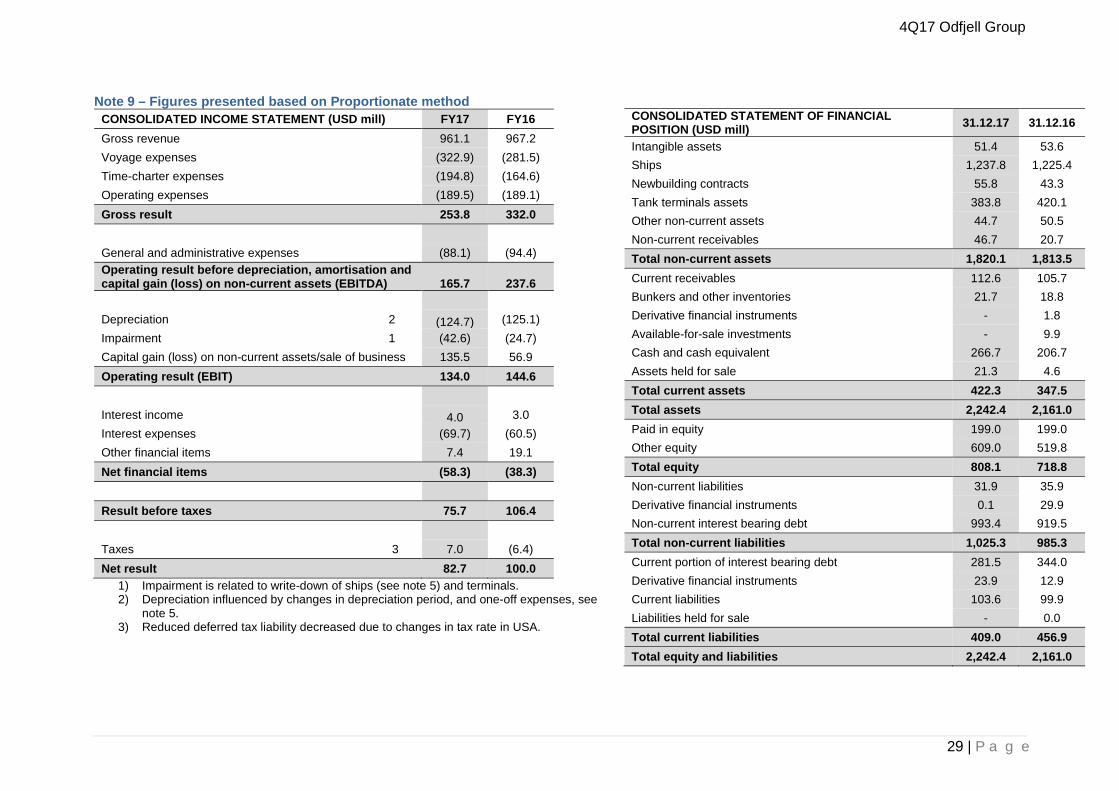
Note 9 – Figures presented based on Proportionate methodCONSOLIDATED INCOME STATEMENT (USD mill) FY17 FY16 Gross revenue 961.1 967.2 Voyage expenses (322.9) (281.5) Time-charter expenses (194.8) (164.6) Operating expenses (189.5) (189.1) Gross result 253.8 332.0
General and administrative expenses (88.1) (94.4) Operating result before depreciation, amortisation and capital gain (loss) on non-current assets (EBITDA) 165.7 237.6
Depreciation 2 (124.7) (125.1) Impairment 1 (42.6) (24.7) Capital gain (loss) on non-current assets/sale of business 135.5 56.9 Operating result (EBIT) 134.0 144.6
Interest income 4.0 3.0 Interest expenses (69.7) (60.5) Other financial items 7.4 19.1 Net financial items (58.3) (38.3)
Result before taxes 75.7 106.4
Taxes 3 7.0 (6.4) Net result 82.7 100.0
1) Impairment is related to write-down of ships (see note 5) and terminals.2) Depreciation influenced by changes in depreciation period, and one-off expenses, see
note 5. 3) Reduced deferred tax liability decreased due to changes in tax rate in USA.
CONSOLIDATED STATEMENT OF FINANCIAL POSITION (USD mill) 31.12.17 31.12.16
Intangible assets 51.4 53.6 Ships 1,237.8 1,225.4 Newbuilding contracts 55.8 43.3 Tank terminals assets 383.8 420.1 Other non-current assets 44.7 50.5 Non-current receivables 46.7 20.7 Total non-current assets 1,820.1 1,813.5 Current receivables 112.6 105.7 Bunkers and other inventories 21.7 18.8 Derivative financial instruments - 1.8Available-for-sale investments - 9.9Cash and cash equivalent 266.7 206.7Assets held for sale 21.3 4.6 Total current assets 422.3 347.5 Total assets 2,242.4 2,161.0 Paid in equity 199.0 199.0 Other equity 609.0 519.8 Total equity 808.1 718.8 Non-current liabilities 31.9 35.9 Derivative financial instruments 0.1 29.9 Non-current interest bearing debt 993.4 919.5 Total non-current liabilities 1,025.3 985.3 Current portion of interest bearing debt 281.5 344.0 Derivative financial instruments 23.9 12.9 Current liabilities 103.6 99.9 Liabilities held for sale - 0.0Total current liabilities 409.0 456.9 Total equity and liabilities 2,242.4 2,161.0

Fleet list as per 31 December 2017STAINLESS STAINLESS
CHEMICAL TANKERS BUILT DWT CBM STEEL, CBM TANKS OWNERSHIP CHEMICAL TANKERS BUILT DWT CBM STEEL, CBM TANKS OWNERSHIPBow Neon 2017 24 786 28 644 28 644 24 Leased Horin Trader 2015 19 856 22 129 22 129 18 Time charterBow Palladium 2017 24 764 29 041 29 041 24 Leased Gion Trader 2015 19 833 22 130 22 130 18 Time charter
Bow Firda 2003 37 427 40 645 40 645 47 Owned Southern Koala 2010 21 290 20 008 20 008 20 Time charterBow Chain 2002 37 518 40 621 40 621 47 Owned Southern Jaguar 2009 19 997 22 157 22 157 20 Time charterBow Fortune 1999 37 395 40 619 40 619 47 Owned Southern Ibis 2009 19 905 22 158 22 158 20 Time charterBow Flora 1998 37 369 40 515 33 236 47 Owned Celsius Mayfair 2007 19 999 21 714 21 714 20 Time charterBow Cecil 1998 37 369 40 515 33 236 47 Owned Flumar Maceio 2006 19 975 21 713 21 713 22 OwnedBow Faith 1997 37 479 41 487 34 208 52 Owned Celsius Manhattan 2006 19 807 22 143 22 143 22 Time charterBow Cardinal 1997 37 446 41 487 34 208 52 Owned Bow Fuji 2006 19 805 22 140 22 140 22 Time charterBow Jubail 1996 37 499 41 488 34 209 52 Bareboat Celsius Monaco 2004 19 999 11 986 11 986 20 Time charterBow Cedar 1996 37 455 41 488 41 488 52 Owned Celsius Mumbai 2005 19 993 22 186 22 186 22 Time charterBow Fagus 1995 37 375 41 608 34 329 52 Owned Moyra 2005 19 806 22 838 22 838 18 Time charterBow Mekka 1995 37 272 41 606 34 257 52 Bareboat Bow Santos 2004 19 997 21 846 21 846 22 OwnedBow Clipper 1995 37 221 41 596 34 328 52 Owned Kristin Knutsen 1998 19 152 19 409 19 409 34 Time charterBow Riyad 1995 37 221 41 492 34 213 52 Bareboat Gwen 2008 19 702 21 651 21 651 26 Time charterBow Flower 1994 37 221 41 492 34 213 52 Owned Bow Triumph 2014 49 622 53 188 0 22 Owned
Bow Trident 2014 49 622 53 188 0 22 OwnedBow Saga 2007 49 559 52 126 52 126 40 Owned Bow Tribute 2014 49 622 53 188 0 22 LeasedBow Sea 2006 49 592 52 107 52 107 40 Owned Bow Trajectory 2014 49 622 53 188 0 22 LeasedBow Sirius 2006 49 539 52 155 52 155 40 Owned Bow Elm 2011 46 098 48 698 0 29 OwnedBow Summer 2005 49 592 52 128 52 128 40 Owned Bow Lind 2011 46 047 48 698 0 29 OwnedBow Sky 2005 49 479 52 126 52 126 40 Leased Flumar Brasil 2010 51 188 55 452 0 14 OwnedBow Star 2004 49 487 52 127 52 127 40 OwnedBow Spring 2004 49 429 52 127 52 127 40 Owned Bow Pioneer 2013 75 000 86 000 0 30 OwnedBow Sun 2003 42 459 52 127 52 127 40 Owned
Bow Oceanic 1997 17 460 19 616 19 616 24 OwnedBristol Trader 2016 35 863 38 315 37 549 18 Time charter Bow Atlantic 1995 17 460 19 588 19 588 24 OwnedBow Hector 2009 33 694 37 384 37 384 16 Time charter Bow Condor 2000 16 121 17 622 17 622 30 OwnedBow Tone 2009 33 625 37 974 37 974 16 Time charter Bow Andes 2000 16 020 17 120 17 120 22 OwnedBow Compass 2009 33 609 37 994 37 994 16 Owned SG Pegasus 2011 13 086 14 523 14 523 16 Time charterBow Heron 2008 33 707 37 365 37 365 16 Time charter Stellar Wisteria 2011 12 601 14 715 14 715 18 Time charterBow Sagami 2008 33 641 38 000 38 000 16 Time charter Stellar Orchid 2011 12 571 14 713 14 713 18 Time charterBow Kiso 2008 33 641 37 974 37 974 16 Time charter Marex Noa 2015 12 478 14 067 14 067 16 Time charterBow Harmony 2008 33 619 38 052 38 052 16 Leased Bow Querida 1996 10 106 11 181 11 181 18 OwnedBow Engineer 2006 30 086 36 274 36 274 28 Leased Bow Asia 2004 9 901 11 088 11 088 20 BareboatBow Architect 2005 30 058 36 290 36 290 28 Leased Bow Singapore 2004 9 888 11 089 11 089 20 BareboatSouthern Owl 2016 26 057 27 656 27 656 26 Time charter Bow Nangang 2013 9 156 10 523 10 523 14 OwnedSouthern Puma 2016 26 057 27 079 27 079 24 Time charter Bow Dalian 2012 9 156 10 523 10 523 14 OwnedRT Star 2011 26 199 27 912 27 912 18 Time charter Bow Fuling 2012 9 156 10 523 10 523 14 OwnedSouthern Quokka 2017 26 077 29 049 29 049 24 Time charter Sun Triton 2017 12 670 13 228 13 228 16 Time charter
Total Chemical Tankers: 76 2 301 653 2 516 612 1 991 397 2 147
STAINLESS3rd party* BUILT DWT CBM STEEL, CBM TANKSCTG Argon 2017 24 761 17 139 17 139 24 PoolSC Taurus 2017 40 964 26 364 26 364 30 Commercial ManagementSC Scorpio 2017 40 964 26 364 26 364 30 Commercial Management
Total 3rd party: 3 106 689 69 867 69 867 84
* Pool participation and commercial management
STAINLESSSUMMARIZED NUMBER DWT CBM STEEL, CBM TANKS
Owned 35 1 246 725 1 360 441 964 275 1 193Time charter 28 631 111 682 605 681 838 554Leased 8 292 036 326 803 220 427 204Bareboat 5 131 781 146 764 124 857 196Pool 1 24 761 17 139 17 139 24Commercial Management 2 81 928 52 728 52 728 60 Total Chemical Tankers: 79 2 408 342 2 586 479 2 061 264 2 231

NEWBUILDINGS ON ORDER:STAINLESS
CHEMICAL TANKERS NUMBER DWT CBM STEEL, CBM TANKS DELIVERYChina Shipbuilding Trading Co., Ltd/ 4 49 000 54 600 54 600 33 2019 - 2020Hudong-Zhonghua Shipbuilding (Group) Co., Ltd 2 38 000 45 000 45 000 40 2020AVIC Dingheng / CTG* 3 25 000 27 100 27 100 24 2017-2018Shin-Kurushima 2 35 500 37 300 37 300 28 2018-2019Asakawa 1 26 057 27 656 27 656 26 2018Undisclosed 2 36 000 40 000 40 000 28 2019-2020Total newbuildings: 14 516 057 571 956 571 956 422
*In addition Chemical Transportation Group, Inc (CTG) continue to own 4 sister vessels which will be placed in a pool managed by Odfjell Tankers
GAS CARRIERS BUILT DWT CBM TYPE TANKS OWNERSHIPBow Gallant 2 008 10 282 8 922 LPG/Ethylene 2 PoolBow Guardian 2 008 10 282 8 922 LPG/Ethylene 2 PoolTotal Gas Carriers: 2 20 564 17 844 4
FLEET CHANGES SINCE LAST QUARTER: STAINLESS FLEET CHANGES AFTER 31 DECEMBER 2017: STAINLESSBUILT DWT CBM STEEL, CBM TANKS OWNERSHIP MONTH BUILT DWT CBM STEEL, CBM TANKS OWNERSHIP MONTH
Fleet additions; Fleet additions;SC Taurus 2017 40 964 26 364 26 364 30 Commercial Management December SC Aquarius 2016 40 901 26 364 26 364 30 Commercial Management JanuarySC Scorpio 2017 40 964 26 364 26 364 30 Commercial Management December Bow Platinum 2017 25 000 16 000 16 000 24 Leased JanuaryCTG Argon 2017 24 761 17 139 17 139 24 Pool December SC Virgo 2017 40 870 26 568 26 568 30 Commercial Management January
Southern shark 2018 25 500 14 965 14 965 26 Time charter JanuaryFleet disposals; SC Hercules 2017 40 900 26 364 26 364 30 Bareboat JanuaryCelsius Miami 2005 19 991 22 192 22 192 22 Time charter December SC Gemini 2017 40 895 26 364 26 364 30 Pool February
SC Draco 2016 40 924 26 364 26 364 30 Pool FebruaryCTG Cobalt 2018 25 000 17 139 17 139 24 Pool FebruaryCTG Mercury 2019 25 000 17 139 17 139 24 Pool February
Fleet disposals;Celsius Monaco 2004 19 999 11 986 11 986 20 Time charter JanuaryBow Heron 2008 33 707 38 000 38 000 16 Time charter JanuarySouthern Ibis 2009 19 905 22 158 22 158 20 Time charter JanuarySouthern Jaguar 2009 19 997 11 757 11 757 20 Time charter February
Bareboat
OWNERSHIPOwned/leased
LeasedLeased
Time charterTime charter
4Q17 Odfjell Group
30 | P a g e
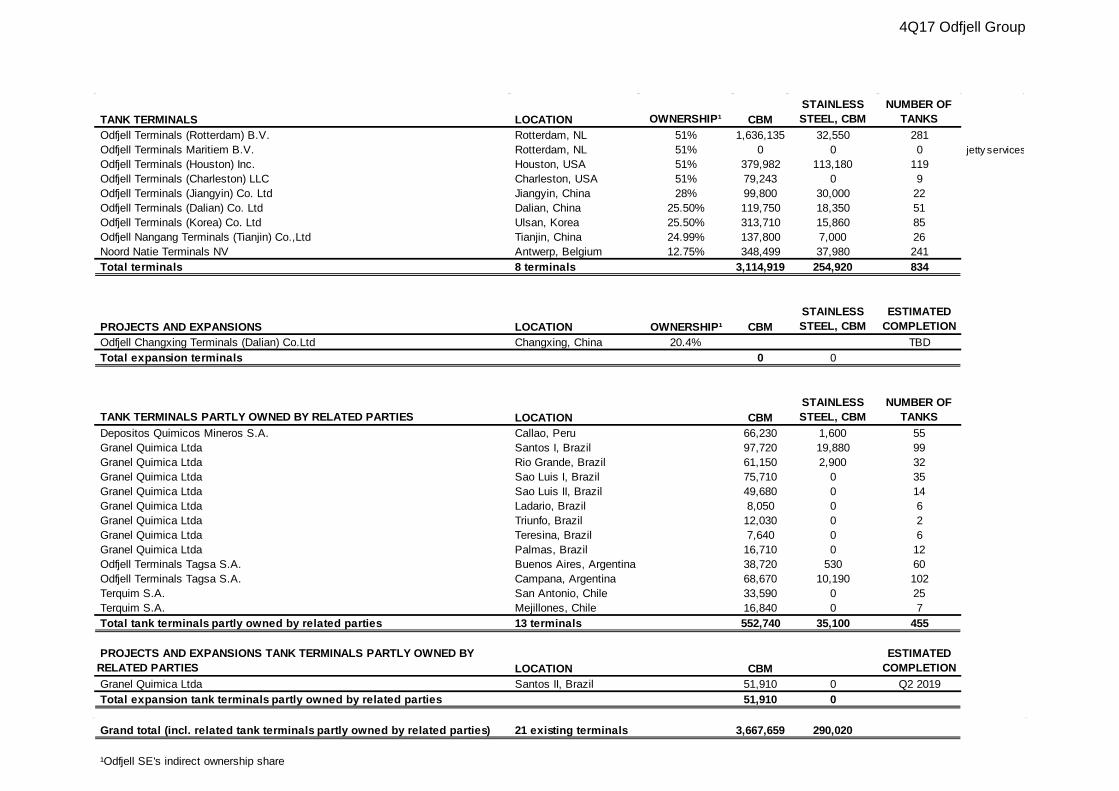
TANK TERMINALS LOCATION OWNERSHIP¹ CBMSTAINLESS STEEL, CBM
NUMBER OF TANKS
Odfjell Terminals (Rotterdam) B.V. Rotterdam, NL 51% 1,636,135 32,550 281Odfjell Terminals Maritiem B.V. Rotterdam, NL 51% 0 0 0 jetty servicesOdfjell Terminals (Houston) Inc. Houston, USA 51% 379,982 113,180 119Odfjell Terminals (Charleston) LLC Charleston, USA 51% 79,243 0 9Odfjell Terminals (Jiangyin) Co. Ltd Jiangyin, China 28% 99,800 30,000 22Odfjell Terminals (Dalian) Co. Ltd Dalian, China 25.50% 119,750 18,350 51Odfjell Terminals (Korea) Co. Ltd Ulsan, Korea 25.50% 313,710 15,860 85Odfjell Nangang Terminals (Tianjin) Co.,Ltd Tianjin, China 24.99% 137,800 7,000 26Noord Natie Terminals NV Antwerp, Belgium 12.75% 348,499 37,980 241Total terminals 8 terminals 3,114,919 254,920 834
PROJECTS AND EXPANSIONS LOCATION OWNERSHIP¹ CBMSTAINLESS STEEL, CBM
ESTIMATED COMPLETION
Odfjell Changxing Terminals (Dalian) Co.Ltd Changxing, China 20.4% TBDTotal expansion terminals 0 0
TANK TERMINALS PARTLY OWNED BY RELATED PARTIES LOCATION CBMSTAINLESS STEEL, CBM
NUMBER OF TANKS
Depositos Quimicos Mineros S.A. Callao, Peru 66,230 1,600 55Granel Quimica Ltda Santos I, Brazil 97,720 19,880 99Granel Quimica Ltda Rio Grande, Brazil 61,150 2,900 32Granel Quimica Ltda Sao Luis I, Brazil 75,710 0 35Granel Quimica Ltda Sao Luis II, Brazil 49,680 0 14Granel Quimica Ltda Ladario, Brazil 8,050 0 6Granel Quimica Ltda Triunfo, Brazil 12,030 0 2Granel Quimica Ltda Teresina, Brazil 7,640 0 6Granel Quimica Ltda Palmas, Brazil 16,710 0 12Odfjell Terminals Tagsa S.A. Buenos Aires, Argentina 38,720 530 60Odfjell Terminals Tagsa S.A. Campana, Argentina 68,670 10,190 102Terquim S.A. San Antonio, Chile 33,590 0 25Terquim S.A. Mejillones, Chile 16,840 0 7Total tank terminals partly owned by related parties 13 terminals 552,740 35,100 455
PROJECTS AND EXPANSIONS TANK TERMINALS PARTLY OWNED BY RELATED PARTIES LOCATION CBM
ESTIMATED COMPLETION
Granel Quimica Ltda Santos II, Brazil 51,910 0 Q2 2019Total expansion tank terminals partly owned by related parties 51,910 0
Grand total (incl. related tank terminals partly owned by related parties) 21 existing terminals 3,667,659 290,020
¹Odfjell SE's indirect ownership share
ODFJELL SE - Conrad Mohrs veg 29, P.O. Box 6101 Postterminalen - 5892 Bergen, Norway Tel: +47 55 27 00 00 - Fax: +47 55 28 47 41 - E-mail: [email protected] - Org. no: 930 192 503
Odfjell.com
Contact information:
Investor Relations: Bjørn Kristian Røed| Tel: +47 55 27 47 33 | Mobile: +47 40 91 98 68 | E-mail: [email protected] Contact: Anngun Dybsland | Tel: + 47 55 27 46 41 | Mobile: + 47 41 54 88 54 |E-mail: [email protected]


