66
PRELIMINARY RESULTS PRESENTATION YEAR ENDED 31 MARCH 2010 www.britishland.com
| Date post: | 04-Jun-2018 |
| Category: |
Documents |
| Upload: | truongtram |
| View: | 216 times |
| Download: | 0 times |

PRELIMINARY RESULTSPRESENTATIONYEAR ENDED 31 MARCH 2010 www.britishland.com

CHRIS GRIGGChief Executive

3
Today’s Agenda
Chris Grigg Overview
Graham Roberts Financial Performance
Steve Smith Portfolio & Market Outlook
Chris Grigg Looking Forward

4
Strong Recovery In Valuation
Portfolio Valuation Movement1
‐5
0
5
10
15
20
1H 2H FY
British Land
Annual Capital Return vs. IPD2
0
2
4
6
8
10
12
14
16
18
Retail Offices Total Portfolio
British Land IPD
1 Valuation movement (net of capital expenditure) of properties held at the balance sheet date2 Calculated by IPD for UK assets on average capital employed and excluding capitalised interest
+16.0%
+13.5%
‐2.1%
change (%) YoY change (%)

5
Strong NAV Growth And Total Returns
Q4 FY
Y/E 31 Mar 2009 2010 2009 2010
Net Asset Value1 £3,387m £4,407m £3,387m £4,407m
Net Asset Value1 per share 398p 504p 398p 504p
Underlying Profit Before Tax2 £61m £62m £268m £249m
Underlying Diluted EPS2 8.7p 7.0p 41.0p 28.4p
Dividend per share 6.5p 6.5p 29.8p 26.0p
Total Return +16.6% +33.5%
1 EPRA (European Public Real Estate) basis2 Excluding gains on property revaluations & disposals, and intangible asset movements

6
Retail: Performance Highlights
• Leasing activity up 30%
• Average length of new leases broadly in line with portfolio
• £12m added to rent roll in 09/10
• Occupancy levels increased from 98% to 99%1
• Tenants in administration down from 2.2% to 0.6%
• Improving rental value trends
New Lettings, Renewals and Rent Reviews
Y/E 31 Mar 2010 New Lettings
Renewals Reviews Total
Number 255 121 224 600
Sq ft (’000s) 864 977 3,593 5,434
Lease to first break (yrs) 9.9 14.5 n/a n/a
Annual Rent Increase £5.5m ‐£1.5m £7.7m £11.7m
1 Includes accommodation subject to asset management and under offer

7
Offices: Performance Highlights
• Occupancy levels 93%1
• Over 1m sq ft of developments completed: substantially let or sold
• Deals accretive to value: rents at 9% premium to ERV
• £25m added to rent roll in 09/10
Lettings of Buildings Completed in 2009/10
As at 31 Mar 2010 Sq ft (’000s)
Let Lease to 1st Break
ContractedRent (£m)
Of which let in 09/10 (£m)
Ropemaker Place, EC2 594 91% 16.3 years 25 15
Regent’s Place –10 & 20 Triton Street
3762 59% 15.8 years 10 10
Total 9702 77% 16.1 years 35 25
1 Includes accommodation subject to asset management and under offer2 Excludes residential units sold in 08/09

8
Asset Disposals Improve Portfolio Balance
Disposals• £1.3bn1
Retail• Reduced exposure to declining high street
locations• Sale of £84m1 mature/low growth retail
warehouses
Offices• Reduced exposure to large single assets • Greater ability to trade City cycles• Improved balance between City & West End
Property Disposals in 2009/10
BL Share £m
Broadgate JV 1,066
20 Department Stores & Shops 144
9 Retail Parks 84
Other 18
Total 1,312
1 BL share

9
Excellent Investments In Retail And Offices
• £247m1 of investments in retail and office sectors
• Potential to add value through asset management and development
− 50% stake in Tesco JV at Surrey Quays & Clifton Moor
− Sainsbury’s, Macclesfield
− 39 Victoria Street
• £29m on 2‐14 Baker Street (post year end)
1 BL share

10
New Developments Create Further Value
Regent’s Place (NEQ)• 500,000 sq ft1
• £232m development cost2
• Completion 2013
2‐14 Baker Street• 139,000 sq ft• £79m development cost2
• Completion 2013
4 & 6 Broadgate• c.700,000 sq ft• c.£175m development cost2,3
• Target completion 2014
1 Includes 120,000 sq ft of residential2 Cost to complete (excluding land and notional interest)3 BL Share – detailed cost, areas and planning subject to agreement and planning

11
Strengthened Management Team
Graham RobertsFinance Director
Steve SmithChief Investment
Officer
Tim RobertsHead of Offices
Charles MaudsleyHead of Retail and
Business Development
Chris GriggChief Executive

GRAHAM ROBERTSFinance Director

13
Financial Review
• 13.5%1 portfolio valuation uplift driving NAV2 growth of 27% to 504p
• Underlying profits3 down 7% to £249m, reflecting disposals and completion of new developments
• 2009/10 dividend of 26p – maintained for 2010/11
• Lower gearing at 47% LTV with investment capacity
1 Valuation movement (net of capital expenditure) for properties held at the balance sheet date, including developments and purchases2 EPRA basis3 Excludes gains on property revaluations and disposals, and intangible asset movements

14
Gross Asset Value
Reconciliation of Gross Asset Value
0
2
4
6
8
10
2009 Broadgate JV Disposals Investment Revaluations 2010
Equity Financed Debt Financed
Portfolio£8.6bn
Portfolio£8.5bn
Gross Asset Value (£bn)

15
Net Asset Value Per Share 504p
Reconciliation of Net Asset Value1 NAV Growth
Q42010
FY2010
NAV per share growth 15.1% 26.6%
Drivers of Valuation Increase
Q42010
FY2010
Valuation increase 7.5% 13.5%
Initial yield compression 33 bps 75bps
ERV growth2 1.2% ‐6.2%0
1
2
3
4
5
2009 Disposals RetainedEarnings
Revaluations 2010
£3.4bn
£4.4bn
1 EPRA basis2 Standing investments like for like, IPD basis (excluding Europe)
Net Asset Value (£bn)

Retail Performance
• Portfolio outperformed IPD by 4.8% (Q4 by 1.7%)1
• £4m pa2 of new rent from lettings & rent reviews in Q4
• Pace of ERV decline slowed in Q4 to ‐0.2%
16
Retail Performance
Y/E 31 Mar 2010 Value
£m
Increase ERVGrowth
%3
Initial yieldcompression
Top‐up initial yield4£m %
Retail warehouses 2,675 345 14.8 ‐3.7 122 bps 6.3%
Superstores 1,302 202 18.4 1.2 87 bps 5.5%
Shopping centres 1,189 36 3.2 ‐5.7 15 bps 7.0%
Department stores 436 77 21.5 ‐9.0 103 bps 6.9%
All Retail 5,602 660 13.4 ‐3.7 90bps 6.3%
1 BL capital return relative to IPD (calculated by IPD)2 Increase in BL share of net effective rent (taking into account tenant incentives)3 Standing investments like for like, IPD basis (excluding Europe)4 Gross yield (without notional purchaser’s costs), adding back rent frees and contracted rental uplifts

17
1 BL capital return relative to IPD (calculated by IPD)2 Increase in BL share of net effective rent (taking into account tenant incentives)3 Standing investments like for like, IPD basis (excluding Europe)4 Gross yield (without notional purchaser’s costs), adding back rent frees and contracted rental uplifts5 Principally development land
Office Performance
• Portfolio outperformed IPD by 3.8% (Q4 by 5.3%)1
• £66m valuation uplift in Q4 from lettings agreed above ERV
• £20m pa2 of new rent from lettings & rent reviews in Q4
Office Performance
Y/E 31 Mar 2010 Value
£m
Increase ERVGrowth
%3
Initial yieldcompression
Top‐up initial yield4£m %
City 1,735 203 13.3 ‐9.3 29 bps 7.3%
West End 967 132 15.8 ‐8.0 51 bps 6.1%
Provincial 34 (1) ‐2.3 n/a5 n/a5 n/a5
All Office 2,736 334 13.9 ‐8.0 37 bps 6.9%

18
Underlying Profit Before Tax
0
50
100
150
200
250
Q1 ‐ Q3 Q4 Full Year
Summary Income Statement1
Q4 2010£m
FY 2010£m
Gross rental income 132 561
Property outgoings (6) (16)
Fees & other income 8 15
Admin expenses (16) (65)
Net interest costs2 (56) (246)
Underlying Profit 62 249
1 With proportional consolidation of Funds & Joint Ventures2 Interest capitalised on developments £13m (Q4: £nil)
£249m
£187m
£62m
Underlying Profit Before Tax £249m (Q4: £62m)
£m

191 With proportional consolidation of Funds & Joint Ventures
Summary Income Statement1
Year ended 31 Mar 2009 2010
Gross rental income 650 561
Property outgoings (52) (16)
Fees & other income 20 15
Administrative expenses (58) (65)
Net interest costs (292) (246)
Underlying Profit 268 249
Underlying EPS 41.0 28.4p
Dividend per share 29.8p 26.0p
Reconciliation of Underlying Profit1
Underlying Profit – Y/E 31 Mar 2009 268
Credit risk provision 17
Share incentive write back (7)
Y/E 31 Mar 2009 ‐ adjusted 278
Disposals less acquisitions(Broadgate £12m & Meadowhall £8m)
(33)
Rent reviews, new lettings and renewals 14
Lease determinations & expiries (7)
Developments (22)
Impact of rights issue proceeds 8
Current year release of credit provision 16
Management & performance fees (5)
Underlying Profit – Y/E 31 Mar 2010 249
Income Statement

20
Analysis of Gross Rental Income1
Year ended 31 Mar 2009 2010
Properties owned throughout2
Retail
Offices
Other
Total – like for like
270
111
4
385
275
110
5
390
+ 2.1%
‐ 0.4%
+2.6%
+ 1.4%
Fixed & minimum uplifts3 63 63
Acquisitions 4 22
Disposals 183 63
Developments 11 19
Other4 4 4
Total 650 561 ‐ 13.7%
1 With proportional consolidation of Funds & JVs2 Investment properties subject to open market reviews and owned throughout the current and comparative periods 3 Rental income from fixed and minimum guaranteed rent reviews is recognised on a straight line basis4 Includes surrender premiums, asset management determinations, back rents and other accounting adjustments
Rental Income Growth
• Gross rental income down 13.7%
• 1.4% like for like income growth
− Retail warehouses up 3.7%
− Superstores up 3.1%
− West End offices up 2.1%
− City offices down 1.2%
− Shopping centres down 2.2%

21
Analysis of Gross Reversion1 – Cash & Accounting basis
£m pa Cash flow basis
Accounting basis
Annualised rents 485
524Expiry of rent frees and fixed/minimum uplifts
61
Total contracted 546 524
Letting of current vacant space
23 19
Rent reviews 8 8
Gross reversion 577 551
• High quality existing income flow
• Only 7% of rent expiring over next 3 years
• Gross reversion of £577m (or £551m on accounting basis) excludes:
− Future lettings & lease renewals
− Future rental growth
− Future investment
− c.£500m of developments
Future Income Growth Potential
1 Within 5 years – includes rent reviews and letting of vacant space at current ERV (as determined by external valuers)

22
Dividends
• Q4 Dividend 6.5p1, giving 26p for full year
• Full year 2010/11 dividend of 26p reflecting
− Strong income profile from prime portfolio
− Embedded growth potential from lettings and asset management
− Future earnings growth from capital recycling and investments
• Approach remains to pass income through to investors consistent with sustainable rental growth
FY 2010 Dividend Cover
On Earnings 1.1x
On cash profits2 0.9x
Cash dividend (i.e. exc. scrip) on cash profits2,3
1.4x
1 Property Income Distribution (PID) of the cash dividend is nil2 Underlying EPS less spreading of tenant incentives & guaranteed rent increases, and non‐cash administrative expenses3 40% scrip take up for last 4 quarters

231 With proportional consolidation of Funds & JVs (unless stated as Group)2 Annualised rent plus expiry of rent frees & contracted rental increases (net of lease expiries)
Financing statistics
As at 31 Mar1 2009 2010
Portfolio valuation £8.6bn £8.5bn
EPRA Net debt £4.9bn £4.1bn
LTV 57% 47%
LTV ‐ Group 46% 25%
Average debt maturity 12.7 years 11.1 years
Group debt maturing over the next 3 years
£531m £431m
Committed undrawn facilities – Group
£3.0bn £2.9bn
Strong Balance Sheet And Liquidity
Prime assets
• Retail occupancy 99%
• Office occupancy 93%
• High % of modern buildings
• 13 years average lease length
• 98% of current rent contracted in 3 years time
Finance
• Long average debt maturity
• Broad sources of existing drawn debt
• Substantial committed undrawn facilities
• Improving trend for lending markets
Gearing policy adapted to market cycles –maximum 55% LTV

STEVE SMITHChief Investment Officer

25
Retail: Strong Demand For Large Flexible Formats
• Large retailers significantly increase market share
• Increased competition and margin pressure
IPD income growth – last 5 years3 % pa
Retail Parks +4.1%
Superstores +5.3%
Shopping Centres +1.8%
High Street shops +1.1%
All Retail +2.8%
• Concentration of sales in fewer larger formats
• 50% of retail sales in 200 locations in 1971 vs 90 locations in 20082
• Polarisation of performance between different formats and locations
1 ONS2 CBRE3 IPD Quarterly Index
15%
20%
25%
30%
35%
40%
45%
88 90 92 94 96 98 00 02 04 06 08
Share of all UK Retail Sales1
Large Food Retailers
Small Retailers
Large Non‐Food Retailers
% All Retail Sales

26
Meeting Retailer And Consumer Needs: Glasgow Fort
• Premier 390,000 sq ft open A1 fashion park built in 2005
• Well located, adjacent to M8
• Convenient out of town location
• Flexible and low cost
− Average rent at £39psf
− Average ERV at £43psf

27
Meeting Retailer And Consumer Needs: Glasgow Fort
• High occupancy rate 97%
• Income growth of 7.4% pa since 2005
• Annual footfall of c.13m
• 10 new lettings in 09/10 at 4% above ERV
• 175,000 sq ft consented extensions, 80,000 sq ft M&S pre let
Food Outlets4%
General Retail 17%
Fashion & Footwear
50%
Other 7%
Strong Mix of 67 High Quality Occupiers
Health & Beauty 10%
Home, Books, Entertainment
13%

28
Offices: Demand For Modern Working Environment
Average City Development Size1
0
25
50
75
100
125
150
175
82 85 88 91 94 97 00 03 06 09
City & West End Take‐up1
0
3
6
9
12
FY 05 FY 06 FY 07 FY 08 FY 09 Q1 10
Other Grade A
1 Jones Lang LaSalle
’000 sq ft m sq ft

29
Meeting Office Occupiers Needs: Regent’s Place
• 1.2 m sq ft of mixed office and retail
• Further 500,000 sq ft: starting soon
• Good infrastructure (national rail/6 tube lines)
30
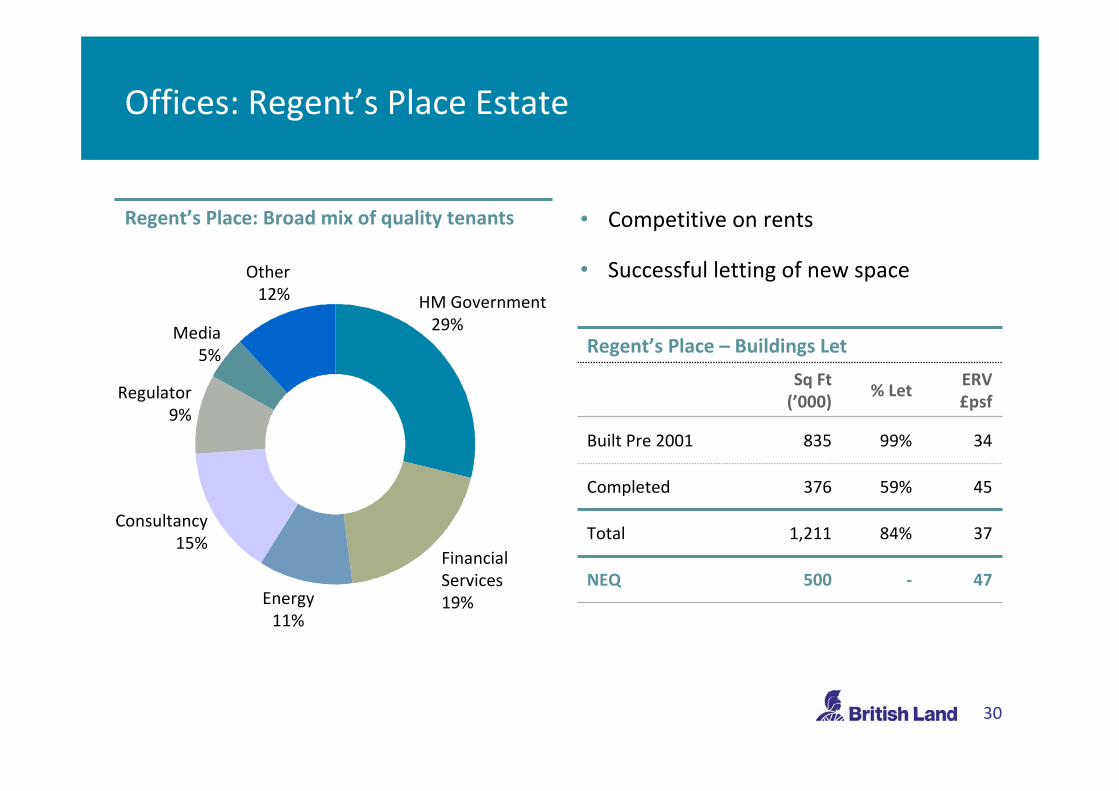
Offices: Regent’s Place Estate
• Competitive on rents
• Successful letting of new space
Regent’s Place – Buildings Let
Sq Ft(’000)
% LetERV£psf
Built Pre 2001 835 99% 34
Completed 376 59% 45
Total 1,211 84% 37
NEQ 500 ‐ 47
Regent’s Place: Broad mix of quality tenants
HM Government29%
FinancialServices19%Energy
11%
Consultancy15%
Regulator9%
Media5%
Other12%

31
Offices: Benefiting From Demand For Modern Space
• Average age 15 years versus 32 for IPD
• 37% of portfolio less than 5 years old (IPD: 9%, exc. BL)
• High occupancy and long lease length
• Strong letting performance in 2009/10
− BL lettings = 10% of all Grade A lettings
− Rents achieved at 11% above ERV
British Land Office Portfolio vs IPD
At 31 Mar 2010 Average Age
Occupancy Rate
Lease Length
British Land 15 years 93% 9.6 years
IPD 32 years 88% 7.2 years

32
Capital Recyling To Strengthen The Portfolio
• Reduced exposure to the high street
• Sold low growth, mature properties
• Reduced exposure to large assets through joint ventures
• Focused portfolio on properties most likely to deliver future income and capital growth
Portfolio Weighting by Value
As at 31 Mar 2005 2010
High Street Shops 10% 5%
Retail Warehouses 13% 32%
Superstores 12% 15%
Shopping Centres 19% 14%
City Offices 31% 20%
West End Offices 5% 11%
Other 10% 3%

33
Portfolio Positioned For Growth
ERV Growth Forecasts by Sector1
0 2 4 6 8 10
Industrial
Provincial offices
West End offices
City offices
Shops
Shopping Centres
Superstores
Retail Parks
YOY Change (%) ‐ next 5 years
BL Sector Weightings Relative to IPD
‐15 ‐10 ‐5 0 5 10 15 20
Industrial
Provincial offices
West End offices
City offices
Shops
Department Stores
Shopping Centres
Superstores
Retail Parks
1 PMA Spring 2010 forecast

34
Offices: A Shift In Emphasis
• City offices volatile
− Supply/demand dynamic impacted by Canary Wharf
− Adopting a more tactical strategy
• West End greater long‐term growth potential
− Increase weighting over time
− Adopting long‐term strategy

35
Market Outlook: Shortage Of Prime London Office Space
0
2
4
6
2010 2011 2012 2013 2014 2015
City West End
0
2
4
6
8
10
12
14
16
85 87 89 91 93 95 97 99 01 03 05 07 09 11 130
2
4
6
8
10
12
14
16
18
20
Available u/c
Completed
Vacancy %
%
Central London Development & Vacancy1
(m sq ft)City & West End Lease Expiries1
(m sq ft)
1 Drivers Jonas Deloitte

36
Market Outlook: Retail Polarising Between Key Locations And The Rest
• Weak consumer demand – impact of fiscal measures
• Overall retail rents expected to
− decline in 2010
− grow by 2.6% pa1 between 2011 and 2015
• Continued demand for key locations
• British Land portfolio well positioned to deliver rental and value growth
1 PMA Spring 2010 forecast

37
Market Outlook: Investment Opportunities
• Shortage of prime with significant investor demand
• Distressed assets beginning to come to market but generally poor quality
• Secondary values set to move out
• Continuing to screen significant number of opportunities
• Better value where assets require repositioning

38
Future Income Potential
• Reversionary potential ahead of IPD
• Additional reversionary potential from above market ERV growth
Reversionary Profile compared with IPD1
‐10% 0% 10% 20% 30%
IPD
British Land
Over‐renting < 5yrs Over‐renting > 5 yrs Rent FreesReversions < 5yrs Vacancies Reversions > 5yrsDevelopments
1 As calculated by IPD

39
Future Potential From Developments
Potential Retail Extensions
Sq ft (’000)
BLShare
Whiteley Village 322 50%
Glasgow Fort 175 36%
Broughton Park 140 36%
Fort Kinnaird 110 16%
Total 747
Office Developments
Sq ft (’000s)
Development Cost1
Total Cost2,3Current ERV £psf4
Completion
Baker Street 139 £79m £100m 68 2013
NEQ, Regent’s Place 500 £232m £294m 47 2013
Broadgate c.700 c.£175m c.£250m n/a5 2014
1 Including residential 2 BL Share3 Including land and notional interest 4 Current estimated headline rent (excluding provision for tenants’ incentives)5 Non‐binding Heads of Terms agreed with UBS for pre‐let of entire building

40
CHRIS GRIGGChief Executive

• Outperformed IPD in volatile market conditions
• Made excellent purchases in both retail and offices
• New office developments offer strong returns
41
Generating Superior Total ReturnsGenerating Superior Total Returns
A Good Year

• Focused on areas predicted to outperform
• Creating value through asset management
− Rental growth
− New lettings
− Reversion
42
Well Positioned For Growth From Existing Portfolio
Generating Superior Total ReturnsGenerating Superior Total Returns

• Demand for prime property continues
• Drivers of value – buying, developing and managing assets well
• Property expertise and access to capital give us a competitive edge
43
Opportunity For Further Value Creation
Generating Superior Total ReturnsGenerating Superior Total Returns

44
APPENDIX

45
£m GroupFunds& JVs
Mar 2010 Mar 2009
Total properties 4,152 4,387 8,539 8,625
Net debt (1,511) (2,570) (4,081) (4,941)
Other net liabilities 81 (132) (51) (297)
EPRA Net Assets 2,722 1,685 4,407 3,387
EPRA Diluted NAV per share 504p 398p
Loan to value ratio – Group 25% 46%
Loan to value ratio – inc. share of Funds & JVs 47% 57%
EPRA Balance Sheet (Proportional Consolidation)

46
Mar 2010 £m Pence per share Mar 2009 £m
Balance sheet (IFRS) net assets 4,208 481 3,209
Deferred tax arising on revaluation movements 43 5 25
Mark to market on effective cash flow hedges and related debt adjustments
126 15 153
Adjust to fully diluted on exercise of share options 30 3 ‐
EPRA NAV 4,407 504 3,387
Deferred tax arising on revaluation movements (43) (5) (25)
Mark to market of debt and derivatives 156 18 963
EPRA NNNAV 4,520 517 4,325
Reconciliation Of EPRA NAV & NNNAV

47
£m Group Funds & JVs 2009/10 2008/9
Net rental income 337 208 545 598
Fees and other income 13 2 15 20
Administrative expenses (55) (10) (65) (58)
Net interest costs (127) (119) (246) (292)
Underlying profit before tax 168 81 249 268
Net valuation movement (includes disposals) 496 412 908 (4,074)
Realisation of cash flow hedges/non‐recurring items ‐ (9) (9) (119)
Amortisation of intangible asset (15) ‐ (15) (14)
Tax ‐ Tax charge relating to underlying profit (2) (3) (5) (9)
‐ Other tax arising 14 (2) 12 67
Profit/(Loss) for the full year after tax 661 479 1,140 3,881
Income Statement (Proportional Consolidation)

48
£m 2009/10 2008/9
IFRS Profit/(Loss) before tax 1,128 (3,928)
Net valuation movement (includes disposals) (908) 4,074
Deferred and current taxation of joint ventures & funds 5 (11)
Amortisation of intangible asset 15 14
Realisation of cash flow hedges/non‐recurring items 9 119
Underlying profit before tax 249 268
Reconciliation Of Underlying Profit Before Tax

49
Gross Rental Income (£m pa) 12 months to 31 Mar 20101 Annualised as at 31 Mar 20102
Group Funds & JVs Total Group Funds & JVs Total
Retail Warehouses 102 63 165 102 65 167
Superstores 8 60 68 10 60 70
Shopping Centres 17 57 74 16 59 75
Department Stores3 36 2 38 33 ‐ 33
All Retail 163 182 345 161 184 345
City Offices 116 36 153 24 86 110
West End Offices 40 ‐ 40 51 ‐ 51
Provincial 1 ‐ 1 1 ‐ 1
All Offices 157 36 193 76 86 163
Other 18 ‐ 18 17 ‐ 17
Total – recurring items 338 219 557 254 270 524
– non‐recurring items4 4 ‐ 4
Total 342 219 561
1 Gross rental income per Income Statement under IFRS (proportionally consolidated) analysed by sector2 Annualised contracted gross rental income under IFRS (proportionally consolidated) analysed by sector as at 30 September 20093 Including High Street4 Including surrender premiums and back rents
Gross (Accounting) Rental Income – Sectoral Analysis

50
Under IFRS contracted rent and cash flows will differ 1 During rent free periods, IFRS requires rent to be recognised ahead of the related cash flow and allocated evenly over the lease term to the earliest termination date
2 IFRS requires the total rental income relating to fixed and minimum guaranteed rent reviews to be recognised ahead of the related cash flow and allocated evenly over the lease term to the earliest termination date
Gross Rental Income £m 2009/10 2010/11 2011/12 2012/13 2013/14 2014/15
Lettings with rent free periods1
Retail 42 46 46 44 43 28
Offices & other 37 51 53 53 52 51
Total rent (accounting basis) 79 97 99 97 95 79
Of which total cash flow 64 74 80 84 97 88
Of which SIC 15 rent free adjustment 15 23 19 14 (2) (9)
Lettings with fixed and minimum uplifts2
Retail 38 40 40 40 40 40
Offices & other 30 32 32 32 32 32
Total rent (accounting basis) 68 72 72 72 72 72
Of which total cash flow 55 60 62 65 66 68
Of which IAS 17 fixed uplift adjustment 13 12 10 7 6 4
Contracted Rental Increases

511 Excludes mark to market on effective cash flow hedges and related debt adjustments2 Underlying profit before interest and tax (UPBIT)/net interest
Group £m
Funds & JVs £m
Total £m
Gross debt 1,781 2,888 4,669
Market value of derivatives 38 99 137
Cash & liquid investments (269) (327) (596)
EPRA adjustments1 (39) (90) (129)
EPRA Net debt 1,511 2,570 4,081
Average interest rate 5.3% 5.1% 5.2%
Interest cover2 2.3x 1.7x 2.0x
Net Debt
52
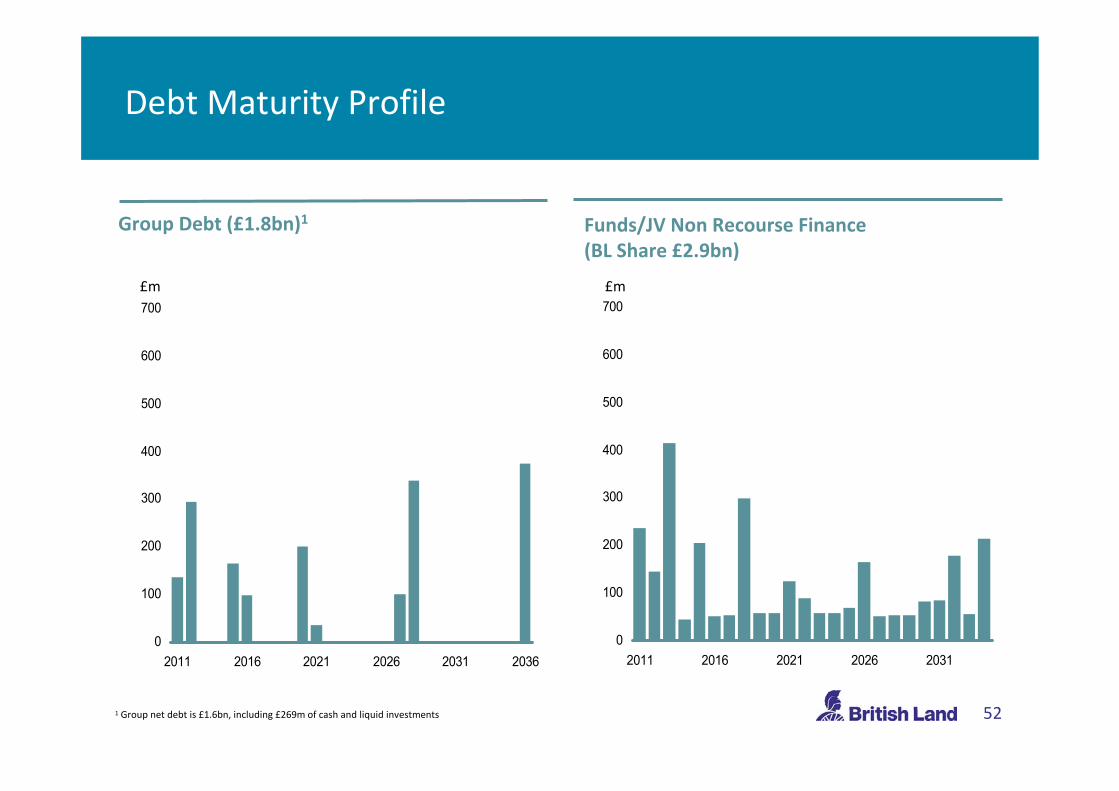
Funds/JV Non Recourse Finance (BL Share £2.9bn)
0
100
200
300
400
500
600
700
2011 2016 2021 2026 20310
100
200
300
400
500
600
700
2011 2016 2021 2026 2031 2036
Group Debt (£1.8bn)1
1 Group net debt is £1.6bn, including £269m of cash and liquid investments
Debt Maturity Profile
£m £m

53
Sales £m
Price BL Share
50% interest in Broadgate, EC2 1,066 1,066
18 Department Stores 209 139
9 Retail Warehouses 252 84
8‐10 Throgmorton, EC2 7 7
2 High Street Shops 5 5
Other 14 11
Total 1,553 1,312
Purchases £m
BL Share
Surrey Quays Shopping Centre 49
Clifton Moor Retail Park 39
Hylton Riverside Retail Park 7
Sainsbury’s, Macclesfield 32
39 Victoria Street, SW1 40
HUT Convertible Bonds 43
Additional PREF Units 35
Other 2
Total 247
2‐14 Baker Street (post year end) 29
Sales & Purchases

54
1 Hercules Unit Trust (HUT)2 Joint Venture with The Crown Estate3 Joint Venture with Universities Superannuation Scheme4 Joint Venture with Goodman Real Estate (UK) Limited
5 Subject to development agreement with Countryside Properties Limited6 In partnership with Network Rail7 Joint Venture with Canada Quays Limited
Sector Sq ft (’000) Planning
Fort Kinnaird1,2 Retail Warehouses 110 Detailed
Glasgow Fort1 Retail Warehouses 175 Detailed
Broughton Park1 Retail Warehouses 140 Detailed
Whiteley Village3 Retail Warehouses 322 Outline/Detailed
The Leadenhall Building City Office 610 Detailed
Colmore Row Provincial Office 280 Detailed
Meadowhall Additional Land Mixed Use 2,200 Outline
New Century Park4 Mixed Use 1,000 Outline
Theale5 Residential Potential Land Sale Detailed
Euston Station6 Mixed Use Master Planning in Progress Pending
Canada Water7 Mixed Use Master Planning in Progress Outline/Detailed
Prospective Developments
55
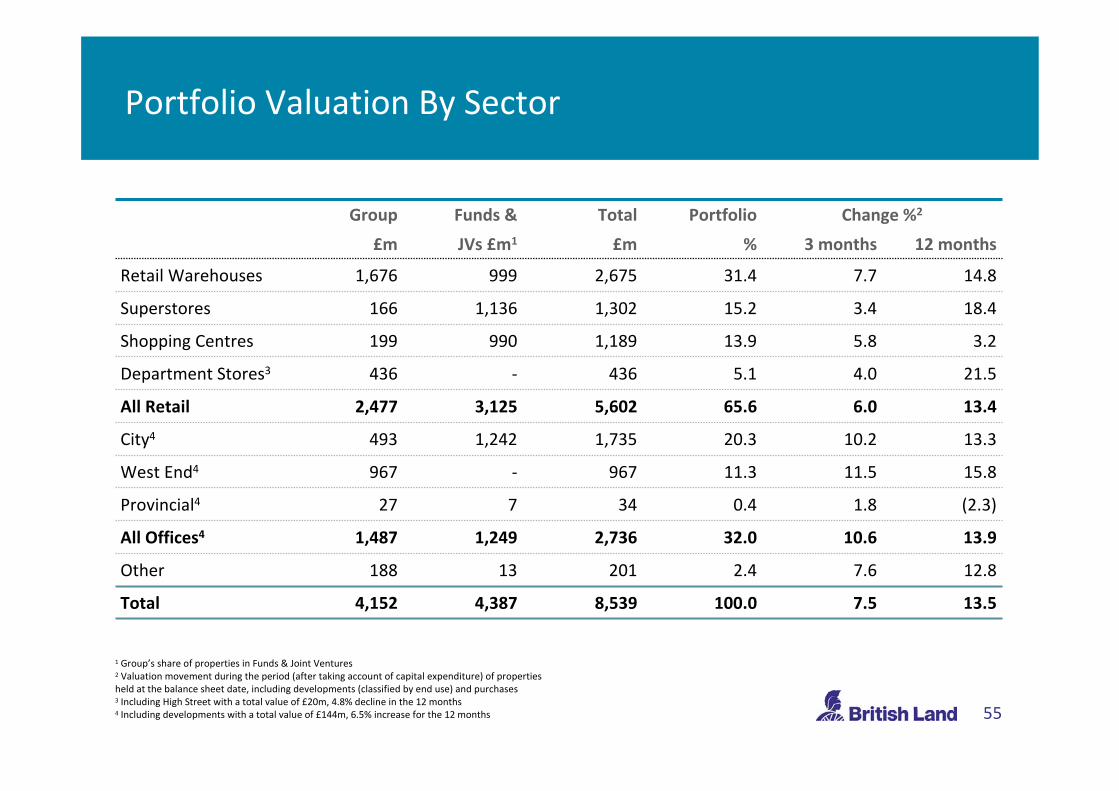
Group Funds & Total Portfolio Change %2
£m JVs £m1 £m % 3 months 12 months
Retail Warehouses 1,676 999 2,675 31.4 7.7 14.8
Superstores 166 1,136 1,302 15.2 3.4 18.4
Shopping Centres 199 990 1,189 13.9 5.8 3.2
Department Stores3 436 ‐ 436 5.1 4.0 21.5
All Retail 2,477 3,125 5,602 65.6 6.0 13.4
City4 493 1,242 1,735 20.3 10.2 13.3
West End4 967 ‐ 967 11.3 11.5 15.8
Provincial4 27 7 34 0.4 1.8 (2.3)
All Offices4 1,487 1,249 2,736 32.0 10.6 13.9
Other 188 13 201 2.4 7.6 12.8
Total 4,152 4,387 8,539 100.0 7.5 13.5
1 Group’s share of properties in Funds & Joint Ventures2 Valuation movement during the period (after taking account of capital expenditure) of properties held at the balance sheet date, including developments (classified by end use) and purchases3 Including High Street with a total value of £20m, 4.8% decline in the 12 months 4 Including developments with a total value of £144m, 6.5% increase for the 12 months
Portfolio Valuation By Sector

56
£m
Valuation as at 31 Mar 2009 8,625
Broadgate JV (1,096)
Disposals (363)
Purchases, development & other capex 352
Change in ownership in PREF 108
Revaluations 935
Decrease in head lease liabilities 6
Other1 (28)
Valuation as at 31 Mar 2010 8,539
1 Other adjustments relating to accounting adjustments for equalising rents (tenant incentives and guaranteed uplifts), as well as foreign exchange movements
Reconciliation Of Portfolio Valuation

57
1 Annualised contracted rent (100% basis)2 Including accommodation subject to asset management and under offer3 To first break 4 Excluding NEQ
Sq ft’000
BL Share
Rent£m pa1
Occupancyrate %2
Lease length, yrs3
1 Broadgate 4,400 50% 184 95.9 8.2
2 Meadowhall Shopping Centre 1,400 50% 78 98.1 11.2
3 Regent’s Place4 1,210 100% 42 83.7 9.8
4 Ropemaker Place 590 100% 25 91.1 16.9
5 Fort Kinnaird Shopping Park 510 18% 20 100.0 7.7
6 New Mersey Shopping Park 470 18% 16 100.0 10.1
7 Glasgow Fort Shopping Park 390 36% 16 97.3 8.6
8 Teesside Shopping Park 410 100% 13 100.0 10.5
9 Bon Accord Shopping Centre 490 50% 15 96.6 7.5
10 Parkgate Shopping Park 560 36% 12 100.0 10.0
Top 10 Properties

58
1 Within next 5 years2 Of which £29m pa within next 3 years 3 Including future portfolio voids on break/expiry
Annualised Rent – Cash Flow Basis
Retail£m pa
Office£m pa
Other£m pa
Total£m pa
Annualised rents 338 131 16 485
Contracted from fixed uplifts and expiry of rent free periods1,2
12 47 2 61
Rent reviews & lease renewals1,3 9 (23) ‐ (14)
Letting of current vacant space 7 15 1 23
Reversionary income 366 170 19 555
Future Rent Profile

59
Office
% of total rent
UBS 4
HM Government 2
RBS 2
Macquarie Group 2
Bank of Tokyo‐Mitsubishi UFJ 2
Herbert Smith 2
JP Morgan 1
Reed Smith 1
Deutsche Bank 1
Mayer Brown 1
Retail
% of total rent
Tesco 8
Sainsbury’s 7
Debenhams 4
Homebase 2
Kingfisher (B&Q) 2
Next 2
Asda 1
Boots 1
Curry’s 1
M&S 1
Top 10 Retail & Office Customers

60
1 Average contracted passing rent (post expiry of rent free periods) 2 Average Headline ERV3 Including High Street
Excluding developments (£psf pa) Rent1 ERV2
Retail Warehouses 22 23
Superstores 21 21
Shopping Centres 26 29
Department Stores3 11 13
All Retail 21 22
City 46 39
West End 40 38
All Offices 44 39
Other 16 18
Total 25 25
Average Rent psf
61
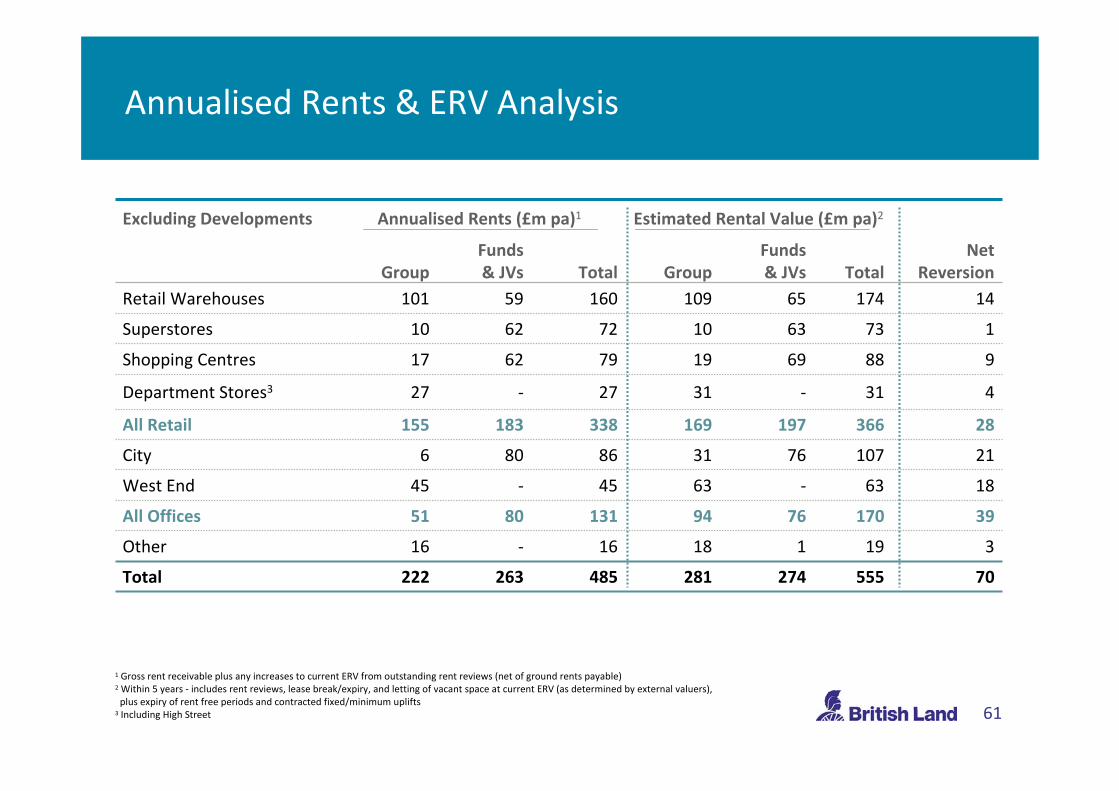
1 Gross rent receivable plus any increases to current ERV from outstanding rent reviews (net of ground rents payable) 2 Within 5 years ‐ includes rent reviews, lease break/expiry, and letting of vacant space at current ERV (as determined by external valuers), plus expiry of rent free periods and contracted fixed/minimum uplifts
3 Including High Street
Excluding Developments Annualised Rents (£m pa)1 Estimated Rental Value (£m pa)2
GroupFunds& JVs Total Group
Funds& JVs Total
Net Reversion
Retail Warehouses 101 59 160 109 65 174 14
Superstores 10 62 72 10 63 73 1
Shopping Centres 17 62 79 19 69 88 9
Department Stores3 27 ‐ 27 31 ‐ 31 4
All Retail 155 183 338 169 197 366 28
City 6 80 86 31 76 107 21
West End 45 ‐ 45 63 ‐ 63 18
All Offices 51 80 131 94 76 170 39
Other 16 ‐ 16 18 1 19 3
Total 222 263 485 281 274 555 70
Annualised Rents & ERV Analysis

62
1 After purchaser’s costs2 Without notional purchaser’s costs3 Adding back rent frees and contracted rental uplifts 4 Including High Street
Excluding developments (%) NetInitialYield1
GrossInitial Yield2
GrossTop‐up
Initial Yield2,3
GrossReversionary
Yield2
NetEquivalent
Yield1
Retail Warehouses 5.7 6.1 6.3 6.7 6.0
Superstores 5.2 5.5 5.5 5.6 5.2
Shopping Centres 6.0 6.7 7.0 7.4 6.4
Department Stores4 5.7 6.1 6.9 7.0 6.7
All Retail 5.6 6.1 6.3 6.6 6.0
City 4.9 5.2 7.3 6.5 6.1
West End 4.4 4.8 6.1 6.7 5.7
All Offices 4.7 5.1 6.9 6.5 5.9
Other 8.4 8.6 9.4 10.3 9.8
Total 5.4 5.8 6.6 6.7 6.0
Yield Profile

631 Including accommodation subject to asset management and under offer2 Including High Street
Excluding developments Average Lease Length (yrs) Occupancy Rate (%)
To Expiry To First Break Underlying1 Overall
Retail Warehouses 12.4 11.4 98.9 97.9
Superstores 17.6 17.6 100.0 100.0
Shopping Centres 11.4 10.8 97.9 95.9
Department Stores2 30.0 26.8 98.7 98.7
All Retail 14.8 13.9 98.9 97.9
City 12.2 10.0 95.0 93.3
West End 11.6 8.8 88.1 87.1
Provincial 22.0 18.9 100.0 100.0
All Offices 11.9 9.6 92.6 91.0
Other 21.2 20.9 93.8 93.8
Total 14.0 12.6 96.6 95.5
Lease Length & Occupancy

64
1 Excluding developments2 Including rent reviews currently outstanding3 Based on current ERV and assuming nil increase where ERV is lower than current passing rent4 Including High Street
Year to 31 March (£m pa)1 Annualised Rent Potential Uplift3
20112 2012 2013 Total 20112 2012 2013 Total
Retail Warehouses 54 18 24 96 2 1 ‐ 3
Superstores 14 6 2 22 1 ‐ ‐ 1
Shopping Centres 20 7 11 38 1 ‐ ‐ 1
Department Stores4 ‐ ‐ ‐ ‐ ‐ ‐ ‐ ‐
All Retail 88 31 37 156 4 1 ‐ 5
City 11 2 17 30 ‐ ‐ ‐ ‐
West End 4 5 7 16 ‐ ‐ ‐ ‐
All Offices 15 7 24 46 ‐ ‐ ‐ ‐
Other 2 ‐ ‐ 2 ‐ ‐ ‐ ‐
Total 105 38 61 204 4 1 ‐ 5
Rental Income Subject To Rent Review

651 Including High Street
Year to 31 March (£m pa) 2011 2012 2013 2014 2015 2011‐13 2011‐15
Retail Warehouses 2 2 3 6 4 7 17
Superstores ‐ ‐ ‐ ‐ ‐ ‐ ‐
Shopping Centres 4 2 3 6 3 9 18
Department Stores1 ‐ ‐ ‐ ‐ ‐ ‐ ‐
All Retail 6 4 6 12 7 16 35
City 8 ‐ ‐ 12 10 8 30
West End 2 4 8 ‐ 1 14 15
Provincial ‐ ‐ ‐ ‐ ‐ ‐ ‐
All Offices 10 4 8 12 11 22 45
Other ‐ ‐ 1 1 ‐ 1 2
Total 16 8 15 25 18 39 82
% of Total Rent 3% 1% 3% 4% 3% 7% 14%
Rental Income Subject To Lease Break Or Expiry

66
The information contained in this presentation has been extracted largely from the Half Year Results Announcement for the year ended 31 March 2010.
This presentation may contain certain “forward‐looking” statements. By their nature, forward‐looking statements involve risk and uncertainty because they relate to future events and circumstances. Actual outcomes and results may differ materially from any outcomes or results expressed or implied by such forward‐looking statements. Any forward‐looking statements made by or on behalf of British Land speak only as of the date they are made and no representation or warranty is given in relation to them, including as to their completeness or accuracy or the basis on which they were prepared. British Land does not undertake to update forward‐looking statements to reflect any changes in British Land’s expectations with regard thereto or any changes in events, conditions or circumstances on which any such statement is based.
This presentation is made only to investment professionals as defined in Article 19 of the Financial Services and Markets Act 2000 (Financial Promotion) Order 2005 ('the FP Order'). The content of this presentation has not been approved by a person authorised under the Financial Services and Markets Act 2000 (“FSMA”). Accordingly, this presentation may only be communicated in the UK with the benefit of an exemption set out in the FP Order. An investment professional includes:
(i) a person who is authorised or exempt under FSMA; and
(ii) a person who invests, or can reasonably be expected to invest, on a professional basis for the purposes of a business carried on by him; and
(iii) a government, local authority (whether in the United Kingdom or elsewhere) or an international organisation; and
(iv) any director, officer, executive or employee of any such person when acting in that capacity.
This presentation is published solely for information purposes. This presentation does not constitute an offer to sell or the solicitation of an offer to subscribe for or buy any security, nor a solicitation of any vote or approval in any jurisdiction, nor shall there be any sale, issuance or transfer of the securities referred to in this presentation in any jurisdiction in contravention of applicable law. No representation or warranty, either express or implied, is provided in relation to the accuracy, completeness or reliability of the information contained herein.
The distribution of this presentation in jurisdictions other than the UK may be restricted by law and therefore any persons who are subject to the laws of any jurisdiction other than the UK should inform themselves about, and observe, any applicable requirements. This presentation has been prepared for the purpose of complying with English law and the City Code and the information disclosed may not be the same as that which would have been disclosed if this presentation had been prepared in accordance with the laws of jurisdictions outside the UK.
All opinions expressed in this presentation are subject to change without notice and may differ from opinions expressed elsewhere.
Disclaimer


