Page 1
SSR Inst. Int. J. Life Sci.
Badoni et al., 2019
DOI:10.21276/SSR-IIJLS.2019.5.2.7
Copyright © 2015 - 2019| SSR-IIJLS by Society for Scientific Research under a CC BY-NC 4.0 International License Volume 05 | Issue 02 | Page 2244
Preliminary Screening of Sapindus mukorossi Extracts from Different
Sources against Forest Fungi
Prerana Badoni1*, Y.P. Singh2, Vineet Kumar3, Kartik Uniyal4
1Assistant Professor, Department of Microbiology, Uttaranchal College of Science & Technology, Dehradun,
India 2Retd. Scientist, Forest Pathology Division, Forest Research Institute, Dehradun, India
3Scientist, Chemistry Division, Forest Research Institute, Dehradun, India 4Assistant Professor, Department of Biotechnology/Microbiology, Alpine Institute of Management & Technology,
Dehradun, India
*Address for Correspondence: Dr. Prerana Badoni, Assistant Professor, Department of Microbiology, Uttaranchal College of Science & Technology, Dehradun-248001, India
E-mail: [email protected]
Received: 23 Jul 2018/ Revised: 19 Nov 2018/ Accepted: 22 Feb 2019
ABSTRACT
Background: Secondary metabolites of the plant have shown antimicrobial activity. Saponins, from pericarp of S. mukorossi have been reported to possess antimicrobial efficacy against a variety of bacteria and fungi. The present study entails to asses this efficacy against different forest fungi. Methods: Seeds of S. mukorossi, a medicinal plant of family Sapindaceae, collected from different sources viz. Dehradun and Gyarahdevi (Uttarakhand) and Nainatikker (Himachal Pradesh) were tested for their antifungal properties on the basis of IC50. Chloroform and methanol extract of fruit pericarp from three sources of soap nut were assayed against eight forest fungi using poisoned food technique. Both the extracts were screened at four concentrations of 0.5%, 1.0%, 1.5%, and 2%. Results: In our screening, we have found that chloroform extract of all sources registered IC50 at all concentrations against Phoma sp. and P. dalbergiae whereas, methanol extract of all the three sources attained IC50 at all concentrations against Phoma sp., P. dalbergiae, R. solani and T. piluliferum. IC50 was not achieved against A. alternata and F. oxysporum at any concentration of the sources in both the extracts. Conclusion: It can be concluded from the present study that though saponins of soap nut tree have many useful biological activities but chloroform and methanol extracts do not contain comparable biological activity against common forest fungi.
Key-words: Antifungal activity, Forest fungi, IC50, Pericarp, Poisoned food technique, Seed sources
INTRODUCTION
The Plant Kingdom has been the safeguard for the
humans throughout recorded history. The importance of
medicinal plants is gaining attention because of this
resumption of interest. However, this is occurring while
natural habitats in countries of origin are being lost. It is
determined that there are about 2,500,000 species of
higher plants and the majority of these have remained
How to cite this article
Badoni P, Singh YP, Kumar V, Uniyal K. Preliminary Screening of Sapindus mukorossi Extracts from Different Sources against Forest Fungi. SSR Inst. Int. J. Life Sci., 2019; 5(2): 2244-2258.
Access this article online
https://iijls.com/
un-examined in detail for their pharmacological activities [1]. Medicinal plants are a source of great economic value
in the Indian subcontinent. Nature has given us a very
rich botanical wealth with diverse varieties of plants
growing in different parts of the country [2].
Higher plants harbor numerous compounds which
provide resistance to pathogenic organisms. Towards
solving the antimicrobial resistance issue, drivers of
resistance and possible solutions have been listed for
future approaches. Discovery and development of new
antimicrobial agents that have clinical significant
importance from natural resources could be one of the
effective approaches. It is important to discover new
antimicrobial agents in order to replace currently
available antimicrobials [3].
Research Article
Page 2
SSR Inst. Int. J. Life Sci.
Badoni et al., 2019
DOI:10.21276/SSR-IIJLS.2019.5.2.7
Copyright © 2015 - 2019| SSR-IIJLS by Society for Scientific Research under a CC BY-NC 4.0 International License Volume 05 | Issue 02 | Page 2245
During the course of evolution, the selection pressure
caused by pathogens has probably been highly acute and
followed the vast chemical diversity in plants. Secondary
compounds from plants are guaranteed to have
biological activity, protecting the plant from pathogens.
Information of the pests to which the secondary
compounds produced in the plants are resistant may
provide useful leads in predicting which pests may be
controlled by compounds from a particular plant species.
This approach has conducted the discovery of different
botanical pesticides [4].
Sapindus mukorossi Gaerten (Family: Sapindaceae), a
medicinal plant, commonly known as Ritha or areetha
was found throughout India. The fruit contains saponins
(10-11.5%), sugars (10%) and mucilages [5]. The fruits of
the plant are valued for saponins present in plants,
which consists of 56.5% of the drupe. Saponins have
been isolated from the pericarp. Saponins exhibit potent
antifungal property and are often present in relatively
high levels in healthy plants; therefore these molecules
have been implicated as determinants of plants
resistance to fungal attack. Fungi that invade saponin
containing plants must have strategies for protecting
themselves from host saponins. For many fungi, saponin
resistance may be a prerequisite for successful infection [6].
It was reported that saponins extracted from the fruit
pericarp of S. mukorossi had bactericidal/bacteriostatic
property against L. acidophilus [7]. It was also found that
ethanol and chloroform extracts of S. mukorossi showed
antibacterial activity against Helicobacterium pylori [8].
Pericarps of S. mukorossi exhibited potent antimicrobial
activities on dermatophytes, Epidermophyton floccosum,
Trichophyton mentagrophytes, T. rubrum, Sabouraudites
canis and C. albicans [9].
The present study is based upon the provenance study of
S. mukorossi collected from three different sources i.e.
Forest Research Institute, Dehradun and Gyarahdevi,
Pithoragarh, Uttarakhand and Nainatikker, Sirmaur,
Himachal Pradesh. The main objective of this study was
to test two extracts (Chloroform and methanol) of S.
mukorossi from different sources for antifungal
properties on the basis of IC50. Most importantly,
antifungal activity of chloroform and methanol extracts
of fruit pericarp was reported for the first time in this
paper.
MATERIALS AND METHODS
Preparation of fruit pericarp extracts- The present study
was carried out in October 2011 in Forest Pathology
Division, Forest Research Institute, Dehradun,
Uttarakhand, India.
For the preparation of extracts, pericarp was separated
from seeds. The collected pericarp was spread on blotter
paper sheet and air-dried in shade. The dried pericarp
was then cut into pieces and extracted successively with
the solvents of increasing polarity viz. chloroform and
methanol in a Soxhlet apparatus. These extracts were
concentrated on a water bath to small volumes [10]. The
yield of extracts was determined on moisture free basis
(Table 1). Eight forest fungi were selected for bioassay
viz. Alternaria alternata, Colletotrichum gloeosporioides,
Phoma sp., Phomopsis dalbergiae, Ganoderma lucidum,
Fusarium oxysporum, Rhizoctonia solani, and
Trichoderma piluliferum. The rationale for short-listing
these fungi is ecological, host specificity, plant part
infectivity, wider presence, economic and loss, etc.
Table 1: Yield of extracts (%) from different sources of S.
mukorossi
Extract
Source/Yield (%)
Dehradun Gyarahdevi Nainatikker
Chloroform 2.5 3.1 5.6
Methanol 60.0 68.7 61.8
The extracts of S. mukorossi were tested for their toxicity
against fungal pathogens by the Poisoned Food
Technique [11] on the basis of Inhibitory Concentration
(IC50).
Inhibitory Concentration (IC50)- The toxicity of extracts
(chloroform and methanol) of the pericarp of S.
mukorossi from different sources was determined
against eight test fungi. A culture of the test fungi was
grown on Potato Dextrose Agar (PDA) medium for
certain period (generally 7 days) at the optimum
temperature (25°±1°C) for growth. Chloroform extract
from all three sources was dissolved in acetone solvent
to prepare the concentration (%). Methanol extract from
all three sources was dissolved in sterilized distilled
water to make concentration (%). The solvents used for
dissolving were taken on the basis of polarity.
Page 3
SSR Inst. Int. J. Life Sci.
Badoni et al., 2019
DOI:10.21276/SSR-IIJLS.2019.5.2.7
Copyright © 2015 - 2019| SSR-IIJLS by Society for Scientific Research under a CC BY-NC 4.0 International License Volume 05 | Issue 02 | Page 2246
PDA supplemented with different plant extracts at four
concentrations (0.5, 1.0, 1.5 & 2.0 %).
After solidification, small disc (0.7 cm dia) of the fungus
culture was cut with a sterile cork borer and transferred
aseptically upside down at the center of a Petri-dish.
Suitable checks were maintained where the culture discs
were grown under the same conditions on PDA without
extract. Solvent checks (a solvent which was used for
dissolving extract i.e. acetone) were maintained to check
out the inhibitory effect of solvent on fungi. Petri plates
were incubated at 25°±1°C. The radial growth of fungus
colony was measured after every twenty-four hours till
the fungus in the control plate completely occupied it.
Three replications were maintained. The antifungal
activity was evaluated by measuring the relative growth
of fungus in treatment vis-a-vis control.
The percent growth inhibition over control was worked
out using the formula of vincent [12].
I (%)= C – T/C x 100
Where,
I (%) = Growth Inhibition (%)
C = Colony diameter in control (mm)
T = Colony diameter in treatment (mm)
RESULTS
Chloroform extract- In this study, Table 2 shows that
irrespective of concentrations, maximum and
significantly more antifungal activity was found in
pericarp of seeds collected from Dehradun (37.8%)
against A. alternata and minimum inhibition was
recorded in Nainatikker (31%). The growth suppression
of A. alternata significantly increased with changing
concentrations of chloroform extract, for example,
highest suppression was in case of 2% (44.5%) and
lowest at 0.5% concentration (41%) of chloroform
extract, irrespective of seed sources.
Interactions between source and concentration (SxC)
showed that Dehradun source was significantly better in
terms of suppressing the growth of A. alternata than
other two seed sources at all concentrations of
chloroform extract (Table 2). Barring Nainatikker source,
there was overlapping growth suppression of the
pathogen in relation to concentration. For example, the
growth inhibition of the fungus remained at par between
the concentrations of 1.5 and 2% in both Dehradun (48.5
& 49.3 % respectively) and Gyarahdevi (42.8 & 43.6%
respectively) sources.
The mycelial growth of C. gloeosporioides was
suppressed maximum and significantly more in
Dehradun source 40% shown in Table 2. However,
Gyarahdevi (33%) and Nainatikker (33.3%) were at par,
irrespective of concentrations. There was a significant
increase of fungal growth inhibition over concentrations,
irrespective of seed sources.
Following interactions between source and
concentration (SxC), it was observed that Dehradun
source was significantly superior over the other two
sources at all concentrations barring 0.5% (Table 2).
Similarly, growth inhibition of C. gloeosporioides was
significantly more at higher concentration of 1.5 (44.5%)
and 2.0 (52.7%) in Gyarahdevi, however, it was
significantly better at the lower concentration of 0.5
(37%) and 1.0 (40%) concentration in Nainatikker. There
was a significant increase in growth suppression of the
pathogen over-concentration in all the sources.
The growth inhibition of Phoma sp. was highest and
significantly more in Nainatikker source (72.0%) on the
perusal of Table 2 & Fig. 1. However, minimum inhibition
was reported in Dehradun (50.9%) irrespective of
concentrations. There was a significant increase of fungal
growth inhibition over concentrations, irrespective of
seed sources. Interactions between source and
concentration (SxC) revealed that 100% inhibition of
growth was exhibited by Nainatikker source starting
from the lowest concentration of 0.5% (Table 2 & Fig. 1).
In the rest of the sources, there was linearity of
significant fungal growth suppression over
concentrations.
Irrespective of concentrations, Nainatikker (54.3%) had
the highest reduction of growth of P. dalbergiae whereas
Dehradun (52.7%) and Gyarahdevi (52.4%) suppressed at
par growth of the pathogen (Table 3). The growth
suppression of fungus was significantly more over the
concentrations, irrespective of seed sources.
Interactions between source and concentration (SxC)
revealed that Nainatikker had significantly high growth
inhibition of P. dalbergiae at the lowest concentration of
0.5% (61.9%; Table 3). However, it had at par growth with
Dehradun at the concentration of 1.0 (67.4 & 66.2%,
respectively) and 2% (69.8 & 70.1% respectively). Also,
Nainatikker remained at par with both Dehradun and
Gyarahdevi sources at the concentration of 1.5% (68.1,
67.5, & 68.9%, respectively).
Page 4
SSR Inst. Int. J. Life Sci.
Badoni et al., 2019
DOI:10.21276/SSR-IIJLS.2019.5.2.7
Copyright © 2015 - 2019| SSR-IIJLS by Society for Scientific Research under a CC BY-NC 4.0 International License Volume 05 | Issue 02 | Page 2247
Table 2: Effect of different concentrations of chloroform extract of S. mukorossi on radial growth of test fungi
Source
Concentration (%) / Inhibition (%)
Mean 0.0 0.5 1.0 1.5 2.0
A. alternata
Dehradun 0.0(0.0) 44.7(50.0*) 46.3(52.3) 48.5(56.2) 49.3(57.6) 37.8(43.1)
Gyarahdevi 0.0(0.0) 41.3(43.6) 41.8(44.6) 42.8(46.2) 43.6(47.6) 34(36.4)
Nainatikker 0.0(0.0) 37.0(36.2) 38.1(38.1) 39.4(40.5) 40.6(42.4) 31(31.4)
Mean 0.0(0.0) 41.0(43.1) 42.1(45.0) 43.6(47.6) 44.5(49.1)
SEM
Source (S) Concentration (C) Interaction
(SxC)
0.1 0.2 0.3
CD (5%) 0.4 0.5 0.8
C. gloeosporioides
Dehradun 0.0(0.0) 35.3(33.3) 46.1(51.9) 57.1(70.5) 61.1(76.6) 40(46.5)
Gyarahdevi 0.0(0.0) 31.1(26.6) 37.0(36.2) 44.5(49.0) 52.7(63.3) 33(35.0)
Nainatikker 0.0(0.0) 37.0(36.2) 40.0(40.5) 42.6(45.7) 47.7(54.8) 33.3(35.4)
Mean 0.0(0.0) 34.4(32.0) 40.8(42.8) 48.0(55.0) 53.9(64.9)
SEM
Source (S) Concentration (C) Interaction
(SxC)
0.2 0.3 0.5
CD (5%) 0.6 0.8 1.4
Phoma sp.
Dehradun 0.0(0.0) 60.8(76.2) 63.0(79.1) 64.8(81.9) 65.9(83.4) 50.9(64.1)
Gyarahdevi 0.0(0.0) 58.3(72.3) 63.1(79.5) 65.2(82.4) 69.8(88.1) 51.3(64.5)
Nainatikker 0.0(0.0) 90.0(100) 90.0(100) 90.0(100) 90.0(100) 72(80.0)
Mean 0.0(0.0) 70.0(82.8) 72.0(86.2) 73.3(88.1) 75.3(90.5)
SEM
Source (S) Concentration (C) Interaction
(SxC)
0.1 0.2 0.3
CD (5%) 0.3 0.4 0.8
*Values in parentheses are original
Page 5
SSR Inst. Int. J. Life Sci.
Badoni et al., 2019
DOI:10.21276/SSR-IIJLS.2019.5.2.7
Copyright © 2015 - 2019| SSR-IIJLS by Society for Scientific Research under a CC BY-NC 4.0 International License Volume 05 | Issue 02 | Page 2248
Fig. 1: Effect of chloroform extract of S. mukorossi from different sources on the growth of Phoma sp.
Irrespective of concentrations, maximum and significantly
more antifungal activity was found in Dehradun source
(33.0%) followed by Gyarahdevi (31.6%) and Nainatikker
(29.2%) against F. oxysporum (Table 3). The fungus had
significantly low inhibition percentage with an increase in
the concentration of the chloroform extract i.e. minimum
at 0.5% (34.2%) concentration and maximum at 2%
(42.8%), irrespective of seed sources.
Following interactions between source and
concentration (SxC), Dehradun maintained its superiority
excluding 1% where it remained at par with Gyarahdevi
(39.8 & 40%) and 2% with both Gyarahdevi and
Nainatikker (43.4, 42.8 & 42.3%, respectively; Table 3).
Also, the growth inhibition of F. oxysporum in Dehradun
was at par with Gyarahdevi at 1% and with Gyarahdevi
and Nainatikker sources at 2%.
Irrespective of concentrations, Dehradun (52.1%) had
the highest reduction of growth of G. lucidum where as it
was at par for Gyarahdevi (50.2%) and Nainatikker
(50.0%) sources (Table 3). Irrespective of seed sources,
growth suppression of G. lucidum increased significantly
with rising concentrations.
Interactions between source and concentration (SxC),
exhibited that Dehradun had 100% inhibition of G.
lucidum at the concentration of 1.5% and above (Table
3). It was also observed that Gyarahdevi had significantly
better growth reduction of the fungus at all the
concentrations. Also, Dehradun suppressed at par
growth at the lowest concentration of 0.5 (60%) and 1%
(60.8%). The fungal growth inhibition at all the sources
significantly increased over concentrations.
Table 3: Effect of different concentrations of chloroform extract of S. mukorossi on radial growth of test fungi
Source Concentration (%) / Inhibition (%)
Mean
0.0 0.5 1.0 1.5 2.0
P. dalbergiae
Dehradun 0.0(0.0) 60.0(74.3*) 66.2 (83.7) 67.5(85.3) 70.1(88.3) 52.7(66.4)
Gyarahdevi 0.0(0.0) 60.0(74.8) 62.1(78.1) 68.9(86.7) 71.3(89.7) 52.4(65.9)
Sou
rces
Concentration (%)
Check Check (Chemical)
0.5 1.0 1.5 2.0
De
hra
du
n
Gya
rah
dev
i
Nai
nat
ikke
r
Page 6
SSR Inst. Int. J. Life Sci.
Badoni et al., 2019
DOI:10.21276/SSR-IIJLS.2019.5.2.7
Copyright © 2015 - 2019| SSR-IIJLS by Society for Scientific Research under a CC BY-NC 4.0 International License Volume 05 | Issue 02 | Page 2249
Nainatikker 0.0(0.0) 66.3(83.8) 67.4(85.2) 68.1(86.2) 69.8(88.1) 54.4(68.7)
Mean 0.0(0.0) 61.9(77.7) 65.2(82.7) 68.1(86.1) 70.4(88.7)
Source (S) Concentration (C) Interaction
(SxC)
SEM 0.2 0.3 0.5
CD (5%) 0.6 0.8 1.4
F. oxysporum
Dehradun 0.0(0.0) 38.4(38.6) 39.8(41.0) 43.1(46.7) 43.4(47.1) 33(34.7)
Gyarahdevi 0.0(0.0) 34.4(31.9) 40.0(40.5) 41.5(43.8) 42.8(46.2) 31.6(32.5)
Nainatikker 0.0(0.0) 30.0(24.8) 34.4(31.9) 40.0(40.5) 42.3(45.2) 29.2(28.5)
Mean 0.0(0.0) 34.2(31.8) 38.0(37.8) 41.3(43.7) 42.8(46.2)
Source (S) Concentration (C) Interaction
(SxC)
SEM 0.2 0.3 0.5
CD (5%) 0.6 0.8 1.3
G. lucidum
Dehradun 0.0(0.0) 36.0(33.8) 44.7(49.5) 90.0(100) 90.0(100) 52.1(56.7)
Gyarahdevi 0.0(0.0) 60.0(74.8) 60.8(76.2) 64.1(80.9) 66.1(83.6) 50.2(63.1)
Nainatikker 0.0(0.0) 45.3(50.5) 49.4(58.0) 53.0(63.8) 57.1(70.5) 50(48.6)
Mean 0.0(0.0) 47.0(53.0) 51.6(61.2) 69.0(81.6) 71.1(84.7)
Source (S) Concentration (C) Interaction
(SxC)
SEM 0.1 0.2 0.3
CD (5%) 0.4 0.5 0.9
*Values in parentheses are original
Irrespective of concentrations, Nainatikker (45.7%) had
significant and more growth suppression against R.
solani and lowest in Dehradun 41.3% shown in Table 3 &
Fig. 2. Irrespective of seed sources, R. solani showed a
linear and significant relationship between
concentrations of extract and growth inhibition.
Interactions between source and concentration (SxC,)
revealed that Nainatikker had suppressed the growth of
test fungus to the maximum extent that was significantly
more than other sources at all concentrations (Table 4 &
Fig. 2). Moreover, Dehradun and Gyarahdevi suppressed
at par growth of R. solani at the lowest concentration of
0.5 (48.8 & 48.5% respectively) and at 1.0 (51.3 & 50.6%,
respectively), whereas, Gyarahdevi was significantly
better than Dehradun at the higher concentration of 1.5
(53.9 vs 52.2%) and 2% (57.1 vs 54.4%). It was also
recorded that all the sources suppressed the growth of
R. solani significantly over changing concentrations.
It was observed in Table 4 and Fig. 3 that Nainatikker
(47.1%) registered significantly more and Dehradun
(37.2%) had the lowest antifungal activity against T.
piluliferum irrespective of concentrations. The growth
reduction of T. piluliferum increased significantly with
rising concentrations, irrespective of seed sources.
Page 7
SSR Inst. Int. J. Life Sci.
Badoni et al., 2019
DOI:10.21276/SSR-IIJLS.2019.5.2.7
Copyright © 2015 - 2019| SSR-IIJLS by Society for Scientific Research under a CC BY-NC 4.0 International License Volume 05 | Issue 02 | Page 2250
Pursuing the interactions between source and
concentration (SxC), it was observed that Nainatikker
had significant and maximum inhibition of growth at the
higher concentrations of 1.5 (60.2%) and 2% (64.1%)
than other two sources (Table 4 & Fig. 3) However,
Gyarahdevi performed significantly better than
Dehradun at all the concentrations tested. It was also
recorded that in all three sources fungal growth
suppression increased significantly at the higher
concentrations of 1.5% and 2%.
Table 4: Effect of different concentrations of chloroform extract of S. mukorossi on radial growth of test fungi
Source
Concentration (%)/Inhibition (%)
Mean 0.0 0.5 1.0 1.5 2.0
R. solani
Dehradun 0.0(0.0) 48.8(56.7*) 51.3(60.9) 52.2(62.4) 54.4(66.6) 41.3(49.3)
Gyarahdevi 0.0(0.0) 48.5(56.2) 50.6(59.7) 53.9(65.2) 57.1(70.5) 42(50.3)
Nainatikker 0.0(0.0) 54.7(66.6) 56.5(69.5) 57.4(70.9) 60.0(74.8) 45.7(56.4)
Mean 0.0(0.0) 50.7(59.8) 52.8(63.4) 54.5(66.2) 57.1(70.6)
Source (S) Concentration (C) Interaction
(SxC)
SEM 0.1 0.2 0.3
CD (5%) 0.4 0.5 0.8
T. piluliferum
Dehradun 0.0(0.0) 42.5(45.7) 43.1(46.6) 45.8(51.4) 54.7(66.6) 37.2(42.1)
Gyarahdevi 0.0(0.0) 53.9(65.2) 56.8(69.7) 57.4(71.3) 60.8(76.2) 45.8(56.5)
Nainatikker 0.0(0.0) 54.7(66.7) 56.5(69.5) 60.2(75.3) 64.1(80.9) 47.1(58.5)
Mean 0.0(0.0) 50.4(59.2) 52.1(62.0) 54.5(65.9) 60.0(74.6)
Source (S) Concentration (C)
Interaction
(SxC)
SEM 0.2 0.3 0.5
CD (5%) 0.6 0.7 1.3
*Values in parentheses are original
Page 8
SSR Inst. Int. J. Life Sci.
Badoni et al., 2019
DOI:10.21276/SSR-IIJLS.2019.5.2.7
Copyright © 2015 - 2019| SSR-IIJLS by Society for Scientific Research under a CC BY-NC 4.0 International License Volume 05 | Issue 02 | Page 2251
Fig. 2: Effect of chloroform extract of S. mukorossi from different sources on the growth of R. solani
Ck= Check (Fungal culture media), Ch.= Check chemical control (Media containing chloroform)
Fig. 3: Effect of chloroform extract of S. mukorossi from different sources on the growth of T. piluliferum
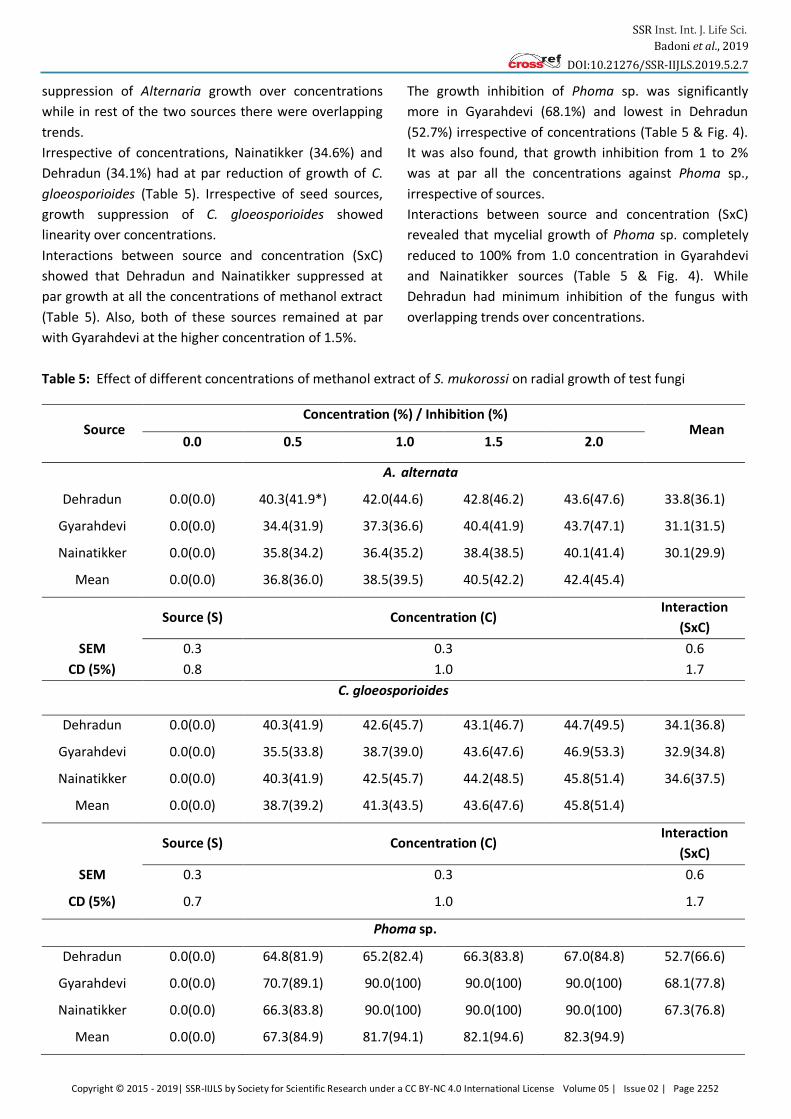
Methanol extract- Table 5 revealed that irrespective of
concentrations, maximum and significantly more
antifungal activity was found in the pericarp of seeds
collected from Dehradun (33.8%) against A. alternata
followed by Gyarahdevi (31.1%) and Nainatikker (30.1%).
Irrespective of seed sources, all the concentrations of
methanol extract showed significant and increasing
suppression of growth i.e. maximum at concentration of
2% (42.4%) and minimum at 0.5% (36.8%).
Interactions between source and concentration (SxC)
reveals that Dehradun was significantly better in
suppressing the growth of A. alternata than other two
seed sources at all concentrations except 2% of
methanol extract where it remained at par with
Gyarahdevi (Table 5), while Gyarahdevi had significantly
more growth reduction in respect to Nainatikker at a
higher concentration of 1.5% (40.4 & 38.4%) and 2%
(43.7 & 40.1%). Only Gyarahdevi had significant
Source
Concentration (%)
Ck Ck (Ch.) 0.5 1.0 1.5 2.0
Dehradun
Gyarahdevi
Nainatikker
Ck= Check (Fungal culture media), Ch.= Check chemical control (Media containing chloroform)
Source Concentration (%)
Ck Ck (Ch.) 0.5 1.0 1.5 2.0
Dehradun
Gyarahdevi
Nainatikker
Page 9
SSR Inst. Int. J. Life Sci.
Badoni et al., 2019
DOI:10.21276/SSR-IIJLS.2019.5.2.7
Copyright © 2015 - 2019| SSR-IIJLS by Society for Scientific Research under a CC BY-NC 4.0 International License Volume 05 | Issue 02 | Page 2252
suppression of Alternaria growth over concentrations
while in rest of the two sources there were overlapping
trends.
Irrespective of concentrations, Nainatikker (34.6%) and
Dehradun (34.1%) had at par reduction of growth of C.
gloeosporioides (Table 5). Irrespective of seed sources,
growth suppression of C. gloeosporioides showed
linearity over concentrations.
Interactions between source and concentration (SxC)
showed that Dehradun and Nainatikker suppressed at
par growth at all the concentrations of methanol extract
(Table 5). Also, both of these sources remained at par
with Gyarahdevi at the higher concentration of 1.5%.
The growth inhibition of Phoma sp. was significantly
more in Gyarahdevi (68.1%) and lowest in Dehradun
(52.7%) irrespective of concentrations (Table 5 & Fig. 4).
It was also found, that growth inhibition from 1 to 2%
was at par all the concentrations against Phoma sp.,
irrespective of sources.
Interactions between source and concentration (SxC)
revealed that mycelial growth of Phoma sp. completely
reduced to 100% from 1.0 concentration in Gyarahdevi
and Nainatikker sources (Table 5 & Fig. 4). While
Dehradun had minimum inhibition of the fungus with
overlapping trends over concentrations.
Table 5: Effect of different concentrations of methanol extract of S. mukorossi on radial growth of test fungi
Source Concentration (%) / Inhibition (%)
Mean 0.0 0.5 1.0 1.5 2.0
A. alternata
Dehradun 0.0(0.0) 40.3(41.9*) 42.0(44.6) 42.8(46.2) 43.6(47.6) 33.8(36.1)
Gyarahdevi 0.0(0.0) 34.4(31.9) 37.3(36.6) 40.4(41.9) 43.7(47.1) 31.1(31.5)
Nainatikker 0.0(0.0) 35.8(34.2) 36.4(35.2) 38.4(38.5) 40.1(41.4) 30.1(29.9)
Mean 0.0(0.0) 36.8(36.0) 38.5(39.5) 40.5(42.2) 42.4(45.4)
Source (S) Concentration (C) Interaction
(SxC)
SEM 0.3 0.3 0.6
CD (5%) 0.8 1.0 1.7
C. gloeosporioides
Dehradun 0.0(0.0) 40.3(41.9) 42.6(45.7) 43.1(46.7) 44.7(49.5) 34.1(36.8)
Gyarahdevi 0.0(0.0) 35.5(33.8) 38.7(39.0) 43.6(47.6) 46.9(53.3) 32.9(34.8)
Nainatikker 0.0(0.0) 40.3(41.9) 42.5(45.7) 44.2(48.5) 45.8(51.4) 34.6(37.5)
Mean 0.0(0.0) 38.7(39.2) 41.3(43.5) 43.6(47.6) 45.8(51.4)
Source (S) Concentration (C) Interaction
(SxC)
SEM 0.3 0.3 0.6
CD (5%) 0.7 1.0 1.7
Phoma sp.
Dehradun 0.0(0.0) 64.8(81.9) 65.2(82.4) 66.3(83.8) 67.0(84.8) 52.7(66.6)
Gyarahdevi 0.0(0.0) 70.7(89.1) 90.0(100) 90.0(100) 90.0(100) 68.1(77.8)
Nainatikker 0.0(0.0) 66.3(83.8) 90.0(100) 90.0(100) 90.0(100) 67.3(76.8)
Mean 0.0(0.0) 67.3(84.9) 81.7(94.1) 82.1(94.6) 82.3(94.9)
Page 10
SSR Inst. Int. J. Life Sci.
Badoni et al., 2019
DOI:10.21276/SSR-IIJLS.2019.5.2.7
Copyright © 2015 - 2019| SSR-IIJLS by Society for Scientific Research under a CC BY-NC 4.0 International License Volume 05 | Issue 02 | Page 2253
Source (S) Concentration (C) Interaction
(SxC)
SEM 0.2 0.3 0.4
CD (5%) 0.6 0.7 1.3
*Values in parentheses are original
Fig. 4: Effect of methanol extract of S. mukorossi from different sources on the growth of Phoma sp.
Irrespective of concentrations, Gyarahdevi had maximum
and significantly higher growth inhibition of 68.2%, while
Dehradun had lowest of 55.6% against P. dalbergiae
(Table 6). Irrespective of sources, suppression of mycelial
growth of P. dalbergiae was at par at 1% and 1.5 %
concentration.
Following interactions between source and
concentration (SxC), it was concluded that Gyarahdevi
had 100% antifungal activity at the concentration of 1.0
against P. dalbergiae (Table 6). Barring the concentration
of 1.0, Nainatikker was at par with Dehradun at 0.5, 1.5
and 2.0 concentrations. Also, Dehradun and Nainatikker
were at par at the lower concentrations of 0.5 and 1.0
and at the higher of 1.5 and 2.0.
It was observed in Table 6 that Gyarahdevi (33.7%)
registered significantly more and Dehradun (27.7%) had
the lowest antifungal activity against F. oxysporum,
irrespective of concentrations. The growth reduction of
the fungus increased significantly with rising
concentrations, irrespective of seed sources.
Interactions between source and concentration (SxC)
revealed that Gyarahdevi had significantly better growth
suppression at all concentrations (Table 6). Also, it
remained at par with Nainatikker at the highest
concentration of 2% (43.6 & 42.6%).
Moreover, Nainatikker was second to highest and was at
par at the concentration of 1.0 and 1.5.
Table 6 showed significantly differential growth
suppression of G. lucidum by pericarp of seeds collected
from different sources, for example, Nainatikker had
highest (45.0%) and Dehradun had lowest of 37.3%,
irrespective of concentrations. G. lucidum showed a
linear and significant relationship between
concentrations of extract and growth inhibition,
irrespective of sources. Interactions between source and
concentration (SxC) revealed that Nainatikker had
highest growth suppression of G. lucidum at all the
concentrations barring 2% concentration of Dehradun
source, where 61.7% of growth inhibition was observed
(Table 6). At lower concentrations, up to 1.5 Gyarahdevi
performed better than Dehradun while at higher
concentration of 1.5% and 2% Dehradun scored
significantly better than Gyarahdevi. The antifungal
activity of Gyarahdevi had overlapping trends over
concentrations, while the rest of the two recorded
significant suppression with increasing concentrations.
Source Concentration (%)
Ck Ck (Ch.) 0.5 1.0 1.5 2.0
Dehradun
Gyarahdevi
Nainatikker
Page 11
SSR Inst. Int. J. Life Sci.
Badoni et al., 2019
DOI:10.21276/SSR-IIJLS.2019.5.2.7
Copyright © 2015 - 2019| SSR-IIJLS by Society for Scientific Research under a CC BY-NC 4.0 International License Volume 05 | Issue 02 | Page 2254
Table 6: Effect of different concentrations of methanol extract of S. mukorossi on radial growth of test fungi
Source
Concentration (%) / Inhibition (%)
Mean
0.0 0.5 1.0 1.5 2.0
P. dalbergiae
Dehradun 0.0(0.0) 68.2(86.2*) 69.0(87.1) 69.8(88.1) 70.7(89.0) 55.6(70.1)
Gyarahdevi 0.0(0.0) 71.1(89.5) 90.0(100) 90.0(100) 90.0(100) 68.2(77.9)
Nainatikker 0.0(0.0) 69.4(87.6) 69.8(88.1) 70.7(89.0) 71.6(90.0) 56.3(71.0)
Mean 0.0(0.0) 70.0(87.8) 76.3(91.7) 76.8(92.4) 77.4(93.0)
Source (S) Concentration (C) Interaction
(SxC)
SEM 0.2 0.3 0.4
CD (5%) 0.6 0.7 1.2
F. oxysporum
Dehradun 0.0(0.0) 31.7(27.6) 33.5(30.5) 34.7(32.4) 38.7(39.0) 27.7(25.9)
Gyarahdevi 0.0(0.0) 40.3(41.9) 41.5(43.8) 42.8(46.2) 43.6(47.6) 33.7(35.9)
Nainatikker 0.0(0.0) 37.0(35.7) 40.1(41.4) 40.6(42.4) 42.6(45.7) 32(33.1)
Mean 0.0(0.0) 36.3(35.1) 38.3(38.6) 39.4(40.3) 41.6(44.1)
Source (S) Concentration (C) Interaction
(SxC)
SEM 0.2 0.2 0.4
CD (5%) 0.5 0.6 1.0
G. lucidum
Dehradun 0.0(0.0) 32.6(29.0) 35.6(33.8) 56.4(69.3) 61.7(77.6) 37.3(42.0)
Gyarahdevi 0.0(0.0) 50.8(60.1) 51.3(60.9) 52.7(63.3) 53.6(64.7 41.7(49.8)
Nainatikker 0.0(0.0) 52.4(62.9) 55.1(67.3) 57.7(71.4) 60.0(74.3) 45(55.2)
Mean 0.0(0.0) 45.3(50.7) 47.3(54.0) 55.6(68.0) 58.3(72.2)
Source (S) Concentration (C) Interaction
(SxC)
SEM 0.2 0.2 0.4
CD (5%) 0.5 0.6 1.1
*Values in parentheses are original
Irrespective of concentrations, Nainatikker had
maximum and significantly more growth reduction of
48% followed by Dehradun (44.8%) and Gyarahdevi
(41.6%, Table 7 & Fig. 5) sources against R. solani. All the
concentrations had a linear and significant reduction of
growth of R. solani, irrespective of sources.
Interactions between source and concentration (SxC)
revealed that Nainatikker had significantly better growth
suppression at all concentrations followed by Dehradun
and Gyarahdevi sources (Table 7 & Fig. 5). It was also
recorded that Gyarahdevi and Nainatikker had
overlapping trends among concentrations.
Page 12
SSR Inst. Int. J. Life Sci.
Badoni et al., 2019
DOI:10.21276/SSR-IIJLS.2019.5.2.7
Copyright © 2015 - 2019| SSR-IIJLS by Society for Scientific Research under a CC BY-NC 4.0 International License Volume 05 | Issue 02 | Page 2255
Irrespective of concentrations, Gyarahdevi had
significant and maximum inhibition of 50% of T.
piluliferum followed by Nainatikker (46.0%) and
Dehradun (44.9%; Table 7 & Fig.6) sources. Irrespective
of sources, T. piluliferum had significant and linear
growth reduction over concentrations.
Interactions between source and concentration (SxC),
showed that the performance of Gyarahdevi was
significantly better than other two sources and at all the
concentrations and Nainatikker and Dehradun had at par
growth of T. piluliferum at all concentrations barring 2%
where Nainatikker performed significantly better than
Dehradun (Table 7 & Fig. 6) Barring the concentration of
2.0, all the sources had overlapping trends among
concentrations.
Table 7: Effect of different concentrations of methanol extract of S. mukorossi on radial growth of test fungi
Source
Concentration (%) / Inhibition (%) Mean
0.0 0.5 1.0 1.5 2.0
R. solani
Dehradun 0.0(0.0) 54.0(64.8)* 55.4(67.6) 57.1(70.5) 58.0(71.9) 44.8(54.9)
Gyarahdevi 0.0(0.0) 50.8(60.0) 51.6(61.4) 52.4(62.8) 53.4(64.3) 41.6(49.7)
Nainatikker 0.0(0.0) 57.7(71.4) 60.0(74.3) 60.2(75.2) 62.0(78.1) 48(59.8)
Mean 0.0(0.0) 54.0(65.4) 56.0(67.7) 57.0(69.5) 57.8(71.4)
Source (S) Concentration (C) Interaction
(SxC)
SEM 0.2 0.3 0.6
CD (5%) 0.7 0.9 1.6
T. piluliferum
Dehradun 0.0(0.0) 54.0(64.7) 55.3(67.6) 57.1(70.5) 58.3(72.3) 44.9(55.0)
Gyarahdevi 0.0(0.0) 60.5(75.7) 61.4(77.1) 62.4(78.6) 63.4(80.0) 50.0(62.3)
Nainatikker 0.0(0.0) 55.1(67.3) 56.0(68.7) 57.0(70.1) 60.0(74.3) 46.0(56.1)
Mean 0.0(0.0) 56.4(69.2) 57.6(71.1) 58.8(73.0) 60.4(75.6)
Source (S) Concentration (C) Interaction
(SxC)
SEM 0.2 0.3 0.5
CD (5%) 0.7 0.9 1.5
*Values in parentheses are original
Page 13
SSR Inst. Int. J. Life Sci.
Badoni et al., 2019
DOI:10.21276/SSR-IIJLS.2019.5.2.7
Copyright © 2015 - 2019| SSR-IIJLS by Society for Scientific Research under a CC BY-NC 4.0 International License Volume 05 | Issue 02 | Page 2256
Fig. 5: Effect of methanol extract of S. mukorossi from different sources on the growth of R. solani
Fig. 6: Effect of methanol extract of S. mukorossi from different sources on the growth of T. piluliferum
DISCUSSION
Phytochemical constituents in the plant samples are
known to be biologically active compounds and they are
responsible for different activities such
as antioxidant, antimicrobial, antifungal, and anticancer [13,14]. Regarding chloroform extract, the current study
found that this extract of all the three sources presented
IC50 at all concentrations against only two fungi namely,
Phoma sp. and P. dalbergiae. Similar to the present
study, ethanol and chloroform extracts of S. mukorossi
had shown antibacterial activity against H. pylori [8] at
very low concentrations (10 µg/ml for both extracts). In a
subsequent study, Tsuzuki verified that the crude
extracts (hydroalcoholic and butanol) of S. saponaria
showed strong antifungal activity against clinical isolates
of yeasts C. albicans [15]. Focusing on methanol extract,
we had observed that this extract of all the three sources
has attained IC50 at all concentrations against four fungi
namely, Phoma sp., P. dalbergiae, R. solani and T.
piluliferum. Previous studies had reported that ethyl
acetate extract from endophytes of S. Saponaria showed
a greater antimicrobial activity against some pathogenic
Source Concentration (%)
Ck Ck (Ch.) 0.5 1.0 1.5 2.0
Dehradun
Gyarahdevi
Nainatikker
Source Concentration (%)
Ck Ck (Ch.) 0.5 1.0 1.5 2.0
Dehradun
Gyarahdevi
Nainatikker
Page 14
SSR Inst. Int. J. Life Sci.
Badoni et al., 2019
DOI:10.21276/SSR-IIJLS.2019.5.2.7
Copyright © 2015 - 2019| SSR-IIJLS by Society for Scientific Research under a CC BY-NC 4.0 International License Volume 05 | Issue 02 | Page 2257
bacteria but methanol extract did not show positive
results for human pathogenic bacteria [16]. Results
concluded that the methanol extract of different sources
performed much better than chloroform extract barring
one fungus, G. lucidum (1.5%); all other fungi exhibited
IC50 at their minimum concentration of 0.5%.
Predominantly, antifungal activity of pericarp extracts
(chloroform and methanol) of S. mukorossi was never
tested against forest fungi though it was a popular tree
under intensive uses.
CONCLUSIONS
The results of preliminary screening suggested that
chloroform extract of all three sources could not achieve
IC50 against A. alternata and F. oxysporum ranging from
0.5% to 2% concentration. Further, it was common
between both extracts of all three sources registered IC50
at all concentrations against Phoma sp. and P.
dalbergiae.
Future studies concerning antimicrobial activities must
be carried out with other extracts (petroleum ether,
butanol etc.) of fruit pericarp of S. mukorossi against
forest fungi to justify their antifungal properties.
ACKNOWLEDGMENTS
The authors were thankful to the research fellows and
other staff for providing support during the course of the
investigation. We were also thankful to Director FRI for
providing all the necessary facilities required for the
successful completion of the work.
CONTRIBUTION OF AUTHORS
Research concept- Dr. Y. P. Singh, Dr. Vineet Kumar
Research design- Dr. Y. P. Singh, Dr. Prerana Badoni
Supervision- Dr. Y. P. Singh, Dr. Vineet Kumar
Materials- Dr. Prerana Badoni
Data collection- Dr. Prerana Badoni
Data analysis and interpretation- Dr. Prerana Badoni, Dr.
Y. P. Singh
Literature search- Dr. Prerana Badoni
Writing article- Dr. Prerana Badoni, Dr. Kartik Uniyal
Critical review- Dr. Y. P. Singh
Article editing- Dr. Prerana Badoni, Dr. Kartik Uniyal
Final approval- Dr. Y. P. Singh
REFERENCES
[1] Kawsar SMA, Uddin, MS, Huq E, Nahar N, Ozeki Y.
Biological investigation of Macrotyloma uniflorum
Linn. extracts against some pathogens. J. Biol. Sci.,
2008; 8: 1051-56.
[2] Singh RP, Jain DA. Evaluation of antimicrobial activity
of alcoholic and aqueous extracts of five plants used
in traditional medicine in north India. Int. J. Pharm.
Tech. Res., 2011; 3(1): 376-80.
[3] Khanam Z, Wen CS, Bhat IUH. Phytochemical
screening and antimicrobial activity of root and stem
extracts of wild Eurycoma longifolia Jack (Tongkat
Ali). J. King Saud University-Sci., 2015; 27: 23-30.
[4] Dubey NK, Shukla R, Kumar A, Singh P and Prakash B.
Prospects of botanical pesticides in sustainable
agriculture. Curr. Sci., 2010; 98(4): 479-80.
[5] Gedeon J. Saponins from Indian soapnuts. J. Sci. Ind.
Res., 1954; 13B: 427-28.
[6] Osbourn AE. Saponins and plant defence- A soap
story. Trends Plant Sci., 1996; 1: 4-9.
[7] Ojha P, Maikhuri JP, Gupta G. Effect of spermicides
on Lactobacillus acidophilus in vitro nonoxynol-9 vs.
Sapindus saponins. Contracept., 2003; 68 (2): 135-38.
[8] Ibrahim M, Khan AA, Tiwari SK, Habeeba M.A, Khaja
MN, Habibullah CM. Antimicrobial activity of
Sapindus mukorossi and Rheum emodi extracts
against Helicobacterium pylori in in vivo studies.
World J. Gastroenterol.; 2006; 12(44): 7136-42.
[9] Tamura Y, Mizutani K, Ikeda T, Ohtani K, Kasai R, et
al. Antimicrobial activities of saponins of pericarps of
Sapindus mukurossi on dermatophytes. Nat. Med.,
2001; 55 (1): 11-16.
[10]Singh J, Tripathi NN. Efficacy of plant extracts against
Fusarium oxysporum f. sp. lentis of Lens esculanta. J.
Indian Bot. Soc., 1993; 72: 51-53.
[11]Grover RK, Moore JD. Toximetric studies of
fungicides against brown rot organism Sclerotina
fructicola and S. laxa. Phytopathology, 1962; 52:
876-80.
[12]Vincent JM. Distortion of fungal hyphae in the
presence of certain inhibitions. Nature, 1927; 159:
850.
[13]Hossain, MA, Nagooru MR. Biochemical profiling and
total flavonoids contents of leaves crude extract of
endemic medicinal plant Corydyline terminalis L.
Kunth. Pharmacogn. J., 2011; 3(24): 25-29.
[14]Suresh SN, Nagarajan N. Preliminary phytochemical
and antimicrobial activity analysis of Begonia
malabarica Lam. J. Basic Appl. Biol., 2009; 3(1&2):
59-61.
Page 15
SSR Inst. Int. J. Life Sci.
Badoni et al., 2019
DOI:10.21276/SSR-IIJLS.2019.5.2.7
Copyright © 2015 - 2019| SSR-IIJLS by Society for Scientific Research under a CC BY-NC 4.0 International License Volume 05 | Issue 02 | Page 2258
[15]Tsuzuki JK, Svidzinski IE, Shinobu CS, Silva FA, Filho
ER, et al. Antifungal activity of the extracts and
saponins from Sapindus Saponaria L. An. Acad. Bras.
Cienc., 2007; 79(4): 1-7.
[16]Garcia A, Rhoden SA, Bernardi-Wenzel J, Orlandelli
RC, Azevedo JL, Pamphile JA. Antimicrobial activity of
crude extracts of endophytic fungi isolated from
medicinal plant Sapindus saponaria L. J. Appl. Pharm.
Sci., 2012; 2(10): 35-40.
Open Access Policy: Authors/Contributors are responsible for originality, contents, correct references, and ethical issues. SSR-IIJLS publishes all articles under Creative Commons Attribution- Non-Commercial 4.0 International License (CC BY-NC). https://creativecommons.org/licenses/by-nc/4.0/legalcode