Map projection: Web Mercator Corner coordinates: WGS84 Edge tics: UTM Zone 17N WGS840 30 60 120 180
Feet0 5 10 20 30
MetersMap Scale: 1:621 if printed on A portrait (8.5" x 11") sheet.
MAP LEGEND MAP INFORMATION
Area of Interest (AOI)Area of Interest (AOI)
SoilsSoil Map Unit Polygons
Soil Map Unit Lines
Soil Map Unit Points
Special Point FeaturesBlowout
Borrow Pit
Clay Spot
Closed Depression
Gravel Pit
Gravelly Spot
Landfill
Lava Flow
Marsh or swamp
Mine or Quarry
Miscellaneous Water
Perennial Water
Rock Outcrop
Saline Spot
Sandy Spot
Severely Eroded Spot
Sinkhole
Slide or Slip
Sodic Spot
Spoil Area
Stony Spot
Very Stony Spot
Wet Spot
Other
Special Line Features
Water FeaturesStreams and Canals
TransportationRails
Interstate Highways
US Routes
Major Roads
Local Roads
BackgroundAerial Photography
The soil surveys that comprise your AOI were mapped at 1:15,800.
Warning: Soil Map may not be valid at this scale.
Enlargement of maps beyond the scale of mapping can causemisunderstanding of the detail of mapping and accuracy of soil lineplacement. The maps do not show the small areas of contrastingsoils that could have been shown at a more detailed scale.
Please rely on the bar scale on each map sheet for mapmeasurements.
Source of Map: Natural Resources Conservation ServiceWeb Soil Survey URL: http://websoilsurvey.nrcs.usda.govCoordinate System: Web Mercator (EPSG:3857)
Maps from the Web Soil Survey are based on the Web Mercatorprojection, which preserves direction and shape but distortsdistance and area. A projection that preserves area, such as theAlbers equal-area conic projection, should be used if more accuratecalculations of distance or area are required.
This product is generated from the USDA-NRCS certified data as ofthe version date(s) listed below.
Soil Survey Area: Franklin County, OhioSurvey Area Data: Version 13, Sep 26, 2015
Soil map units are labeled (as space allows) for map scales 1:50,000or larger.
Date(s) aerial images were photographed: Feb 27, 2012—Mar10, 2012
The orthophoto or other base map on which the soil lines werecompiled and digitized probably differs from the backgroundimagery displayed on these maps. As a result, some minor shiftingof map unit boundaries may be evident.
Soil Map—Franklin County, Ohio
Natural ResourcesConservation Service
Web Soil SurveyNational Cooperative Soil Survey
7/21/2016Page 2 of 3
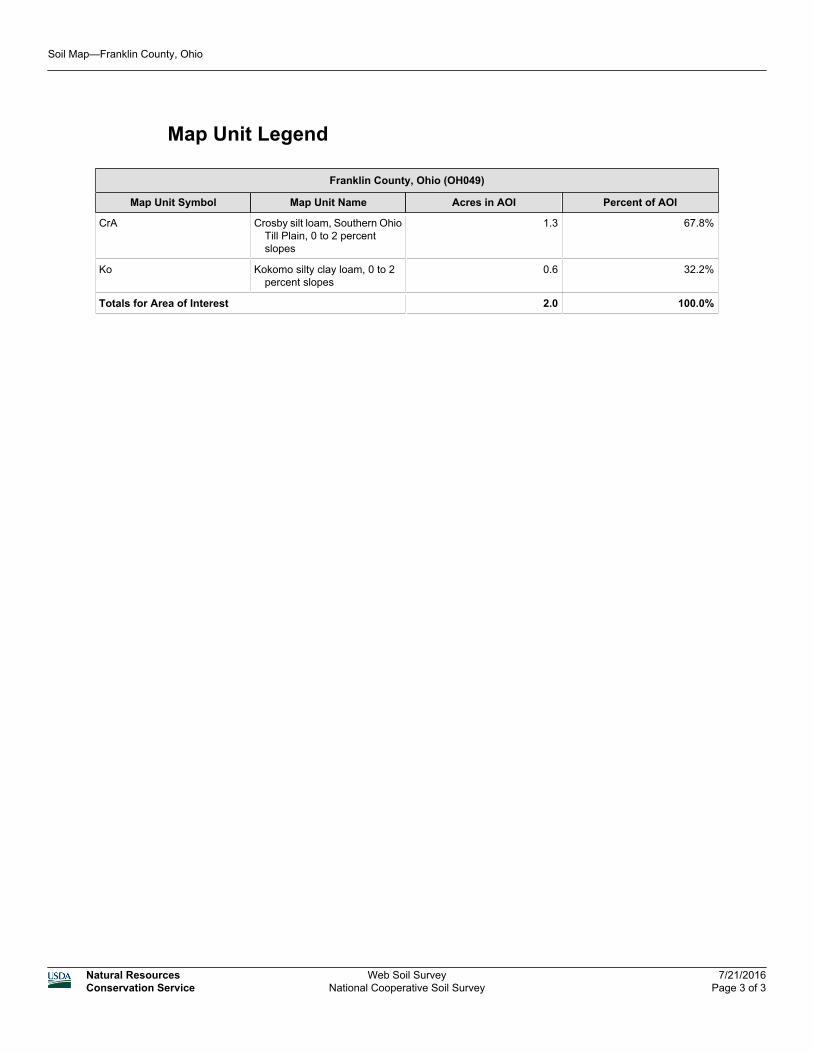
Map Unit Legend
Franklin County, Ohio (OH049)
Map Unit Symbol Map Unit Name Acres in AOI Percent of AOI
Hydraflow Hydrographs Extension for AutoCAD® Civil 3D® 2014 by Autodesk, Inc. v10.3 Friday, 08 / 26 / 2016
Hyd. No. 2
PRE
Hydrograph type = Rational Peak discharge = 0.917 cfsStorm frequency = 2 yrs Time to peak = 5 minTime interval = 1 min Hyd. volume = 275 cuftDrainage area = 0.480 ac Runoff coeff. = 0.38*Intensity = 5.030 in/hr Tc by User = 5.00 minIDF Curve = GROVE CITY IDF.IDF Asc/Rec limb fact = 1/1
* Composite (Area/C) = [(0.060 x 0.90) + (0.030 x 0.40) + (0.390 x 0.30)] / 0.480
1
0 1 2 3 4 5 6 7 8 9 10
Q (cfs)
0.00 0.00
0.10 0.10
0.20 0.20
0.30 0.30
0.40 0.40
0.50 0.50
0.60 0.60
0.70 0.70
0.80 0.80
0.90 0.90
1.00 1.00
Q (cfs)
Time (min)
PRE
Hyd. No. 2 -- 2 Year
Hyd No. 2
Hydrograph Report
Hydraflow Hydrographs Extension for AutoCAD® Civil 3D® 2014 by Autodesk, Inc. v10.3 Friday, 08 / 26 / 2016
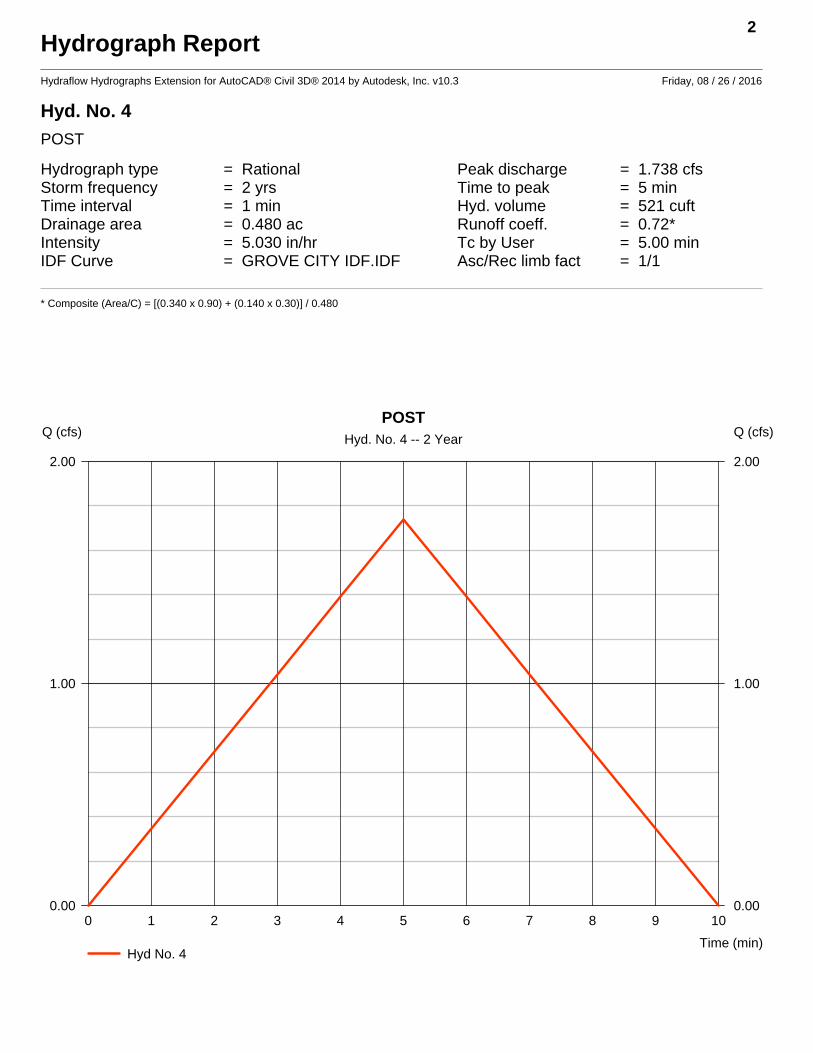
Hyd. No. 4
POST
Hydrograph type = Rational Peak discharge = 1.738 cfsStorm frequency = 2 yrs Time to peak = 5 minTime interval = 1 min Hyd. volume = 521 cuftDrainage area = 0.480 ac Runoff coeff. = 0.72*Intensity = 5.030 in/hr Tc by User = 5.00 minIDF Curve = GROVE CITY IDF.IDF Asc/Rec limb fact = 1/1
* Composite (Area/C) = [(0.340 x 0.90) + (0.140 x 0.30)] / 0.480
2
0 1 2 3 4 5 6 7 8 9 10
Q (cfs)
0.00 0.00
1.00 1.00
2.00 2.00
Q (cfs)
Time (min)
POST
Hyd. No. 4 -- 2 Year
Hyd No. 4
Hydrograph Report
Hydraflow Hydrographs Extension for AutoCAD® Civil 3D® 2014 by Autodesk, Inc. v10.3 Friday, 08 / 26 / 2016
Hyd. No. 6
DIRECT DISCHARGE
Hydrograph type = Rational Peak discharge = 0.121 cfsStorm frequency = 2 yrs Time to peak = 5 minTime interval = 1 min Hyd. volume = 36 cuftDrainage area = 0.080 ac Runoff coeff. = 0.3*Intensity = 5.030 in/hr Tc by User = 5.00 minIDF Curve = GROVE CITY IDF.IDF Asc/Rec limb fact = 1/1
* Composite (Area/C) = [(0.080 x 0.30)] / 0.080
3
0 1 2 3 4 5 6 7 8 9 10
Q (cfs)
0.00 0.00
0.05 0.05
0.10 0.10
0.15 0.15
0.20 0.20
0.25 0.25
0.30 0.30
0.35 0.35
0.40 0.40
0.45 0.45
0.50 0.50
Q (cfs)
Time (min)
DIRECT DISCHARGE
Hyd. No. 6 -- 2 Year
Hyd No. 6
Hydrograph Report
Hydraflow Hydrographs Extension for AutoCAD® Civil 3D® 2014 by Autodesk, Inc. v10.3 Friday, 08 / 26 / 2016
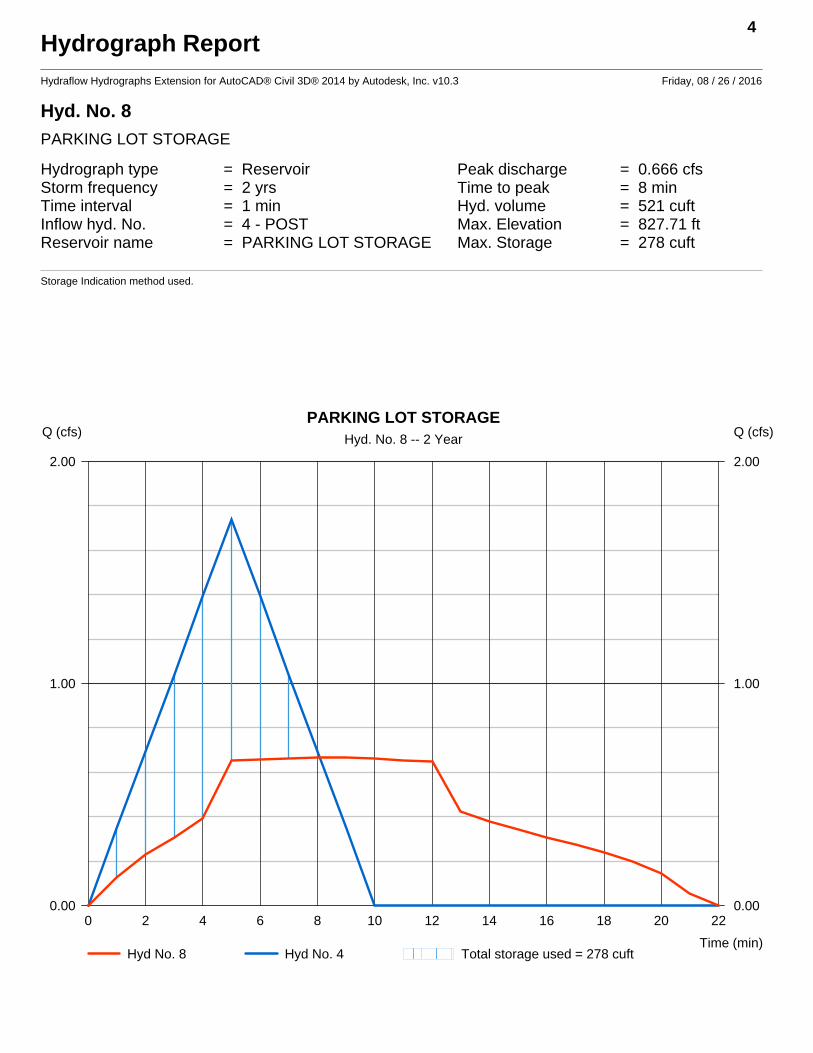
Hyd. No. 8
PARKING LOT STORAGE
Hydrograph type = Reservoir Peak discharge = 0.666 cfsStorm frequency = 2 yrs Time to peak = 8 minTime interval = 1 min Hyd. volume = 521 cuftInflow hyd. No. = 4 - POST Max. Elevation = 827.71 ftReservoir name = PARKING LOT STORAGE Max. Storage = 278 cuft
Storage Indication method used.
4
0 2 4 6 8 10 12 14 16 18 20 22
Q (cfs)
0.00 0.00
1.00 1.00
2.00 2.00
Q (cfs)
Time (min)
PARKING LOT STORAGE
Hyd. No. 8 -- 2 Year
Hyd No. 8 Hyd No. 4 Total storage used = 278 cuft
Pond Report 5
Hydraflow Hydrographs Extension for AutoCAD® Civil 3D® 2014 by Autodesk, Inc. v10.3 Friday, 08 / 26 / 2016
Pond No. 1 - PARKING LOT STORAGE
Pond Data
UG Chambers -Invert elev. = 824.79 ft, Rise x Span = 1.25 x 1.25 ft, Barrel Len = 116.00 ft, No. Barrels = 1, Slope = 0.40%, Headers = NoContours -User-defined contour areas. Conic method used for volume calculation. Begining Elevation = 826.51 ft
Stage / Storage Table
Stage (ft) Elevation (ft) Contour area (sqft) Incr. Storage (cuft) Total storage (cuft)
Note: Culvert/Orifice outflows are analyzed under inlet (ic) and outlet (oc) control. Weir risers checked for orifice conditions (ic) and submergence (s).
Hydraflow Hydrographs Extension for AutoCAD® Civil 3D® 2014 by Autodesk, Inc. v10.3 Friday, 08 / 26 / 2016
Hyd. No. 2
PRE
Hydrograph type = Rational Peak discharge = 1.117 cfsStorm frequency = 5 yrs Time to peak = 5 minTime interval = 1 min Hyd. volume = 335 cuftDrainage area = 0.480 ac Runoff coeff. = 0.38*Intensity = 6.125 in/hr Tc by User = 5.00 minIDF Curve = GROVE CITY IDF.IDF Asc/Rec limb fact = 1/1
* Composite (Area/C) = [(0.060 x 0.90) + (0.030 x 0.40) + (0.390 x 0.30)] / 0.480
6
0 1 2 3 4 5 6 7 8 9 10
Q (cfs)
0.00 0.00
1.00 1.00
2.00 2.00
Q (cfs)
Time (min)
PRE
Hyd. No. 2 -- 5 Year
Hyd No. 2
Hydrograph Report
Hydraflow Hydrographs Extension for AutoCAD® Civil 3D® 2014 by Autodesk, Inc. v10.3 Friday, 08 / 26 / 2016
Hyd. No. 4
POST
Hydrograph type = Rational Peak discharge = 2.117 cfsStorm frequency = 5 yrs Time to peak = 5 minTime interval = 1 min Hyd. volume = 635 cuftDrainage area = 0.480 ac Runoff coeff. = 0.72*Intensity = 6.125 in/hr Tc by User = 5.00 minIDF Curve = GROVE CITY IDF.IDF Asc/Rec limb fact = 1/1
* Composite (Area/C) = [(0.340 x 0.90) + (0.140 x 0.30)] / 0.480
7
0 1 2 3 4 5 6 7 8 9 10
Q (cfs)
0.00 0.00
1.00 1.00
2.00 2.00
3.00 3.00
Q (cfs)
Time (min)
POST
Hyd. No. 4 -- 5 Year
Hyd No. 4
Hydrograph Report
Hydraflow Hydrographs Extension for AutoCAD® Civil 3D® 2014 by Autodesk, Inc. v10.3 Friday, 08 / 26 / 2016
Hyd. No. 6
DIRECT DISCHARGE
Hydrograph type = Rational Peak discharge = 0.147 cfsStorm frequency = 5 yrs Time to peak = 5 minTime interval = 1 min Hyd. volume = 44 cuftDrainage area = 0.080 ac Runoff coeff. = 0.3*Intensity = 6.125 in/hr Tc by User = 5.00 minIDF Curve = GROVE CITY IDF.IDF Asc/Rec limb fact = 1/1
* Composite (Area/C) = [(0.080 x 0.30)] / 0.080
8
0 1 2 3 4 5 6 7 8 9 10
Q (cfs)
0.00 0.00
0.05 0.05
0.10 0.10
0.15 0.15
0.20 0.20
0.25 0.25
0.30 0.30
0.35 0.35
0.40 0.40
0.45 0.45
0.50 0.50
Q (cfs)
Time (min)
DIRECT DISCHARGE
Hyd. No. 6 -- 5 Year
Hyd No. 6
Hydrograph Report
Hydraflow Hydrographs Extension for AutoCAD® Civil 3D® 2014 by Autodesk, Inc. v10.3 Friday, 08 / 26 / 2016
Hyd. No. 8
PARKING LOT STORAGE
Hydrograph type = Reservoir Peak discharge = 0.677 cfsStorm frequency = 5 yrs Time to peak = 8 minTime interval = 1 min Hyd. volume = 635 cuftInflow hyd. No. = 4 - POST Max. Elevation = 827.81 ftReservoir name = PARKING LOT STORAGE Max. Storage = 369 cuft
Storage Indication method used.
9
0 2 4 6 8 10 12 14 16 18 20 22 24 26
Q (cfs)
0.00 0.00
1.00 1.00
2.00 2.00
3.00 3.00
Q (cfs)
Time (min)
PARKING LOT STORAGE
Hyd. No. 8 -- 5 Year
Hyd No. 8 Hyd No. 4 Total storage used = 369 cuft
Hydrograph Report
Hydraflow Hydrographs Extension for AutoCAD® Civil 3D® 2014 by Autodesk, Inc. v10.3 Friday, 08 / 26 / 2016
Hyd. No. 2
PRE
Hydrograph type = Rational Peak discharge = 1.237 cfsStorm frequency = 10 yrs Time to peak = 5 minTime interval = 1 min Hyd. volume = 371 cuftDrainage area = 0.480 ac Runoff coeff. = 0.38*Intensity = 6.779 in/hr Tc by User = 5.00 minIDF Curve = GROVE CITY IDF.IDF Asc/Rec limb fact = 1/1
* Composite (Area/C) = [(0.060 x 0.90) + (0.030 x 0.40) + (0.390 x 0.30)] / 0.480
10
0 1 2 3 4 5 6 7 8 9 10
Q (cfs)
0.00 0.00
1.00 1.00
2.00 2.00
Q (cfs)
Time (min)
PRE
Hyd. No. 2 -- 10 Year
Hyd No. 2
Hydrograph Report
Hydraflow Hydrographs Extension for AutoCAD® Civil 3D® 2014 by Autodesk, Inc. v10.3 Friday, 08 / 26 / 2016
Hyd. No. 4
POST
Hydrograph type = Rational Peak discharge = 2.343 cfsStorm frequency = 10 yrs Time to peak = 5 minTime interval = 1 min Hyd. volume = 703 cuftDrainage area = 0.480 ac Runoff coeff. = 0.72*Intensity = 6.779 in/hr Tc by User = 5.00 minIDF Curve = GROVE CITY IDF.IDF Asc/Rec limb fact = 1/1
* Composite (Area/C) = [(0.340 x 0.90) + (0.140 x 0.30)] / 0.480
11
0 1 2 3 4 5 6 7 8 9 10
Q (cfs)
0.00 0.00
1.00 1.00
2.00 2.00
3.00 3.00
Q (cfs)
Time (min)
POST
Hyd. No. 4 -- 10 Year
Hyd No. 4
Hydrograph Report
Hydraflow Hydrographs Extension for AutoCAD® Civil 3D® 2014 by Autodesk, Inc. v10.3 Friday, 08 / 26 / 2016
Hyd. No. 6
DIRECT DISCHARGE
Hydrograph type = Rational Peak discharge = 0.163 cfsStorm frequency = 10 yrs Time to peak = 5 minTime interval = 1 min Hyd. volume = 49 cuftDrainage area = 0.080 ac Runoff coeff. = 0.3*Intensity = 6.779 in/hr Tc by User = 5.00 minIDF Curve = GROVE CITY IDF.IDF Asc/Rec limb fact = 1/1
* Composite (Area/C) = [(0.080 x 0.30)] / 0.080
12
0 1 2 3 4 5 6 7 8 9 10
Q (cfs)
0.00 0.00
0.05 0.05
0.10 0.10
0.15 0.15
0.20 0.20
0.25 0.25
0.30 0.30
0.35 0.35
0.40 0.40
0.45 0.45
0.50 0.50
Q (cfs)
Time (min)
DIRECT DISCHARGE
Hyd. No. 6 -- 10 Year
Hyd No. 6
Hydrograph Report
Hydraflow Hydrographs Extension for AutoCAD® Civil 3D® 2014 by Autodesk, Inc. v10.3 Friday, 08 / 26 / 2016
Hyd. No. 8
PARKING LOT STORAGE
Hydrograph type = Reservoir Peak discharge = 0.684 cfsStorm frequency = 10 yrs Time to peak = 9 minTime interval = 1 min Hyd. volume = 703 cuftInflow hyd. No. = 4 - POST Max. Elevation = 827.86 ftReservoir name = PARKING LOT STORAGE Max. Storage = 421 cuft
Storage Indication method used.
13
0 2 4 6 8 10 12 14 16 18 20 22 24 26
Q (cfs)
0.00 0.00
1.00 1.00
2.00 2.00
3.00 3.00
Q (cfs)
Time (min)
PARKING LOT STORAGE
Hyd. No. 8 -- 10 Year
Hyd No. 8 Hyd No. 4 Total storage used = 421 cuft
Hydrograph Report
Hydraflow Hydrographs Extension for AutoCAD® Civil 3D® 2014 by Autodesk, Inc. v10.3 Friday, 08 / 26 / 2016
Hyd. No. 2
PRE
Hydrograph type = Rational Peak discharge = 1.432 cfsStorm frequency = 25 yrs Time to peak = 5 minTime interval = 1 min Hyd. volume = 429 cuftDrainage area = 0.480 ac Runoff coeff. = 0.38*Intensity = 7.849 in/hr Tc by User = 5.00 minIDF Curve = GROVE CITY IDF.IDF Asc/Rec limb fact = 1/1
* Composite (Area/C) = [(0.060 x 0.90) + (0.030 x 0.40) + (0.390 x 0.30)] / 0.480
14
0 1 2 3 4 5 6 7 8 9 10
Q (cfs)
0.00 0.00
1.00 1.00
2.00 2.00
Q (cfs)
Time (min)
PRE
Hyd. No. 2 -- 25 Year
Hyd No. 2
Hydrograph Report
Hydraflow Hydrographs Extension for AutoCAD® Civil 3D® 2014 by Autodesk, Inc. v10.3 Friday, 08 / 26 / 2016
Hyd. No. 4
POST
Hydrograph type = Rational Peak discharge = 2.713 cfsStorm frequency = 25 yrs Time to peak = 5 minTime interval = 1 min Hyd. volume = 814 cuftDrainage area = 0.480 ac Runoff coeff. = 0.72*Intensity = 7.849 in/hr Tc by User = 5.00 minIDF Curve = GROVE CITY IDF.IDF Asc/Rec limb fact = 1/1
* Composite (Area/C) = [(0.340 x 0.90) + (0.140 x 0.30)] / 0.480
15
0 1 2 3 4 5 6 7 8 9 10
Q (cfs)
0.00 0.00
1.00 1.00
2.00 2.00
3.00 3.00
Q (cfs)
Time (min)
POST
Hyd. No. 4 -- 25 Year
Hyd No. 4
Hydrograph Report
Hydraflow Hydrographs Extension for AutoCAD® Civil 3D® 2014 by Autodesk, Inc. v10.3 Friday, 08 / 26 / 2016
Hyd. No. 6
DIRECT DISCHARGE
Hydrograph type = Rational Peak discharge = 0.188 cfsStorm frequency = 25 yrs Time to peak = 5 minTime interval = 1 min Hyd. volume = 57 cuftDrainage area = 0.080 ac Runoff coeff. = 0.3*Intensity = 7.849 in/hr Tc by User = 5.00 minIDF Curve = GROVE CITY IDF.IDF Asc/Rec limb fact = 1/1
* Composite (Area/C) = [(0.080 x 0.30)] / 0.080
16
0 1 2 3 4 5 6 7 8 9 10
Q (cfs)
0.00 0.00
0.05 0.05
0.10 0.10
0.15 0.15
0.20 0.20
0.25 0.25
0.30 0.30
0.35 0.35
0.40 0.40
0.45 0.45
0.50 0.50
Q (cfs)
Time (min)
DIRECT DISCHARGE
Hyd. No. 6 -- 25 Year
Hyd No. 6
Hydrograph Report
Hydraflow Hydrographs Extension for AutoCAD® Civil 3D® 2014 by Autodesk, Inc. v10.3 Friday, 08 / 26 / 2016
Hyd. No. 8
PARKING LOT STORAGE
Hydrograph type = Reservoir Peak discharge = 0.697 cfsStorm frequency = 25 yrs Time to peak = 9 minTime interval = 1 min Hyd. volume = 814 cuftInflow hyd. No. = 4 - POST Max. Elevation = 827.97 ftReservoir name = PARKING LOT STORAGE Max. Storage = 523 cuft
Storage Indication method used.
17
0 2 4 6 8 10 12 14 16 18 20 22 24 26 28 30
Q (cfs)
0.00 0.00
1.00 1.00
2.00 2.00
3.00 3.00
Q (cfs)
Time (min)
PARKING LOT STORAGE
Hyd. No. 8 -- 25 Year
Hyd No. 8 Hyd No. 4 Total storage used = 523 cuft
Hydrograph Report
Hydraflow Hydrographs Extension for AutoCAD® Civil 3D® 2014 by Autodesk, Inc. v10.3 Friday, 08 / 26 / 2016
Hyd. No. 2
PRE
Hydrograph type = Rational Peak discharge = 1.712 cfsStorm frequency = 100 yrs Time to peak = 5 minTime interval = 1 min Hyd. volume = 513 cuftDrainage area = 0.480 ac Runoff coeff. = 0.38*Intensity = 9.383 in/hr Tc by User = 5.00 minIDF Curve = GROVE CITY IDF.IDF Asc/Rec limb fact = 1/1
* Composite (Area/C) = [(0.060 x 0.90) + (0.030 x 0.40) + (0.390 x 0.30)] / 0.480
18
0 1 2 3 4 5 6 7 8 9 10
Q (cfs)
0.00 0.00
1.00 1.00
2.00 2.00
Q (cfs)
Time (min)
PRE
Hyd. No. 2 -- 100 Year
Hyd No. 2
Hydrograph Report
Hydraflow Hydrographs Extension for AutoCAD® Civil 3D® 2014 by Autodesk, Inc. v10.3 Friday, 08 / 26 / 2016
Hyd. No. 4
POST
Hydrograph type = Rational Peak discharge = 3.243 cfsStorm frequency = 100 yrs Time to peak = 5 minTime interval = 1 min Hyd. volume = 973 cuftDrainage area = 0.480 ac Runoff coeff. = 0.72*Intensity = 9.383 in/hr Tc by User = 5.00 minIDF Curve = GROVE CITY IDF.IDF Asc/Rec limb fact = 1/1
* Composite (Area/C) = [(0.340 x 0.90) + (0.140 x 0.30)] / 0.480
19
0 1 2 3 4 5 6 7 8 9 10
Q (cfs)
0.00 0.00
1.00 1.00
2.00 2.00
3.00 3.00
4.00 4.00
Q (cfs)
Time (min)
POST
Hyd. No. 4 -- 100 Year
Hyd No. 4
Hydrograph Report
Hydraflow Hydrographs Extension for AutoCAD® Civil 3D® 2014 by Autodesk, Inc. v10.3 Friday, 08 / 26 / 2016
Hyd. No. 6
DIRECT DISCHARGE
Hydrograph type = Rational Peak discharge = 0.225 cfsStorm frequency = 100 yrs Time to peak = 5 minTime interval = 1 min Hyd. volume = 68 cuftDrainage area = 0.080 ac Runoff coeff. = 0.3*Intensity = 9.383 in/hr Tc by User = 5.00 minIDF Curve = GROVE CITY IDF.IDF Asc/Rec limb fact = 1/1
* Composite (Area/C) = [(0.080 x 0.30)] / 0.080
20
0 1 2 3 4 5 6 7 8 9 10
Q (cfs)
0.00 0.00
0.05 0.05
0.10 0.10
0.15 0.15
0.20 0.20
0.25 0.25
0.30 0.30
0.35 0.35
0.40 0.40
0.45 0.45
0.50 0.50
Q (cfs)
Time (min)
DIRECT DISCHARGE
Hyd. No. 6 -- 100 Year
Hyd No. 6
Hydrograph Report
Hydraflow Hydrographs Extension for AutoCAD® Civil 3D® 2014 by Autodesk, Inc. v10.3 Friday, 08 / 26 / 2016
Hyd. No. 8
PARKING LOT STORAGE
Hydrograph type = Reservoir Peak discharge = 0.715 cfsStorm frequency = 100 yrs Time to peak = 9 minTime interval = 1 min Hyd. volume = 973 cuftInflow hyd. No. = 4 - POST Max. Elevation = 828.12 ftReservoir name = PARKING LOT STORAGE Max. Storage = 670 cuft
Storage Indication method used.
21
0 2 4 6 8 10 12 14 16 18 20 22 24 26 28 30 32
Q (cfs)
0.00 0.00
1.00 1.00
2.00 2.00
3.00 3.00
4.00 4.00
Q (cfs)
Time (min)
PARKING LOT STORAGE
Hyd. No. 8 -- 100 Year
Hyd No. 8 Hyd No. 4 Total storage used = 670 cuft
Page: 1/1216-137-WaffleHouse-Calcs.xls
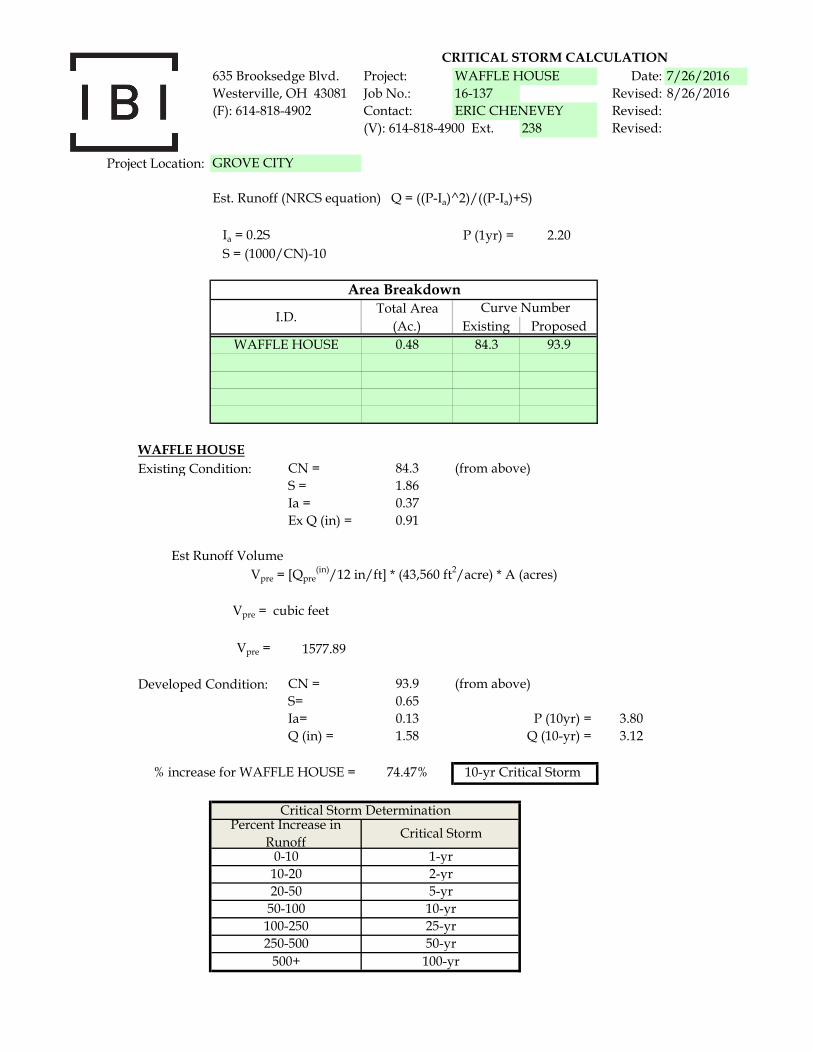
635 Brooksedge Blvd. Project: Waffle House Date: 7/26/16Westerville, OH 43081 Job No.: 16-137 Revised: 8/26/16(F): 614-818-4902 Contact: Eric Chenevey Revised:
(V): 614-818-4900 Ext. 238 Revised: 10 Yr Design Storm n = 0.013