Global Convertible Research MORGAN STANLEY DEAN WITTER Guide to PEPS Premium Exchangeable Participating Securities Anand S. Iyer, CFA Group Head (212) 761-5783 Anthony Cichocki (212) 761-8836 Douglas Decker (212) 761-5661 David J. Rudnick (212) 761-5429 Michael H. Schwartz (212) 761-5600 New York London Colum McCoole (0171) 425-6260 Tareen Hussain (0171) 425-6792 Dec 1998 PEPS: A Convertible Structure Designed to Gallop The Global Convertible Recommended Portfolio and Strategy MORGAN STANLEY DEAN WITTER Dec 1998
Transcript
Global Convertible Research
MORGAN STANLEY DEAN WITTER
Guide to PEPSPremium Exchangeable Participating Securities
Anand S. Iyer, CFAGroup Head(212) 761-5783
Anthony Cichocki(212) 761-8836
Douglas Decker(212) 761-5661
David J. Rudnick(212) 761-5429
Michael H. Schwartz(212) 761-5600
New York London
Colum McCoole(0171) 425-6260
Tareen Hussain(0171) 425-6792
Dec 1998
PEPS: A Convertible Structure Designed to Gallop
The G
lobal Convertible R
ecomm
ended Portfolio and Strategy
MO
RG
AN
STAN
LE
Y D
EA
N W
ITT
ER
Dec 1998
MORGAN STANLEY DEAN WITTER
This memorandum is based on information available to the public. No representation is made that it is accurate or complete. This memorandum is not an offer to buy or sell or asolicitation of an offer to buy or sell the securities mentioned. Please refer to the notes at the end of this report.
This memorandum is based on information available to the public. No representation is made that it is accurate or complete. This memorandum is not an offer to buy or sell or asolicitation of an offer to buy or sell the securities mentioned. Please refer to the notes at the end of this report.
PEPS for all Reasons — Issuer Considerations............................................... 25
Alternative PEPS Structures........................................................................... 27
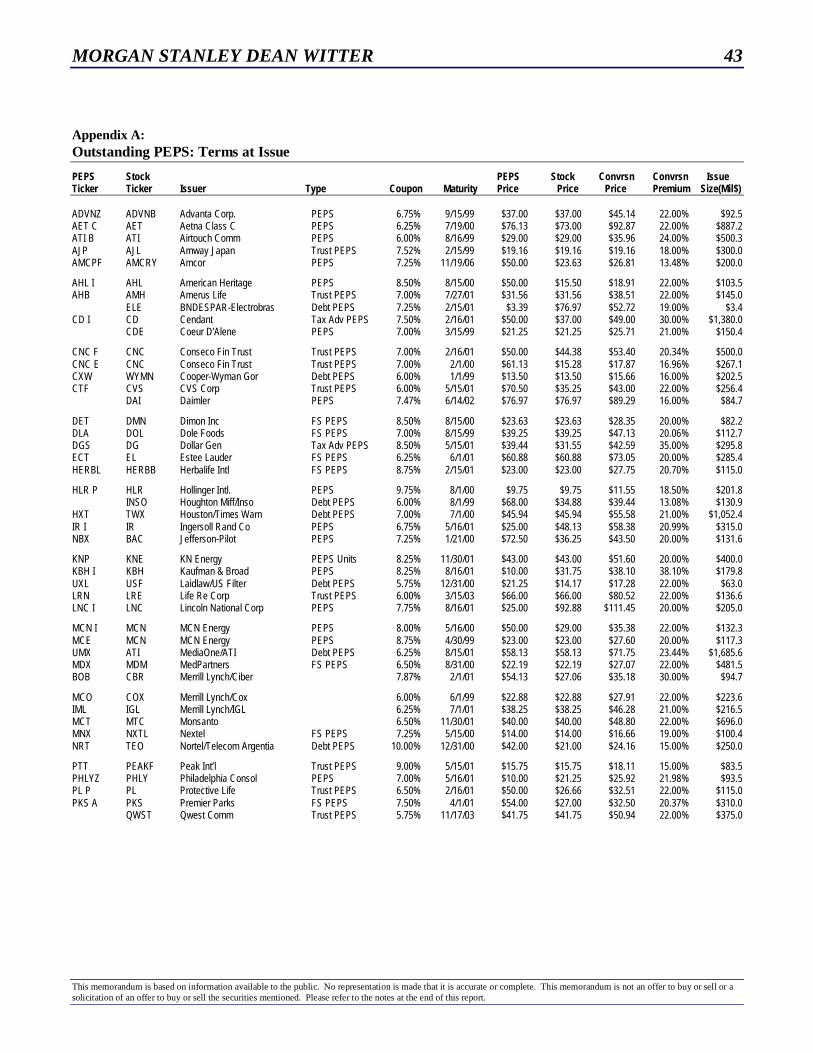
Outstanding PEPS Terms at Issue. ............................................................ 43
Recent Prices of Outstanding PEPS........................................................... 45
Performance of Individual PEPS at Maturity............................................. 47
Performance of PEPS by Maturity Group.................................................. 47
PEPS Name Variations ............................................................................. 48
PEPS and PERCS Comparison ................................................................. 49
We wish to acknowledge the valuable contributions of Ravi Arcot, Claudette Bell, David Ballard, Diane Cavarretta, Kevin
Donovan, Brooks Harris, Giovanna Marcone, David Pilgrim, Mariella Talleyrand, Joyce Yurman and Jill Woodworth in
producing this report.
MORGAN STANLEY DEAN WITTER 3
This memorandum is based on information available to the public. No representation is made that it is accurate or complete. This memorandum is not an offer to buy or sell or asolicitation of an offer to buy or sell the securities mentioned. Please refer to the notes at the end of this report.
Executive Summary
PEPS can truly be considered among the most successfulstructures found in the modern convertible market. Sincethe first PEPS appeared in 1993, a total of $25 billion PEPShave been issued. The size of the currently outstandingPEPS market is $18.9 billion, representing 12% of the con-vertible market, and we expect that proportion to grow.Indeed, after a three-month lull in convertible new issueactivity, three of the ten companies that issued convertiblesecurities since November have raised $1.5 billion viaPEPS, representing 40.1% of the total amount raised. Weexpect the vigorous growth in the PEPS market that oc-curred over the last five years to continue in the U.S., aswell as throughout the world. In fact, we think the growthrate will gain momentum as long as investors continue torequire high income and significant capital appreciationfrom their investments and issuers continue to rationalizetheir operations by monetizing non-strategic assets, de-levertheir balance sheets, and raise tax-advantaged capital.
In this publication, the Guide to PEPS, we describe the pros,cons, and valuation techniques of the PEPS security. Fromthe investor’s perspective, PEPS are a high income, highly-equity-sensitive convertible security. PEPS allow investorsconfident in the fundamental prospects of the stock under-lying the PEPS a way to balance their income and capitalappreciation expectations. On the other hand, from the is-suer’s perspective, PEPS in their various forms provide ahigh-equity content security that offer a means to efficientlyrestructure and de-leverage the balance sheet, minimize theafter-tax cost of issuance, optimize dilution, and enhancecredit rating.
PEPS and other similarly structured convertibles allow anissuer to capitalize on an already segmented investor base,while potentially enhancing its capital structure. For exam-ple, fixed income securities are appropriate for investorsseeking income while preserving capital. Common stock,on the other hand, appeals to investors looking for high re-turns primarily through capital appreciation with an oftenminimal income component, albeit with higher risk. PEPSeffectively blend these two types of investment profiles,providing investors with an opportunity to achieve a mix ofhigh current income and capital appreciation.
A PEPS issuer can thus target those investors seeking highyield with growth opportunities while maintaining its cur-rent investor base. With a high-yielding PEPS outstanding,an issuer can moderate, or in some cases eliminate, its taxinefficient common dividend, thus providing income andcapital appreciation-oriented investors an alternative in-vestment choice. Therefore, PEPS should be considered anintegral part of a company’s capital structure in an increas-ingly segmented investor environment.
Various forms of PEPS provide high income and upsideparticipation in companies that would typically not providesuch high income. Unlike traditional convertibles, theseshort-dated securities allow investors to take advantage oftheir stock picking ability rather than both their creditevaluation and stock selection skills. This is due to the factthat PEPS are high-equity content securities, and so requirestock selection abilities more than the credit evaluationskills that are implicitly required of a convertible securityinvestor.
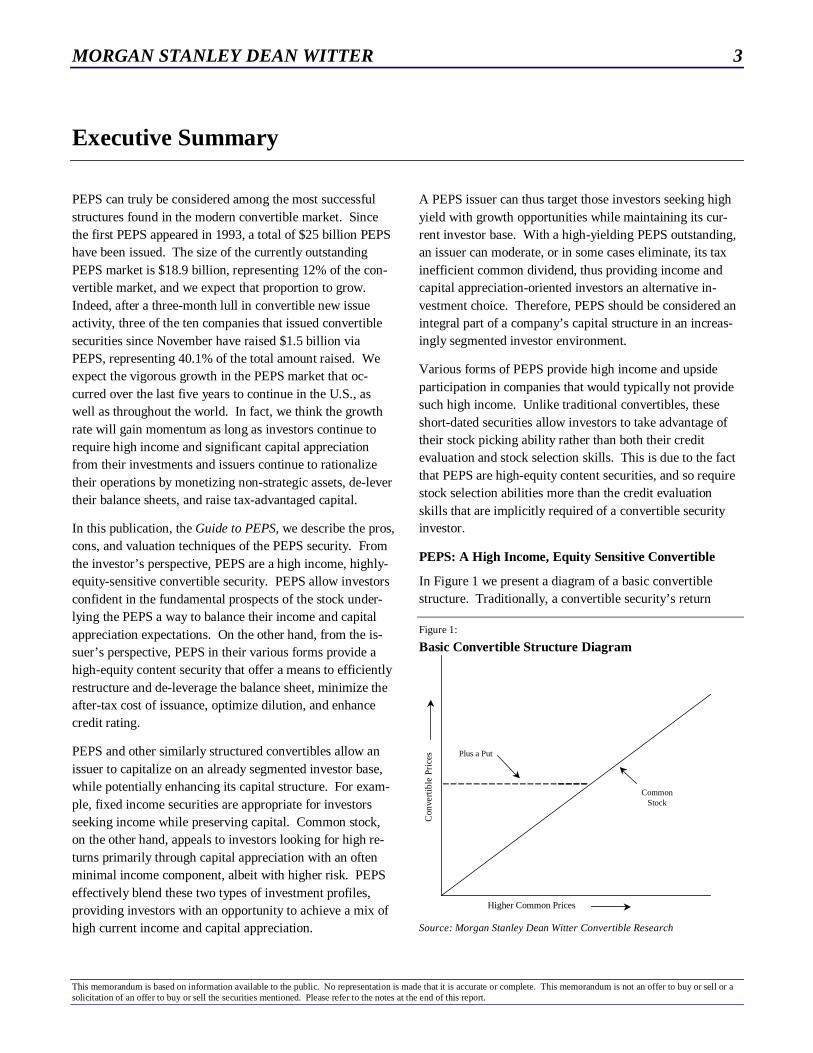
PEPS: A High Income, Equity Sensitive Convertible
In Figure 1 we present a diagram of a basic convertiblestructure. Traditionally, a convertible security’s return
Figure 1:
Basic Convertible Structure Diagram
Higher Common Prices
Con
vert
ible
Pri
ces
CommonStock
Plus a Put
Source: Morgan Stanley Dean Witter Convertible Research
4 MORGAN STANLEY DEAN WITTER
This memorandum is based on information available to the public. No representation is made that it is accurate or complete. This memorandum is not an offer to buy or sell or asolicitation of an offer to buy or sell the securities mentioned. Please refer to the notes at the end of this report.
profile is expressed as either a bond plus an out of themoney call option, or as a common stock plus a put. In Fig-ure 1 on Page 3, we have used the latter method of profilinga traditional convertible security, i.e., a combination of acommon stock with an embedded put.
Investors are attracted to traditional convertible bonds andpreferred stocks because of the upside potential thesesecurities provide, expressed by the “Common Stock” linein Figure 1, as well as the downside protection shown by the“Plus a Put” line in the diagram. The downside protectioncan be considered as insurance against a drop in thecommon stock. When investors purchase a convertible,whether at original issue or in the secondary market, theyare also paying for this insurance premium in order to obtainthe downside protection.
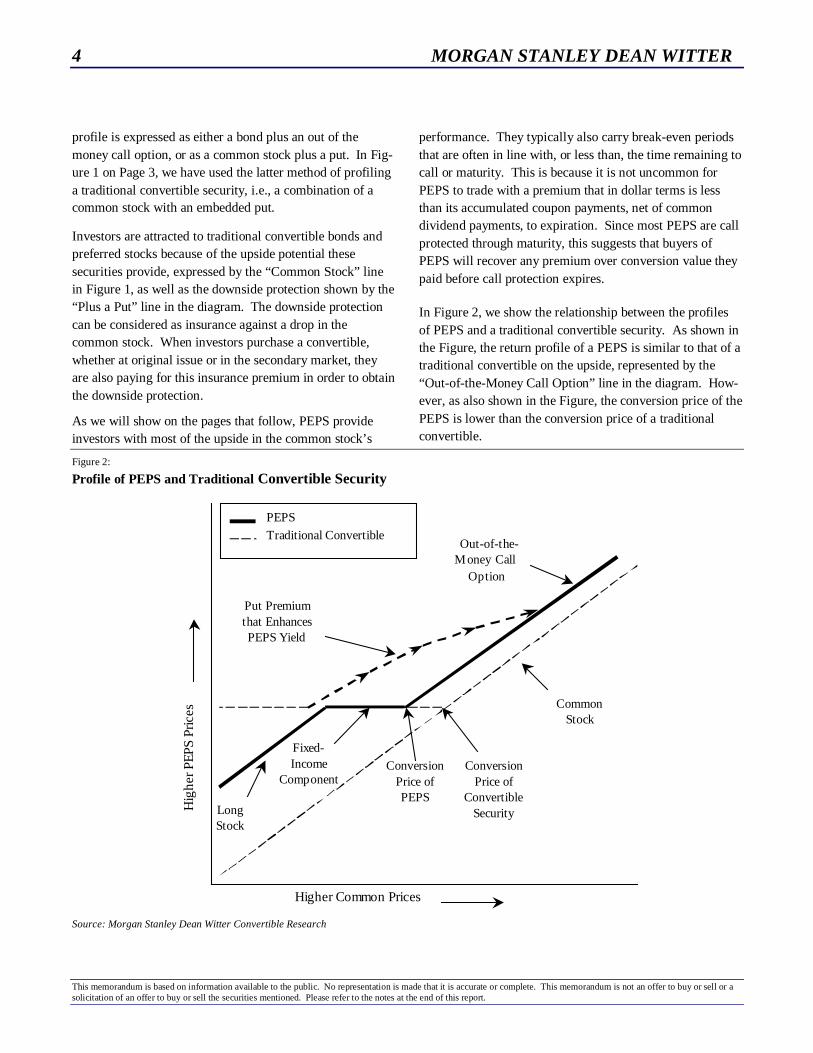
As we will show on the pages that follow, PEPS provideinvestors with most of the upside in the common stock’s
performance. They typically also carry break-even periodsthat are often in line with, or less than, the time remaining tocall or maturity. This is because it is not uncommon forPEPS to trade with a premium that in dollar terms is lessthan its accumulated coupon payments, net of commondividend payments, to expiration. Since most PEPS are callprotected through maturity, this suggests that buyers ofPEPS will recover any premium over conversion value theypaid before call protection expires.
In Figure 2, we show the relationship between the profilesof PEPS and a traditional convertible security. As shown inthe Figure, the return profile of a PEPS is similar to that of atraditional convertible on the upside, represented by the“Out-of-the-Money Call Option” line in the diagram. How-ever, as also shown in the Figure, the conversion price of thePEPS is lower than the conversion price of a traditionalconvertible.
Figure 2:
Profile of PEPS and Traditional Convertible Security
Hig
her P
EPS
Pric
es
Fixed-Income
Component
CommonStock
Out-of-the-Money Call
Option
Put Premiumthat EnhancesPEPS Yield
LongStock
PEPS
Traditional Convertible
Higher Common Prices
ConversionPrice ofPEPS
ConversionPrice of
ConvertibleSecurity
Source: Morgan Stanley Dean Witter Convertible Research
MORGAN STANLEY DEAN WITTER 5
This memorandum is based on information available to the public. No representation is made that it is accurate or complete. This memorandum is not an offer to buy or sell or asolicitation of an offer to buy or sell the securities mentioned. Please refer to the notes at the end of this report.
PEPS can be viewed as a security that converts the embed-ded put of a short-dated convertible note into a much higherthan normal coupon than could be found in a traditionalconvertible bond or convertible preferred stock.
Having converted the downside protection into higher cur-rent income and stock upside, a PEPS investor is subjectedto the underlying stock’s performance on the downside, aswell. In other words, just as PEPS provide significant up-side participation in the underlying stock, after a portion ofthe fixed-income like performance, investors are, however,exposed to the underlying stock’s downside, as shown inFigure 2.
The PEPS return profile, diagrammed in Figure 2 with abold line, suggests that PEPS investors only pay for a por-tion of the protection, the “Fixed-Income Component” line,but not for insurance they may not need. Instead, that partof the embedded put characteristic of the traditional con-vertible, shown by the dotted line, is converted into currentincome.
In other words, PEPS allow investors confident about theprospects of the issuer to convert a portion of the theoreticalbond floor typical of a traditional convertible security intohigh current income. Meanwhile, PEPS tend to have higherequity sensitivity because they are issued at a lower conver-sion premium than a traditional convertible bond or a pre-ferred stock. Thus, PEPS provide higher upside participa-tion in the underlying common. As a result, the payoff pat-tern of a PEPS resembles a “Galloping Horse,” shown onthe cover of this report.
In Table 1, we show the weighted-average current yield andpremium for PEPS issued in 1998. The same information is
presented for both cash-pay convertible bonds and preferredstocks issued this year, and as a combined group.
As can be seen in the Table, PEPS investors on average re-ceive approximately 200 basis points (100 basis points =1%) more in current yield, and realize a 270 basis pointsavings in premium as a result of the elimination of the em-bedded put. The lower premium by definition contributes tothe PEPS greater upside participation in the underlyingstock. These factors combine to provide investors withhigher income and equity sensitivity. Hence, equity-oriented convertible investors and growth and income fundsfind PEPS to be attractive investment choices.
Also, since PEPS are generally issued by mid-to large-capcompanies, in contrast to the typical convertible issuer,which tends to be a small to mid-cap company, PEPS in-vestors are able to benefit from the added liquidity. This isparticularly relevant given the current market environmentcharacterized by out-performance by the large-cap stocksrelative to small-cap stocks.
Convertible investors might consider another point that re-lates to the issue of downside protection. While there is noquestion PEPS by design provide only a modicum of down-side protection, traditional convertible securities, particu-larly those with sub-investment grade ratings, have demon-strated weak records of downside protection. This wasclearly evident during the 1998 market decline caused bywidening credit spreads and the 1994 market decline causedby rising interest rates. These two scenarios, characterizedby rising rates and a credit crunch, have been behind someof the more pronounced equity market declines during thedecade of the 90s.
The expectation of the downside protection of traditionalconvertible securities, especially in the case of non-investment grade convertible bonds and preferred stocks,has not materialized for investors, at least in the short run.The record of downside protection has been suspect for longduration convertible securities such as zero-coupon bonds,trust preferreds, and preferred stocks, especially when theyare sub-investment grade rated and unregistered.
There is no question that in most cases, investors in con-vertible securities recover their principal investment, but in
Source: Morgan Stanley Dean Witter Convertible Research
6 MORGAN STANLEY DEAN WITTER
This memorandum is based on information available to the public. No representation is made that it is accurate or complete. This memorandum is not an offer to buy or sell or asolicitation of an offer to buy or sell the securities mentioned. Please refer to the notes at the end of this report.
the short run, their performance relative to traditional PEPS,brings into focus the theoretical expectations of downsideprotection vs. reality. This is because PEPS are relativelyinsensitive to changes in interest rates, credit spreads, etc.,but are most sensitive to its underlying common stock. Wediscuss these sensitivities later in this report.
The previous discussion is not meant to suggest that thePEPS of any issuer should be summarily purchased, vis-à-vis traditional convertible securities. Instead, investors
should consider the PEPS when they are comfortable withthe fundamental prospects of the company. For convertibleinvestors, a more efficient way to invest in PEPS would beto include them in a portfolio of other, more balanced and/ordefensive types of convertible structures. Investors wouldthus create a portfolio that in its entirety offers a good bal-ance of upside potential and downside protection.
For recommended PEPS securities, please refer to theMSDW Recommended Convertible Portfolio.
MORGAN STANLEY DEAN WITTER 7
This memorandum is based on information available to the public. No representation is made that it is accurate or complete. This memorandum is not an offer to buy or sell or asolicitation of an offer to buy or sell the securities mentioned. Please refer to the notes at the end of this report.
Introduction
PEPS, which are either Participating Equity PreferredShares or Premium Exchangeable Participating Securities1,are convertible securities designed to provide investors withhigh current income along with high equity-like participa-tion in the underlying stock. These features have allowedthis convertible structure to gain broad acceptance amongconvertible, growth and income, equity and income, andindividual investors. International and domestic companieshave also embraced PEPS because the flexibility and vari-ous features of the security enable issuers to de-leveragetheir balance sheets and monetize non-strategic assets in anorderly fashion.
In this report we examine the basic structure of PEPS, itstypical terms as well as those features unique to the security.We review the variables that should be considered whendetermining fair value, and discuss how these securitieshave performed. We also discuss how issuers have tailoredthe basic structure of the security to meet a variety of needs,as well as some of the more involved structures and the ad-vantages they provide. A review of accounting and taxtreatment rounds out our comprehensive look at this veryinnovative structure.
Market Growth
Since June of 1993, 86 issuers have raised $25 billion byissuing PEPS and PEPS-like securities. In fact, the PEPS’new issue market has posted compound annual growth of81.1%, rising from just $1.2 billion at the end of 1993. Thenumber of issues per year has also grown from just three in1993 to 22 in 1998. PEPS new issuance as a percentage ofall convertible new issue volume has also expanded from4.9% in 1993, to 19.6% in 1998. Figure 3 illustrates thedramatic annual and cumulative growth in the size of thePEPS new issue market since 1993.
1 The Participating Equity Preferred Share version of the security, alsoknown as Equity PEPS, is issued by companies for the benefit of their ownbalance sheets. The Premium Exchangeable Participating Security, alsoknown as Debt PEPS, is used as a conduit to distribute stock in an orderlyfashion. Consequently, in this structure the issuer and the distributedshares can be from two different companies.
PEPS’ Investors
PEPS investors include income and growth-oriented inves-tors like mutual funds, pension plans, endowments, insur-ance companies and individual investors. These investorsall find that the characteristics of PEPS fall within their re-spective investment parameters. We believe that the key toinvestor acceptance has been the continued solid perform-ance of the security.
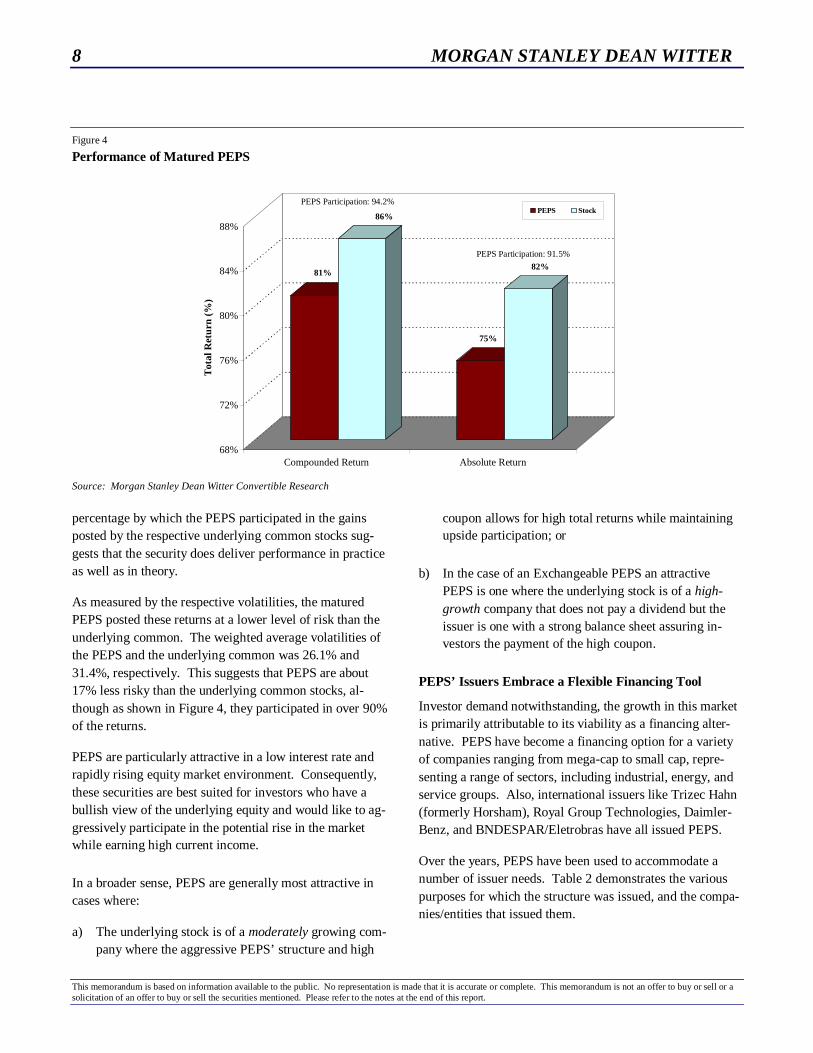
In Figure 4 on Page 8, we evaluated the performance of the21 PEPS that have matured so far. The first two columnsreflect the performance of PEPS relative to their underlyingstocks assuming the reinvestment of PEPS’ coupon and therespective common dividends. The second two columnsreflect the same comparison, but based on simple total re-turn only. PEPS’ performance as a percentage of the un-derlying common performance is also noted.
We chose matured PEPS because of the stable frame of ref-erence they provide. Of the 21 PEPS represented in Figure4, only three showed losses. The returns and the
Figure 3
Annual and Cumulative PEPS New Issue Volume
1.2 1.2
3.4
4.6
2.5
7.1
4.0
11.1
5.3
16.4
8.5
24.9
0
5
10
15
20
25
1993 1994 1995 1996 1997 1998
Annual PEPS New Issue Volume
Cumulative PEPS New Issue Volume:1993-1998
Source: Morgan Stanley Dean Witter Convertible Research
8 MORGAN STANLEY DEAN WITTER
This memorandum is based on information available to the public. No representation is made that it is accurate or complete. This memorandum is not an offer to buy or sell or asolicitation of an offer to buy or sell the securities mentioned. Please refer to the notes at the end of this report.
Figure 4
Performance of Matured PEPS
81%
86%
75%
82%
68%
72%
76%
80%
84%
88%
Tot
al R
etur
n (%
)
Compounded Return Absolute Return
PEPS StockPEPS Participation: 94.2%
PEPS Participation: 91.5%
Source: Morgan Stanley Dean Witter Convertible Research
percentage by which the PEPS participated in the gainsposted by the respective underlying common stocks sug-gests that the security does deliver performance in practiceas well as in theory.
As measured by the respective volatilities, the maturedPEPS posted these returns at a lower level of risk than theunderlying common. The weighted average volatilities ofthe PEPS and the underlying common was 26.1% and31.4%, respectively. This suggests that PEPS are about17% less risky than the underlying common stocks, al-though as shown in Figure 4, they participated in over 90%of the returns.
PEPS are particularly attractive in a low interest rate andrapidly rising equity market environment. Consequently,these securities are best suited for investors who have abullish view of the underlying equity and would like to ag-gressively participate in the potential rise in the marketwhile earning high current income.
In a broader sense, PEPS are generally most attractive incases where:
a) The underlying stock is of a moderately growing com-pany where the aggressive PEPS’ structure and high
coupon allows for high total returns while maintainingupside participation; or
b) In the case of an Exchangeable PEPS an attractivePEPS is one where the underlying stock is of a high-growth company that does not pay a dividend but theissuer is one with a strong balance sheet assuring in-vestors the payment of the high coupon.
PEPS’ Issuers Embrace a Flexible Financing Tool
Investor demand notwithstanding, the growth in this marketis primarily attributable to its viability as a financing alter-native. PEPS have become a financing option for a varietyof companies ranging from mega-cap to small cap, repre-senting a range of sectors, including industrial, energy, andservice groups. Also, international issuers like Trizec Hahn(formerly Horsham), Royal Group Technologies, Daimler-Benz, and BNDESPAR/Eletrobras have all issued PEPS.
Over the years, PEPS have been used to accommodate anumber of issuer needs. Table 2 demonstrates the variouspurposes for which the structure was issued, and the compa-nies/entities that issued them.
MORGAN STANLEY DEAN WITTER 9
This memorandum is based on information available to the public. No representation is made that it is accurate or complete. This memorandum is not an offer to buy or sell or asolicitation of an offer to buy or sell the securities mentioned. Please refer to the notes at the end of this report.
Table 2
PEPS Design Allows Issuers to Meet Various Objectives
Purpose Issuers
A. De-leveraging Balance Sheet. Westinghouse, Mascotech and Cendant
B. Monetizing Non-Strategic Assets. MediaOne/Airtouch, American Express/ First Data Corp,Houston Industries/Time Warner
C. Merger Consideration. Aetna, AirTouch Communications
D. Orderly Distribution of Stock held by non-registered Holders:
I. Institutional Salomon-Smith Barney/Cincinnati Bell
II. Corporate Insiders (e.g. Estate Planning) Dole Foods, DIMON
Source: Morgan Stanley Dean Witter Convertible Research
Issuers have also embraced a product that can provide anumber of advantages, including enabling tax-advantagedcoupon payments, monetization of non-strategic assets,and a strengthening of their balance sheets.
PEPS Pros and Cons for Issuers and Investors
PEPS investors generally require high income and a highyield advantage over the common stock, a performance-based conversion premium, and a significant degree ofstock participation. At the same time, the many advan-tages PEPS structures offer issuers will continue to makethem very reasonable financing alternatives.
Table 3 summarizes these advantages and disadvantagesof PEPS for both investor and issuer.
Still, the advantages for both issuer and investor do notcome without a cost. Though investors benefit from the
significant yield advantage these securities provide, whichalso gives them a degree of out performance if the stocktrends below the original issue price, PEPS do not providethe downside support typical of a traditional convertiblebond or convertible preferred stock. While PEPS are lessinterest rate and credit spread sensitive, factors which willdirectly influence the bond value of a traditional converti-ble bond, they are also much more equity sensitive thanconvertible bonds and preferred stock, causing them tooutperform the traditional convertible security.
Meanwhile, for issuers, even though the PEPS coupon istax advantaged, it is still higher than its comparable ma-turity debt or common dividend yield. The high couponof the PEPS, however, ensures distribution of the under-lying common stock through the PEPS issuance.
10 MORGAN STANLEY DEAN WITTER
This memorandum is based on information available to the public. No representation is made that it is accurate or complete. This memorandum is not an offer to buy or sell or asolicitation of an offer to buy or sell the securities mentioned. Please refer to the notes at the end of this report.
Table 3
PEPS: Advantages and Disadvantages for Investors and Issuers
Investor Advantages Issuer Advantages
Income Advantage: Appropriate for investors with a favor-able view of the common stock and in need of high currentincome.
Strategic Financial Restructuring: Provides issuers with anorderly and efficient way of disposing of non-strategic assets.Also allows issuer to infuse equity into the balance sheet at apotentially higher price than the current stock price.
High Current Income: The average yield of all PEPS issuedsince 1993 is 7.36%, providing a yield advantage of almost640 basis points over the underlying common stock.
Tax Advantaged Coupon: The PEPS’ coupon payments aretypically tax advantaged, deductible or deferred to the issuer.
Performance-based Conversion Premium: Relative to thecommon stock, investors incur the conversion premium onlyif the stock rises above the issue price.
If at mandatory maturity:
(i) the stock price is above the Conversion Price, holdersincur the conversion premium and receive stock at a mini-mum ratio, usually .8000 to .8500 of a share;
(ii) the stock is below the issue price at maturity, holders getone share;
(iii) the stock is between the Issue Price and ConversionPrice, holders receive the value of the original investment instock.
Investors receive coupon payments regardless of where thestock price closes at maturity.
Issuer Equity Participation: Exchangeable PEPS allow issuerto lock in sale price while maintaining upside participation inthe common. The fact that issuers gain from stock apprecia-tion somewhat aligns issuer and investor interests.
Favorable Rating Agency Treatment: Because of the man-datory nature of the PEPS, rating agencies view these issuesas having greater equity content than a convertible bond orpreferred stock.
Visibility: PEPS are generally listed on a stock exchange. Broaden Investor Base: PEPS appeal to growth and income,equity and income, convertible, and individual investors. Asa result, the issuer can offer security to widest possible rangeof investors.
Investor Disadvantages
Weak Downside Protection: Although the significant yieldadvantage gives PEPS a degree of out performance if thestock trends lower, PEPS lack the downside protection of atypical convertible bond or preferred stock. Still, PEPS tendto be significantly less interest rate and credit spread sensi-tive than convertible bonds or preferred stocks, although theyare also much more equity sensitive than convertible bondsand preferred stock.
Issuer Disadvantages
High Coupon of Security. Issuer typically has to providehigher coupon than its comparable maturity debt or commondividend yield in order to ensure the distribution of the un-derlying common stock via the PEPS while still maintainingthe upside in it. However, the coupon payments are gener-ally tax-advantaged. This reduces the net effective costwhile postponing an immediate capital gains tax payment.
Source: Morgan Stanley Dean Witter Convertible Research
MORGAN STANLEY DEAN WITTER 11
This memorandum is based on information available to the public. No representation is made that it is accurate or complete. This memorandum is not an offer to buy or sell or asolicitation of an offer to buy or sell the securities mentioned. Please refer to the notes at the end of this report.
Typical Issue Terms
PEPS are typically issued at a price that is equal to the priceof the stock into which it converts and have conversionpremiums that typically range from 18% to 23%. The re-sulting conversion price means the minimum conversionratio at maturity is a fraction of a share. The maximumnumber of shares PEPS’ holders will typically receive atmaturity is one. All ratios are adjusted for stock splits,stock dividends and any other distribution that affects thenumber of shares outstanding. The security typically ispriced with a current yield that is anywhere from 500 to 700basis points higher than the underlying common stock divi-dend yield. The PEPS annual coupon is usually paid quar-terly, although some PEPS variations pay semi-annually.Typically, these securities mandatorily convert into commonstock or mature in 3 to 5 years. They are usually call pro-tected for most of their life.
Finally, some PEPS, particularly the exchangeable kind,cannot be converted but are exchanged into common stockat the issuer’s option at maturity, while others can be con-verted at any time at the holder’s option at the minimumconversion ratio.
The recently issued KN Energy 8.25% PEPS is a good ex-ample of a typical structure. The terms are detailed in thefollowing table.
Table 4
KN Energy 8.25% due 11/30/2001
PEPS’ Issue Price: $43.00
Underlying Common Price: $43.00
Conversion Premium: 20.00%
Conversion Price: $51.60
Minimum Conversion Ratio: 0.8333
Maximum Conversion Ratio: 1.0000
PEPS Yield: 8.25%
Common Yield: 2.60%
Yield Advantage: 5.65%
Annual Coupon Payment $3.54
Quarterly Coupon Payment: $0.887
Expiration Date: 11/30/01
Call Protection: Life
Source: Morgan Stanley Dean Witter Convertible Research
The defining feature of PEPS is its conversion feature. Atits maturity, the number of common shares a PEPS’ holderwill be entitled to will depend on where the common stockprice is at the time.
In Figure 5, the simple return profile of the average PEPS atexpiration is presented. As shown in the Figure, regardlessof the structure, a PEPS return at maturity mirrors the illus-tration.
Figure 5
PEPS Payoff Scenario
Common Prices at Maturity
A
B
C
Issue Price Conversion Price
Premium Paid
Original Investment Recovered
in StockNo Premium Paid
Source: Morgan Stanley Dean Witter Convertible Research
As shown in the Figure, if the stock price is above the Con-version Price, represented by the “A” range, investors re-ceive a preset number of shares while participating in thestock price appreciation. Referring to the KN Energy ex-ample, if the stock closed above the $51.60 ConversionPrice, holders would be entitled to receive 0.8333 shares ofcommon stock (the ratio is equal to the IssuePrice/Conversion Price).
The “B” Range represents the return if the underlying stockcloses between the Issue Price and the Conversion Price. Inthis area, investors will receive common shares based on arange between the maximum ratio, which is 1, and theminimum ratio, which is 0.8333. The value of the stockequals the price of the PEPS at issue. In the KN Energyexample, this would cover the range of prices between$43.00 and $51.60. To illustrate, if the average price of
12 MORGAN STANLEY DEAN WITTER
This memorandum is based on information available to the public. No representation is made that it is accurate or complete. This memorandum is not an offer to buy or sell or asolicitation of an offer to buy or sell the securities mentioned. Please refer to the notes at the end of this report.
KNE stock is $48.00 on the expiration date, holders wouldbe entitled to a fraction of stock worth $43.00. The fractionis simply the issue price divided by the stock price at expi-ration, or 0.8958 ($43.00/$48.00) shares. The value ofwhich is 0.8958 x $48.00 = $43.00, or the issue price.
If the stock price is below the issue price at expiration, rep-resented by range “C,” investors receive one share. Thiswould occur if KNE stock closed below $43.00.
Performance Based Conversion Premium
Another characteristic unique to PEPS is that investors donot actually pay a premium at the time of issue. This is be-cause the security is typically issued at the same price as thestock into which it is mandatorily convertible. Investors intraditional convertibles pay the premium at issue.
Consider a PEPS priced at $20 with a conversion price of$25. The maximum conversion ratio is 1, and the minimumconversion ratio is 0.80 ($20/$25). As the stock rises from$20 to $25, the effective ratio will decline from 1 to 0.80.The declining ratio, and subsequent decline in the conver-sion value, represents the conversion premium PEPS hold-ers pay.
From the issuer’s perspective, the PEPS premium can beviewed as performance based. If the stock performs welland rises above the conversion price by maturity, the issuerin our example will have to deliver 0.8000 shares. The 0.20share difference will represent the premium the issuer earns,or that the investor pays. In this way, both the issuer andinvestor benefit if the stock performs, thus aligning theirinterests.
The conversion ratio is only variable between the issue priceand the conversion price. If the stock rises above the con-version price, or trades below the issue price, the conversionratio will be fixed.
The concept of a performance based conversion premium isparticularly relevant for PEPS structures that can only beconverted at maturity. However, even for PEPS structuresthat can convert at any time, we think it only makes sense todo so at maturity, when the relationship of stock price to the
issue price and conversion price will dictate the best courseof action.
The Past and the Future
While PEPS have certainly become a useful financing solu-tion, the structure was not the first mandatory. In terms ofproduct evolution, PEPS succeeded PERCS on the converti-ble product continuum. The main difference between thestructures is that PEPS offer uncapped upside participationin its underlying common, while the upside of PERCS wascapped. The other major difference is that PERCS investorsdo not give up any upside unless the underlying stockmoves above the cap price. Consequently, if an investorbelieves that the stock is likely to be a moderate performerover the life of the security, the high coupon of a PERCS,relative to a PEPS, would contribute to a higher total returnfor the PERCS investor.
If over the next several years equity market performancewere to slow to high single digit to low double digit returns,rather than the 20% to 30% returns enjoyed by investorsduring the past few years, issuance of PERCS may be re-kindled. This possibility should not be ignored, and couldbe appealing to value and income-oriented investors.
One drawback that PERCS have had is the decline in theirequity sensitivity, or delta, as the underlying stock rises andapproaches the cap price. We think the next generation ofpopular PERCS may be the multi-step/cap PERCS, which isa structure Morgan Stanley pioneered, as it did the originalPERCS structure.
In a subsequent publication we intend to discuss the multistep/cap PERCS. But for now, in Appendix F on Page 49,we have presented a table that briefly describes the differ-ences between PEPS, the topic of this report, and PERCS,the original mandatory security.
PEPS Name Variations
PEPS go by a number of acronyms, including DECS,ACES, PRIDES, PIES and SAILS. (A complete list ofthese acronyms appears in Appendix E on Page 48). Forthe purpose of our report, we will use the term PEPS to de-scribe all these types of structures.
MORGAN STANLEY DEAN WITTER 13
This memorandum is based on information available to the public. No representation is made that it is accurate or complete. This memorandum is not an offer to buy or sell or asolicitation of an offer to buy or sell the securities mentioned. Please refer to the notes at the end of this report.
PEPS Structure and Evaluation
In this section we discuss the fundamental dynamics of thePEPS structure at maturity. We also address the ways thatPEPS are evaluated in the secondary market. The sensitiv-ity of PEPS prices to changes in the price and volatility ofits underlying stock, as well as changes in interest rates willalso be discussed. We round out this section with a look atsome of the theoretical characteristics unique to PEPS.
Consider the terms of a hypothetical PEPS issue:
Issue Price: $20.00
Coupon: 6.75%
Dividend: $1.35
Stock Dividend: $0.00
Conversion Premium: 25%
Conversion Ratio: 0.8000
Call Protection: 3.00 Yrs
Break-even: 2.96 Yrs
Source: Morgan Stanley Dean Witter Convertible Research
PEPS provide investors with most of the upside in thecommon stock’s performance. They typically also carrybreak-even periods that are often in line with, or less than,the time remaining to call or maturity. This is because it isnot uncommon for PEPS to trade with a premium that indollar terms is less than its accumulated coupon payments,net of common dividend payments, to expiration. Sincemost PEPS are call protected through expiration, this sug-gests that buyers of PEPS recover any premium over con-version value they paid before call protection expires.
Using the hypothetical PEPS terms we review the payoffscenarios at maturity. If the price of the common rises to$50.00 at expiration, the value of the PEPS will be $40.00($50.00 x 0.8000). The difference between the stock priceat issue and the value of the PEPS at expiration will reflectthe “postponed” premium, that is now paid, relative towhere the stock traded over the security’s life.
If the stock trades between the issue price and the Conver-sion Price of the PEPS, holders receive an amount of stockequal in value to the $20.00 issue price.
If the stock drops to $10.00 by expiration, the value of thePEPS will be $10.00. In these last two cases, as we dis-cussed earlier, the holder pays no premium.
To illustrate these three possible outcomes, we have repro-duced the familiar “galloping horse” diagram in Figure 6.
Though not figured into the discussion of the PEPS’ expira-tion possibilities, but important nonetheless, is the fact thatthe PEPS in our example was offered with a significantyield advantage over its underlying stock. So, the stock’sdrop at expiration would be somewhat mitigated by thequarterly coupon payments the holder would have receivedover the life of the security. Meanwhile, the return of thePEPS given a rise in the stock would be similarly increasedwhen the income is added to the price appreciation.
In Figure 7, we illustrate the return profile of the typicalPEPS. As shown, on a total return basis, the yield advan-tage of the PEPS will give investors a sizable cushion if thestock trends lower. It is also clear on this graph how thePEPS will share in a significant degree of its underlyingcommon stock’s rise as well.
Figure 6
PEPS Payoff Scenarios
$20.00 $25.00
If Stock closes above $25.00,
holders get 0.8000 shares.
If Stock closes below $20.00,
holders get 1.0000 share.
If Stock closes at $22.00, holders get ($20.00/$22.00), or
0.9091 shares.
$10.00 $50.00
$40.00
($50.00 x 0.8000)
Between 1.0000 and
0.8000 Shares
$10.00
($10.00 x 1.0000)
PE
PS
Pri
ces
Stock Prices
Source: Morgan Stanley Dean Witter Convertible Research
14 MORGAN STANLEY DEAN WITTER
This memorandum is based on information available to the public. No representation is made that it is accurate or complete. This memorandum is not an offer to buy or sell or asolicitation of an offer to buy or sell the securities mentioned. Please refer to the notes at the end of this report.
Figure 7
PEPS/Common Total Return at Expiration
Common Prices
PEPS Price Return at Expiration
PEPS plus Income at Expiration
Common plus Income at Expiration
Common Price Return at Expiration
Issue Price Conversion Price
Source: Morgan Stanley Dean Witter Convertible Research
Valuing a PEPS
The pay-off profile of PEPS at expiration certainly helpsillustrate the dynamics of the security. However, investorsshould not view “expiration pay-off analysis” as the onlyway to determine the richness or cheapness of PEPS. It isalso important to consider the fair value of the outstandingsecurity. With this in mind, we review the various ways thefair value of outstanding PEPS can be determined.
Take another look at Figure 6 on Page 14. It is easy to seehow PEPS can be separated into three components: upside,downside, and flat participation profiles. These profilescorrespond to the parts of a call spread, and a convertiblesecurity with a put.
The Call Spread
Consider the following information: Table 5
“Call Spread” Components
PEPS = Underlying Common Stock (1)
+ (Out-of-the Money Call Option on theUnderlying Common struck at theConversion Price) x Conversion Ratio
(2)
- At-the-Money Call Option on the Un-derlying Common Stock
(3)
+ Present value of the Incremental In-come over the Common Dividend
(4)
Source: Morgan Stanley Dean Witter Convertible Research
MORGAN STANLEY DEAN WITTER 15
This memorandum is based on information available to the public. No representation is made that it is accurate or complete. This memorandum is not an offer to buy or sell or asolicitation of an offer to buy or sell the securities mentioned. Please refer to the notes at the end of this report.
As shown in the table, PEPS can be viewed as a commonstock with extra income. The income is the compensationfor the net premium incurred from the long and short calloptions (Line 2 - Line 3 in Table 5). The short call is struckat the issue price, so it is at-the-money, while the long call isstruck at the Conversion Price, so it is out-of-the money.The long call provides the upside participation in the com-mon stock. The net premium received from writing the call,and purchasing a partial call, is effectively the present valueof the income differential between the PEPS and the com-mon stock (Line 4). This net premium is what is receivedby the investor as a quarterly coupon payment or paid by theissuer as coupon.
In Figure 8 we reproduced the PEPS-at-expiration chartfrom Figure 6. The various components of the call-spreadexample have been labeled to match the diagram.
Figure 8
PEPS/Call Spread Diagram
Issue Price
Short at the Money Call
OptionLong
Underlying Stock
At the Money Strike
Out of the
Money Strike
Long Out of the Money
C ll
Conversion Price
Source: Morgan Stanley Dean Witter Convertible Research
Convertible Security with a Put
Table 6 describes an alternative method of calculating thefair value of a PEPS:
This method is essentially the same as the call spread, withonly a few differences. However, because the call spread iseasier to model, we think it is the preferred valuationmethod. In this case, the PEPS can be viewed as a shortmaturity convertible note (Line 1 in the Table 6) plus the
excess premium received from the short at the money putoption.
Convertible investors will realize that the combination ofthe short-maturity note and the long out-of-the money calloption (Line 2 in the Table) is actually the equivalent of ashort-dated convertible note. PEPS typically provide ahigher level of income than the average convertible, so wemust value the excess income of the PEPS over and abovethe coupon of the traditional security. This excess incomecan be viewed as compensating the investor for taking therisk of a short at-the-money put option.
Figure 9 illustrates how the various components of the con-vertible security/put evaluation method fit the PEPS graph.
Figure 9
PEPS/Convertible with a Put Diagram
Standard Convertible S i
Short at the Money Put Option
Issue Price Conversion
Source: Morgan Stanley Dean Witter Convertible Research
Table 6
“Convertible with a Put” Components
PEPS = Short-Maturity Note (1)
+ (Out-of-the-money Call Option on theUnderlying Common Stock Struck atthe Conversion Price) x ConversionRatio
(2)
- At-the-Money Put Option struck at theIssue Price on the Underlying CommonStock
(3)
Source: Morgan Stanley Dean Witter Convertible Research
16 MORGAN STANLEY DEAN WITTER
This memorandum is based on information available to the public. No representation is made that it is accurate or complete. This memorandum is not an offer to buy or sell or asolicitation of an offer to buy or sell the securities mentioned. Please refer to the notes at the end of this report.
PEPS Sensitivity Profiles
In the sections that follow, we will discuss the sensitivity ofa PEPS theoretical value to changes in specific evaluationvariables, (while all other factors are held constant). Wehave used the KN Energy 8.25% PEPS cited earlier to illus-trate these changes.
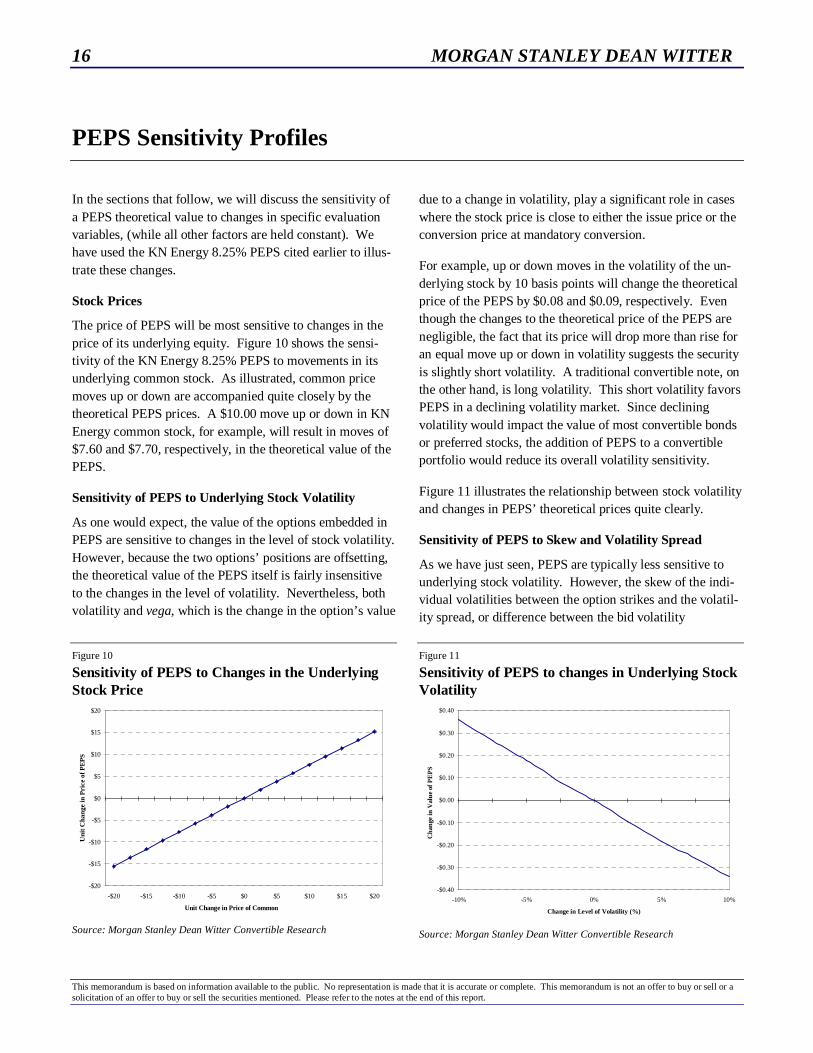
Stock Prices
The price of PEPS will be most sensitive to changes in theprice of its underlying equity. Figure 10 shows the sensi-tivity of the KN Energy 8.25% PEPS to movements in itsunderlying common stock. As illustrated, common pricemoves up or down are accompanied quite closely by thetheoretical PEPS prices. A $10.00 move up or down in KNEnergy common stock, for example, will result in moves of$7.60 and $7.70, respectively, in the theoretical value of thePEPS.
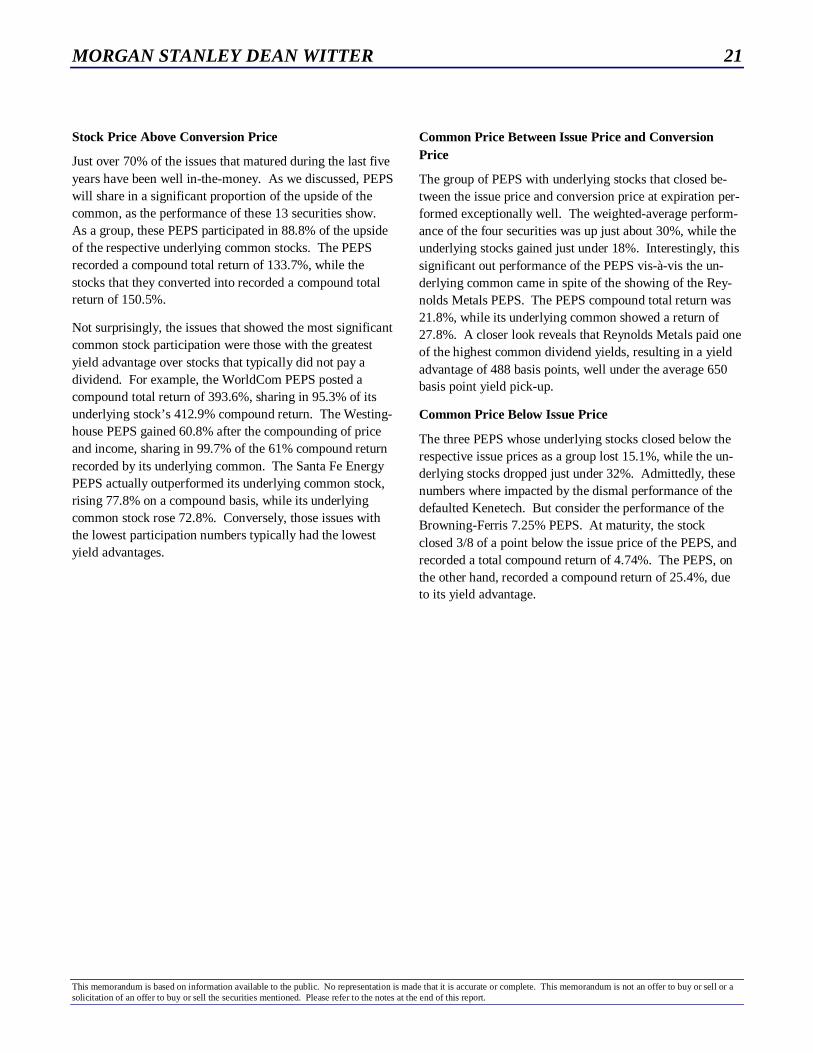
Sensitivity of PEPS to Underlying Stock Volatility
As one would expect, the value of the options embedded inPEPS are sensitive to changes in the level of stock volatility.However, because the two options’ positions are offsetting,the theoretical value of the PEPS itself is fairly insensitiveto the changes in the level of volatility. Nevertheless, bothvolatility and vega, which is the change in the option’s value
due to a change in volatility, play a significant role in caseswhere the stock price is close to either the issue price or theconversion price at mandatory conversion.
For example, up or down moves in the volatility of the un-derlying stock by 10 basis points will change the theoreticalprice of the PEPS by $0.08 and $0.09, respectively. Eventhough the changes to the theoretical price of the PEPS arenegligible, the fact that its price will drop more than rise foran equal move up or down in volatility suggests the securityis slightly short volatility. A traditional convertible note, onthe other hand, is long volatility. This short volatility favorsPEPS in a declining volatility market. Since decliningvolatility would impact the value of most convertible bondsor preferred stocks, the addition of PEPS to a convertibleportfolio would reduce its overall volatility sensitivity.
Figure 11 illustrates the relationship between stock volatilityand changes in PEPS’ theoretical prices quite clearly.
Sensitivity of PEPS to Skew and Volatility Spread
As we have just seen, PEPS are typically less sensitive tounderlying stock volatility. However, the skew of the indi-vidual volatilities between the option strikes and the volatil-ity spread, or difference between the bid volatility
Figure 10
Sensitivity of PEPS to Changes in the UnderlyingStock Price
-$20
-$15
-$10
-$5
$0
$5
$10
$15
$20
-$20 -$15 -$10 -$5 $0 $5 $10 $15 $20
Unit Change in Price of Common
Uni
t Cha
nge
in P
rice
of P
EP
S
Source: Morgan Stanley Dean Witter Convertible Research
Figure 11
Sensitivity of PEPS to changes in Underlying StockVolatility
-$0.40
-$0.30
-$0.20
-$0.10
$0.00
$0.10
$0.20
$0.30
$0.40
-10% -5% 0% 5% 10%
Change in Level of Volatility (%)
Cha
nge
in V
alue
of P
EP
S
Source: Morgan Stanley Dean Witter Convertible Research
MORGAN STANLEY DEAN WITTER 17
This memorandum is based on information available to the public. No representation is made that it is accurate or complete. This memorandum is not an offer to buy or sell or asolicitation of an offer to buy or sell the securities mentioned. Please refer to the notes at the end of this report.
and the offered volatility, are two important variables toconsider when evaluating the fair-value of PEPS.
Skew describes the characteristic of an option to trade atdifferent volatilities at different strike prices. For exam-ple, the strike prices of Aetna calls expiring in January1999 range from 60 to 100. The two options that corre-spond most closely to the issue price and the conversionprice of the Aetna PEPS are those struck at 75 and 95.The bid/ask volatility of the option with a 75 strike is31.9% and 34.3%, respectively. The bid/ask volatility ofthe option struck at 95 is 39.3% and 43.5%, respectively.Please note that the differences between the bid vola-tilities of these two options at the different strike prices is7.4, while the difference between the offered volatility atthe different strikes is 9.2 points. Skew is not a measureof volatility spread; it simply describes the fact that theoptions with different strikes will have different vola-tilities.
In spite of our attention to skew and volatility spreads, itis still fairly common that one static volatility is used toderive the valuation of PEPS rather than skew and vola-tility spread. However, not considering the skew andvolatility spread could cause a particular PEPS to appearsignificantly undervalued when that simply might not bethe case. So, in order to correctly determine the fair valueof a PEPS, the skew and volatility spread must be consid-ered.
As discussed earlier, the long partial out-of-the-moneycall and short at-the-money call are embedded in PEPS.Therefore, in order to arrive at the fair value investorsdeconstruct the option components of the PEPS by valu-ing its parts. The next step involves a volatility assump-tion, and here is where the static volatility will be used,rather than a volatility spread, which we recommend.
The use of static volatility does not factor in the effectivecost of the option components. In our view, using thevolatility spread allows for that cost to be considered indetermining the fair value of the PEPS.
As a result, in our analysis we use the lower, bid side,volatility when evaluating the long partial call struck atthe conversion price, and the higher, offered side, volatil-
ity when evaluating the short call struck at the issue price.This method results in a conservative lower value for thePEPS than what might be commonly accepted. Existingpricing of the securities in the market place seems to con-firm our conservative methodology.
Sensitivity of PEPS to Interest Rates
Since PEPS are mandatory by design they are less sensi-tive to fluctuations of interest rates and credit spreads.This characteristic of PEPS differs from traditional con-vertible bonds and preferred stocks, which conversely aresensitive to both interest rate and credit spread move-ments.
Although insensitive to interest rate moves, PEPS are notimmune from them. Changes in the level of interest rateswill affect the value of the “excess” coupon stream of thePEPS. To a lesser extent, changes in the level of interestrates will affect the value of the two embedded options.
A traditional convertible bond or preferred stock tradeslike a fixed-income security if the embedded call is farout-of-the-money. These convertibles are considered“hung.” Hung convertibles typically trade like fixed-income instruments, with a substantial part of their valuebased on interest rate direction and credit spread dynam-ics. This aspect of traditional convertible bonds and con-vertible preferreds caused concern among rating agencies.
In response to these concerns, PEPS were designed with amandatory conversion feature that prevents them fromever being hung. As a result, PEPS will be significantlyless sensitive to interest rate and credit spread movementsthan traditional convertible securities.
In Figure 12, we show the interest rate sensitivity of theKN Energy PEPS. As shown, a fairly significant move of150 basis points in either direction does not significantlychange the theoretical value of the PEPS.
Favorable Credit Ratings
As mentioned, the mandatory conversion feature meansthese securities are typically awarded very favorabletreatment by the credit agencies. Among other reasons,this is because the issues do not have a face amount thatthe issuing company would be obligated to
18 MORGAN STANLEY DEAN WITTER
This memorandum is based on information available to the public. No representation is made that it is accurate or complete. This memorandum is not an offer to buy or sell or asolicitation of an offer to buy or sell the securities mentioned. Please refer to the notes at the end of this report.
Figure 12
Sensitivity of PEPS to changes in Interest Rates
-$0.25
-$0.20
-$0.15
-$0.10
-$0.05
$0.00
$0.05
$0.10
$0.15
$0.20
$0.25
-150 -125 -100 -75 -50 -25 0 25 50 75 100 125 150
Change in Level of Interest Rates (Basis Points)
Cha
nge
in V
alue
of
PE
PS
Source: Morgan Stanley Dean Witter Convertible Research
pay when the securities mature or expire. Issuing stockwould satisfy the obligation the issuer has to holders. Therelative ease with which an issuer can retire the obligation,among other factors, usually translates into very favorableratings by Moody’s and Standard & Poor’s.
PEPS and Gamma
Gamma is defined as the rate of change in delta. Delta isdefined as the rate of change in the price of a derivativegiven a one-unit change in the underlying equity.
A common stock has a delta of 1 and a gamma of 0. A deepin-the-money option, or a way out-of-the-money option,also has a gamma that approaches 0. In the former case thedelta approaches 1 and the gamma approaches 0 because atthat point, the option is simply a stock surrogate. In thelatter case, the gamma of the option approaches 0 because ofthe lack of any equity sensitivity. Needless to say, the deltaof the way out-of-the-money option also approaches 0, re-flecting the lack of any stock sensitivity.
Recall that the long call provides the upside participation inthe common stock and is struck at the Conversion Price.However, because the conversion ratio is less than one, thenumber of long calls would be equal to a number less thanone.
The remainder of the position, the short call and the longcommon stock position, provides the source of income butalso gives the position its downside equity exposure. As we
have pointed out, the mandatory conversion feature meansthe PEPS’ conversion value will reflect the drop in thecommon below the issue price, while holders can expect asignificant portion of one share should the stock trendhigher.
In theory, the fact that holders participate in a portion of theupside, while sharing in all the downside of the underlyingstock is why a PEPS’ position is generally viewed as beingshort gamma, or having negative gamma. Still, the relation-ship of the underlying stock price to the issue price and con-version price, which as we have seen determines much of aPEPS value, also affects whether the PEPS is actually shortor long gamma.
A PEPS gamma profile is most dynamic at common pricelevels between the issue price and the conversion price. Atcommon prices well beyond the issue price the gammatrends toward zero. Over the range of common prices clus-tered between the conversion price and the issue price,gamma is generally negative.
However, the amount of negative gamma in the overallscheme of things is relatively small, particularly when thestock price is well above PEPS’ conversion price, or wellbelow its issue price. The role of gamma gains significanceif the underlying common is close to either the issue price orconversion price while the PEPS is outstanding. At matur-ity, gamma will be irrelevant. Nonetheless, the most im-portant factor contributing to a PEPS performance is thefundamentals of the underlying common stock.
A PEPS gamma profile, while theoretical in nature, doeshave practical implications in the market place. Similar toother convertible securities, it is not uncommon for arbitra-geurs, or hedgers, to create trading positions consisting oflong positions in PEPS and short positions in the underlyingstock. The purpose of the hedge is to take advantage of thePEPS’ significant positive cash flow, relative to the com-mon stock. The cash flow of a hedge would consist of theincome from the PEPS plus any rebate received on theshorted shares, less any dividend that would have to be paidby the seller of the stock and the cost of the borrow. APEPS with a significant yield advantage might be a candi-date for this strategy. The number of shares shorted againstthe long PEPS position is based on the delta of the PEPS.
MORGAN STANLEY DEAN WITTER 19
This memorandum is based on information available to the public. No representation is made that it is accurate or complete. This memorandum is not an offer to buy or sell or asolicitation of an offer to buy or sell the securities mentioned. Please refer to the notes at the end of this report.
The fact that PEPS have negative gamma is noteworthywhen we consider the dynamics of a hedge with positivegamma, like the typical convertible security. Ordinarily, asthe stock price rises, the delta will increase as well. As deltaincreases, the hedger who is long a convertible, would haveto sell more stock short in order to maintain the proper mixof long convertible and short stock that will result in theoptimum cash flow. Given the same set of circumstances,an arbitrageur that is long PEPS and wants to stay in hedgewould have to buy more stock to partially cover the shortposition as the stock rises. This would likely cause both thecommon and the PEPS’ prices to marginally rise.
Unfortunately, the flip side of gamma is also true. If thestock trended lower, hedgers would likely be required to sellmore stock short (up to 100% of the common stock repre-sented by the PEPS’ position) as the stock declines.
The significant yield advantage PEPS provide compensatesinvestors for this seeming disparity. Furthermore, the yieldhas proven to provide holders with a reasonable degree ofout performance at lower stock prices.
20 MORGAN STANLEY DEAN WITTER
This memorandum is based on information available to the public. No representation is made that it is accurate or complete. This memorandum is not an offer to buy or sell or asolicitation of an offer to buy or sell the securities mentioned. Please refer to the notes at the end of this report.
Performance of PEPS
Understanding theoretical concepts regarding PEPS andhow they will likely perform is an important exercise.However, the pool of matured PEPS has provided a rea-sonably large enough sample to review just how these issueshave actually performed.
As mentioned, 21 PEPS have matured by our count. Wesorted the 21 based on where they fell on the PEPS’ “expi-ration continuum,” and charted the performance of both thePEPS and its underlying stock, assuming reinvestment ofdividends at the respective PEPS and stock dividend rates.The complete list of these performance numbers appears onPage 47 in Appendix C. In Figure 13, the performance ofthe three maturity groups of PEPS relative to their underly-ing stocks is shown.
When Mascotech issued the first PEPS on July 1, 1993, theDow Jones Industrial Average and the S&P 500 stood at3,516.08 and 450.53, respectively. So it should come aslittle surprise that during the most robust bull market in
history 13 of the 21 issues expired with stock prices wellbeyond the conversion prices of the respective PEPS. Ofthe remaining eight issues, four ended up with stock pricesbetween the issue price and the conversion price, and fourexpired with underlying common stocks below the issueprices of the PEPS. Only three of the 21 PEPS that maturedposted losses.
As we observed earlier, the significant yield advantagesPEPS offer should provide a level of downside support, andthe 21 expiring PEPS bore this out. The average weightedyield of the group at issue was 7.62%, while the averageweighted dividend yield was 1.46%, giving the PEPS a 616basis point yield pick-up over their respective underlyingstocks. This yield advantage significantly buffered thelosses recorded by the four issues that expired with stockprices below the issue price.
Figure 13
Performance of Matured PEPS by Maturity Group Relative to Underlying Stock
133.7%
150.5%
29.6%
17.9%
-15.1%
-31.6%-40%
-20%
0%
20%
40%
60%
80%
100%
120%
140%
160%
Common Stock AboveConversion Price
Common Stock Between IssuePrice and Conversion Price
Common Stock Below Issue Price
PEPS Weighted Compound Return
Common Weighted Compound Return
PEPS Participation: 88.8%
PEPS Participation: 165.4%
PEPS Participation: 47.8%
Source: Morgan Stanley Dean Witter Convertible Research
MORGAN STANLEY DEAN WITTER 21
This memorandum is based on information available to the public. No representation is made that it is accurate or complete. This memorandum is not an offer to buy or sell or asolicitation of an offer to buy or sell the securities mentioned. Please refer to the notes at the end of this report.
Stock Price Above Conversion Price
Just over 70% of the issues that matured during the last fiveyears have been well in-the-money. As we discussed, PEPSwill share in a significant proportion of the upside of thecommon, as the performance of these 13 securities show.As a group, these PEPS participated in 88.8% of the upsideof the respective underlying common stocks. The PEPSrecorded a compound total return of 133.7%, while thestocks that they converted into recorded a compound totalreturn of 150.5%.
Not surprisingly, the issues that showed the most significantcommon stock participation were those with the greatestyield advantage over stocks that typically did not pay adividend. For example, the WorldCom PEPS posted acompound total return of 393.6%, sharing in 95.3% of itsunderlying stock’s 412.9% compound return. The Westing-house PEPS gained 60.8% after the compounding of priceand income, sharing in 99.7% of the 61% compound returnrecorded by its underlying common. The Santa Fe EnergyPEPS actually outperformed its underlying common stock,rising 77.8% on a compound basis, while its underlyingcommon stock rose 72.8%. Conversely, those issues withthe lowest participation numbers typically had the lowestyield advantages.
Common Price Between Issue Price and ConversionPrice
The group of PEPS with underlying stocks that closed be-tween the issue price and conversion price at expiration per-formed exceptionally well. The weighted-average perform-ance of the four securities was up just about 30%, while theunderlying stocks gained just under 18%. Interestingly, thissignificant out performance of the PEPS vis-à-vis the un-derlying common came in spite of the showing of the Rey-nolds Metals PEPS. The PEPS compound total return was21.8%, while its underlying common showed a return of27.8%. A closer look reveals that Reynolds Metals paid oneof the highest common dividend yields, resulting in a yieldadvantage of 488 basis points, well under the average 650basis point yield pick-up.
Common Price Below Issue Price
The three PEPS whose underlying stocks closed below therespective issue prices as a group lost 15.1%, while the un-derlying stocks dropped just under 32%. Admittedly, thesenumbers where impacted by the dismal performance of thedefaulted Kenetech. But consider the performance of theBrowning-Ferris 7.25% PEPS. At maturity, the stockclosed 3/8 of a point below the issue price of the PEPS, andrecorded a total compound return of 4.74%. The PEPS, onthe other hand, recorded a compound return of 25.4%, dueto its yield advantage.
22 MORGAN STANLEY DEAN WITTER
This memorandum is based on information available to the public. No representation is made that it is accurate or complete. This memorandum is not an offer to buy or sell or asolicitation of an offer to buy or sell the securities mentioned. Please refer to the notes at the end of this report.
PEPS’ Performance vs. Conventional Convertibles
The next natural step would be to address how PEPS per-form relative to convertibles.
Of the 21 PEPS that matured, only Mascotech and JamesRiver had convertibles outstanding concurrently with itsPEPS.
The Mascotech 4.50% due 12/15/2003 was issued on Janu-ary 13, 1994, just over six months after the issuer’s PEPSwas priced on July 2, 1993.
From January 1994, through the June 1997, maturity date ofthe PEPS, when both securities were outstanding, Masco-tech’s common lost 22.4%. Meanwhile, the PEPS gained7.05% and the convertible bond gained 8.75%. The S & P500 returned 22.5%. These figures all assume the regularcompounding of dividends and interest.
James River, now known as Fort James, had a $3.375 SeriesK and $3.50 Series L convertible preferreds outstanding atthe same time as its 9.00% PEPS. Each of these particularissues has since been called for redemption.
The James River 9.00% PEPS was issued in June 1994, andwas exchanged in September 1997. Over that period, the$3.375 Series K posted a compounded return of 93.1%. TheJames River $3.50 Series L recorded a compounded returnof 103.2%. The James River common and PEPS recordedcompounded returns of 178.7% and 167.6%, respectively.
We do not think any conclusions drawn from a three-observation sample are particularly meaningful. However,these few examples do help illustrate a number of notionsregarding PEPS/convertible pricing dynamics that are worthmentioning.
Clearly, the equity-like returns PEPS provide are favorablyevident in the James River examples. The convertiblesposted respectable annualized returns of 29.1% and 34.4%for the $3.375 K and $3.50 L, respectively. The PEPS,however, shared in just about 94% of the gain posted by thecommon over the same period, returning 52.4% on a com-pound annual basis, and 55.8%, respectively. The S & P500 returned 27.9% on a compound annual basis over thesame period.
Meanwhile the performance of the Mascotech PEPS illus-trates how the yield advantage of the security provides areasonable level of protection from a sliding stock price, inspite of the absence of the “floor” value, which gives tradi-tional convertibles their downside support.
Comparison of PEPS and Traditional Convertibles
In the absence of any significant actual examples, we can,however, make very reasonable assumptions based on whatwe know of standard convertible and PEPS price dynamics.
In the following table we depict what we think the standardpricing of a convertible would be, a PEPS with the samepricing terms as the convertible (PEPSCV), and a PEPSwith terms at which we think it would actually be priced.We will use the hypothetical PEPS pricing detailed on Page14 in the “Structure and Valuation” section.
At Issue: Convertible PEPSCV PEPS
Stock Price: $20.00 $20.00 $20.00
Coupon: 5.00% 5.00% 6.75%
Premium: 25.00% 25.00% 20.00%
Conversion Price: $25.00 $25.00 $24.00
Conversion Ratio: 40.0000 0.8000 0.8333
Source: Morgan Stanley Dean Witter Convertible Research
The next table shows the value of the respective securities ifthe stock moves to $100.00 in three years. As shown in the
Three Years Later: Convertible PEPS/CV PEPS
Conversion Ratio: 40.0000 0.8000 0.8333
Parity: 400.00% $80.00 $83.33
Income: 15.00% $3.00 $4.05
Total: 415.00% $83.00 $87.33
Issue Price: 100.00% $20.00 $20.00
Total Return: 315.00% 315.00% 336.65%
Source: Morgan Stanley Dean Witter Convertible Research
MORGAN STANLEY DEAN WITTER 23
This memorandum is based on information available to the public. No representation is made that it is accurate or complete. This memorandum is not an offer to buy or sell or asolicitation of an offer to buy or sell the securities mentioned. Please refer to the notes at the end of this report.
table, based on fundamental convertible and PEPS pricingconventions, the PEPS actually would outperform a tradi-tionally priced convertible security if the stock trendedhigher. In our example, the 6.75% PEPS would have posteda total return of 336.65%, while the 5.00% PEPS and 5.00%convertible note would have posted total returns of 315%each.
PEPS: More Like Equity than Convertible
As we have seen, the relationship of PEPS’ prices to theunderlying stock is practically identical to a traditional con-vertible if the stock trends higher. Similarly, the usuallysubstantial dividend PEPS’ provide will often help cushionany drop in the common. But while the general return pro-file of PEPS is very similar to traditional convertible securi-ties, i.e., sharing in significant, if not all, the upside shouldthe common trend higher, and outperforming if the stockstays flat or drops, PEPS and traditional convertibles have asignificant difference.
The fact that PEPS will typically share in such a significantpart of both the upside and downside of its underlying stockmakes these securities the most equity-like convertible cur-rently available to investors.
If the stock trades below the issue price of the PEPS, hold-ers will be in the same position as common stock investors.This is because PEPS do not have par values and at maturitywill convert into one share of stock if the stock price hap-pens to be below the issue price. So as the stock slips, thePEPS will fall, too.
PEPS’ Structures
It should be clear by now that an investor considering astock that also happens to underlie PEPS should considerthe latter choice for the portfolio. As we have seen, inves-tors benefit from the meaningful yield advantage, whichamong other factors provides a measure of downside pro-tection. As we have mentioned, like any convertible, PEPSwill outperform the common in two of three possible out-comes. If the stock drops or trades at a level between theissue price and the conversion price, PEPS holders will dobetter than stockholders. If the stock moves considerablyhigher, then holders of the PEPS will share in a significantpercentage of the upside of the common further bolstered bythe yield advantage over the life of the security.
24 MORGAN STANLEY DEAN WITTER
This memorandum is based on information available to the public. No representation is made that it is accurate or complete. This memorandum is not an offer to buy or sell or asolicitation of an offer to buy or sell the securities mentioned. Please refer to the notes at the end of this report.
MORGAN STANLEY DEAN WITTER 25
This memorandum is based on information available to the public. No representation is made that it is accurate or complete. This memorandum is not an offer to buy or sell or asolicitation of an offer to buy or sell the securities mentioned. Please refer to the notes at the end of this report.
PEPS for All Reasons – Issuer Considerations
26 MORGAN STANLEY DEAN WITTER
This memorandum is based on information available to the public. No representation is made that it is accurate or complete. This memorandum is not an offer to buy or sell or asolicitation of an offer to buy or sell the securities mentioned. Please refer to the notes at the end of this report.
MORGAN STANLEY DEAN WITTER 27
This memorandum is based on information available to the public. No representation is made that it is accurate or complete. This memorandum is not an offer to buy or sell or asolicitation of an offer to buy or sell the securities mentioned. Please refer to the notes at the end of this report.
Alternative PEPS Structures
In this “Issuer Consideration” section, we discuss the evo-lution of the various PEPS structures broadly from their useas a primary issuance and secondary stock distribution con-duit. In addition, a detailed discussion of the varieties of thestructures that fall under these two broad categories such asEquity PEPS, PEPS Units, PEPS Units with corporate obli-gations, Debt PEPS, and Trust PEPS are presented. Thesebasic structures and how they are issued are illustrated inFigure 14.
As shown in Figure 14, we discuss the PEPS structuresmarked 1, 2, and 3 that result in the primary issuance ofstock.
We then discuss those structures marked 4 and 5 of the sameFigure, which are those that result in a secondary distribu-tion of stock.
Also, in this section we discuss how the PEPS structure canaddress various issuer specific needs with some structural
Figure 14
PEPS Basic Structures
PEPS
SecondaryDistribution
of Stock
PrimaryDistribution
of Stock
Equity PEPS NonTax-Deductible
Ex. MSX
Tax-Deductible
PEPS
Debt PEPSSEC Reg
Ex.AXP/FDC
Trust PEPS Non-SEC Reg . Ex.RYG, DOL
(Figure 17)
PEPS Units:Stock Purchase
Contract andTreasuries. Ex. BFI,
MDM, KNE
(Figure 15)
Reset Trust Security,Stock Purchase
Contract Ex. CD
(Figure 16)
Callable /Reset TrustSecurity, Stock
Purchase Contract
PEPS Units: With Corporate Debt
Issuance and ...
1
2
3
4 5
3b3a
Source: Morgan Stanley Dean Witter Convertible Research
28 MORGAN STANLEY DEAN WITTER
This memorandum is based on information available to the public. No representation is made that it is accurate or complete. This memorandum is not an offer to buy or sell or asolicitation of an offer to buy or sell the securities mentioned. Please refer to the notes at the end of this report.
modifications, along with some salient accounting and taxtreatments, as it pertains to the PEPS structure.
PEPS Product Evolution
At its inception, PEPS were designed to de-lever a balancesheet by infusing equity capital at a price higher than theexisting common stock price, but without a lasting dividendliability. In other words, from the issuer’s perspective, ini-tial PEPS structures involved raising equity capital by for-ward selling equity at a higher price but without the embed-ded put typical of traditional convertible securities. In Fig-ure 14, we use the term “Primary Distribution,” since theprinciple purpose is to raise equity-like capital for the pri-mary issuer.
This structure, which we call an Equity PEPS, had charac-teristics similar to those of a traditional convertible pre-ferred stock, including a dividend payment, the right to con-vert into the issuer’s common stock, and voting rights uponconversion, for example. Unlike a traditional convertiblepreferred, this structure had a mandatory conversion feature,which eliminated the need for a par value, but did mean thesecurity’s coupon was higher. Also, since the coupon was apreferred dividend it was not tax deductible for the issuer.The first such PEPS was the Mascotech PEPS.
Subsequent innovations addressed the original lack of taxdeductibility of the issuer’s coupon, increasing the effi-ciency of the PEPS security.
Unlike the original (equity) PEPS, which was structured as aprimary convertible preferred stock offering of the issuer,the next iteration of PEPS served as a secondary distributionof the underlying stock, whereby the PEPS structure al-lowed issuers to monetize their non-strategic equity assets.
In this case, the issuer of the PEPS exchanged its holding ofcommon stock of a subsidiary or a non-strategic marketableequity security. This structure was first used by AmericanExpress to monetize its investment in First Data Corpora-tion. We call this usage of the PEPS structure a “SecondaryDistribution” PEPS.
All other derivatives of the primary and secondary distribu-tion PEPS are only minor modifications of the simple origi-nal structure. In the following pages we describe the vari-
ous nuances of the evolving PEPS product. Keeping inmind that the return profile of all variations are the sameexcept that some of them are issued as either debt or pre-ferred stock or are issued via the usage of a trust. Later ver-sions of PEPS provided issuers with varying degrees of taxdeductible coupon payments, while the minority of these arenon-tax deductible dividend payments.
Primary Distribution:
1. Equity PEPS
The Equity PEPS structure just discussed was the initialPEPS structure that resulted in the primary issuance of theissuer’s common stock. While PEPS were truly innovative,the main drawback of the product was the non-tax deducti-ble nature of the dividend to the issuer. This caused thestructure to be expensive from the issuer’s perspective. Thenon-tax deductibility of the coupon to the issuer was ad-dressed in a subsequent structural innovation: the PEPSUnit. This structure is now far more popular than EquityPEPS.
2. PEPS Units
The PEPS Unit structure is far more tax efficient for theissuer while preserving all the other beneficial aspects of thesecurity for investors. This in a nutshell is accomplished byincorporating a stock purchase contract to the PEPS struc-ture and issuing a concurrent debt security. The proceeds ofthe PEPS are invested in U.S. Treasuries. The additionalstep of issuing separate corporate debt allows the issuer toraise capital at a much lower cost than would ordinarily bepossible.
As just mentioned, all the proceeds of the PEPS offering areused to purchase U.S. Treasuries with maturities corre-sponding with the maturity of the PEPS. The yield from theTreasuries is supplemented with an additional adjustmentfee to the stock purchase contract to arrive at the stated highyield of the PEPS. The supplemental adjustment fee, alsoknown as the contract fee, is non-tax deductible for the is-suer.
While all this may sound involved, please note that from theinvestor’s perspective, structurally all these securities aresimilar in that their pay-off pattern as any PEPS structure.
MORGAN STANLEY DEAN WITTER 29
This memorandum is based on information available to the public. No representation is made that it is accurate or complete. This memorandum is not an offer to buy or sell or asolicitation of an offer to buy or sell the securities mentioned. Please refer to the notes at the end of this report.
Figure 15
PEPS Units
IssuerConvertible
Investor
U.S.Treasury
Principleat Maturity
Proceeds100%
Coupon
PEPS
Contract Adjustment Fee
PEPS Settlement Fee
(Treasury Principle)
DebtMarket
PEPS Settlement FeeCould be used to Retire
DebtDebt
ProceedsDebt
Cash Flows at Issue
Cash Flows at Maturity
Source: Morgan Stanley Dean Witter Convertible Research
Furthermore, the terms of the stock purchase contract pro-vide for the three possible conversion outcomes at maturitysimilar to traditional PEPS. However, the contract also callsfor investors to pay for the purchase of the stock when thePEPS mature. This purchase price is equal to the price ofthe PEPS at issue.
The issuer then typically enters the public debt markets toissue an interest-bearing note with a maturity and faceamount similar to the respective terms of the PEPS issue.However, the two offerings are completely independent, andnot in any way contingent on each other. This independence
is essential because if the debt were issued with the expresspurpose of supporting the PEPS, the IRS would likely treatthe note as equity, thus eliminating the tax deductibility ofthe interest payment.
The components of the typical PEPS Unit structure areshown in Figure 15.
When the PEPS mature, holders deliver cash or the matur-ing Treasury to satisfy the terms of the purchase contract.Please note that the obligation of investors to purchase theissuer’s shares under the stock purchase contract is collater-
30 MORGAN STANLEY DEAN WITTER
This memorandum is based on information available to the public. No representation is made that it is accurate or complete. This memorandum is not an offer to buy or sell or asolicitation of an offer to buy or sell the securities mentioned. Please refer to the notes at the end of this report.
alized by pledging the Treasury notes with a collateralagent. The collateral agent typically applies the proceeds ofthe maturing Treasury notes to purchase the issuer’s sharesat maturity. This process ensures that the issuer receives theinitial proceeds at maturity of the forward contract. In otherwords, the PEPS issuer is not dependent upon the PEPSinvestor’s actions. The issuer receives either the maturityvalue of the Treasuries or the settlement fee from the pur-chase contract at maturity. The issuer can use these pro-ceeds to retire the maturing corporate debt that was issuedwhen the PEPS were initially placed, or it may use the pro-ceeds to add to its cash balances.
In spite of the use of a collateral agent to ensure that inves-tors satisfy the conditions of the forward contract, it is im-portant to note that in this structure, PEPS investors own theTreasuries. The issuing company does not typically pur-chase the Treasuries, so it never owns them. Therefore, inthe event of a bankruptcy by the issuer, PEPS holders willbe entitled to the Treasury securities, not the issuer, subject,of course, to the bankruptcy court’s determination.
Once again, the tax deductibility of the parallel debt helpslower the overall cost of capital to the issuer in this struc-ture. Furthermore, this structure is tax advantaged to theinvestor since the Treasury coupon payments are excludedfrom state and local income taxes.
Browning-Ferris, MedPartners, and, most recently, KN En-ergy have issued PEPS using this structure.
3. PEPS Units with Corporate Obligation (and an Auc-tion Agent)
It became clear that if the company used its own debt asopposed to Treasuries, it could lower its non-tax deductiblepurchase contract adjustment fee. Recall that the contractadjustment fee paid to holders in the PEPS Unit structurejust discussed is simply the difference between the statedyield of the PEPS and the Treasury yield. By using its owndebt, an issuing company can effectively capture the creditspread, or the difference between the corporate debt yieldand the corresponding Treasury yield, and lower its non-taxdeductible purchase contract adjustment fee. This results inan even lower cost of coupon for the issuer.
But in order to stay within IRS guidelines regarding thecontingency of the debt vis-à-vis the PEPS, growth and in-
come unit features were added to the PEPS and a re-marketing or auction agent was employed. The growth unittypically consists of a stock purchase contract calling for thepayment of an adjustment fee. The income unit usuallyconsists of a trust preferred stock, along with the stock pur-chase contract and adjustment payment. The yield on thegrowth unit comes from the contract adjustment payment,while the yield on the income unit is provided by the cou-pon on the trust preferred and the contract adjustment pay-ment.
This structure does not employ Treasuries, so this structuredoes not have collateral to hold against payment of the pur-chase price. In this structure, the auction agent would en-sure that all unexercised PEPS are sold and that the issuerreceives the proceeds of the sale. This satisfies the IRScondition requiring the issuer’s debt to be independent ofthe PEPS.
There is a trust in this structure that is created to issue thePEPS and then use the proceeds to purchase deeply subor-dinated debentures from the issuer. The issuer pays the in-terest on the debenture to the trust, and the trust pays thecoupon on the PEPS. At issue, the forward purchase con-tract is included in the PEPS, but because the yield on thedebenture issued to the trust is higher than the U.S. Treasurycoupon payment, the non tax-deductible adjustment fee willbe much lower, resulting in higher tax-deductibility for theissuer.
As mentioned, for the structure to achieve tax deductibility,the debt and PEPS pieces of the structure cannot be contin-gent on each other. One way of doing this is for the issuerto establish that there will be a reasonable possibility thatthe trust preferred will remain outstanding after the maturityof the stock purchase contract. This is why the trust pre-ferred usually has a five-year life, while the stock purchasecontract is typically set to expire in three years.
Reset and Callable/Putable Features of PEPS Units
As shown in Figure 14, on Page 25, these structures gener-ally include the same components that create and allow thetax deductibility of the coupon to the issuer. However, tofurther ensure that the structure maintains its tax deductibil-ity, the trust preferred component is given either a resetfeature, or a callable/putable provision.
MORGAN STANLEY DEAN WITTER 31
This memorandum is based on information available to the public. No representation is made that it is accurate or complete. This memorandum is not an offer to buy or sell or asolicitation of an offer to buy or sell the securities mentioned. Please refer to the notes at the end of this report.
The reset feature calls for the dividend rate on all trust pre-ferred outstanding after the stock purchase contract expiresto be reset to a market rate. This rate is usually tied to theyield on a Treasury note with the same time to maturity asthe trust preferred. Any trust preferred that is given up bythe holder will be re-marketed, based on this new rate, andremain outstanding until maturity.
The callable/putable provision gives the underwriter a callon the trust preferred which expires 90 days before the stock
purchase contract expires. Holders of the trust preferred aregiven two puts. The first put is at par on the expiration ofthe stock purchase contract. The second put is at a priceabove par 90 days after the expiration of the stock purchasecontract. Once again, this structure is designed to increasethe possibility that the trust preferred will be separated fromthe stock purchase contract, and subsequently, the paralleldebt.
This structure was used by Cendant, and is illustrated inFigure 16.
Figure 16
PEPS Units with Corporate Obligation
Issuer
ConvertibleInvestor
Trust
AuctionAgent
Forward Contract Fee
Cash Proceeds
Shares
Debenture
Interest
Proceeds
PurchasePrice Trust
PreferredCouponPayment
Trust Preferred
Cash Proceeds
Cash Flows at Issue
Cash Flows at Maturity
Source: Morgan Stanley Dean Witter Convertible Research
Secondary Distribution:
4. Debt PEPS
Unlike the Mascotech (equity) PEPS, which was structuredas a primary offering convertible into the stock of the issuer,the American Express (debt) PEPS was a secondary distri-bution convertible into the company’s First Data Corp.stake, as shown in Figure 14. While the return profile of theAmerican Express security was identical to the MascotechPEPS, the difference was that this PEPS was designed asdebt, as opposed to preferred stock after which equity PEPSwere patterned.
American Express’ debt shelf was tapped to issue this note,which paid a coupon, not a dividend, had a stated maturitydate, and was not convertible at any time, but exchangeable
only at maturity. In later versions, the maturity date of thedebt PEPS could be extended. The company could also paythe maturity amount in cash or stock, which was why thecoupon was treated as an interest payment, allowing it to bededucted from taxes.
The PEPS allowed the company to effectively monetize itsstake in First Data Corp. while receiving a capital gains taxdeferral. American Express also got to keep the votingrights of the monetized stake, while setting a floor price toits stake in First Data Corp.
Since American Express used the PEPS structure tomonetize its stake in a non-strategic asset, almost 20 othercompanies have done the same.
32 MORGAN STANLEY DEAN WITTER
This memorandum is based on information available to the public. No representation is made that it is accurate or complete. This memorandum is not an offer to buy or sell or asolicitation of an offer to buy or sell the securities mentioned. Please refer to the notes at the end of this report.
5. Trust PEPS
As mentioned, debt PEPS provide tax deductibility to theissuer. However, insiders and investors who are non-SECregistrants with large positions in a company’s stock arealso able to use debt PEPS as a secondary distribution ofstock to their advantage, with some modifications to thestructure.
Shareholders at a number of companies including EsteeLauder, Dimon, Dole Foods, Herbalife, Nextel, and RoyalGroup Technologies used trust PEPS to forward sell theirholdings. A diagram of this structure appears in Figure 17.
In this case, a trust was established as a conduit. Sellingshareholders would enter into a pre-paid forward contract.
The trust would issue PEPS to investors and distribute aportion of the proceeds, usually about 80%, to the sellingshareholders. The remaining 20% of the proceeds would beused to purchase 12 U.S. Treasury strips with maturities thatcorrespond to the quarterly payment dates of the PEPS.(Assuming a three-year life, 3 x 4 = 12). The maturity valueof the Strips would pay the coupon due on the trust PEPS.
The company whose stock was effectively being sold wouldhave little to do with the transaction, except perhaps to reg-ister the stock. The selling shareholders, would receive theirportion of the proceeds of the sale of the PEPS at issue, andat maturity, through the trust, would deliver between a fullshare and the fraction of a share representing the minimumconversion ratio of the trust PEPS.
Figure 17
Trust PEPS Cash Flow Diagram
TrustTreasury Securities
20% Proceeds
ConvertibleInvestor
Proceeds
SellingShareholders
100%
PEPSQuarterlyCoupon
80%Proceeds
Shares
12 U.S.Treasury
Strips
Source: Morgan Stanley Dean Witter Convertible Research
MORGAN STANLEY DEAN WITTER 33
This memorandum is based on information available to the public. No representation is made that it is accurate or complete. This memorandum is not an offer to buy or sell or asolicitation of an offer to buy or sell the securities mentioned. Please refer to the notes at the end of this report.
If the stock performs well, and ends up higher than theconversion price at maturity, selling shareholders willdeliver the fraction of a share, and the original ownerswould continue to hold the remaining shares. Any capitalgain due on the sale of the shares would be due at thattime, three to five years after the original issue of the trustPEPS to investors.
Investor’s Perspective
It is important to note that as far as the investor is con-cerned, the return profile and conversion feature of equity,debt or trust PEPS is identical. Also, the conversion fea-tures are the same from version to version. Differenceslie in the way the security is treated for tax and account-
ing purposes, and in the payment schedule of the Treas-uries, which is detailed in the following table.
PEPS Type Payment Schedule
Equity PEPS Quarterly
PEPS Units Quarterly
Trust PEPS Quarterly
Debt PEPS Quarterly/Semi-annually
Source: Morgan Stanley Dean Witter Convertible Research
34 MORGAN STANLEY DEAN WITTER
This memorandum is based on information available to the public. No representation is made that it is accurate or complete. This memorandum is not an offer to buy or sell or asolicitation of an offer to buy or sell the securities mentioned. Please refer to the notes at the end of this report.
MORGAN STANLEY DEAN WITTER 35
This memorandum is based on information available to the public. No representation is made that it is accurate or complete. This memorandum is not an offer to buy or sell or asolicitation of an offer to buy or sell the securities mentioned. Please refer to the notes at the end of this report.
A Review of PEPS Accounting and Tax Treatment
36 MORGAN STANLEY DEAN WITTER
This memorandum is based on information available to the public. No representation is made that it is accurate or complete. This memorandum is not an offer to buy or sell or asolicitation of an offer to buy or sell the securities mentioned. Please refer to the notes at the end of this report.
MORGAN STANLEY DEAN WITTER 37
This memorandum is based on information available to the public. No representation is made that it is accurate or complete. This memorandum is not an offer to buy or sell or asolicitation of an offer to buy or sell the securities mentioned. Please refer to the notes at the end of this report.
Accounting Treatment
Equity PEPS: As-if-Converted Method
Like any convertible security, Equity PEPS are accountedfor using the “as-if-converted” method. As a result, proforma diluted EPS is the lower of:
1)
Net Income
Total SharesOutstanding +
Common Shares into whichPEPS would convert given
current market price ofcommon stock
Preferred Dividends+
Or:
2)
NetIncome
- PreferredDividends
Total Shares Outstanding
Under the “as-if-converted” method, conversion of thePEPS is assumed at the beginning of the reporting periodonly if dilutive. The appropriate number of shares used isbased on the average stock price for the period. In Equation1, the amount of shares into which the PEPS convert areadded to the weighted average number of shares in the EPSdenominator. Since the PEPS is assumed to have been con-verted at the beginning of the period, the numerator is ad-justed to add back any preferred dividends that were de-ducted from net income.
The as-if-converted method is not used if the result of theformula is less dilutive than not assuming conversion at all.In that case, the preferred dividend remains in the numerator(and subtracted from net income) and there is no adjustmentto the number of shares outstanding, as shown in Equation2.
Tax Deductible PEPS
We think issuers will likely move toward the tax-advantaged structures, which are accounted for a bit differ-ently. As mentioned, these structures include forward stock
units and are accounted for as debt and forward contracts, incontrast to the “as-if-converted” method. Debt or interestexpense is booked, and at maturity, the common shares thatunderlie the forward contract unit PEPS are added to thetotal shares outstanding.
• PEPS structures that include purchase contracts, debtissuance, and U.S. Treasuries are accounted for using thetreasury stock method for computing basic and dilutedearnings per share.
• Under this method, the common stock price is the mostimportant factor to consider when determining whether thePEPS will be dilutive.
• The number of shares to be added to the total shares out-standing, and therefore the potential dilution, can be estab-lished at any time during the life of the PEPS, although it istypically at the beginning of the reporting period.
• At maturity, the full dilutive effect of the PEPS issue willbe realized.
The number of shares to be added to the total shares out-standing under the treasury method is based on the follow-ing formula:
N umber of SharesIssued * Conversion
RatioShares A dded to Total
Shares Outstanding
Number ofShares Issued Issue Price*
Current Market P rice=
In the formula, the “Number of Shares Issued” equals theoriginal number of PEPS shares issued. The “Current Con-version Ratio” equals the number of common shares intowhich the PEPS exchange at the time of calculation. Thisratio is initially 1, but the ratio will be based on where thecommon stock price is in relation to the PEPS’ issue priceand conversion price. The conversion ratio of a PEPS willtypically range from a minimum of 0.80 to 0.85 to a maxi-mum that is usually 1. In other words, the Number ofShares x Current Conversion Ratio equals the number ofcommon shares underlying the purchase contracts.
38 MORGAN STANLEY DEAN WITTER
This memorandum is based on information available to the public. No representation is made that it is accurate or complete. This memorandum is not an offer to buy or sell or asolicitation of an offer to buy or sell the securities mentioned. Please refer to the notes at the end of this report.
To illustrate, consider the following assumptions:
Table 7:
Treasury Method Variables
Issue Price: $ 45Conversion Premium: 20%Conversion Price: $ 54 ($45 x 1.20)Issued Shares: 8 million sharesShares Outstanding: 46 millionConversion Ratio: If Stock is Below $45 = 1.00; If Stock is Above $54 = 0.83; If Stock is>$45 and <$54 = 1.00 to 0.83.
Case I: If Stock Is Trading Below Issue Price
Assume the common stock was trading below the issueprice at $40. As shown in the table, the conversion ratiowould be 1.00. The following number of shares would beadded to the total shares outstanding.
(8 million x 1.0)Shares Added to TotalShares Outstanding
8 million $45x
$40=
Or:
8 million – 9 million = (1 million)
Since the result is a negative number, which would be anti-dilutive, total shares outstanding would not change, and thePEPS would have no dilutive effect.
Therefore, if the common price is below the issue price ofthe PEPS, there will be no adjustment made to the totalshares outstanding.
Case II: If Stock Is Trading Between Issue Price andConversion Price
Assume the stock is at $50, which is between the issue priceand the conversion price. At this common price level, eachPEPS would be exchangeable into 0.90 ($45/$50) shares ofstock. Using these values yields the following:
(8 million x 0.90)Shares Added to Total
Shares Outstanding
8 million $45x
$50=
Or:
7.2 million – 7.2 million = 0
At all prices between the issue price and the conversionprice, the result will be 0.
Hence, if the common price is between the issue price ofthe PEPS and the conversion price, again there will beno dilution.
Case III: If Stock Price Is Higher Than ConversionPrice
A. Consider if the stock is at a level higher than the $54conversion price. As shown in Table 7, at stock pricesabove the conversion price, the conversion ratio will be0.83. Using $60, the number of shares to be added wouldbe:
(8 million x 0.83)Shares Added to TotalShares Outstanding
8 million $45x
$60=
Or:
6.66million – 6.00 million = 0.66 million shares added tototal shares outstanding
Using the 46 million shares outstanding shown in the table,the PEPS would be 1.4% dilutive, (666,400/ [46 million +666,400] ).
B. If the stock is at $100, the number of shares to be addedto total shares outstanding would be:
(8 million x 0.83)Shares Added to TotalShares Outstanding
8 million $45x=
$100
Or:6.66 million – 3.60 million = 3.07 million shares added tototal shares outstanding, resulting in dilution of 6.3% (3.07million/[46 million + 3.07 million] ).
C. At $200, the number of shares to be added to total sharesoutstanding would be:
(8 million x 0.83)Shares Added to TotalShares Outstanding
8 million $45x=
$200
Or:
6.66 million – 1.80 million = 4.87 million added to totalshares outstanding, or dilution of 9.6%, (4.87 million/ [ 46million + 4.87 million]).
MORGAN STANLEY DEAN WITTER 39
This memorandum is based on information available to the public. No representation is made that it is accurate or complete. This memorandum is not an offer to buy or sell or asolicitation of an offer to buy or sell the securities mentioned. Please refer to the notes at the end of this report.
Accounting Treatment Summary
• At maturity, the full dilutive effect of the PEPS willoccur.
• During the life of the security, the dilutive effect of thisPEPS structure is generally small, and is a function of thestock price in relation to the conversion price.
• During the life of the PEPS, and prior to maturity, if thestock is below the issue price, or trades between the issueprice and the conversion price, no dilution will occur. Therewill be no adjustment to the total shares outstanding whencalculating basic and diluted earnings per share.
• If the stock rises above the conversion price before ma-turity, there will be an adjustment to total shares outstand-ing, and dilution will occur. However, the stock would haveto rise significantly over the conversion price for the ad-justment to total shares outstanding to be meaningful. InCase III, Example A, an 11% rise in the stock over the con-version price (33% above the issue price) would result inless than 2% dilution. On the other hand, in Case III, Ex-ample C, if the stock rose about 270% above the conversionprice (344% above the issue price) at any point during thelife of the PEPS, 4.87 million shares would be added to totalshares outstanding, resulting in dilution of 9.6%.
The treasury stock method assumes that the forward-contract component of the unit is exercised once the stockprice exceeds the issue price. It also assumes that cash pro-ceeds will be used to purchase shares. If the current price isless than the issue price, no shares are added to the totalshares outstanding.
Income Statement and Balance Sheet Treatment
Tax-deductible PEPS with Treasuries generally receive fa-vorable income statement and balance sheet treatment. Inthe income statement, trust preferred payments are recordedas minority interest expense. The non-deductible stock pur-chase contract adjustment payments reduce the equity ac-count without running through the income statement.
In the balance sheet, the trust preferred is accounted for asminority interest. The stock purchase contract is recorded inthe footnotes of the financial statements.
From a “basic” earnings-per-share perspective minority in-terest reduces net income, and no shares from the stock pur-chase contract are added to the total amount of shares out-
standing. From a “diluted” earnings basis minority interestwill once again reduce net income, but depending where thecommon stock price is, the shares underlying the stock pur-chase contract may be added to the total amount of sharesoutstanding, consistent with the treasury stock method.
Tax Treatment
For tax purposes, equity PEPS are treated in similar fashionas preferred stock. Coupons received by investors are taxedas ordinary income. Corporate holders are generally eligiblefor the dividend-received deduction (DRD), which allowsthem to deduct 70% of the dividend, as long as the PEPShave been held at risk for 46 days during each dividend pe-riod. Tax deductible PEPS with U.S. Treasuries, corporatedebt, or corporate trust preferred, however, are not eligiblefor DRD. Still, for PEPS with U.S. Treasuries a significantportion of the coupon investors receive represents tax-freereturns of capital. In addition, income from U.S. Treasuriesis free from state and local taxes.
Gains or losses will be recognized upon the sale of the secu-rity. If the PEPS is exchanged into the stock of the issuer,then no gain or loss will be recognized by the holder, al-though the cost basis of the common will reflect the costbasis of the PEPS, less any cost attributable to any fractionalcash distribution. A gain will be recognized if the holderreceives cash in lieu of common stock on conversion.
Debt PEPS are treated like notes and the interest income istaxed as ordinary income. Upon exchange, in contrast toequity PEPS, investors will have a capital transaction if theyreceive cash instead of stock. (Debt PEPS cannot usually beconverted at the holder’s option, and issuers have the optionof issuing stock or cash.) If the debt PEPS are sold beforematurity, a gain or loss is recognized, though the holder’stax basis will be adjusted by an amount of interest as if ithad accrued during the holding period. This amount of in-terest will be treated as ordinary income.
Trust PEPS are considered forward purchase contracts topurchase the particular underlying stock for tax purposes.Coupon income received by holders is treated as ordinaryincome for tax purposes, although to the extent the couponis funded with U.S. Treasuries it will be free from state andlocal taxes and a portion will represent a tax-free return ofcapital.
If the Trust PEPS is sold before maturity or expiration, again or loss will be recognized based on the
40 MORGAN STANLEY DEAN WITTER
This memorandum is based on information available to the public. No representation is made that it is accurate or complete. This memorandum is not an offer to buy or sell or asolicitation of an offer to buy or sell the securities mentioned. Please refer to the notes at the end of this report.
holder’s cost basis. No gain or loss will be recognized onthe purchase of stock in accordance with the purchase con-tract, and any cash in lieu of fractional shares will be tax-
able. The cost basis of purchased shares, less the receivedcash, will be equal to the cost basis of the Trust PEPS, lessthe cost attributable to any cash in lieu of fractional shares.
Conclusion
The growth and innovation of PEPS attests to the broad ap-peal of the security to both investors and issuers. As wehave seen, the structure of PEPS has evolved quite a bitsince it first appeared in 1993.
Investors have benefited from very attractive yields andgenerally favorable dynamics relative to the underlyingstock.
The flexibility of these various PEPS’ forms has made themvery popular financing vehicles among issuers who usethem to provide varied financial solutions. For example,equity PEPS allow issuers to de-leverage their balancesheets; debt PEPS are a way to forward-sell common stock,and provide a way to monetize an equity stake. Truststructures provide a typically less expensive way to raise
capital, owing to the tax deductibility of the coupon, andtrust PEPS with stock purchase contracts allow issuers todefer earnings per share dilution.
All told, we continue to maintain that all types of investors,including growth and income, convertible, equity income,pension funds, and endowments should review the struc-tures and opportunities in the PEPS market. As we haveseen, PEPS allow investors to earn equity-like returns withlower risk relative to common stock, while providing a sig-nificant degree of current income.
On Pages 43 and 44 in Appendix A we have listed the termsand conditions of all the PEPS under our evaluation. Wealso suggest investors review our U.S.Recommended Port-folio for our recommended choices.
MORGAN STANLEY DEAN WITTER 41
This memorandum is based on information available to the public. No representation is made that it is accurate or complete. This memorandum is not an offer to buy or sell or asolicitation of an offer to buy or sell the securities mentioned. Please refer to the notes at the end of this report.
Appendix:
A: Terms and Conditions of Outstanding PEPS at Issue
B: Current Prices
C: Performance of Matured PEPS
D: PEPS Name Variations
E: PEPS/PERCS Comparisons
42 MORGAN STANLEY DEAN WITTER
This memorandum is based on information available to the public. No representation is made that it is accurate or complete. This memorandum is not an offer to buy or sell or asolicitation of an offer to buy or sell the securities mentioned. Please refer to the notes at the end of this report.
MORGAN STANLEY DEAN WITTER 43
This memorandum is based on information available to the public. No representation is made that it is accurate or complete. This memorandum is not an offer to buy or sell or asolicitation of an offer to buy or sell the securities mentioned. Please refer to the notes at the end of this report.
This memorandum is based on information available to the public. No representation is made that it is accurate or complete. This memorandum is not an offer to buy or sell or asolicitation of an offer to buy or sell the securities mentioned. Please refer to the notes at the end of this report.
Source: Morgan Stanley Dean Witter Convertible Research
MORGAN STANLEY DEAN WITTER 45
This memorandum is based on information available to the public. No representation is made that it is accurate or complete. This memorandum is not an offer to buy or sell or asolicitation of an offer to buy or sell the securities mentioned. Please refer to the notes at the end of this report.
Appendix B:
Outstanding PEPS: Recent Prices and Yields
PEPS Stock Current Com PEPS Min Max Moody’s S&PTicker Ticker Issuer Coupon Maturity Price Yield Price Yld Adv Ratio Ratio Ratings Ratings
ADVNZ ADVNB Advanta Corp. 6.75% 9/15/99 $10.69 23.4% $8.06 19.6% 0.8197 1.0000 B2 B+AET C AET Aetna Class C 6.25% 7/19/00 $75.06 6.3% $79.19 5.3% 0.8197 1.0000 A3 A-ATI B ATI Airtouch Comm 6.00% 8/16/99 $47.88 3.6% $58.19 3.6% 0.8060 1.0000 BAA3 BBBAJP AJL Amway Japan 7.52% 2/15/99 $6.00 24.0% $4.88 24.0% 0.8475 1.2500 NR NRAMCPF AMCRY Amcor 7.25% 11/19/06 $46.13 7.9% $16.63 7.9% 1.8650 2.1160 A3 A-
AHL I AHL American Heritage 8.50% 8/15/00 $70.75 6.0% $24.50 4.3% 2.6440 3.2260 NR A-AHB AMH Amerus Life 7.00% 7/27/01 $24.94 8.9% $23.00 8.0% 0.8197 1.0000 BAA3 BBB-
ELE BNDESPAR-Electrobras 7.25% 2/15/01 $30.06 24.1% $15.00 24.1% 0.8403 1.0000 NR NRCD I CD Cendant 7.50% 2/16/01 $34.38 10.9% $19.81 10.9% 1.0395 1.3514 BAA1 BBB-CDE P CDE Coeur D’Alene 7.00% 3/15/99 $8.69 17.1% $4.94 17.1% 0.8260 1.0000 B3 CCC+
CNC F CNC Conseco Fin Trust 7.00% 2/16/01 $40.50 8.6% $32.13 5.9% 0.9363 1.1268 BA2 BBB-CNC E CNC Conseco Fin Trust 7.00% 2/1/00 $110.88 3.9% $32.13 2.2% 3.4200 4.0000 BA2 BBB-CXW WYMN Cooper-Wyman Gor 6.00% 1/1/99 $11.38 7.1% $11.94 7.1% 0.8621 1.0000 A2 BBB+CTF CVS CVS Corp 6.00% 5/15/01 $94.06 4.5% $52.75 4.1% 1.6394 2.0000 NR NR
DAI Daimler 7.47% 6/14/02 $94.00 6.1% $81.50 6.1% 0.8620 1.0000 NR NR
DET DMN Dimon Inc 8.50% 8/15/00 $9.25 21.9% $7.31 17.0% 0.8333 1.0000 NR NRDLA DOL Dole Foods 7.00% 8/15/99 $29.50 9.3% $29.25 7.9% 0.8329 1.0000 NR NRDGS DG Dollar Gen 8.50% 5/15/01 $34.88 9.6% $25.56 9.1% 0.9259 1.2500 NR NRECT EL Estee Lauder 6.25% 6/1/01 $69.88 5.4% $74.25 4.9% 0.8333 1.0000 NR NRHERBL HERBB Herbalife Intl 8.75% 2/15/01 $11.13 18.1% $9.13 11.5% 0.8288 1.0000 NR NR
PTT PEAKF Peak Int’l 9.00% 5/15/01 $11.13 12.7% $9.25 12.7% 0.8696 1.0000 NR NRPHLYZ PHLY Philadelphia Consol 7.00% 5/16/01 $9.63 7.3% $21.75 7.3% 0.3858 1.0000 NR BBPL P PL Protective Life Trust 6.50% 2/16/01 $61.88 5.3% $36.06 4.1% 1.5380 1.8760 A3 A-PKS A PKS Premier Parks 7.50% 4/1/01 $56.00 7.2% $28.56 7.2% 1.6616 2.0000 CAA1 B-
QWST Qwest Comm 5.75% 11/17/03 $43.00 5.6% $43.69 5.6% 0.8197 1.0000 NR NR
46 MORGAN STANLEY DEAN WITTER
This memorandum is based on information available to the public. No representation is made that it is accurate or complete. This memorandum is not an offer to buy or sell or asolicitation of an offer to buy or sell the securities mentioned. Please refer to the notes at the end of this report.
Appendix B: (Continued)
Outstanding PEPS: Recent Prices and Yields (Continued)
PEPS Stock Current Com PEPS Min Max Moody’s S&PTicker Ticker Issuer Coupon Maturity Price Yield Price Yld Adv Ratio Ratio Ratings Ratings
RII Republic Industry 6.50% 5/15/00 $16.00 9.7% $15.06 9.7% 0.8333 1.0000 NR NRRYG Royal Group Technology 6.88% 11/15/00 $22.63 8.0% $22.63 8.0% 0.8130 1.0000 NR NR
MAT C MAT TYCO/Mattel 8.25% 7/1/00 $12.19 3.4% $29.81 2.3% 0.4006 1.0000 NR NRUC I UC United Cos Finl 6.75% 6/16/00 $6.94 SUSP $3.94 SUSP 1.6528 2.0000 B2 B-
Source: Morgan Stanley Dean Witter Convertibles Research
MORGAN STANLEY DEAN WITTER 47
This memorandum is based on information available to the public. No representation is made that it is accurate or complete. This memorandum is not an offer to buy or sell or asolicitation of an offer to buy or sell the securities mentioned. Please refer to the notes at the end of this report.
Appendix C:Performance of Individual PEPS at Maturity
PEPS Com Compound Risk Adjusted Risk Adjusted
Maturity Total Total PEPS PEPS Com PEPS PEPS Com PEPS Com
Issuer Coupon Date Return Return Participatn Return Return Participatn Total Ret Total Ret Comp Ret Comp Ret
American Exp/First Data 6.25% 10/15/96 110.27% 131.59% 83.80% 110.66% 153.16% 72.25% 92.87% 109.47% 93.20% 127.41%
Common Stock Above Conversion Price: 13 133.69% 150.53%
Common Stock Between Issue Price and Conversion Price: 4 29.56% 17.91%
Common Stock Below Issue Price 4 -15.06% -31.62%
Source: Morgan Stanley Dean Witter Convertibles Research
48 MORGAN STANLEY DEAN WITTER
This memorandum is based on information available to the public. No representation is made that it is accurate or complete. This memorandum is not an offer to buy or sell or asolicitation of an offer to buy or sell the securities mentioned. Please refer to the notes at the end of this report.
Appendix E:PEPS Name VariationsEquity Participating Mandatory Convertibles
PRIDES : Provisionally Redeemable Income Debt Exchangeable for StockDECS : Debt Exchangeable for Common StockACES : Automatic Common Exchangeable SecuritiesMEDS : Mandatory Exchangeable Debt Securities
MORGAN STANLEY DEAN WITTER 49
This memorandum is based on information available to the public. No representation is made that it is accurate or complete. This memorandum is not an offer to buy or sell or asolicitation of an offer to buy or sell the securities mentioned. Please refer to the notes at the end of this report.
Appendix F:
PEPS and PERCS ComparisonPEPS PERCS
Issue Price Same as Common Stock Price at Issue. Same as Common Stock Price at Issue
Yield 500 to 600 basis point Current Yield Advantage. 700 to 900 basis point Current Yield Advantage.
PEPS Holders Get: PERCS Holders Get:If at Maturity Common is:
Higher than Threshold
Price: Conversion Value Based on
Conversion Ratio.
If at Maturity Common is:
Higher than Threshold
Price: Fraction of a Share Equal
to Cap Price/Stock Price.
(As stock price rises,
Holders get FewerShares.)
Conversion
Feature at
Maturity
Between Issue Price and
Threshold Price:
Fraction of Share equal to
Issue Price / Stock Price.
(Holders will always get
Value of Stock Equal to
Issue Price.)
Between Issue Price and
Threshold Price:
One Share of Stock.
Lower than Issue Price: One Share of Stock. Lower than Issue Price: One Share of Stock.
Call Protection Usually Three Years From Issue Date. No Call Protection.
Maturity Three to Five Years. Three Years.
50 MORGAN STANLEY DEAN WITTER
This memorandum is based on information available to the public. No representation is made that it is accurate or complete. This memorandum is not an offer to buy or sell or asolicitation of an offer to buy or sell the securities mentioned. Please refer to the notes at the end of this report.
Notes:
MORGAN STANLEY DEAN WITTER 51
This memorandum is based on information available to the public. No representation is made that it is accurate or complete. This memorandum is not an offer to buy or sell or asolicitation of an offer to buy or sell the securities mentioned. Please refer to the notes at the end of this report.
Notes:
52 MORGAN STANLEY DEAN WITTER
This memorandum is based on information available to the public. No representation is made that it is accurate or complete. This memorandum is not an offer to buy or sell or asolicitation of an offer to buy or sell the securities mentioned. Please refer to the notes at the end of this report.
__________________________
The information and opinions in this report were prepared by Morgan Stanley & Co. Incorporated (“Morgan Stanley Dean Witter”). Morgan Stanley DeanWitter does not undertake to advise you of changes in its opinion or information. Morgan Stanley Dean Witter and others associated with it may make mar-kets or specialize in, have positions in and effect transactions in securities of companies mentioned and may also perform or seek to perform investmentbanking services for those companies.
Within the last three years, Morgan Stanley & Co. Incorporated, Dean Witter Reynolds Inc. and/or their affiliates managed or co-managed a public offeringof the securities of K N Energy.
Morgan Stanley & Co. Incorporated, Dean Witter Reynolds Inc. and/or their affiliates or their employees have or may have a long or short position or hold-ing in the securities, options on securities, or other related investments of issuers mentioned herein.
The investments discussed or recommended in this report may be unsuitable for investors depending on their specific investment objectives and financialposition. Where an investment is denominated in a currency other than the investor’s currency, changes in rates of exchange may have an adverse effect onthe value, price of, or income derived from the investment. Past performance is not necessarily a guide to future performance. Income from investmentsmay fluctuate. The price or value of the investments to which this report relates, either directly or indirectly, may fall or rise against the interest of investors.
To our readers in Australia: This publication has been issued by Morgan Stanley & Co. Inc. but is being distributed in Australia by Morgan Stanley AustraliaLimited, a licensed dealer, which accepts responsibility for its contents. Any person receiving this report and wishing to effect transactions in any securitydiscussed in it may wish to do so with an authorised representative of Morgan Stanley Australia Limited.
To our readers in the United Kingdom: This publication has been issued by Morgan Stanley & Co. Incorporated and approved by Morgan Stanley & Co.International Ltd., regulated by the Securities and Futures Authority Limited. Morgan Stanley & Co. International Limited and/or its affiliates may be pro-viding or may have provided significant advice or investment services, including investment banking services, for any company mentioned in this report.The investments discussed or recommended in this report may be unsuitable for investors depending on their specific investment objectives and financialposition. Private investors should obtain the advice of their Morgan Stanley & Co. International Limited representative about the investments concerned.
This publication is disseminated in Japan by Morgan Stanley Japan Limited and in Singapore by Morgan Stanley Asia (Singapore) Pte.
Additional information on recommended securities is available on request.