34
Experience you can trust. Premium Power Quality contracts and labeling Webinar ECI 17 September 2007 Work package 2 of the Quality of Supply and Regulation Project Jasper van Casteren
| Date post: | 14-Jul-2015 |
| Category: |
Travel |
| Upload: | european-copper-institute |
| View: | 781 times |
| Download: | 3 times |
Experience you can trust.
Premium Power Quality contracts and labeling
Webinar ECI 17 September 2007Work package 2 of the Quality of Supply and Regulation Project
Jasper van Casteren
Contents
• Introduction
• Power Quality contracts
• Power Quality classification
• Conclusions
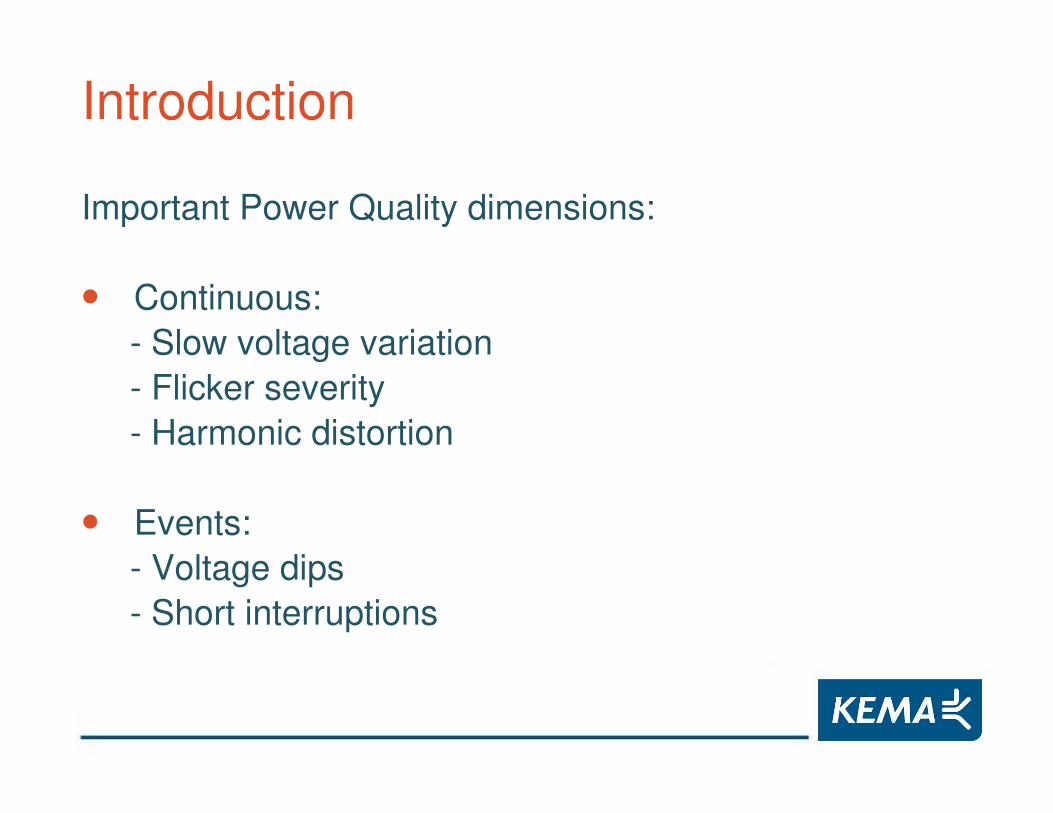
Introduction
Important Power Quality dimensions:
• Continuous:- Slow voltage variation- Flicker severity- Harmonic distortion
• Events:- Voltage dips- Short interruptions
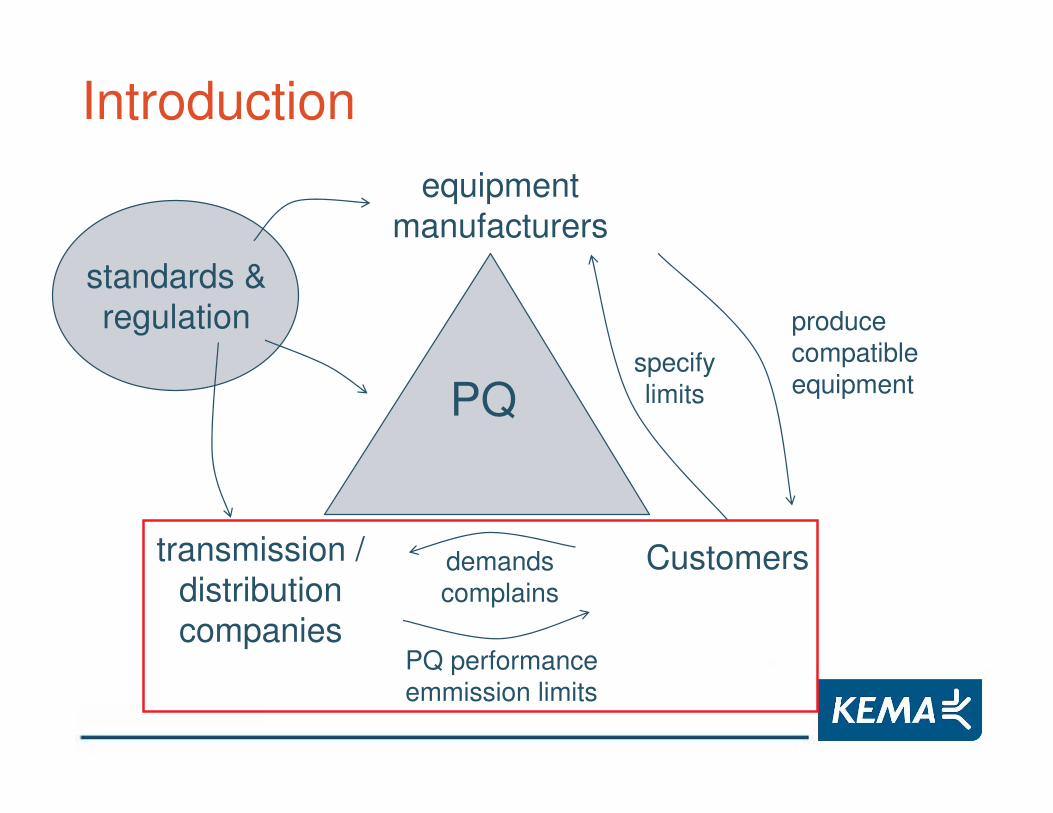
Introductionequipment
manufacturers
transmission /distributioncompanies
Customers
PQ
demandscomplains
PQ performanceemmission limits
producecompatibleequipment
specifylimits
standards ®ulation
Introduction
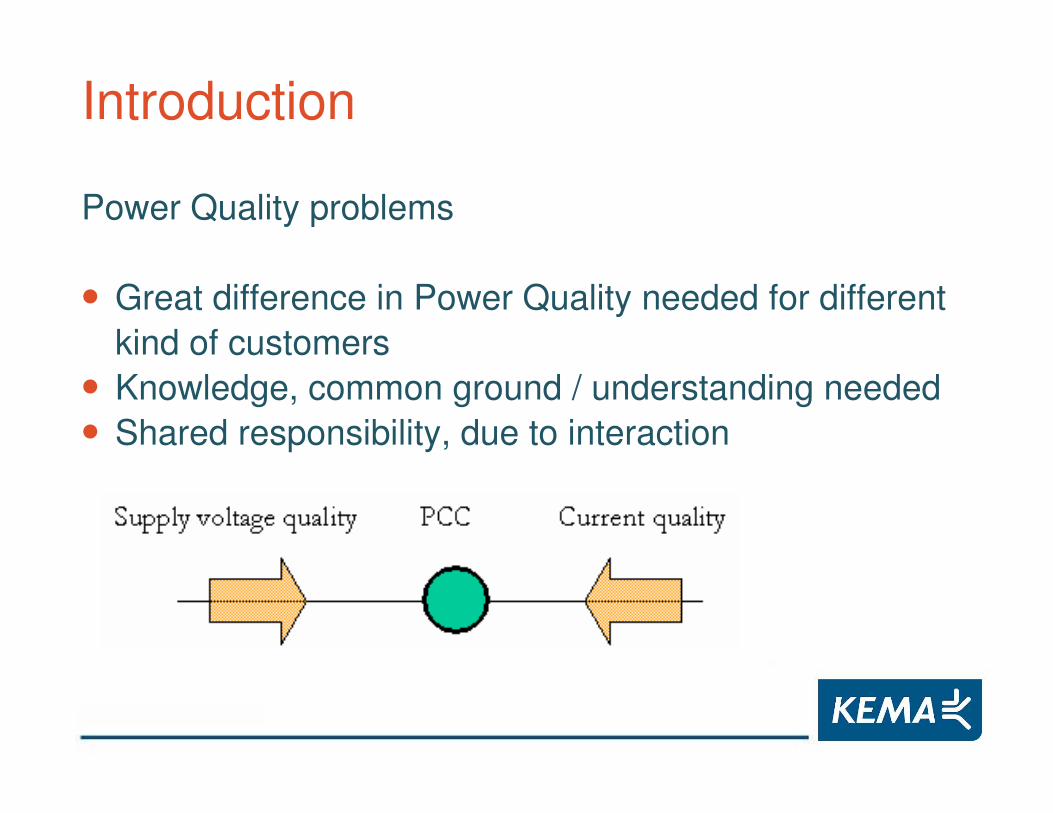
Power Quality problems
• Great difference in Power Quality needed for different kind of customers
• Knowledge, common ground / understanding needed• Shared responsibility, due to interaction
Power Quality contracts
Benefits for the grid operator:• Customer-satisfaction.• Only investments into premium power quality for
customers who really need it.
Benefits for the customer:• Insured of a sufficient level of power quality.• A power quality solution in the grid could be cheaper
as a solution on site.
Power Quality contracts
• Financial mitigation instrument
• Minimum standards needed, to protect customers without a power quality contract for poor power quality.
• Good solution for customers which need high levels of power quality.
Examples of Power Quality contracts
• EdF, France• Autorità, Italy• Eskom, South-Africa• DEC, USA• UIC, USA• PSE&G, USA• Argentina
Power Quality contracts: France
• Both TNO (RTE) as well the biggest DNO (EdF).
• Contract called “Emeraude” (Emerald) and contains a “base-contract”, “contract with customer adjusted levels” and a “plus contract” for the most sensitive customers.
• Both demands on “delivered” voltage quality, as well on emission limits for customers.
Power Quality contracts: France
Requirements for voltage quality regarding.:
• Number of planned interruptions• Number of short and long planned interruptions• Number of voltage dips• Slow voltage variations• Rapid voltage fluctuations (flicker)• Unbalance• Frequency• Harmonic voltages
Power Quality contracts: Italy
• Voltage quality measurement campaign since 2006; Grid operators have to do power quality measurements at strategic locations in the grid and report to the regulator.
• The grid operator has to measure the voltage quality, on the customers requests. The customer paids the costs for it.
• Customers have the opportunity to participate in a power quality contract with the grid operator. Currently, no contracts have been established.
Power Quality contracts: Italy
At the moment 400 PQ meters at the MV rail of HV/MV stations and 200 PQ meters at customers.
The following voltage quality aspects need to be monitored and reported:
• Supply voltage variations• Supply voltage dips and peaks• Voltage interruptions• Voltage harmonics• Flicker• Supply voltage unbalance• Rapid voltage changes
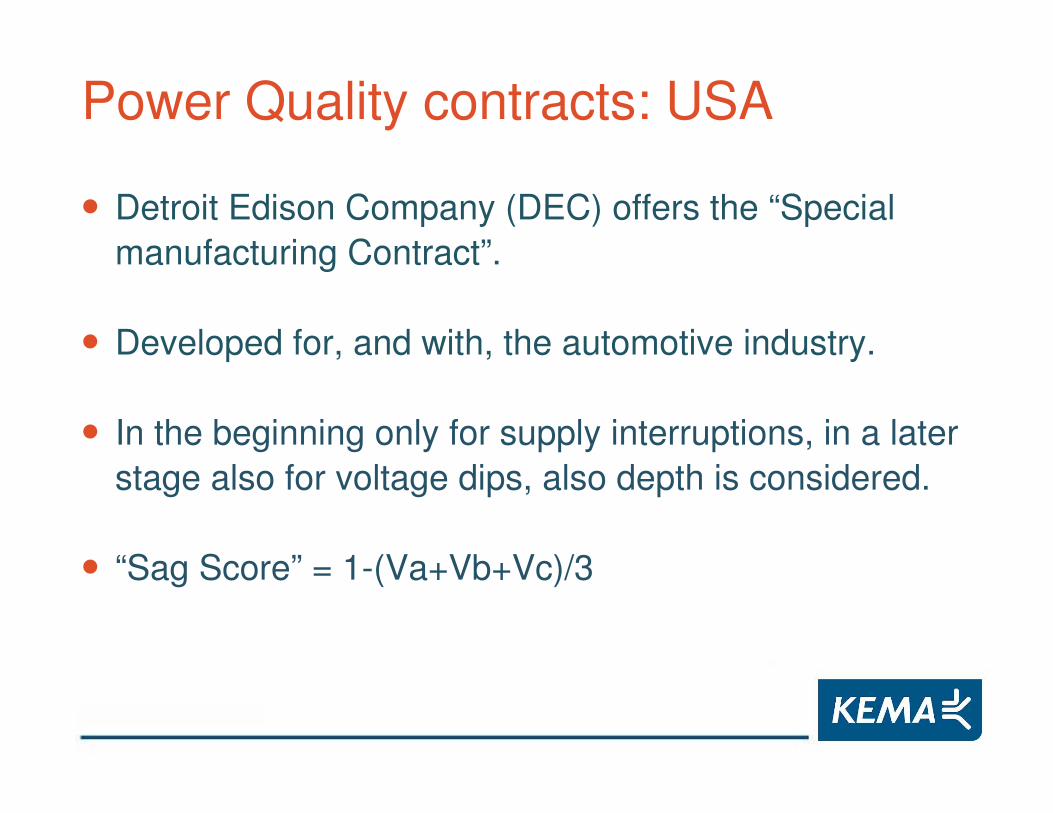
Power Quality contracts: USA
• Detroit Edison Company (DEC) offers the “Special manufacturing Contract”.
• Developed for, and with, the automotive industry.
• In the beginning only for supply interruptions, in a later stage also for voltage dips, also depth is considered.
• “Sag Score” = 1-(Va+Vb+Vc)/3
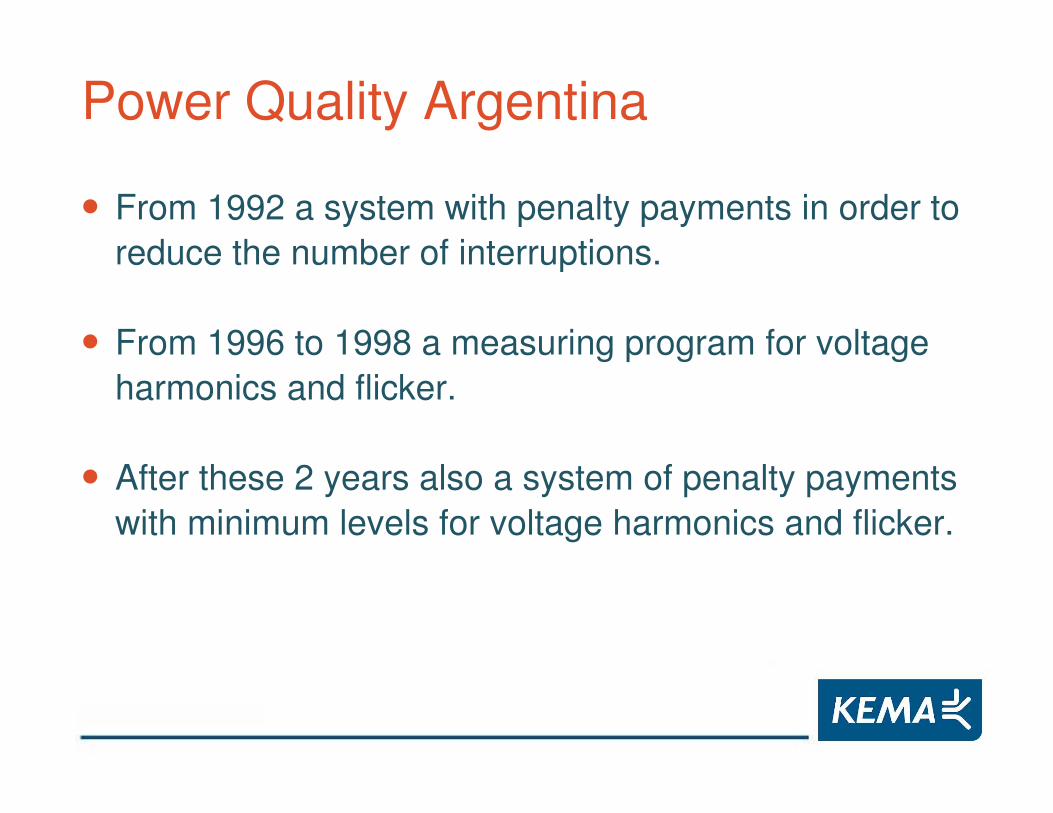
Power Quality Argentina
• From 1992 a system with penalty payments in order to reduce the number of interruptions.
• From 1996 to 1998 a measuring program for voltage harmonics and flicker.
• After these 2 years also a system of penalty payments with minimum levels for voltage harmonics and flicker.
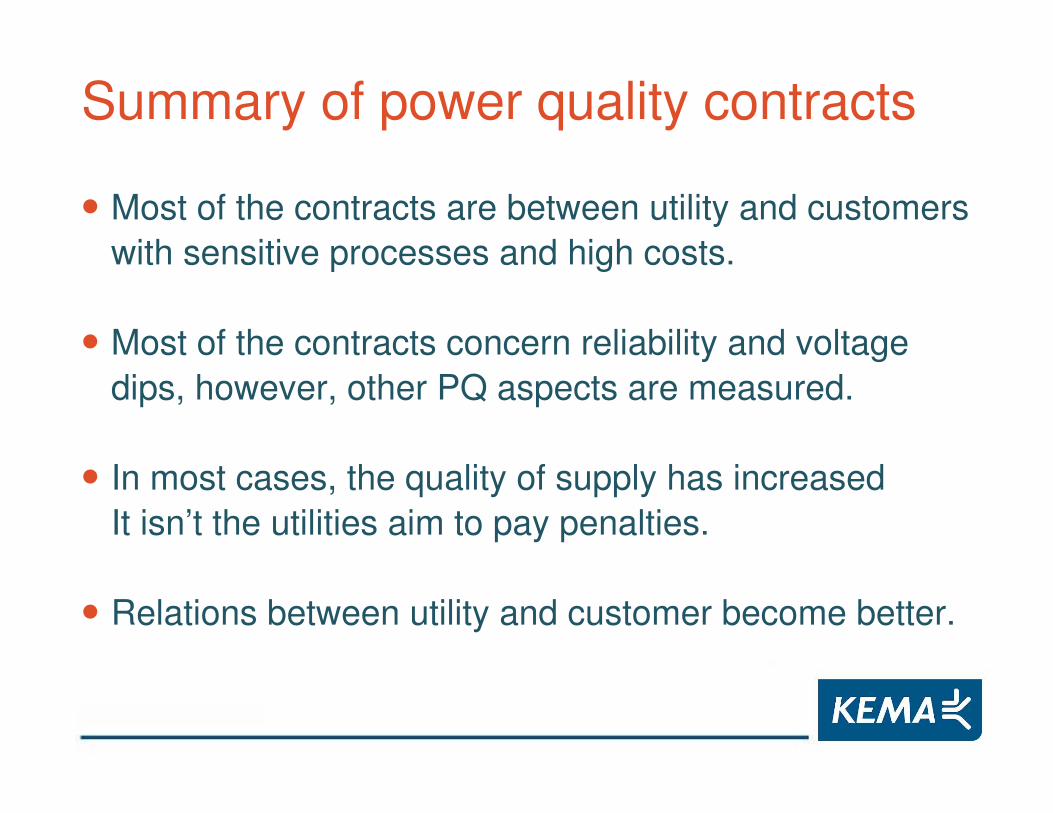
Summary of power quality contracts
• Most of the contracts are between utility and customers with sensitive processes and high costs.
• Most of the contracts concern reliability and voltage dips, however, other PQ aspects are measured.
• In most cases, the quality of supply has increasedIt isn’t the utilities aim to pay penalties.
• Relations between utility and customer become better.
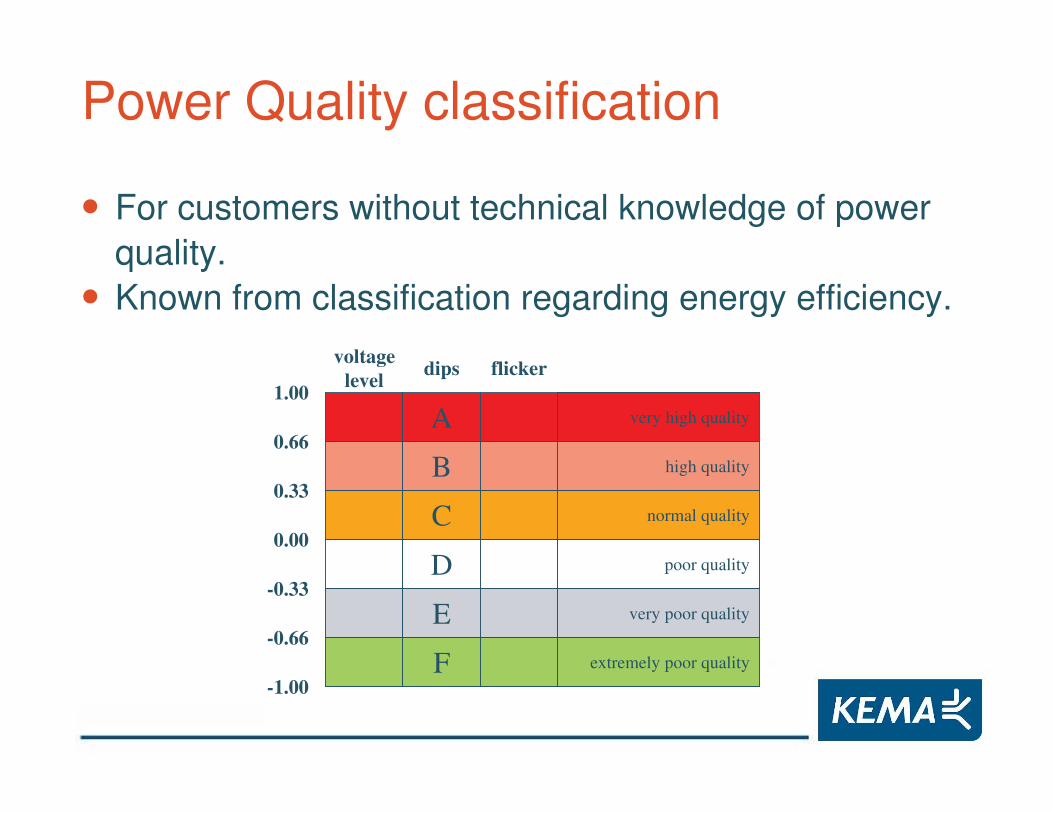
Power Quality classification
• For customers without technical knowledge of power quality.
• Known from classification regarding energy efficiency.voltage
level
0.66
0.33
0.00
-0.33
-0.66
-1.00
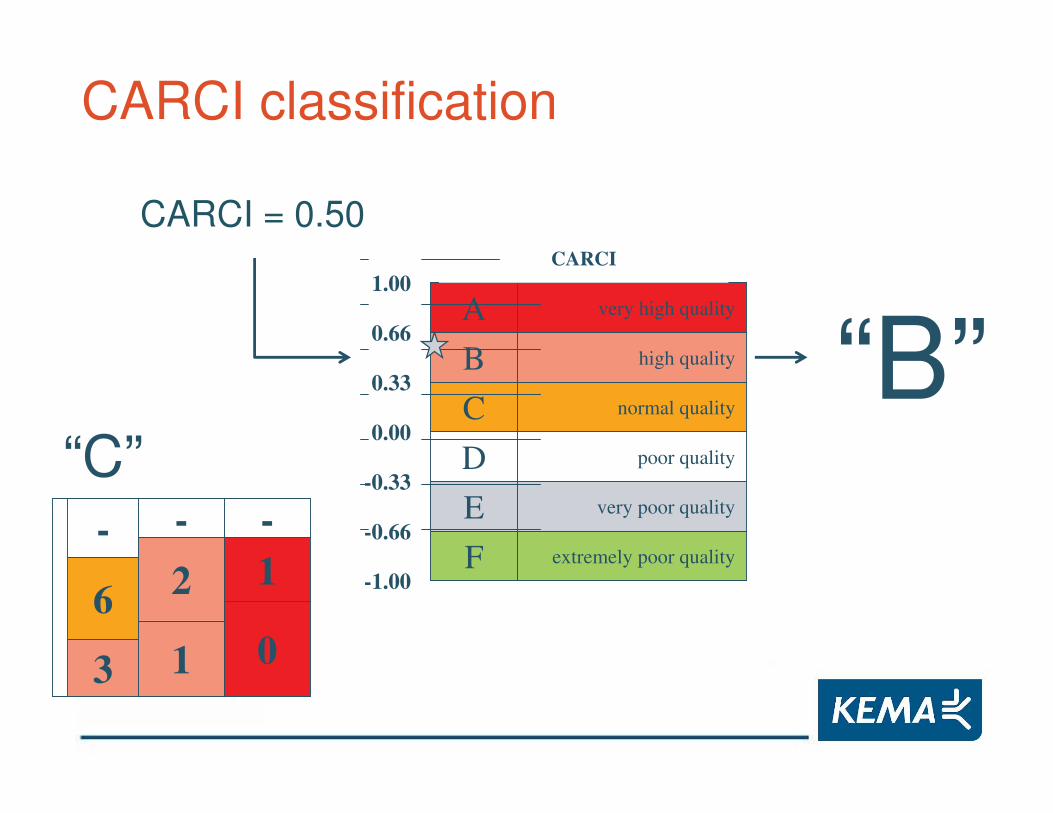
1.00A
B
D
C
E
F
dips flicker
very high quality
high quality
poor quality
normal quality
very poor quality
extremely poor quality
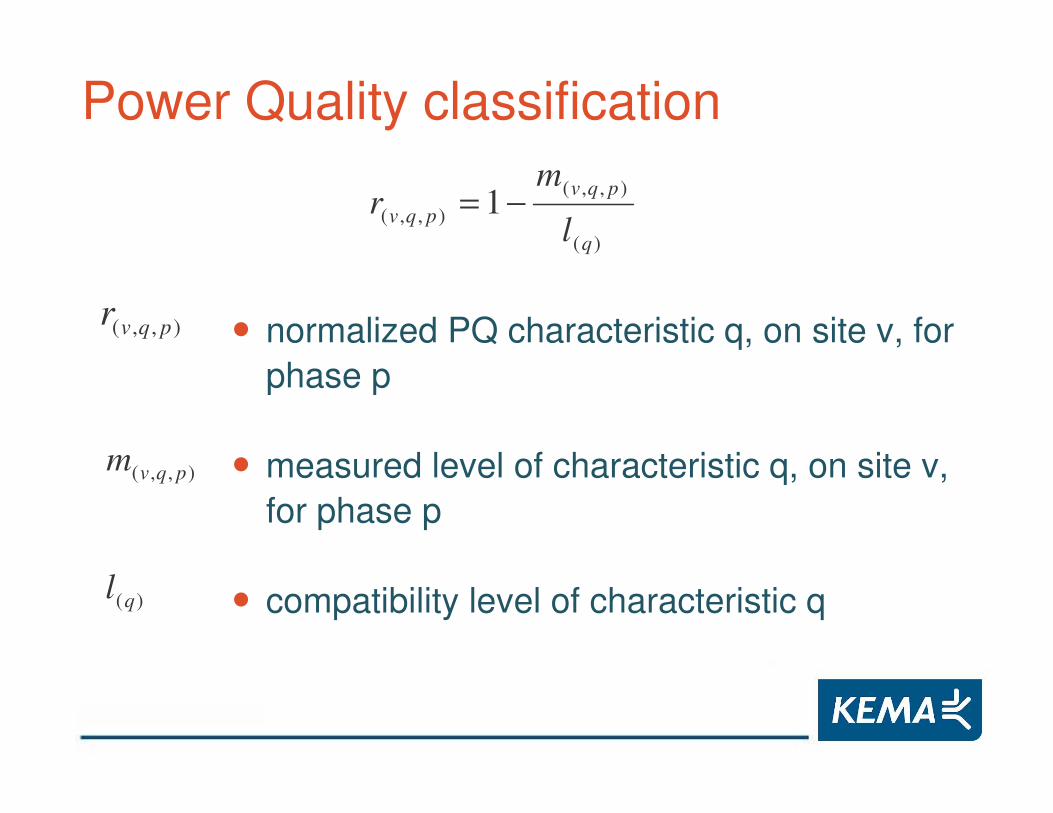
Power Quality classification
)(
),,(),,( 1
q
pqvpqv l
mr −=
),,( pqvr
),,( pqvm
)(ql
• normalized PQ characteristic q, on site v, for phase p
• measured level of characteristic q, on site v, for phase p
• compatibility level of characteristic q
Power Quality classification: Flicker
( ) 52.0148.0
1,, =−=pqvr
A
B
D
C
EF
very high quality
high quality
poor quality
normal quality
very poor quality
extremely poor quality
95 % percentile flicker level
0.66
0.33
0.00
- 0.33
- 0.66
- 1.00
1.00 A
B
D
C
EF
very high quality
high quality
poor quality
normal quality
very poor quality
extremely poor quality
95 % percentile flicker level
0.66
0.33
0.00
- 0.33
- 0.66
- 1.00
1.00
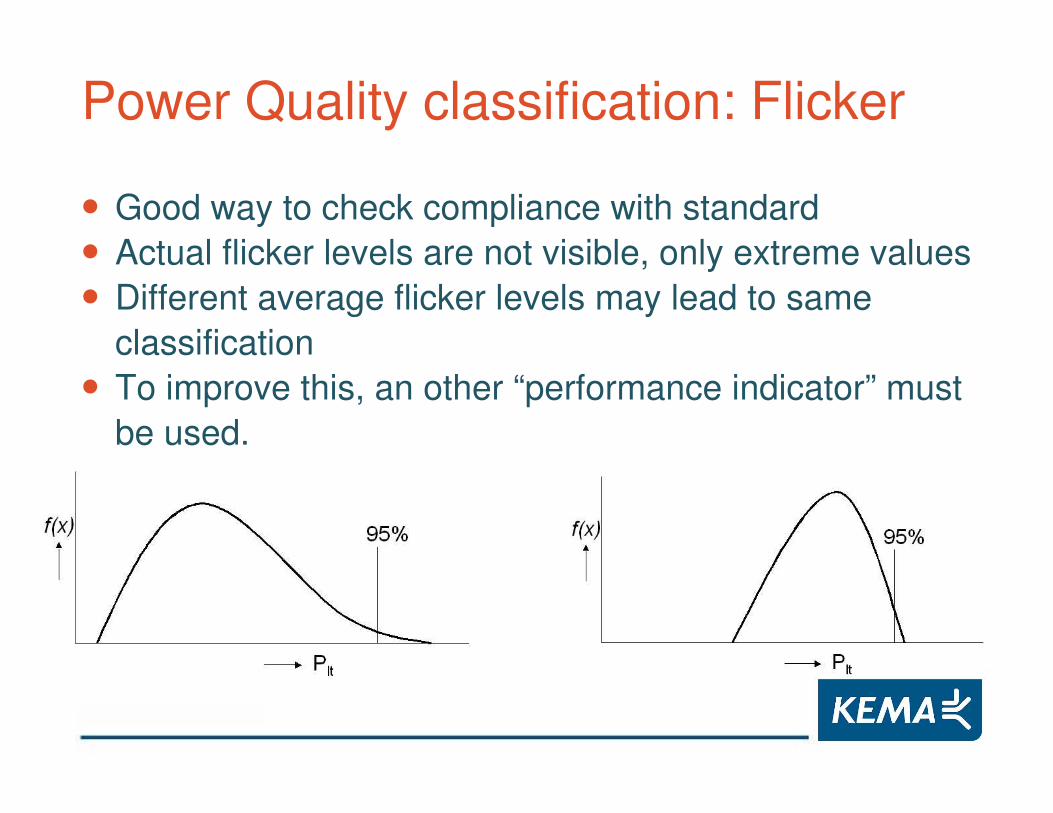
Power Quality classification: Flicker
• Good way to check compliance with standard• Actual flicker levels are not visible, only extreme values• Different average flicker levels may lead to same
classification• To improve this, an other “performance indicator” must
be used.
Power Quality classificaton: Harmonics
• Each individual harmonic voltage and the THD can be classified on the same way as flicker.
• The worst classification letter, of the individual harmonics and THD, is ascribed to voltage harmonics.
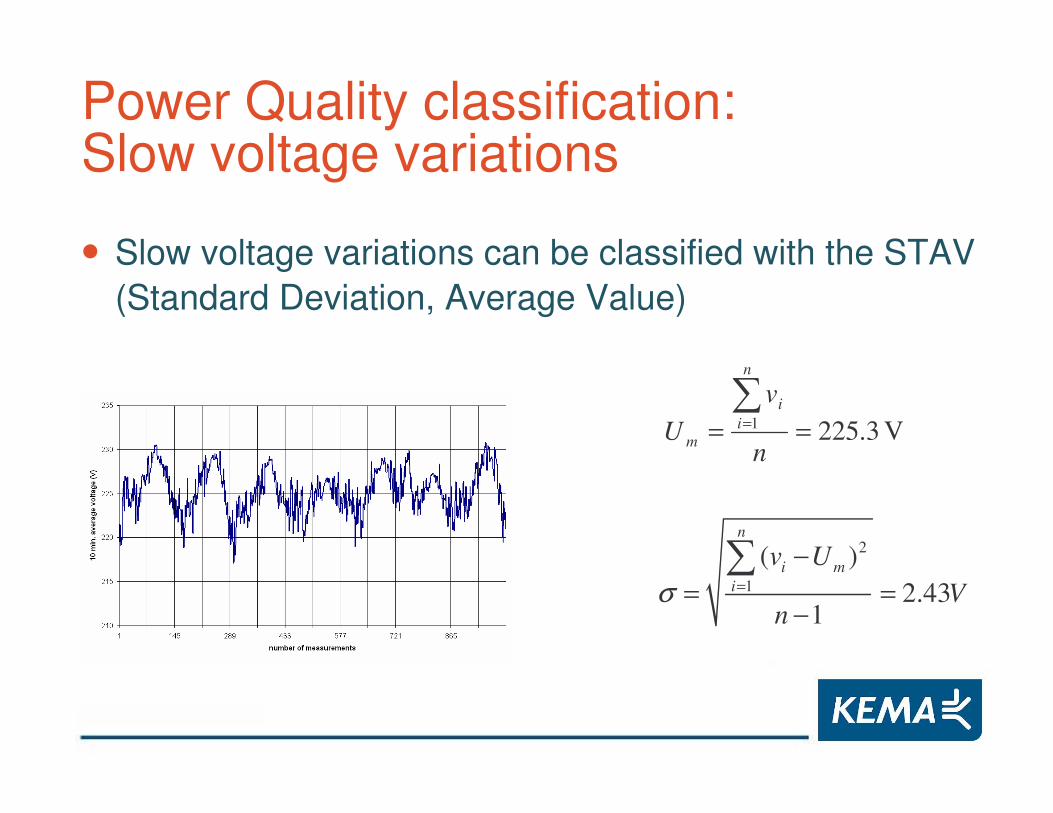
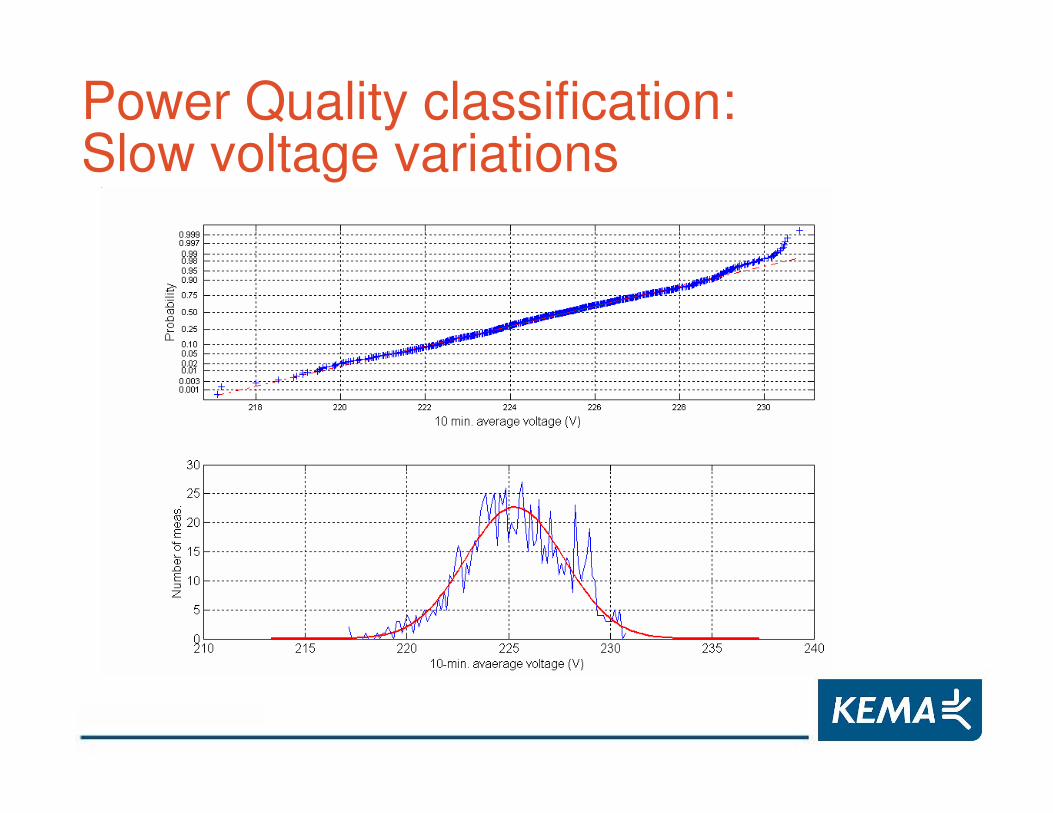
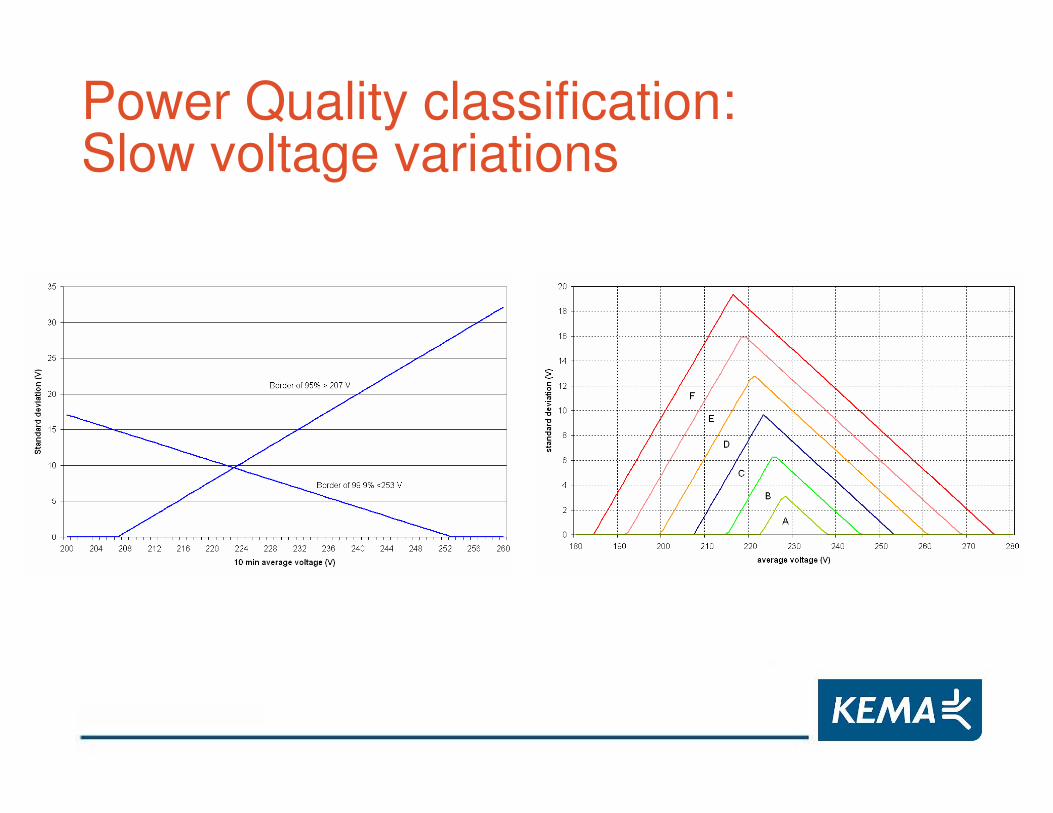
Power Quality classification: Slow voltage variations
• Slow voltage variations can be classified with the STAV (Standard Deviation, Average Value)
V 3.2251 ==�
=
n
vU
n
ii
m
2
1
( )2.43
1
n
i mi
v UV
nσ =
−= =
−
�
Power Quality classification: Slow voltage variations
Power Quality classification: Slow voltage variations
100
90
80
70
60
50
30
40
20
10
0
500 ms. 10 s. 5 min.
S0
S1
S2
M0
M1
M2
L0
L1
L2
dip duration
rem
aini
ng v
olta
ge [
%]
20 ms.
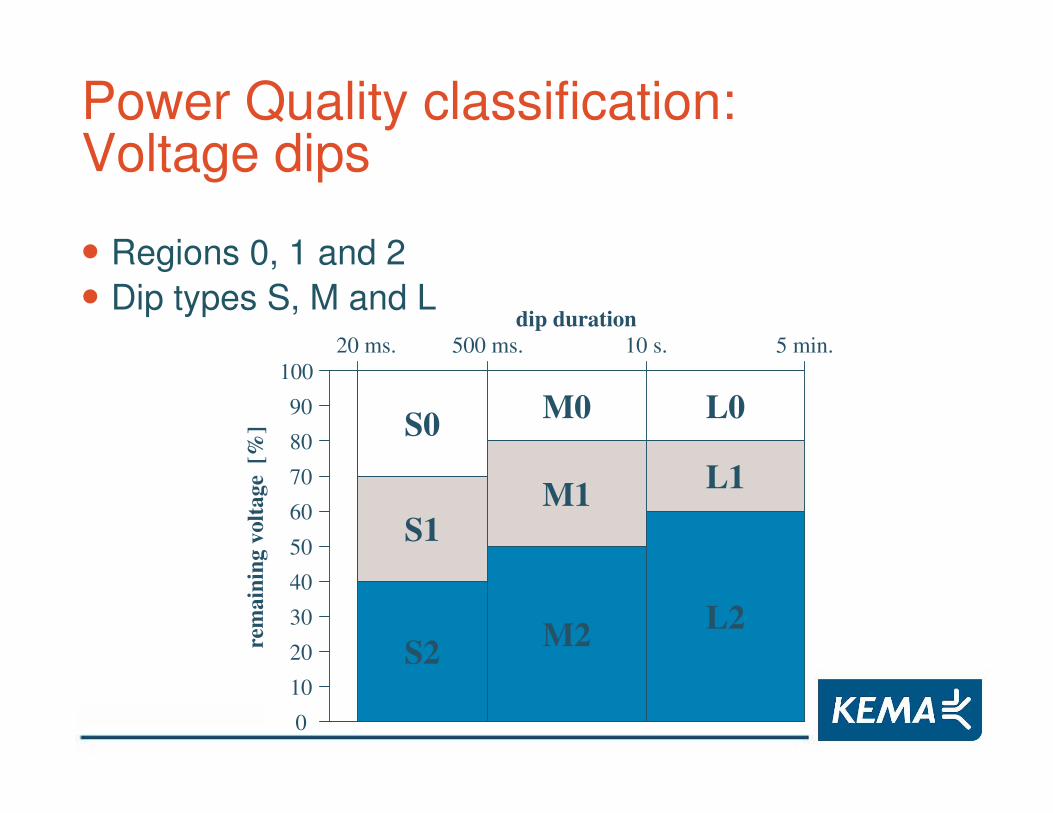
Power Quality classification: Voltage dips
• Regions 0, 1 and 2• Dip types S, M and L
-
8
4
-
4
2
-
2
1
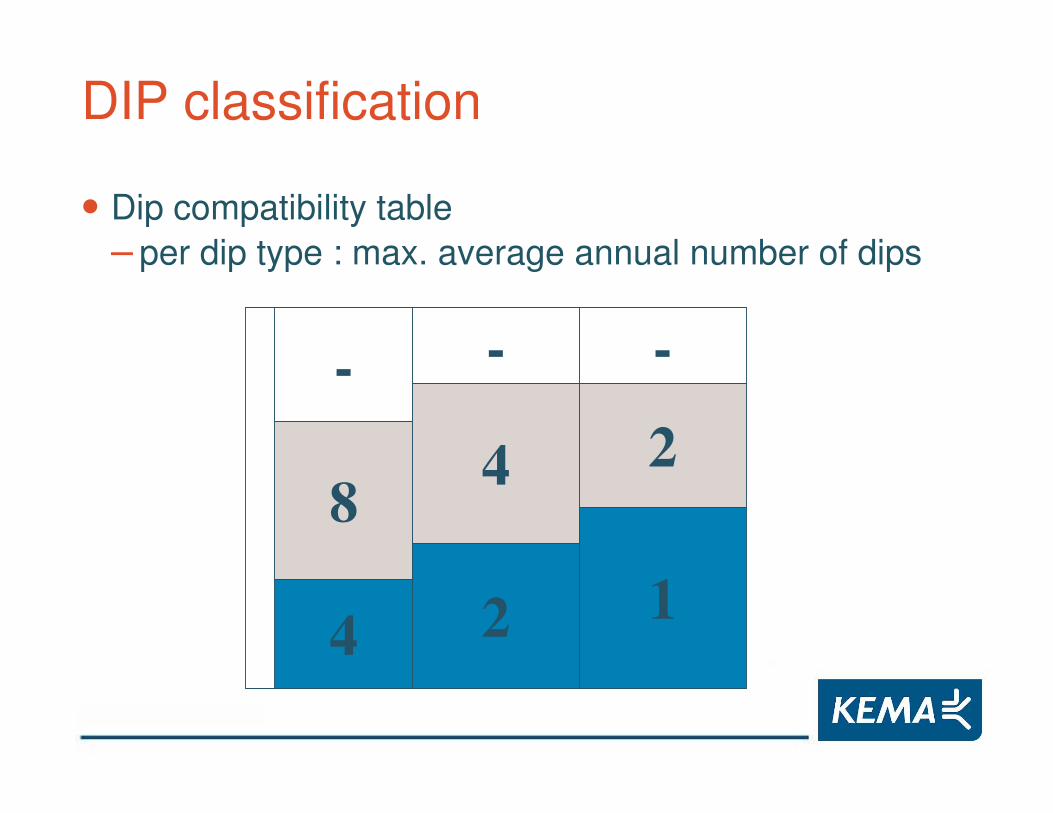
DIP classification
• Dip compatibility table– per dip type : max. average annual number of dips
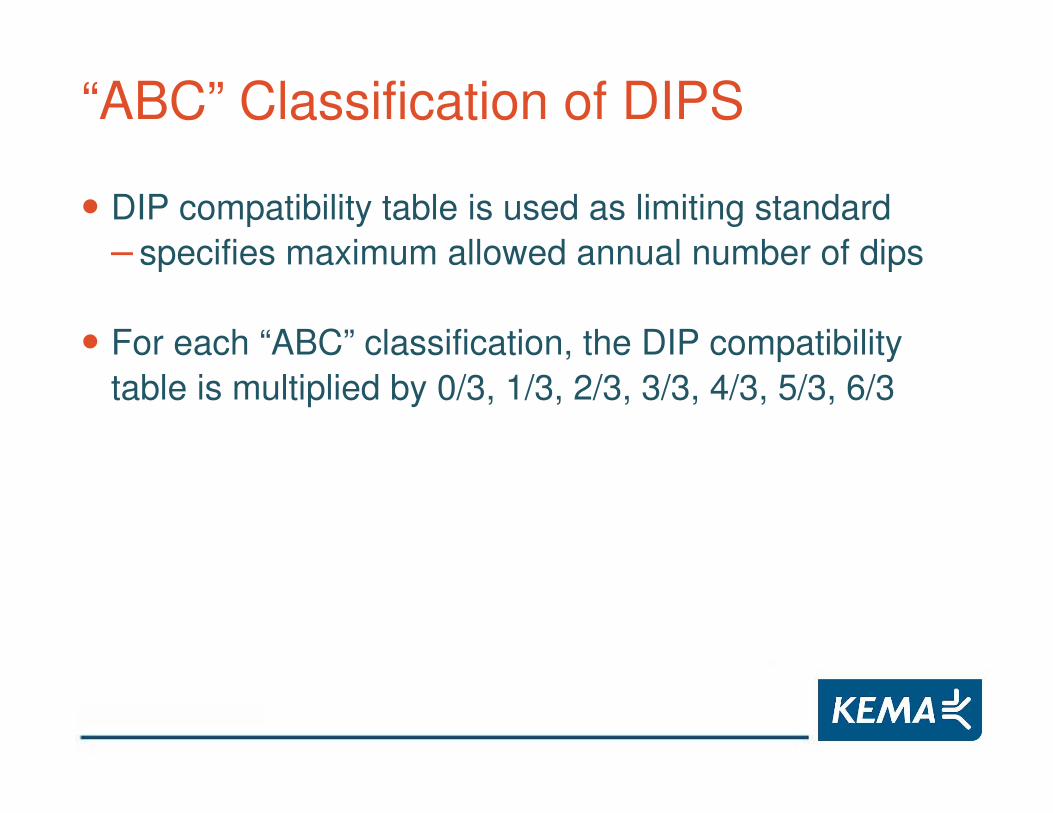
“ABC” Classification of DIPS
• DIP compatibility table is used as limiting standard– specifies maximum allowed annual number of dips
• For each “ABC” classification, the DIP compatibility table is multiplied by 0/3, 1/3, 2/3, 3/3, 4/3, 5/3, 6/3
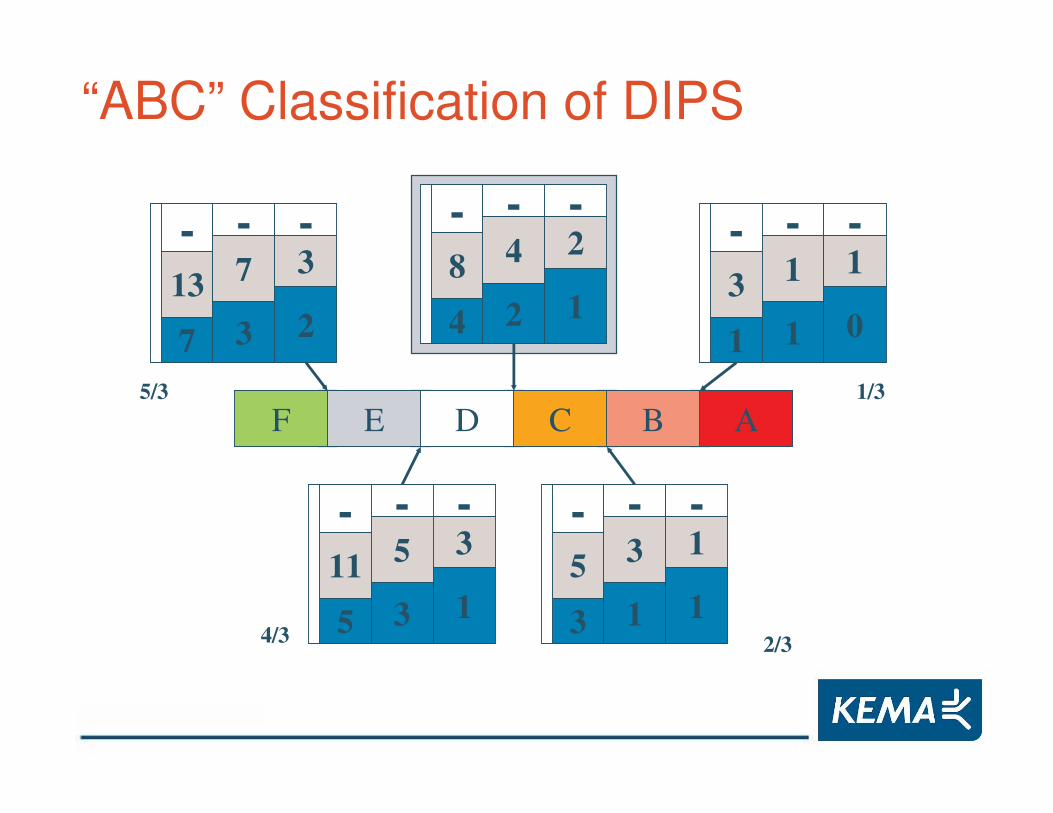
5/3 1/3
-11
5
-5
3
-3
1
-8
4
-4
2
-2
1
-3
1
-1
1
-1
0
-5
3
-3
1
-1
1
ABD CEF
-13
7
-7
3
-3
2
2/34/3
“ABC” Classification of DIPS
-
8
4
-
4
2
-2
1
-
1.7
5.2
-
3.4
10.3
-6.9
17.2
= 1.0⊗
* 0.01
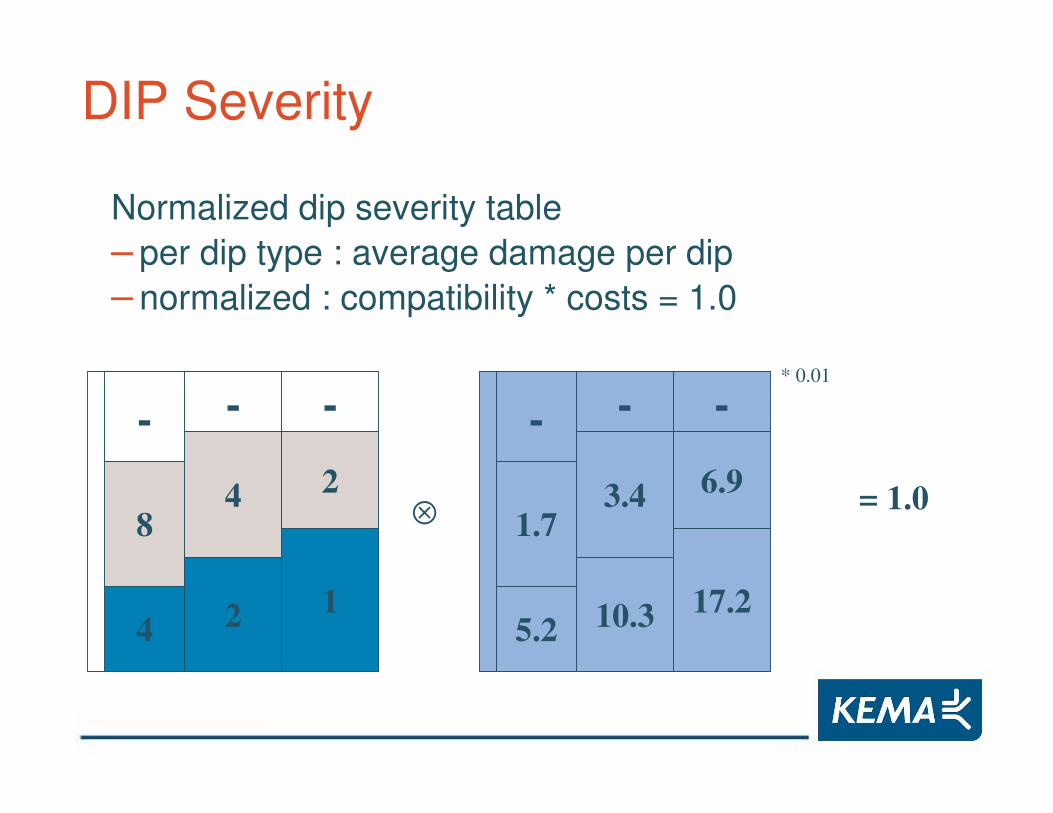
DIP Severity
Normalized dip severity table– per dip type : average damage per dip– normalized : compatibility * costs = 1.0
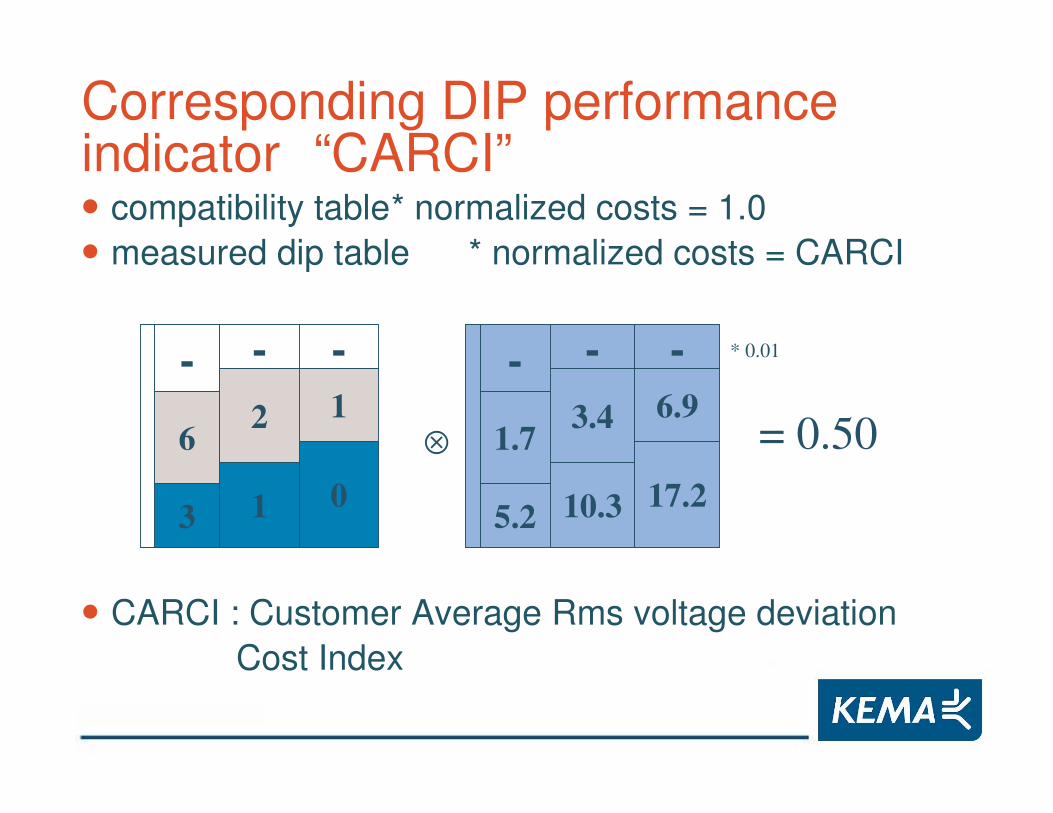
Corresponding DIP performance indicator “CARCI”• compatibility table* normalized costs = 1.0• measured dip table * normalized costs = CARCI
• CARCI : Customer Average Rms voltage deviationCost Index
-6
3
-2
1
-1
0
= 0.50⊗
* 0.01-1.7
5.2
-3.4
10.3
-6.9
17.2
AB
DC
EF
very high quality
high quality
poor quality
normal quality
very poor quality
extremely poor quality
CARCI
0.66
0.33
0.00
-0.33
-0.66
-1.00
1.00
CARCI classification
CARCI = 0.50
“B”-
6
3
-2
1
-1
0
“C”
Advantages of DIP classification method• DIP cost table can be constructed for various types of
customer classes (industry, households, commercial, etc.)
• Specific CARCI can be calculated for individual customers
• Easy to be used for “what-if” dip mitigation questions
• Max. number of dips per dip type remain in place
Summary of classification
• Methods exist to calculate normalized levels of power quality performance
• These methods can be extended to other PQ-phenomena
• The color-coded “ABC” classification system is excellent for communicating the difficult subject of power quality to all customers in a meaningful and transparent way.
• DIP classification system clearly specifies responsibilities, useful for SLA’s.
Conclusions
• PQ contracts are attractive for customers with sensitive process and / or high costs due to poor power quality.
• Most contracts so far deal with the number of interruptions and voltage dips, however, other PQ aspects are measured.
• In most cases, the quality of supply has increasedIt isn’t the utilities aim to pay penalties.
• Relations between utility and customer become better.
• Power quality classification gives information about power quality for people without technical knowledge.
Experience you can trust.
The end
Thanks for your attention.
Jasper van Casteren+31 26 356 38 68


