+ All Categories
Home > Documents > Preparation and Characterization of …shodhganga.inflibnet.ac.in/bitstream/10603/8321/11/11_chapter...

Preparation and Characterization of …shodhganga.inflibnet.ac.in/bitstream/10603/8321/11/11_chapter...

Date post: 29-Aug-2018
Category:
Upload: lyxuyen
View: 212 times
Download: 0 times
Share this document with a friend
25
Chapter 2 Preparation and Characterization of ZnF 2 –PbO–TeO 2 : TiO 2 glass ceramics In this chapter the detailed description of the methods used in the preparation of glasses and glass ceramics and the apparatus used and methods adopted for the characterization of the ZnF 2 –PbO–TeO 2 : TiO 2 glass ceramics are presented. The characterization of the samples by SEM, TEM, XRD and DSC techniques have indicated that the samples contain well defined and randomly distributed grains of different crystalline phases.
Transcript

Chapter 2

Preparation and Characterization of ZnF2–PbO–TeO2: TiO2 glass ceramics

In this chapter the detailed description of the methods used in the

preparation of glasses and glass ceramics and the apparatus used and

methods adopted for the characterization of the ZnF2–PbO–TeO2: TiO2

glass ceramics are presented. The characterization of the samples by SEM,

TEM, XRD and DSC techniques have indicated that the samples contain

well defined and randomly distributed grains of different crystalline

phases.

Preparation and Characterization of ZnF2–PbO–TeO2: TiO2 glass ceramics

2.1 Introduction

In this chapter the detailed description of the methods used in the

preparation of glasses and glass ceramics and the apparatus used and methods

adopted for the characterization of the ZnF2–PbO–TeO2: TiO2 glass ceramics are

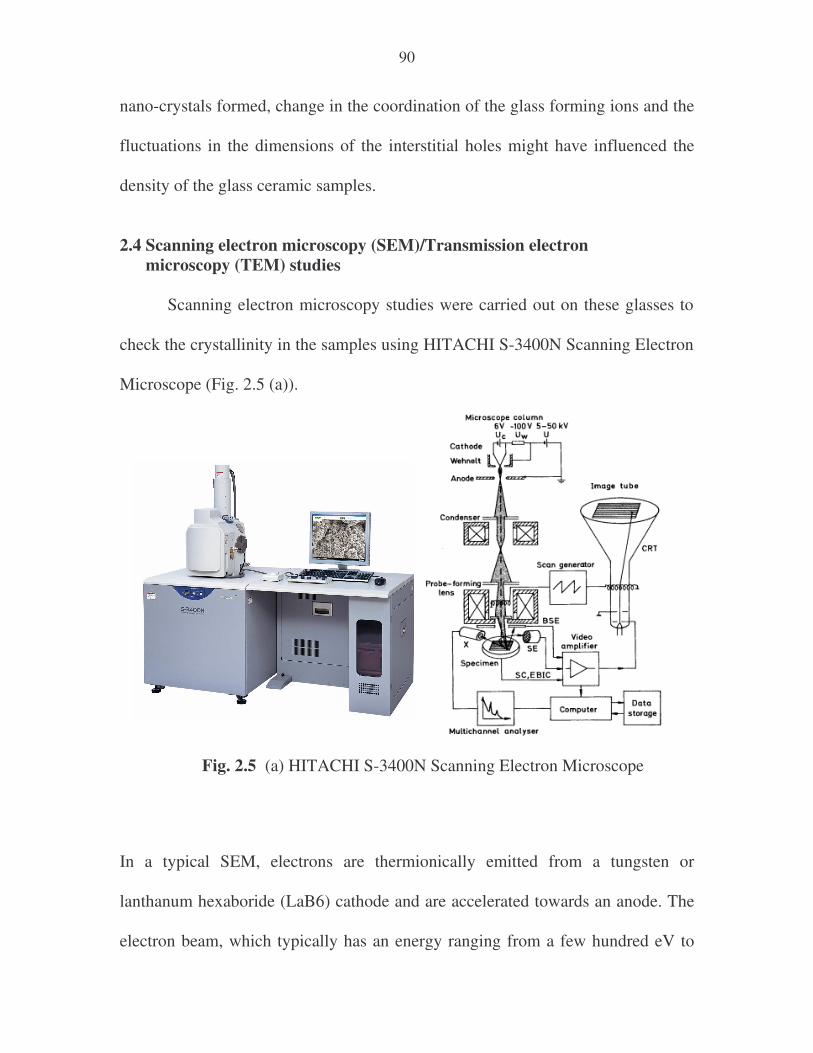
presented. The methods include X-Ray diffraction (XRD), scanning electron

microscopy (SEM) and transmission electron microscopy (TEM), differential

scanning calorimetry (DSC). These studies are intended to obtain the

information regarding the chemical composition, size and the concentration of

different crystalline phases that are formed in the bulk samples due to

crystallization. This information is essential for understanding different physical

properties of the samples that are presented in the subsequent chapters.

2.2 Glass preparation

2.2.1 Composition of the glass

Within the glass forming region of ZnF2–PbO–TeO2 system (Fig. 2.1), the

following compositions are chosen for the present study:

TC0 : 30ZnF2–10.0PbO– 60TeO2

TC5 : 30ZnF2–9.50PbO–60TeO2:0.5TiO2 TC7 : 30ZnF2–9.30PbO–60TeO2:0.7TiO2

TC10: 30ZnF2–9.00PbO–60TeO2:1.0TiO2 TC15: 30ZnF2–8.50PbO–60TeO2:1.5TiO2

85

TC20: 30ZnF2–8.00PbO–60TeO2 :2.0TiO2

Fig. 2.1 Approximate glass forming region of ZnF2–PbO–TeO2 system. Circle indicates the composition of the present study.

2.2.2 Preparation of the glass and glass ceramics

The glasses used for the present study are prepared by the melting and

quenching techniques [1–3]. The starting chemicals used for the preparation of

the glasses were analytical grade reagents of ZnF2, PbO, TeO2 (METALL, China,

4N pure) and TiO2. The compounds of required compositions were thoroughly

mixed in an agate mortar and melted in a platinum crucible. The furnace used was

a proportional–integral–derivative (PID) temperature controlled furnace (Fig. 2.2).

The glasses were melted at about 700–750 oC for an hour till a bubble free liquid

86

was formed. The resultant melt was then poured in a brass mould (containing

smooth polished inner surface) and subsequently annealed from 250 oC with a

cooling rate of 1ºC/min in another furnace.

Crystallization

For the crystallization, the glasses were heat treated at crystallization

temperature of the corresponding amorphous material identified from the DSC

traces of the glasses for 72 h. After heat treatment in the furnace at specified

temperature, the samples were sharply chilled in air to room temperature.

Automatic controlling furnace was used for raising the temperature to the required

level and for maintaining it for the specified duration.

Fig. 2.2 (a) PID controller and the photographs of (b) Melting furnace (c) Annealing furnace and (d) Casting of glass sample.

87

The photographs of some of ZnF2–PbO –TeO2 :TiO2 glass samples (as quenched) are shown below:

Fig. 2.3 Photographs of pre-polished ZnF2 –PbO –TeO2: TiO2 glass samples

The glasses were then ground and optically polished. The approximate final

dimensions of the glasses used for studying the electrical and optical properties are

1 cm x 1 cm x 0.2 cm.

2.3 Physical properties

The density (d) of the glasses and glass ceramics was determined to an

accuracy of 0.0001 g/cm3 by the standard principle of Archimedes’ with o-xylene

(99.99 % pure) as the buoyant liquid using Ohaus digital balance Model AR2140

fitted with density measurement kit. The density of the samples was determined by

weighing the bulk glasses in the liquid and in air. The refractive index (nd) of the

glasses was measured (at λ = 589.3 nm) at room temperature using Abbe

88

refractometer (Fig.2.4) with monobromo naphthalene as the contact layer between

the glass and the refractometer prism.

From the measured values of the density and average molecular weight M

of the samples, various other physical parameters such as titanium ion

concentration Ni, mean titanium ion separation Ri, polaron radius Rp in ZnF2–PbO–

TeO2: TiO2 glass ceramic samples which are useful for understanding the physical

properties of these glasses are evaluated using conventional formulae [3,4]

mentioned in the Chapter 1 and presented in Table 3.1. The density of the samples

is observed to decrease slightly with the concentration of TiO2. However due to

the crystallization a slight increment in the density compared to that of

corresponding amorphous samples is observed.

The average errors in these physical parameters were calculated and given below.

Density, d (g/cm3) ±0.0001

Fig. 2.4 Abbe refractometer (Model NAR-4T)

89

Dopant ion concentration, Ni (1020/cm3) ±0.01

Inter-ionic distance of dopant ions, Ri (Å) ±0.01

Polaron radius, Rp(Å) ±0.01

Field strength, Fi (1015 cm-2) ±0. 01

Refractive index ±0. 001

Table 2.1 Physical parameters of ZnF2–PbO–TeO2: TiO2 glass ceramic samples

• Density values given in the parenthesis are those of corresponding amorphous samples

The progressive introduction of crystallizing agent TiO2 caused a slight

decrease in the density of the samples. The degree of structural compactness, the

modification of the geometrical configuration of the glassy network, the size of the

Sample

Density (g/cm3)

Dopant ion conc (Ni)

( x 1020 ions/cm3)

Inter ionic distance(Ao)

Polaron radius (Ao)

Refractive index

TCo

TC5

TC7

TC10

TC15

TC20

5.660

(5.565)

5.617 (5.506)

5.517

(5.499)

5.499 (5.496)

5.486

(5.486)

5.467 (5.405)

……..

1.14

1.57

2.24

3.55

4.505

……..

20.62

18.53

16.46

14.12

13.04

………

8.309

7.468

6.632

5.689

5.256

1.662

1.655

1.653

1.649

1.642

1.633

90

nano-crystals formed, change in the coordination of the glass forming ions and the

fluctuations in the dimensions of the interstitial holes might have influenced the

density of the glass ceramic samples.

2.4 Scanning electron microscopy (SEM)/Transmission electron microscopy (TEM) studies

Scanning electron microscopy studies were carried out on these glasses to

check the crystallinity in the samples using HITACHI S-3400N Scanning Electron

Microscope (Fig. 2.5 (a)).

In a typical SEM, electrons are thermionically emitted from a tungsten or

lanthanum hexaboride (LaB6) cathode and are accelerated towards an anode. The

electron beam, which typically has an energy ranging from a few hundred eV to

Fig. 2.5 (a) HITACHI S-3400N Scanning Electron Microscope

91

100 keV, is focused by one or two condenser lenses into a beam with a very fine

focal spot sized 0.4 nm to 5 nm. The beam passes through pairs of scanning coils

or pairs of deflector plates in the electron optical column, typically in the objective

lens, which deflect the beam horizontally and vertically so that it scans in a raster

fashion over a rectangular area of the sample surface. When the primary electron

beam interacts with the sample, the electrons lose energy by repeated scattering

and absorption within a teardrop-shaped volume of the specimen known as the

interaction volume, which extends from less than 100 nm to around 5 µm into the

surface. The size of the interaction volume depends on the electrons' landing

energy, the atomic number of the specimen and the specimen's density. The energy

exchange between the electron beam and the sample results in the emission of

electrons and electromagnetic radiation, which can be detected to produce an

image.

The transmission electron microscopic pictures were recorded for some

of the glass ceramic samples using Tecnai T20 microscope (Fig. 2.5 (b)). The FEI

Tecnai TF20 is a 200kV FEG high resolution Transmission Electron Microscope

(TEM), suitable for cryo single particles and semi-thick frozen cells or sections

(up to 200 nm) electron microscopy and electron tomography. The microscope is

fitted with a W-source and an ultra high resolution pole piece with a point-point

resolution of 1.9 A. The TF20 is equipped with a Field Emission Gun (FEG) and

+/-80 degrees tilted computer controlled LiN cryostage. This microscope features

a TIETZ F415MP 4k x 4k multiport CCD camera with a 4-port readout and 15m

92

pixel size. Images could be recorded on plain film camera as well. In the main

body of the EM, the column, are located, from top to bottom, Field Emission Gun

(FEG), Condenser lenses and condenser apertures (C1 and C2), Objective lens,

Compustage, Objective aperture (OA), Selective aperture (SA), Projectors,

Viewing camera, Plain film camera and CCD camera. The High Voltage Tank

produces 80 – 200kV Accelerating voltage applied to the FEG and the Anode,

which produces a coherent beam of accelerated electrons. The condenser lenses

and apertures control spot size and beam size.

Fig. 2.5 (b) Tecnai T-20 High Resolution- Transmission Electron Microscope.

The objective lens focuses the beam transmitting the specimen, the objective

aperture selects the electrons close to optical axis improving image contrast and

projectors form the final magnification. The post magnification factor for the CCD

93

camera is 1.4. All the microscope functions, including CCD imaging, are provided

by the Main Computer supplied with dedicated FEI and TIETZ software

The scanning microscopic pictures of some of the crystallized samples are

shown in Fig. 2.6 (a), whereas in Fig. 2.6 (b) transmission electron microscopic

pictures are presented for some of the samples. The pictures clearly indicate that

well defined, randomly distributed crystals of different sizes (varying from 50 to

500 nm) are ingrained in glassy matrix. The residual glass phase is acting as

interconnecting zones among the crystallized areas, making the samples free of

voids and cracks. The pictures further indicate a gradual increase in the volume

fraction of crystallites in the samples with increasing concentration of TiO2. Thus,

from these pictures it can also be concluded that TiO2, enhanced the phase

separation tendency of various crystalline phases. The SEM or TEM pictures of

pre-heated samples exhibited virtually no crystallinity.

Fig. 2.6 (a) ZnF2–PbO–TeO2 glasses heat treated with different concentrations of TiO2.

TC2 TC5 TC7

TC10 TC15 Amorphous sample TA5

94

Fig. 2.6 (b) TEM pictures of ZnF2–PbO–TeO2: TiO2 glass ceramic samples

2.5 X-ray diffraction studies (XRD)

The crystalline nature of the heat treated samples was checked by X-ray

diffraction spectra recorded on Xpert PRO’panalytical X-ray diffractometer (Fig.

2.7 (a)) with CuKα radiation. Fig. 2.7 (b) represents the schematic diagram of

general X-ray diffractometer.

It may be noted here that the XRD pattern of pre-heated samples have not

exhibited any sharp peaks.

TC10

TC5

TC20

Pre Crystallized

95

X-ray diffraction patterns for the ZnF2–PbO–TeO2 glass ceramic doped with 1.0

wt% of TiO2 is shown in Fig. 2.8 (a).

Fig. 2.7 (a) Xpert PRO’panalytical X-ray diffractometer.

Fig. 2.7 (b) Schematic representation of X-ray diffractometer.

96

The patterns exhibited peaks due to variety of crystal phases; some of them are

Pb5Ti3F19, PbTiO3, PbTi2O6, PbTeO3, Pb3TeO5 and TiTe3O8; the details JCPDS

card numbers for these crystalline phases can be found in the ref. [6]. The XRD

patterns for all the crystallized glasses are shown in Fig. 2.8 (b).

Fig. 2.8 (a) XRD pattern of ZnF2–PbO–TeO2 glass ceramics doped with 1.0 wt % of TiO2 showing different possible crystalline phases. Most interestingly we have observed diffraction peak with significant intensity and

full width at half maximum due to Pb5Ti3F19 crystal phase at about 2θ = 25.00°,

27.84° and 29.65° due to reflections from (3 2 1), (4 1 1) and (2 2 2) crystal planes,

4

5 10 15 20 25 30 35 40 45 50 55

2θ (deg)

Inte

nsity

(rel

. uni

ts)

(1)

(1)

(1)

(2)

(2)

(3)

(3)

(3)

(4)(5)

(5)

(6)(6)

97

respectively. The presence of such phase clearly suggests that a fraction of the

titanium ions exists in Ti3+ valence state. However, as the concentration of TiO2

increased up to 1.0 wt% the intensity of these peaks is found to increase and

beyond this concentration a slight decreasing trend is observed.

Fig. 2.8 (b) XRD pattern of ZnF2–PbO–TeO2 glass ceramics doped with different concentrations of TiO2. For the sake of comparision, the XRD pattern of one of the pre-crystallized samples (TA5) is also included.

5 10 15 20 25 30 35 40 45 50 55

2θ (deg)

TA5

TC5

TC7

TC10

TC15

TC20

98

The structure composed of infinite chains of eclipsed corner-sharing TiF6

octahedra as well as individual octahedra. The arrangement consists of number of

octahedra, PbFn polyhedra and non-octahedral F- ions. A structural fragment of

Pb5Ti3F19 is illustrated in Fig.2.9.

Distortions from regularity in the independent TiF6 octahedral phase result

in the development of appreciable electric dipoles in these crystal phases that will

contributing to NLO effects which will be discussed in chapter 5. The gradual

increase in the intensity of the diffraction peaks due to these crystallites (especially

in the pattern of the samples containing TiO2 upto1.0 wt %) indicates larger

concentration of such crystal phases.

Fig. 2.9 An illustration of Pb5Ti3F19 structural fragment.

99

In fact ferroelectric behaviour of this type of crystals was reported earlier [7, 8].

Another interesting feature of XRD pattern is, presence of clear diffraction peaks

at 2θ = 22.77° and 31.97° corresponding to PbTiO3 orthorhombic crystal phases;

this observation points out that the titanium ions do exist in Ti4+ state and

participate as a network former in the glass network. Additionally, the intensity of

the diffraction peaks due to PbTiO3, PbTeO3 phases is also found to be maximal

for the samples crystallized with 1.0 wt % of TiO2 indicating the concentration of

such crystal phases is higher in this sample. The presence of PbTiO3 crystal phases

points out that the titanium ions also exist in Ti4+ state and participate as a network

former in the glass network. Additionally, it should be further emphasized that the

XRD patterns of pre-heated samples have exhibited virtually no sharp peaks (see

XRD pattern of the sample TC5, Fig. 2.8 (b)).

2.6 Differential scanning calorimetric (DSC) studies

Thermal analysis of the samples was carried out by Netzsch Simultaneous

DSC/TG Thermal Analyzer STA409C (Fig. 2.10(a)) with 32-bit controller to

determine the glass transition temperature and crystalline peaks. High temperature

furnace together with a sample carrier suitable for Cp measurements and Al2O3

crucibles were used. Apparatus was calibrated both for temperature and for

sensitivity with melting temperatures and melting enthalpies of the pure metals:

Ga, In, Sn, Zn, Al, Ag, Au. All the recordings were carried out in argon (of 5N

pure) atmosphere to prevent samples from oxidation. Heating rate was 10 �C/min

in the temperature range 303–1500 K.

100

The glass transition temperature and other glass forming ability parameters are

evaluated to an accuracy of ± 1 K. The schematic sketch of Netzsch Simultaneous

DSC/TG Thermal Analyzer STA409C is also presented in Fig. 2.10 (b).

In Figs. 2.11(a–e) differential scanning calorimetric (DSC) scans in the

temperature region 300-1500 K for ZnF2–PbO–TeO2 glasses crystallized with

different concentrations of TiO2 are presented, whereas in Fig. 2.12 the

comparison plot for all the samples is presented. For the crystallized glasses, a

weak endothermic effect (due to glass transition) in the temperature range 590 to

610 K is observed. At about 770 K, the DSC thermogram of each glass ceramic

sample exhibited well-defined exothermic effects with multiple steps of

Fig. 2.10 (b) The sketch of Netzsch Simultaneous DSC/TG Thermal Analyzer STA409C.

Fig. 2.10 (a) Netzsch Simultaneous DSC/TG Thermal Analyzer STA409C.

101

crystallization temperatures; the auxiliary peaks appear to be weak and spread

over a region of approximately 50 K. These results clearly support the view point

that the samples are composed of different crystalline phases. The enthalpy

associated with the primary crystallization peak with the concentration of

crystallizing agent appears to decrease with the concentration of crystallizing

agent TiO2. It may be noted here that no multiple steps of crystallization are

observed in the thermograms of pre-crystallized samples. To observe the mass

change effects during heating process, we have also recorded thermal gravimetric

traces for all the samples; in Fig. 2.11 (a–e), thermal gravimetric (TG) traces for

all the samples along with corresponding DSC traces are also shown. The analysis

exhibits virtually no change in the mass of the samples upto 1100 K.

102

(a)

(b)

(c)

103

Fig. 2.11 (a –e) DSC scans of ZnF2–PbO–TeO2 glasses crystallized with different concentrations of TiO2. In the DSC scan of sample TC10 the corresponding thermogram of pre-crystallized sample (TA10) is also presented. Multiple weak exothermic effects could clearly be observed in the thermograms of crystallized samples.

(d)

(e)

104

Fig. 2.12 Comparison plots of DSC traces of ZnF2–PbO–TeO2 glass ceramics doped with different concentrations of TiO2 (a) In the low temperature region, (b) In the high temperature region.

The appearance of different exothermic peaks in the DSC pattern obviously

suggests the presence of different phases of crystallization in the samples. The

crystallization in the glass samples may take place following the surface and

bulk nucleations. The general shape of the crystallization peak in DSC curves

reflects the variation of enthalpy. A decrease in the value of enthalpy

associated with the crystallization with increase in the concentration of

nucleating agent suggests that the crystallization starts initially from the

surface of the material and extended in to volume of the material. The

calorimetric exothermic effects (peaks) caused by crystallization have been

suppressed by mutual movement and revolution (aggregation) of metal–oxygen

octahedral (endothermic) in the plastic (flexible) phase, at temperature range

which appear in the same temperature as the crystallization; this affects

decrease of actual enthalpy of crystallization as observed. Thermal gravimetric

analysis confirms high stability and lacks of symptom of decomposition up to

1100 K of all the crystallized samples.

105

106

2.7 Conclusions

ZnF2–PbO–TeO2 glasses doped with different concentrations of TiO2

were prepared. Later they were crystallized by heat treating them at

crystallization temperature identified from DSC studies. The samples were

characterized by SEM, XRD and DSC techniques. The characterization of the

samples by SEM, XRD and DSC techniques have indicated that the samples

contain well defined and randomly distributed grains of different crystalline

phases viz., Pb5Ti3F19, PbTiO3

and PbTeO3. Interestingly the concentration of Pb5Ti3F19 tetragonal crystalline

phases in which the titanium ions exist as Ti3+ state is found to increase in the

glass ceramics with increase in the concentration of TiO2.

107

References [1] James E Shelby, Introduction to Science and Technology of Glass

Materials Royal Society of Chemistry, London 2005.

[2] W. Vogel, Glass Chemistry, Springer Verlag, Berlin 1994.

[3] S.R. Elliot, Physics of Amorphous Materials. Longman, Essex1990.

[4] M.J. Weber, R.A. Saroyan, R.C. Ropp, J. Non-Crst. Solids 4 (1981) 137.

[5] M.J. Weber, J. Chem. Phys. 48 (1968) 4774.

[6] Powder Diffraction File, Alphabetical Index, Inorganic Compounds, JCPDS, International Centre for Diffraction Data, Newtown Square, PA 19073, 2003.

[7] S.C. Abrahams, J. Ravez, H. Ritter and J. Ihringer, Acta Cryst. B59

(2003) 557. [8] V. Andriamampianina, P. Gravereau, J. Ravez, S.C. Abrahams, Acta

Cryst. B50 (1994) 135.


Recommended