Page 1
Sebastian Franz Höfler, BSc
Preparation and Characterization of
Integrated Organic Multi-Junction Solar Cell/
Lithium-Ion Battery Hybrid Devices
for Simultaneous Energy Conversion and Storage
MASTER THESIS
In partial fulfillment of the requirements for the academic degree
Diplom-Ingenieur
in the field of study of Technical Chemistry
submitted at
Graz University of Technology
Supervisors
Assoc.Prof. Dipl.-Ing. Dr.techn. Gregor Trimmel
Institute for Chemistry and Technology of Materials
Dr. Ilie Hanzu
Institute for Chemistry and Technology of Materials
Graz, September 2015
Page 2
AFFIDAVIT / EIDESSTATTLICHE ERKLÄRUNG
I declare that I have authored this thesis independently, that I have not used other than
the declared sources/resources, and that I have explicitly indicated all material which
has been quoted either literally or by content from the sources used. The text document
uploaded to TUGRAZonline is identical to the present master’s thesis.
Ich erkläre an Eides statt, dass ich die vorliegende Arbeit selbstständig verfasst, andere
als die angegebenen Quellen/Hilfsmittel nicht benutzt, und die den benutzten Quellen
wörtlich und inhaltlich entnommenen Stellen als solche kenntlich gemacht habe. Das in
TUGRAZonline hochgeladene Textdokument ist mit der vorliegenden Masterarbeit
identisch.
Page 4
IV
Abstract
A novel concept of an integrated solar battery hybrid device or power pack based on the
combination of an organic multi-junction solar cell and a low-voltage lithium-ion
battery for simultaneous energy conversion and storage is presented. The solar energy
conversion and the electrochemical energy storage system are connected in series in a
three-terminal assembly with two positive and a shared negative electrode. In order to
charge the lithium-ion battery upon illumination of the photovoltaic system, a voltage
exceeding 1.15 V needs to be supplied by the bulk-heterojunction tandem solar cell.
Tandem solar cells were prepared in normal device architecture consisting of a MoO3
hole-transport layer, a benzothiadiazole-based small band gap polymer with carbazole
moiety blended with a fullerene derivative as active layer in both sub-cells and Ti/Cu
top electrodes. Various intermediate layers based on the combination of metals (Al, Ag,
Au, Cu, Ti) and metal oxides (TiOx, ZnO, MoO3) with MoO3 serving as electron- and
hole-transport layer were investigated for enhanced photo-voltage generation. Lithium
titanate (Li4Ti5O12), cobalt diantimonide (CoSb2) and cobalt triantimonide (CoSb3) were
used as electro-active species for composite electrodes for the low-voltage lithium-ion
battery. The electrode materials were prepared and characterized in half- and full-cell
configuration via common electrochemical methods including cyclic voltammetry (CV),
galvanostatic cycling with potential limitation (GCPL), galvanostatic intermittent
titration technique (GITT), and potentio electrochemical impedance spectroscopy
(PEIS). Three different methods were presented to determine the chemical diffusion
coefficient of Li+ in Li4Ti5O12, CoSb2 and CoSb3 composite electrodes, which were
based on CV (Randles-Sevcik), PEIS (Warburg diffusion element) and GITT
(Weppner-Huggins) measurements.
Integrated power packs were assembled and sealed under argon atmosphere by applying
pressure on an O-ring via Plexiglas® plates to provide an air- and moisture-tight
packaging of the solar battery hybrid device. The power pack was characterized on the
basis of the performance of the solar cell via I-V measurements and of the lithium-ion
battery via galvanostatic cycling experiments. Because of assembling and packaging
problems and low voltages supplied by the photovoltaic system based on the impact of
the liquid electrolyte of the battery system, the lithium-ion battery could not be charged
upon illumination of the solar cell and no overall energy conversion and storage
efficiency could be determined.
Page 5
V
Kurzfassung
Integrierte Hybrid-Solarbatterien basieren auf der Umwandlung von Sonnenenergie in
elektrische Energie durch Solarzellen unter gleichzeitiger Speicherung der elektrischen
Energie in einer Batterie. Diese Arbeit behandelt ein neuartiges Konzept einer
kombinierten organischen Mehrfachsolarzelle und einer Lithium-Ionen-Batterie,
welches durch Serienschaltung in einem drei-terminalen, integrierten Aufbau mit zwei
positiven und einer geteilten negativen Elektrode erreicht werden soll.
Die Ladung der integrierten Lithium-Ionen-Batterie erfolgt dabei durch Belichtung der
Solarzelle. Um die benötigte Mindestspannung zum Laden der Batterie zu erreichen,
wurden Bulk-Heterojunction Tandem-Solarzellen in Normalaufbau gebaut. Diese
bestanden aus einer MoO3 Lochleitungsschicht, einem Benzothiadiazol-basierten
konjugierten Polymer mit Carbazol-Gruppe mit geringer Bandlücke kombiniert mit
Fulleren-Derivaten als Aktivschicht und Ti/Cu-Elektroden. Verschiedene Zwischen-
schichten basierend auf einer Kombination von Metallen (Al, Ag, Au, Cu, Ti) oder
Metalloxiden (TiOx, ZnO, MoO3) mit MoO3 als Elektronen- und Lochleitungsschicht
wurden hinsichtlich einer verbesserten Spannungserzeugung untersucht. Lithiumtitanat
(Li4Ti5O12), Cobaltdiantimonid (CoSb2) und Cobalttriantimonid (CoSb3) wurden als
elektro-aktive Spezies zur Herstellung von Kompositelektroden in Lithium-Ionen-
Batterien verwendet, welche unter Verwendung verschiedener elektrochemischer
Methoden wie Cyclovoltammetrie (CV), Konstantstromzyklisierung (GCPL),
galvanostatische Titrationsmethode (GITT) und potentiostatische elektrochemische
Impedanzspektroskopie (PEIS) charakterisiert wurden. Zudem wurde der chemische
Diffusionskoeffizient von Li+ in Li4Ti5O12, CoSb2 und CoSb3 Kompositelektroden
mittels CV (Randles-Sevcik), PEIS (Warburg Diffusions-Element) und GITT
(Weppner-Huggins) bestimmt.
Integrierte Hybrid-Solarbatterien wurden unter Argon-Atmosphäre assembliert und
durch einen mit Plexiglas®-Platten angepressten O-Ring abgedichtet. Strom-Spannungs-
Kennlinien- sowie GCPL-Messungen wurden zur Charakterisierung der Solarzelle bzw.
der Lithium-Ionen-Batterie durchgeführt. Probleme bei der Assemblierung sowie
niedrige Spannungen der Solarzelle aufgrund des Einflusses des Elektrolyten der
Batterie führten dazu, dass die integrierte Lithium-Ionen-Batterie durch Belichtung der
Tandem-Solarzelle nicht geladen und dahingehend auch keine Energie-Umwandlungs-
und Speichereffizienz ermittelt werden konnte.
Page 6
VI
Acknowledgments
First of all, I want to express my gratitude to both of my supervisors Assoc.Prof.
Dipl.-Ing. Dr.techn. Gregor Trimmel and Dr. Ilie Hanzu for giving me the opportunity
to work on this very interesting field of integrated solar battery hybrid devices and of
course for their pleasant permanent support during my master thesis.
Furthermore, I want to thank my colleagues in the working group for inspiring
discussions, useful comments and remarks, and all people employed at the Institute for
Chemistry and Technology of Materials (ICTM) of Graz University of Technology for
the friendly and enjoyable atmosphere. I also want to thank my friends and all people I
met during my studies for their support and motivation throughout writing this thesis.
My deepest gratitude is dedicated to my family, especially my parents and my brother,
for supporting me from the very beginning and during my studies.
Page 7
VII
List of Abbreviations
[60]PCBM [6,6]-phenyl-C61-butyric acid methyl ester
[70]PCBM [6,6]-phenyl-C71-butyric acid methyl ester
α transfer coefficient
a exponent of the constant phase element
A surface area of the electrode [cm²]
AC alternating current
ACC acceptor
AM air mass
BET Brunauer-Emmett-Teller
BHJ bulk-heterojunction
C concentration of inserted species [mol cm-3
]
or concentration of active centers [mol cm-³]
CB chlorobenzene
CE counter electrode
CIGS copper indium gallium diselenide
CIS copper indium diselenide
CPE constant phase element
CV cyclic voltammetry
D chemical diffusion coefficient [cm² s-1
]
DC direct current
DCB 1,2-dichlorobenzene
DLS dynamic light scattering
DMC dimethyl carbonate
DON donor
DSSC dye-sensitized solar cell
E0’ formal potential of a redox couple [V]
EC ethylene carbonate
ECE potential at the counter electrode [V]
Eg band gap [eV]
EHOMO energy level of the highest occupied molecular orbital [eV]
Page 8
VIII
ELUMO energy level of the lowest unoccupied molecular orbital [eV]
EMC ethylmethyl carbonate
ΔEp peak separation [V]
Ep,a anodic potential peak [V]
Ep,c cathodic potential peak [V]
EQE external quantum efficiency [%]
ΔEs change of the steady-state voltage during the current pulse [V]
ΔEt total transient change of the cell voltage during the current pulse [V]
ETL electron-transport layer
EWE potential at the working electrode [V]
F Faraday constant [As mol-1
]
F8T2 poly[(9,9-dioctylfluorenyl-2,7-diyl)-co-bithiophene]
FF fill factor [%]
GCPL galvanostatic cycling with potential limitation
GITT galvanostatic intermittent titration technique
HOMO highest occupied molecular orbital
HTL hole-transport layer
I current [A]
ICBA indene-C60 bisadduct
IEA International Energy Agency
ip peak current [A]
ip,a anodic peak current [A]
ip,c cathodic peak current [A]
ip,max maximal peak current [A]
IPCE incident photon-to-current efficiency
ITO indium tin oxide
j imaginary number
J current density [mA cm-²]
Jsc short-circuit current density [mA cm-²]
LTO lithium titanate
LUMO lowest unoccupied molecular orbital
mi mass of active material of component i in the electrode [g]
Mi molecular weight of component i [g mol-1
]
ν scan rate [V s-1
]
Page 9
IX
n number of exchanged electrons
na number of exchanged electrons
NMP 1-methyl-2-pyrrolidone
OCV open circuit voltage [V]
OSC organic solar cell
PCDTBT poly[N-9´-heptadecanyl-2,7-carbazole-alt-5,5-(4´,7´-di-2-thienyl-
2´,1´,3´-benzothiadiazole)]
PCE power conversion efficiency [%]
PCPDTBT poly[2,6-(4,4-bis(2-ethylhexyl)-4H-cyclopenta[2,1-b;3,4-
b′]dithiophene)-alt-4,7(2,1,3-benzothiadiazole)]
PEDOT:PSS poly(3,4-ethylenedioxythiophene) polystyrene sulfonate
PEIS potentio electrochemical impedance spectroscopy
PSiF-DBT poly[2,1,3-benzothiadiazole-4,7-diyl-2,5-thiophenediyl(9,9-dioctyl-9H-
9-silafluorene-2,7-diyl)-2,5-thiophenediyl]
PV photovoltaic
PVD physical vapor deposition
R ideal gas constant [J mol-1
K-1
]
Rct charge transfer resistance [Ω]
Re resistance of the electrolyte [Ω]
RE reference electrode
Ri dynamic resistance [Ω]
Rs series resistance [Ω cm²]
Rsh shunt resistance, parallel resistance [kΩ cm²]
S electrode surface area [cm²]
sccm standard cubic centimeters per minute
SEM scanning electron microscopy
τ period of the galvanostatic current pulse [s]
T absolute temperature [K]
TW modulus of the Warburg element [Ω s-1/2
]
V voltage [V]
VM molar volume [cm³ mol-1
]
Vmpp voltage at the maximum power point [V]
VOC open circuit voltage [V]
ω angular frequency [rad/s]
Page 10
X
W Warburg element
WE working electrode
XRD X-ray diffraction
Z impedance
ZW Warburg diffusion element
ZW (ω) Warburg diffusion element as function of frequency
Page 11
XI
Table of Contents
1 Introduction ............................................................................................................. 1
1.1 Aims of this Thesis............................................................................................. 4
1.2 Photovoltaics ...................................................................................................... 6
1.2.1 Organic Solar Cells ..................................................................................... 6
1.3 Lithium-Ion Battery ......................................................................................... 11
2 Results and Discussion.......................................................................................... 14
2.1 Bulk-Heterojunction Solar Cells ...................................................................... 14
2.1.1 Single-Junction Solar Cells ....................................................................... 14
2.1.2 Multi-Junction Solar Cells ........................................................................ 25
2.1.3 Multi-Junction Solar Cells for Solar Battery Hybrid Devices .................. 42
2.1.4 Characterization ........................................................................................ 43
2.2 Lithium-Ion Battery Electrode Materials ......................................................... 46
2.2.1 Lithium Titanate (Li4Ti5O12, LTO) ........................................................... 46
2.2.2 Cobalt Diantimonide (CoSb2) and Cobalt Triantimonide (CoSb3) ........... 55
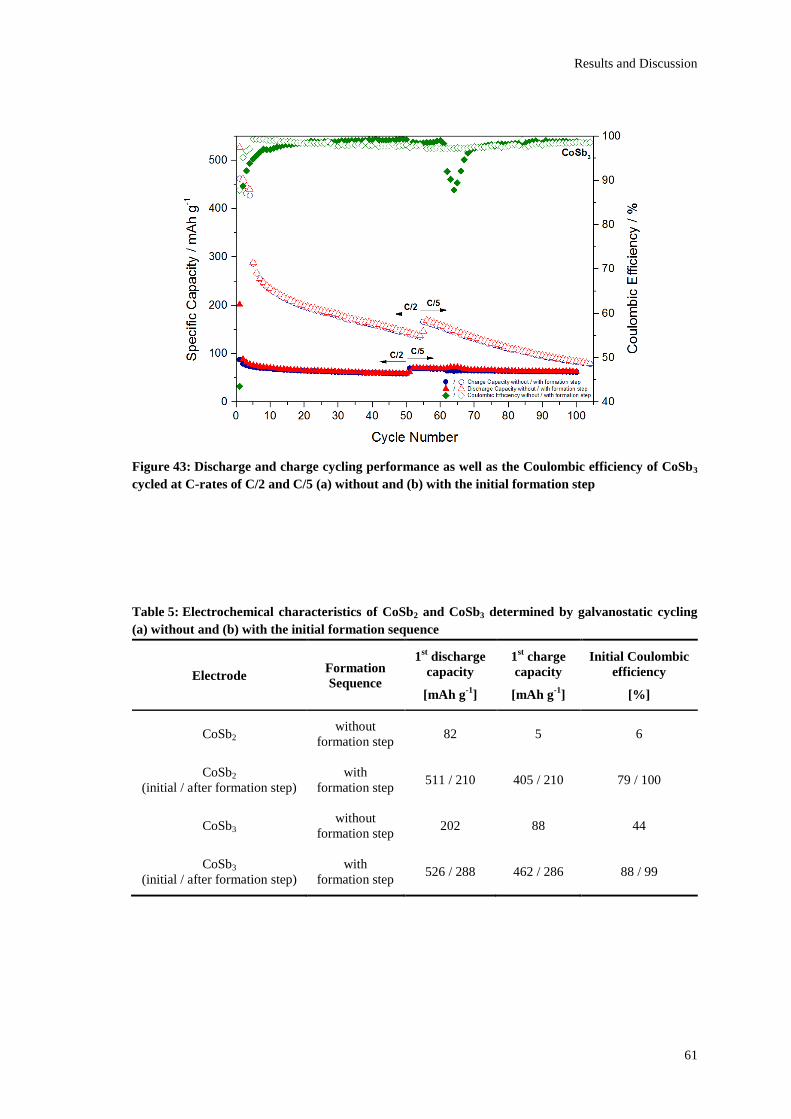
2.2.3 Characterization of Electrode Materials in Full-Cell Configuration ........ 66
2.2.4 Electrode Materials for Solar Battery Hybrid Devices ............................. 76
2.3 Solar Battery Hybrid Devices .......................................................................... 79
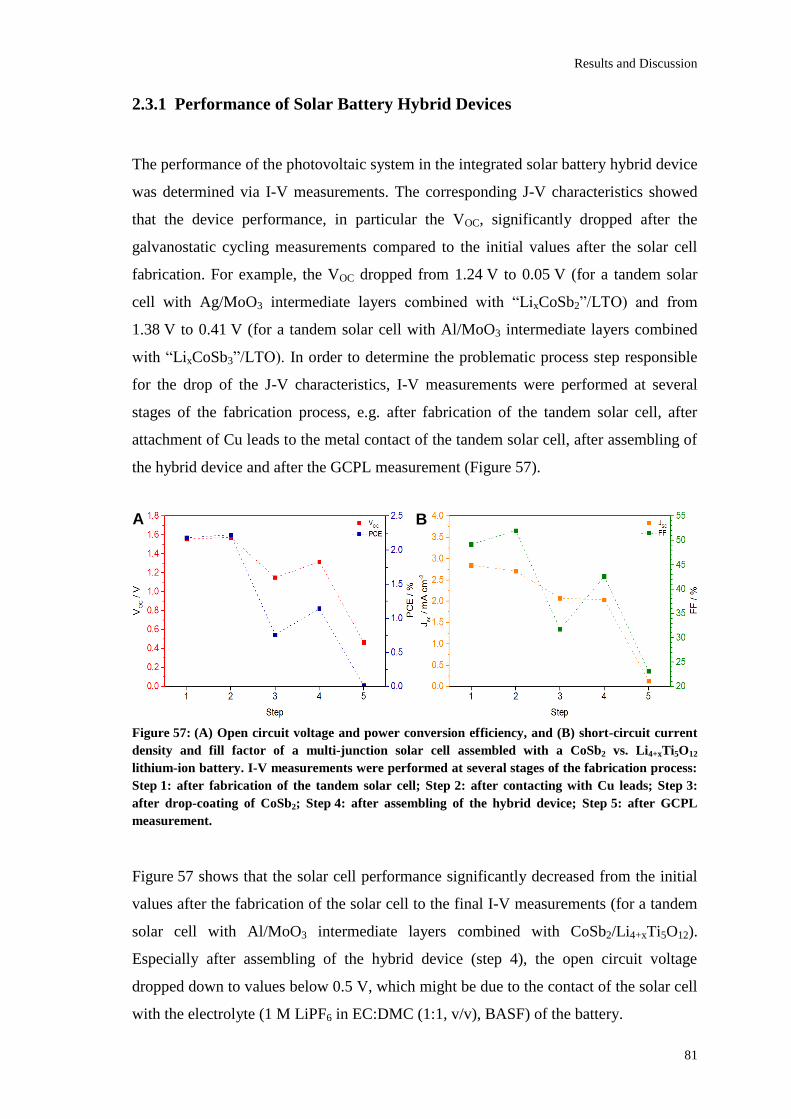
2.3.1 Performance of Solar Battery Hybrid Devices ......................................... 81
3 Experimental ......................................................................................................... 85
3.1 Chemicals and Materials .................................................................................. 85
3.2 Bulk-Heterojunction Solar Cells ...................................................................... 88
3.2.1 General Procedure for Preparation of Bulk-Heterojunction Solar Cells .. 88
3.2.2 Characterization ........................................................................................ 90
Page 12
XII
3.3 Lithium-Ion Battery Electrode Materials ......................................................... 92
3.3.1 Lithium Titanate (Li4Ti5O12, LTO) ........................................................... 92
3.3.2 Cobalt Diantimonide (CoSb2) and Cobalt Triantimonide (CoSb3) ........... 93
3.3.3 Characterization of Electro-Active Materials ........................................... 94
3.3.4 Characterization of Electrode Materials in Half-Cell Configuration ........ 95
3.3.5 Characterization of Electrode Materials in Full-Cell Configuration ........ 96
3.3.6 Electrode Materials for Solar Battery Hybrid Devices ............................. 97
3.4 Solar Battery Hybrid Devices .......................................................................... 98
3.4.1 Preparation of Materials for Solar Battery Hybrid Devices ..................... 98
3.4.2 Assembling of Solar Battery Hybrid Devices ........................................... 99
3.4.3 Characterization ...................................................................................... 100
4 Summary and Outlook ....................................................................................... 101
5 References ............................................................................................................ 106
Page 13
Introduction
1
1 Introduction
Fossil fuels such as coal, oil and natural gas are the major global energy sources
covering about 80% of the world total primary energy supply (Figure 1).[1]
The
accelerated use of fossil reserves, however, contributes to the global climate change
and, since fossil fuels are exhaustible resources, might culminate in a future energy
crisis, unless progress in alternative energy sources is made.[2–4]
Renewable energy
technologies such as wind power, hydropower, solar energy, geothermal energy, and
bio energy represent a credible solution addressing these major concerns. The share of
renewables in the global total primary energy supply of 13.5% (2012) is marginal
compared to fossil fuels but is expected to increase to 15-26% by 2035 according to
various scenarios and projections presented in the World Energy Outlook of the
International Energy Agency (IEA).[5]
Among these renewable energy technologies,
solar energy is the most promising candidate providing an enormous potential to meet
the global energy demand and to tackle the energy crisis. To illustrate this, given a
world total energy consumption of about 376 EJ in 2012[1]
, solar energy with an annual
potential of 1,575-49,387 EJ would fully cover the world’s primary energy demand in
2012.[6]
Figure 1: Fuels shares of world total primary energy supply in 2012 (data taken from [1])
Page 14
Introduction
2
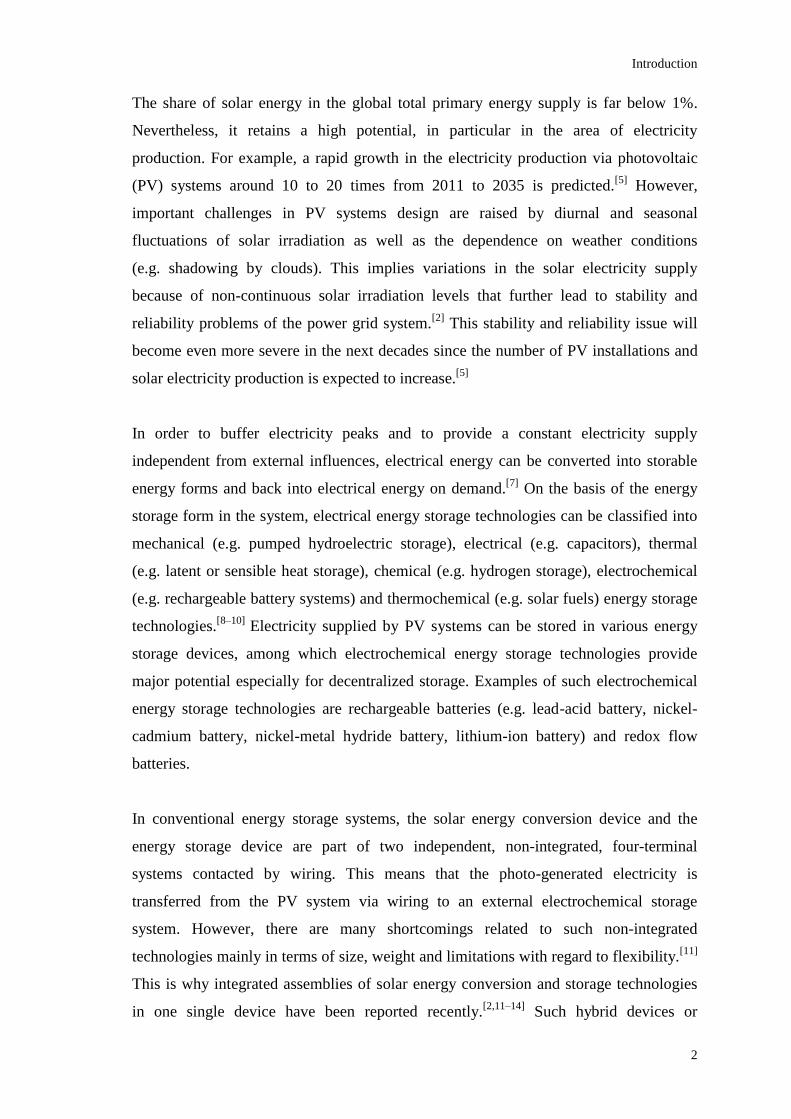
The share of solar energy in the global total primary energy supply is far below 1%.
Nevertheless, it retains a high potential, in particular in the area of electricity
production. For example, a rapid growth in the electricity production via photovoltaic
(PV) systems around 10 to 20 times from 2011 to 2035 is predicted.[5]
However,
important challenges in PV systems design are raised by diurnal and seasonal
fluctuations of solar irradiation as well as the dependence on weather conditions
(e.g. shadowing by clouds). This implies variations in the solar electricity supply
because of non-continuous solar irradiation levels that further lead to stability and
reliability problems of the power grid system.[2]
This stability and reliability issue will
become even more severe in the next decades since the number of PV installations and
solar electricity production is expected to increase.[5]
In order to buffer electricity peaks and to provide a constant electricity supply
independent from external influences, electrical energy can be converted into storable
energy forms and back into electrical energy on demand.[7]
On the basis of the energy
storage form in the system, electrical energy storage technologies can be classified into
mechanical (e.g. pumped hydroelectric storage), electrical (e.g. capacitors), thermal
(e.g. latent or sensible heat storage), chemical (e.g. hydrogen storage), electrochemical
(e.g. rechargeable battery systems) and thermochemical (e.g. solar fuels) energy storage
technologies.[8–10]
Electricity supplied by PV systems can be stored in various energy
storage devices, among which electrochemical energy storage technologies provide
major potential especially for decentralized storage. Examples of such electrochemical
energy storage technologies are rechargeable batteries (e.g. lead-acid battery, nickel-
cadmium battery, nickel-metal hydride battery, lithium-ion battery) and redox flow
batteries.
In conventional energy storage systems, the solar energy conversion device and the
energy storage device are part of two independent, non-integrated, four-terminal
systems contacted by wiring. This means that the photo-generated electricity is
transferred from the PV system via wiring to an external electrochemical storage
system. However, there are many shortcomings related to such non-integrated
technologies mainly in terms of size, weight and limitations with regard to flexibility.[11]
This is why integrated assemblies of solar energy conversion and storage technologies
in one single device have been reported recently.[2,11–14]
Such hybrid devices or
Page 15
Introduction
3
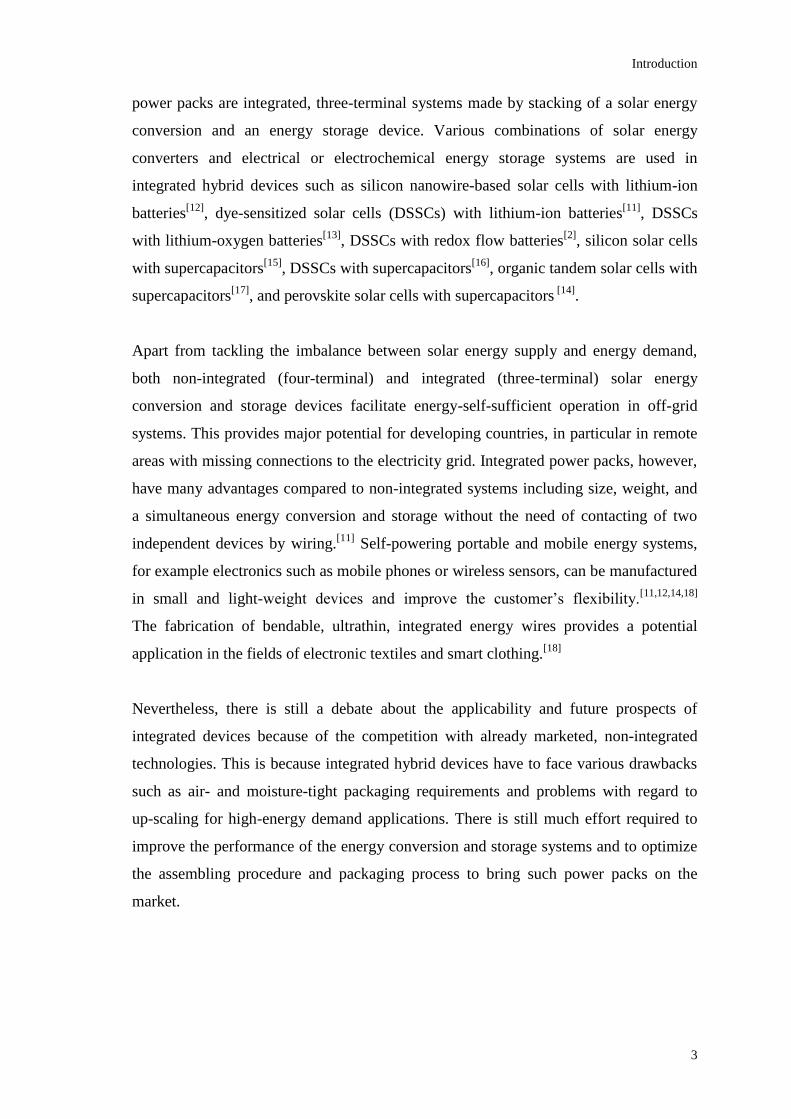
power packs are integrated, three-terminal systems made by stacking of a solar energy
conversion and an energy storage device. Various combinations of solar energy
converters and electrical or electrochemical energy storage systems are used in
integrated hybrid devices such as silicon nanowire-based solar cells with lithium-ion
batteries[12]
, dye-sensitized solar cells (DSSCs) with lithium-ion batteries[11]
, DSSCs
with lithium-oxygen batteries[13]
, DSSCs with redox flow batteries[2]
, silicon solar cells
with supercapacitors[15]
, DSSCs with supercapacitors[16]
, organic tandem solar cells with
supercapacitors[17]
, and perovskite solar cells with supercapacitors [14]
.
Apart from tackling the imbalance between solar energy supply and energy demand,
both non-integrated (four-terminal) and integrated (three-terminal) solar energy
conversion and storage devices facilitate energy-self-sufficient operation in off-grid
systems. This provides major potential for developing countries, in particular in remote
areas with missing connections to the electricity grid. Integrated power packs, however,
have many advantages compared to non-integrated systems including size, weight, and
a simultaneous energy conversion and storage without the need of contacting of two
independent devices by wiring.[11]
Self-powering portable and mobile energy systems,
for example electronics such as mobile phones or wireless sensors, can be manufactured
in small and light-weight devices and improve the customer’s flexibility.[11,12,14,18]
The fabrication of bendable, ultrathin, integrated energy wires provides a potential
application in the fields of electronic textiles and smart clothing.[18]
Nevertheless, there is still a debate about the applicability and future prospects of
integrated devices because of the competition with already marketed, non-integrated
technologies. This is because integrated hybrid devices have to face various drawbacks
such as air- and moisture-tight packaging requirements and problems with regard to
up-scaling for high-energy demand applications. There is still much effort required to
improve the performance of the energy conversion and storage systems and to optimize
the assembling procedure and packaging process to bring such power packs on the
market.
Page 16
Introduction
4
1.1 Aims of this Thesis
In this work, a novel concept of an integrated solar battery hybrid device based on the
combination of an organic multi-junction solar cell and a lithium-ion battery is
presented. This power pack consists of an organic tandem solar cell in normal device
architecture stacked in series with a low-voltage lithium-ion battery to obtain a three-
terminal assembly (Figure 2).
Figure 2: General design (without packaging) and schematic representation of the working
mechanism of the integrated solar battery hybrid device under illumination/charge and in
dark/discharge: (1) glass, (2) ITO, (3) multi-junction solar cell, (4) copper current collector,
(5) CoSby (y = 2,3), negative electrode, (6) separator + electrolyte, (7) Li4Ti5O12, positive electrode
The working mechanism (Figure 2) of this integrated power pack is based on a
combined light-to-electricity conversion and storage process. In principle, the battery is
charged upon illumination of the solar cell and discharged under dark conditions. In
order to charge the battery, an over-voltage has to be applied, which should be
accomplished by the voltage provided by the organic multi-junction solar cell. Upon
illumination of the solar cell, excitons are created within the photo-active layer, which
are separated at the donor/acceptor interface by applying an electric field. The generated
holes and electrons are transported to the positive electrode and negative electrode of
the solar cell, respectively. The over-voltage provided by the organic multi-junction
solar cell forces electrons from the lithium ion battery to move via the external circuit to
the indium tin oxide (ITO) electrode of the solar cell, concomitant with the movement
of Li ions via the electrolyte and separator to the negative electrode (charging). Under
dark conditions, the battery is discharged on the external load and Li ions move from
the negative to the positive electrode via the electrolyte and separator, whereas electrons
move via the external circuit to the positive electrode. In dark, the photovoltaic cell
behaves like a diode biased in the blocking direction.
Page 17
Introduction
5
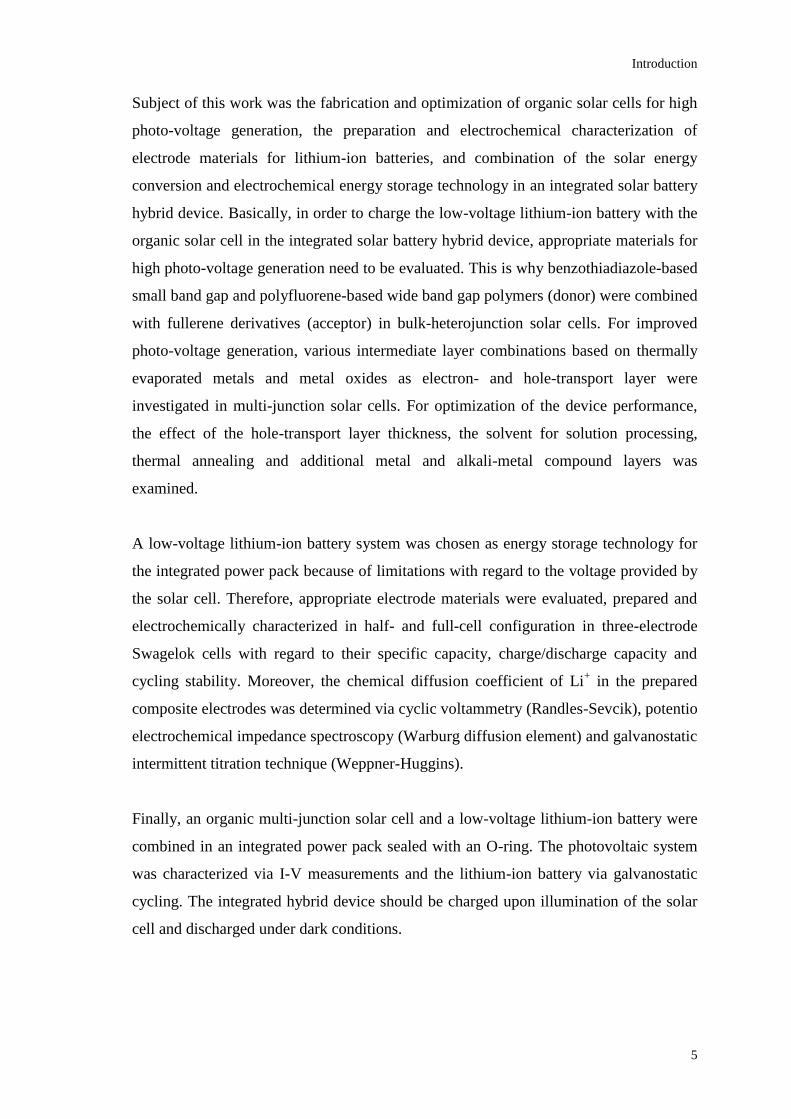
Subject of this work was the fabrication and optimization of organic solar cells for high
photo-voltage generation, the preparation and electrochemical characterization of
electrode materials for lithium-ion batteries, and combination of the solar energy
conversion and electrochemical energy storage technology in an integrated solar battery
hybrid device. Basically, in order to charge the low-voltage lithium-ion battery with the
organic solar cell in the integrated solar battery hybrid device, appropriate materials for
high photo-voltage generation need to be evaluated. This is why benzothiadiazole-based
small band gap and polyfluorene-based wide band gap polymers (donor) were combined
with fullerene derivatives (acceptor) in bulk-heterojunction solar cells. For improved
photo-voltage generation, various intermediate layer combinations based on thermally
evaporated metals and metal oxides as electron- and hole-transport layer were
investigated in multi-junction solar cells. For optimization of the device performance,
the effect of the hole-transport layer thickness, the solvent for solution processing,
thermal annealing and additional metal and alkali-metal compound layers was
examined.
A low-voltage lithium-ion battery system was chosen as energy storage technology for
the integrated power pack because of limitations with regard to the voltage provided by
the solar cell. Therefore, appropriate electrode materials were evaluated, prepared and
electrochemically characterized in half- and full-cell configuration in three-electrode
Swagelok cells with regard to their specific capacity, charge/discharge capacity and
cycling stability. Moreover, the chemical diffusion coefficient of Li+ in the prepared
composite electrodes was determined via cyclic voltammetry (Randles-Sevcik), potentio
electrochemical impedance spectroscopy (Warburg diffusion element) and galvanostatic
intermittent titration technique (Weppner-Huggins).
Finally, an organic multi-junction solar cell and a low-voltage lithium-ion battery were
combined in an integrated power pack sealed with an O-ring. The photovoltaic system
was characterized via I-V measurements and the lithium-ion battery via galvanostatic
cycling. The integrated hybrid device should be charged upon illumination of the solar
cell and discharged under dark conditions.
Page 18
Introduction
6
1.2 Photovoltaics
Solar cells are photovoltaic systems for conversion of solar energy to electrical energy.
Depending on the materials used, three different generations of solar cells are
distinguished. First generation solar cells are based on mono- or polycrystalline silicon
and are the most common photovoltaic technology.[19]
Second generation solar cells
such as thin-film solar cells provide major potential for reduction of fabrication costs
and use materials like cadmium telluride (CdTe), copper indium diselenide (CIS),
copper indium gallium diselenide (CIGS), gallium arsenide (GaAs) or amorphous
silicon (a-Si).[20,21]
Emerging technologies for future solar electricity supply are based
on dye-sensitized solar cells, organic solar cells, hybrid polymer solar cells and
perovskite solar cells (third generation solar cells).[22]
1.2.1 Organic Solar Cells
Organic solar cells (OSCs) are based on organic semiconductors which enable the
conversion of solar energy to electrical energy.[4,23]
Materials for OSCs include organic,
conjugated polymers with a delocalized π electron system (e.g. polythiophenes) and
organic small molecules (e.g. phthalocyanines).[23]
Considering polymer-based OSCs,
the conjugated polymer (donor) is combined with various acceptor materials such as
fullerenes (e.g. C60), fullerene derivatives (e.g. [60]PCBM, [70]PCBM), electron-
accepting polymers (e.g. cyano-substituted conjugated polymers), or organic small
molecules (e.g. perylenes).[23–26]
Donor and acceptor materials constitute the photo-
active layer of solar cells forming either a separated layer structure (bilayer-
heterojunction) or a nanoscale interpenetrating network of donor and acceptor domains
(bulk-heterojunction, BHJ), shown in Figure 3.
Figure 3: Bilayer-heterojunction and bulk-heterojunction solar cells
Page 19
Introduction
7
BHJ-type OSCs consist of a photo-active layer of donor and acceptor embedded
between two electrodes (Figure 4). Interfacial layers between the photo-active layer and
the electrodes alleviate charge transfer processes of electrons and holes to the respective
electrodes and minimize leakage currents. Holes are transported via a hole-transport
layer (HTL) to the anode, whereas electrons are transported via an electron-transport
layer (ETL) to the cathode. OSCs are generally fabricated in two different
configurations, namely normal and inverted device architecture, which differ in the
materials used for the top electrodes. These are made of low work function metals
(e.g. aluminum) in normal device architecture (cathode) and of high work function
metals (e.g. silver, gold) in inverted device architecture (anode).[27]
A typical substrate
material is glass, which is usually coated with a transparent conductive oxide
(e.g. indium tin oxide, ITO) serving as electrode. Common materials for HTLs and
ETLs are poly(3,4-ethylenedioxythiophene) polystyrene sulfonate (PEDOT:PSS) and
TiOx, respectively.[27]
Figure 4: Bulk-heterojunction solar cells in normal and inverted device architecture
The conversion process of light energy into electrical energy in OSCs is based on a
series of various physical processes (Figure 5).[23,28]
Upon illumination of solar cells,
photons with an energy exceeding the band gap of the donor or the acceptor are
absorbed by the photo-active material within the active layer (1). The photon absorption
initiates the excitation of an electron from the highest occupied molecular orbital
(HOMO) to the lowest unoccupied molecular orbital (LUMO) and thus the formation of
a coulombically bound electron-hole pair, called exciton.[23]
In case of photo-excitation
and exciton generation in the donor material, the exciton diffuses within the donor
phase until it reaches the acceptor phase or decays via radiative or non-radiative paths
depending on the diffusion length and the lifetime of the created electron-hole
pair (2).[23,28]
If the exciton reaches the acceptor within its lifetime and diffusion length
Page 20
Introduction
8
(ns- and nm-regime)[29]
, the electron is transferred to the acceptor phase forming a
metastable charge-transfer electron-hole pair across the donor/acceptor interface.[28,30]
An electric field is required for charge separation based on the dissociation of the
exciton into a photo-generated electron and hole (3).[28]
The free charge carriers migrate
to the respective electrodes based on the internal electric field provided by electrodes
with different work functions (4).[28,31]
Electrons are transported via percolated acceptor
paths to the cathode and holes via donor domains to the anode, followed by extraction
of the free charge carriers at the electrodes (5).
Figure 5: Fundamental physical processes for photo-current generation upon illumination of
bulk-heterojunction organic solar cells in normal device architecture based on the photo-excitation
of the donor material: (1) photon absorption, (2) exciton diffusion, (3) exciton dissociation, (4) free
carrier migration, (5) carrier extraction[28]
(DON = donor, ACC = acceptor)
The maximal theoretical conversion efficiency of single-junction solar cells with an
energy band gap of 1.1 eV is limited by 30% under non-concentrated, illuminated
conditions derived from W. Shockley and H. J. Queisser.[32]
This is based on two major
phenomena (Figure 6):
Only photons with an energy exceeding the band gap of the photo-active
materials are absorbed and contribute to the conversion efficiency but photons
with lower energy cannot generate excited states and thus lead to sub-band gap
transmission losses.[4,25,33]
Photons with an energy exceeding the band gap create hot charge carriers, which
relax down to the LUMO level of the donor material and thus, the excess photon
energy is lost by thermalization of hot charge carriers.[4,30]
Page 21
Introduction
9
Figure 6: Sub-band gap transmission and thermalization losses in organic solar cells[4]
The Shockley-Queisser limit of single-junction solar cells can be exceeded by solar cells
in tandem or multi-junction configuration. Tandem and multi-junction solar cells consist
of two or further stacked solar cells connected in series (two-terminal) or parallel
(three-terminal).[34]
According to De Vos, the theoretical conversion efficiency of
tandem solar cells with energy band gaps of 1.9 eV and 1.1 eV can be increased to
42.3%.[35]
Stacking of sub-cells with complementary absorption behavior, for example
of solar cells with wide and small band gap polymers, enables to cover the solar
emission spectrum more efficiently in order to enhance light harvesting and photo-
current generation (Figure 7). Photons with higher energy are absorbed by the wide
band gap sub-cell and photons with lower energy by the small band gap sub-cell,
yielding enhanced solar-to-electricity conversion efficiencies. However, the maximum
photo-current generation of multi-junction solar cells is limited by the smallest short-
circuit current density (JSC) of a sub-cell (Kirchhoff’s law).[34]
Sub-cells of multi-junction solar cells are connected via intermediate or recombination
layers, which ensure the recombination of charge carriers. In case of normal tandem
device architecture, electrons from the front cell are injected via the electron-transport
layer and holes coming from the back cell are injected via the hole-transport layer
(Figure 7).[4]
Using the multi-junction approach higher photo-voltages can be generated
compared to single-junction solar cells. The open circuit voltage (VOC) of a multi-
junction solar cell equals the sum of the VOCs of each contributing sub-cell
(Kirchhoff’s law), which is only valid for ideal, fully-transparent intermediate layers
enabling loss-free charge recombination.[34]
Page 22
Introduction
10
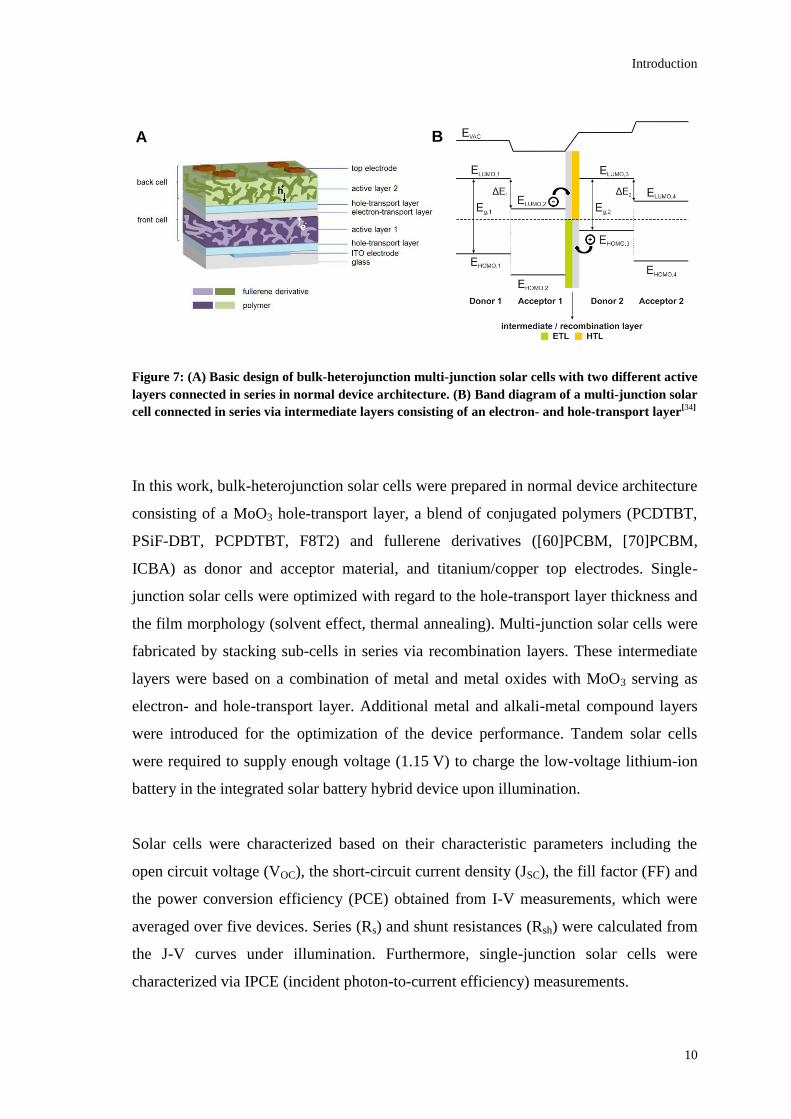
Figure 7: (A) Basic design of bulk-heterojunction multi-junction solar cells with two different active
layers connected in series in normal device architecture. (B) Band diagram of a multi-junction solar
cell connected in series via intermediate layers consisting of an electron- and hole-transport layer[34]
In this work, bulk-heterojunction solar cells were prepared in normal device architecture
consisting of a MoO3 hole-transport layer, a blend of conjugated polymers (PCDTBT,
PSiF-DBT, PCPDTBT, F8T2) and fullerene derivatives ([60]PCBM, [70]PCBM,
ICBA) as donor and acceptor material, and titanium/copper top electrodes. Single-
junction solar cells were optimized with regard to the hole-transport layer thickness and
the film morphology (solvent effect, thermal annealing). Multi-junction solar cells were
fabricated by stacking sub-cells in series via recombination layers. These intermediate
layers were based on a combination of metal and metal oxides with MoO3 serving as
electron- and hole-transport layer. Additional metal and alkali-metal compound layers
were introduced for the optimization of the device performance. Tandem solar cells
were required to supply enough voltage (1.15 V) to charge the low-voltage lithium-ion
battery in the integrated solar battery hybrid device upon illumination.
Solar cells were characterized based on their characteristic parameters including the
open circuit voltage (VOC), the short-circuit current density (JSC), the fill factor (FF) and
the power conversion efficiency (PCE) obtained from I-V measurements, which were
averaged over five devices. Series (Rs) and shunt resistances (Rsh) were calculated from
the J-V curves under illumination. Furthermore, single-junction solar cells were
characterized via IPCE (incident photon-to-current efficiency) measurements.
A B
Page 23
Introduction
11
1.3 Lithium-Ion Battery
Lithium-ion batteries are secondary, rechargeable batteries used for electrochemical
energy storage and conversion. Reversible charging and discharging processes enable
an effective conversion of electrical energy into chemical energy upon charging and
vice versa upon discharging.
A classical lithium-ion battery consists of a positive and a negative electrode separated
by an electrolyte-soaked separator. Positive electrodes are typically made of inorganic
transition metal oxides (e.g. V2O5[36]
, MnO2[36]
) and chalcogenides (e.g. TiS2[37]
).[38]
Moreover, organic molecules and polymers have been used as cathode materials in
rechargeable batteries.[38]
Positive electrode materials can be further classified into
lamellar compounds (e.g. LiCoO2, LiNi1/3Mn1/3Co1/3O2), spinel compounds
(e.g. LiMn2O4) and olivine group compounds (e.g. LiFePO4).[39]
Negative electrodes are
typically made of insertion materials based on carbons (e.g. graphite[40]
), transition
metal oxides (e.g. TiO2[41]
) and chalcogenides (e.g. MoS2[42]
), and lithium alloys
(e.g. Li-Al alloys[43]
, Li-Sn alloys[44]
), among which graphite is the most important one
and the system with the widest commercial use.[38]
Separators are able to retain the
liquid lithium electrolyte in a percolating network of cavities and are placed between the
positive and negative electrode to avoid direct contact and short circuits. Typical
separator materials for lithium-ion batteries are polymer-based microporous materials
such as polyolefins.[45]
Liquid electrolytes in lithium-ion batteries provide conductive
paths for alkali metal ion transport processes upon repeated charge-discharge processes.
Electrolytes consist of lithium salts (e.g. LiPF6, LiBF4, LiClO4) dissolved in organic
alkyl carbonate solvents such as ethylene carbonate (EC), dimethyl carbonate (DMC)
and ethylmethyl carbonate (EMC).[46,47]
During charging, a voltage is applied by an external power source to force electrons to
move from the positive to the negative electrode via the external electric circuit,
concomitant with the Li ion movement from the positive to the negative electrode via
the electrolyte. During discharge, Li ions migrate in the reverse direction, concomitantly
with the transport of electrons via the external electric circuit in the same direction.
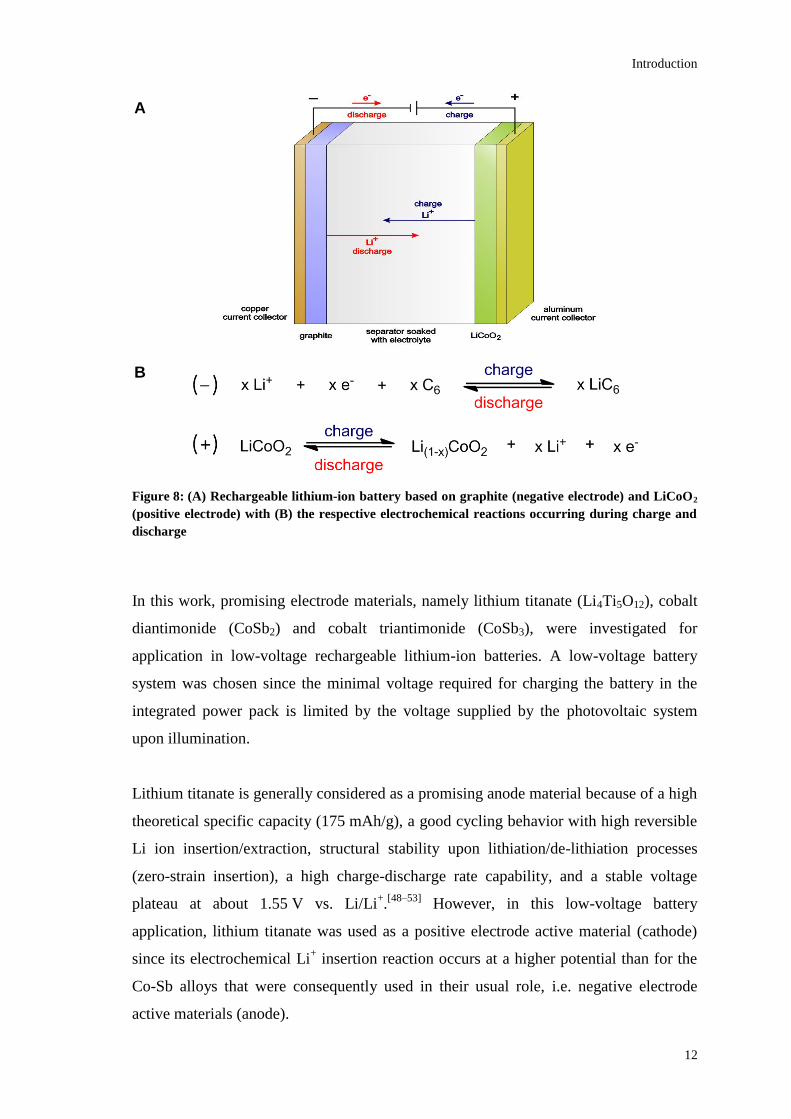
Figure 8 shows the basic principle of charge-discharge reactions in lithium-ion batteries
using the example of a graphite/LiCoO2 battery system.
Page 24
Introduction
12
Figure 8: (A) Rechargeable lithium-ion battery based on graphite (negative electrode) and LiCoO2
(positive electrode) with (B) the respective electrochemical reactions occurring during charge and
discharge
In this work, promising electrode materials, namely lithium titanate (Li4Ti5O12), cobalt
diantimonide (CoSb2) and cobalt triantimonide (CoSb3), were investigated for
application in low-voltage rechargeable lithium-ion batteries. A low-voltage battery
system was chosen since the minimal voltage required for charging the battery in the
integrated power pack is limited by the voltage supplied by the photovoltaic system
upon illumination.
Lithium titanate is generally considered as a promising anode material because of a high
theoretical specific capacity (175 mAh/g), a good cycling behavior with high reversible
Li ion insertion/extraction, structural stability upon lithiation/de-lithiation processes
(zero-strain insertion), a high charge-discharge rate capability, and a stable voltage
plateau at about 1.55 V vs. Li/Li+.[48–53]
However, in this low-voltage battery
application, lithium titanate was used as a positive electrode active material (cathode)
since its electrochemical Li+ insertion reaction occurs at a higher potential than for the
Co-Sb alloys that were consequently used in their usual role, i.e. negative electrode
active materials (anode).
A
B
Page 25
Introduction
13
Co-Sb intermetallic compounds are potential alternative anode materials for
rechargeable lithium-ion batteries. Cobalt antimonides show a good electrochemical
performance, improved theoretical capacities compared to graphite, flat voltage
plateaus, a good cycling stability, and less volume change problems compared to pure
antimony.[54,55]
CoSb2 is a transition metal dipnictide with arsenopyrite structure with
semiconducting and non-magnetic behavior.[56]
CoSb3 is a transition metal tripnictide
with skutterudite structure, derived from the ABX3 perovskite structure.[57]
Lithium titanate, cobalt diantimonide and cobalt triantimonide were used as electro-
active material for the preparation of composite electrodes, which were
electrochemically characterized in half- and full-cell configuration via cyclic
voltammetry (CV), galvanostatic cycling with potential limitation (GCPL),
galvanostatic intermittent titration technique (GITT), and potentio electrochemical
impedance spectroscopy (PEIS). Moreover, the chemical diffusion coefficient of Li+ in
the composite electrodes was determined from CV (Randles-Sevcik), PEIS (Warburg
diffusion element), and GITT (Weppner-Huggins) measurements.
Page 26
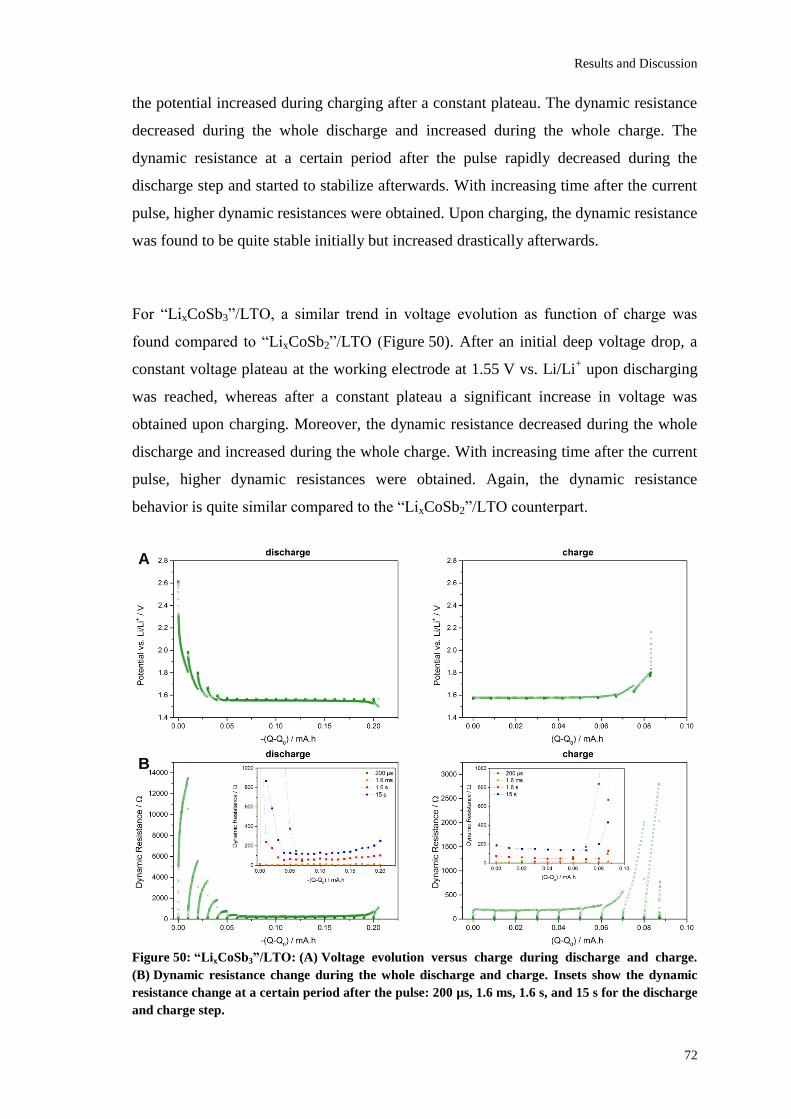
Results and Discussion
14
2 Results and Discussion
An integrated solar battery hybrid device was fabricated by combining an organic
photovoltaic with a battery system in a three-terminal assembly with two positive and a
shared negative electrode. For this purpose, bulk-heterojunction (BHJ) solar cells and
electrode materials for lithium-ion batteries were prepared and characterized, followed
by assembling and testing of the integrated power pack.
2.1 Bulk-Heterojunction Solar Cells
2.1.1 Single-Junction Solar Cells
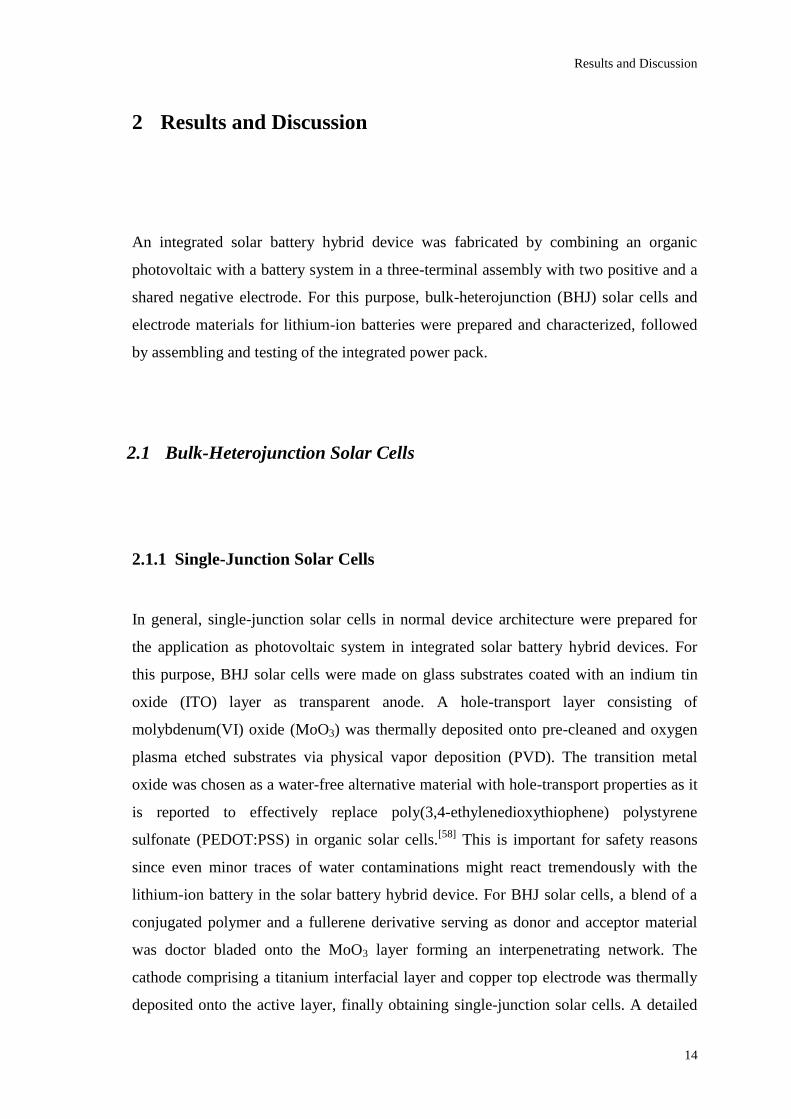
In general, single-junction solar cells in normal device architecture were prepared for
the application as photovoltaic system in integrated solar battery hybrid devices. For
this purpose, BHJ solar cells were made on glass substrates coated with an indium tin
oxide (ITO) layer as transparent anode. A hole-transport layer consisting of
molybdenum(VI) oxide (MoO3) was thermally deposited onto pre-cleaned and oxygen
plasma etched substrates via physical vapor deposition (PVD). The transition metal
oxide was chosen as a water-free alternative material with hole-transport properties as it
is reported to effectively replace poly(3,4-ethylenedioxythiophene) polystyrene
sulfonate (PEDOT:PSS) in organic solar cells.[58]
This is important for safety reasons
since even minor traces of water contaminations might react tremendously with the
lithium-ion battery in the solar battery hybrid device. For BHJ solar cells, a blend of a
conjugated polymer and a fullerene derivative serving as donor and acceptor material
was doctor bladed onto the MoO3 layer forming an interpenetrating network. The
cathode comprising a titanium interfacial layer and copper top electrode was thermally
deposited onto the active layer, finally obtaining single-junction solar cells. A detailed
Page 27
Results and Discussion
15
description of the device fabrication is given in Chapter 3.2. A graphical representation
of the examined single-junction solar cells in normal device architecture is shown in
Figure 9.
Figure 9: Bulk-heterojunction solar cells comprising a polymer:fullerene derivative blend as active
layer in normal device architecture
Different conjugated polymers blended with fullerene derivatives were evaluated for the
application in BHJ solar cells aiming at a good cell performance. In particular, a high
voltage, current density and power conversion efficiency are essential for the overall
performance (conversion and storage efficiency) of the solar battery hybrid device. This
implies that a voltage exceeding 1.15 V should be supplied by the solar cell in order to
charge the integrated electrochemical energy storage device. For optimization of the
solar cell performance, the effect of the donor:acceptor ratio, the hole-transport layer
thickness, the solvent for solution processing and thermal annealing on the
characteristic parameters was investigated.
2.1.1.1 Evaluation of Donor and Acceptor Materials
Blends of various donor and acceptor materials were evaluated with regard to their
performance in single-junction solar cells. In detail, benzothiadiazole-based small band
gap polymers with carbazole (PCDTBT), sila-fluorene (PSiF-DBT) and cyclopenta[2,1-
b:3,4-b’]dithiophene (PCPDTBT) moieties, and the polyfluorene-based wide band gap
polymer F8T2 were used as donor materials.[59]
The acceptor materials were based on
various fullerene derivatives including [60]PCBM, [70]PCBM and ICBA. The chemical
structures of the investigated donor and acceptor materials are shown in Figure 10.
Page 28
Results and Discussion
16
PCDTBT PCPDTBT
PSiF-DBT F8T2
[60]PCBM [70]PCBM ICBA
Figure 10: Chemical structures of evaluated (A) donor and (B) acceptor materials[60,61]
For evaluation of donor and acceptor materials, BHJ solar cells were fabricated in
normal device architecture using a MoO3 hole-transport layer, a polymer:fullerene
derivative blend as active layer, a titanium interfacial layer and a copper top electrode.
Figure 11: (A) Open circuit voltage and power conversion efficiency, and (B) short-circuit current
density and fill factor of blends of different conjugated polymers and fullerene derivatives with
varying donor:acceptor ratios. Characteristic parameters were averaged over five solar cells.
A
B
A B
Page 29
Results and Discussion
17
Figure 11 shows characteristic device parameters of the investigated BHJ solar cells
comprising different donor and acceptor materials with varying ratios. Comparing the
device performance of the BHJ solar cells, PCPDTBT:[70]PCBM solar cells exhibited
both a poor PCE (1.13±0.02%) and VOC (0.55 V), which is too low for the application in
solar battery hybrid devices. Both F8T2:PCBM-based solar cells showed an improved
VOC exceeding 0.95 V compared to the PCPDTBT system but facing lower PCE-values
(below 0.9%), which is due to a decline in JSC (below 1.5 mA/cm2). Even worse
performance parameters were obtained when using ICBA as fullerene derivative.
PSiF-DBT:[60]PCBM solar cells exhibited rather moderate cell characteristics with a
PCE of 2.1±0.1% but exceeding those of the PCPDTBT and F8T2 counterparts.
PCDTBT:ICBA solar cells showed an extremely high VOC (1.06 V) as well but facing
low JSCs and thus low PCE-values. By substituting ICBA with [60]PCBM or [70]PCBM
using PCDTBT as donor, improved characteristics compared to the other examined
donor:acceptor blends were obtained. The PCE-values (over 3.3%) in particular
exceeded the efficiencies of the other blends, which is due to relatively high VOCs
(about 0.9 V), FFs (about 60%), and improved JSCs (over 6 mA/cm²). Representative
J-V curves of BHJ solar cells of the examined donor:acceptor blends are shown in
Figure 12.
Figure 12: J-V curves of BHJ solar cells comprising different donor:acceptor materials
PCDTBT:[60]PCBM and PCDTBT:[70]PCBM solar cells showed an improved device
performance compared to the other examined blends. Hence, PCDTBT was used as
standard donor material for further optimization experiments. These included an
evaluation of diverse fullerene-based acceptor materials and investigation of the effect
of the donor:acceptor ratio, for instance.
A B
Page 30
Results and Discussion
18
2.1.1.2 PCDTBT:Fullerene Derivative as Active Layer in BHJ Solar Cells
For optimization of the performance of BHJ solar cells, the donor material PCDTBT
was mixed with different fullerene derivatives ([60]PCBM, [70]PCBM, ICBA) in
varying donor:acceptor ratios (1:1 w/w, 1:2 w/w, 1:4 w/w). A graphical representation
of the characteristic parameters is given in Figure 13.
Figure 13: (A) Open circuit voltage and power conversion efficiency, and (B) short-circuit current
density and fill factor of PCDTBT:fullerene derivative BHJ solar cells with varying donor:acceptor
ratios. Characteristic parameters were averaged over five solar cells.
Comparing the device performance of BHJ solar cells comprising different
donor:acceptor blends, PCDTBT:[60]PCBM solar cells exhibited a slight decline in VOC
when reducing the donor:acceptor ratio accompanied with a significant increase in FF.
Hence, the device performance was improved by using higher amounts of acceptor
material giving an optimum in the range studied at 1:4 (w/w) with a PCE of
3.39±0.04%. PCDTBT:[70]PCBM solar cells showed an improved performance when
reducing the donor:acceptor ratio from 1:1 (w/w) to 1:2 (w/w), followed by a decline at
higher amounts of the acceptor material. This trend was valid for all investigated
characteristic parameters. Thus, the optimum donor:acceptor ratio for
PCDTBT:[70]PCBM solar cells was determined to be 1:2 (w/w) with a PCE of
3.86±0.09%. PCDTBT:ICBA solar cells displayed a relative constant VOC over all
examined donor:acceptor ratios but an optimum in JSC and PCE at a ratio of 1:2 (w/w)
with a PCE of 1.12±0.03%.
With regard to the different fullerene derivatives, PCDTBT:ICBA solar cells exhibited
higher VOCs but also relatively low JSCs and PCE-values compared to PCBM-based
A B
Page 31
Results and Discussion
19
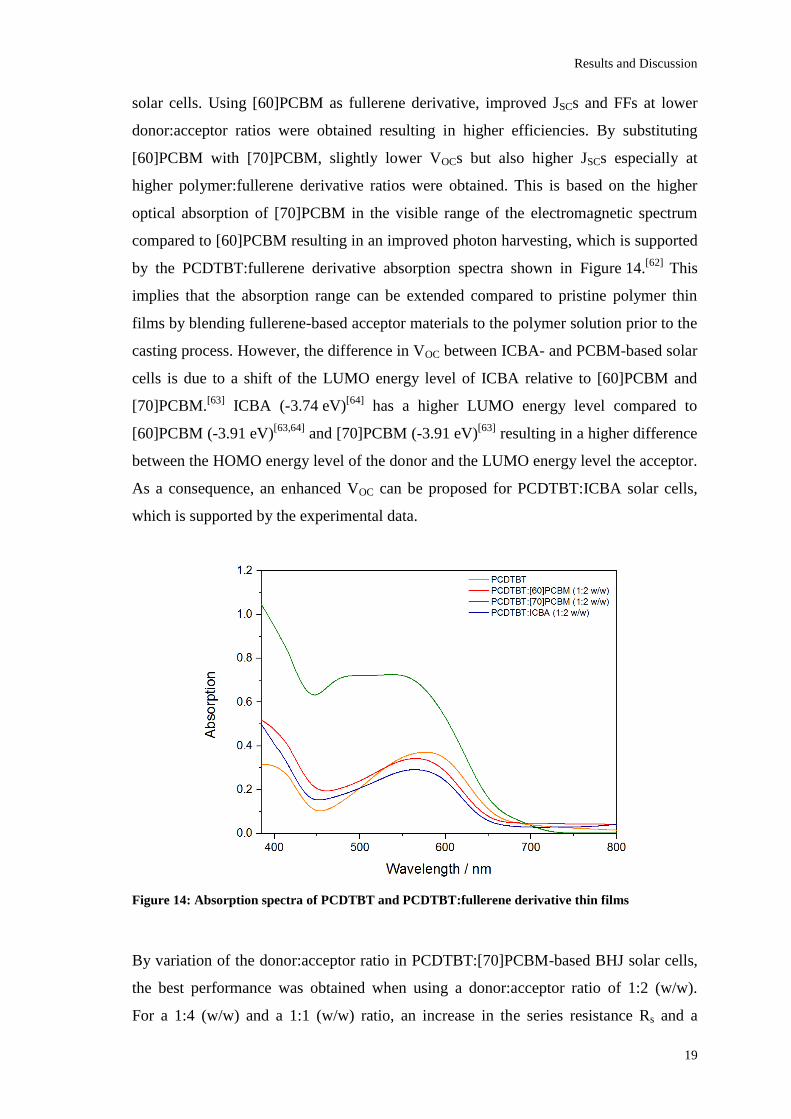
solar cells. Using [60]PCBM as fullerene derivative, improved JSCs and FFs at lower
donor:acceptor ratios were obtained resulting in higher efficiencies. By substituting
[60]PCBM with [70]PCBM, slightly lower VOCs but also higher JSCs especially at
higher polymer:fullerene derivative ratios were obtained. This is based on the higher
optical absorption of [70]PCBM in the visible range of the electromagnetic spectrum
compared to [60]PCBM resulting in an improved photon harvesting, which is supported
by the PCDTBT:fullerene derivative absorption spectra shown in Figure 14.[62]
This
implies that the absorption range can be extended compared to pristine polymer thin
films by blending fullerene-based acceptor materials to the polymer solution prior to the
casting process. However, the difference in VOC between ICBA- and PCBM-based solar
cells is due to a shift of the LUMO energy level of ICBA relative to [60]PCBM and
[70]PCBM.[63]
ICBA (-3.74 eV)[64]
has a higher LUMO energy level compared to
[60]PCBM (-3.91 eV)[63,64]
and [70]PCBM (-3.91 eV)[63]
resulting in a higher difference
between the HOMO energy level of the donor and the LUMO energy level the acceptor.
As a consequence, an enhanced VOC can be proposed for PCDTBT:ICBA solar cells,
which is supported by the experimental data.
Figure 14: Absorption spectra of PCDTBT and PCDTBT:fullerene derivative thin films
By variation of the donor:acceptor ratio in PCDTBT:[70]PCBM-based BHJ solar cells,
the best performance was obtained when using a donor:acceptor ratio of 1:2 (w/w).
For a 1:4 (w/w) and a 1:1 (w/w) ratio, an increase in the series resistance Rs and a
Page 32
Results and Discussion
20
decrease in the fill factor were observed. For example, PCDTBT:[70]PCBM solar cells
with a donor:acceptor ratio of 1:2 (w/w) had a series resistance of 16.1±1.7 Ω cm²
compared to 24.3±2.2 Ω cm² for a ratio of 1:1 (w/w) and 21.2±1.2 Ω cm² for 1:4 (w/w).
This increase in the Rs-value and decrease in FF is based on an inappropriate alignment
of the donor and acceptor phases within the interpenetrating network of the active layer.
Hence, the formation of a percolation network with an increasing number of charge-
trapping sites or a lack of acceptor domains for the formation of proper percolation
pathways can be proposed.[65]
This problem can be overcome by modifying the film
morphology of the active layer to obtain better-connected percolation networks, for
example via changing the solvent for solution processing as reported by Park et al..[65]
This is important since charge carriers need to be transported to the respective
electrodes via these percolation pathways.[65]
The J-V curves of the best solar cell for each PCDTBT:fullerene derivative blend with
its optimal donor:acceptor ratio and for PCDTBT:[70]PCBM solar cells with varying
donor:acceptor ratios are represented in Figure 15.
Figure 15: J-V curves of (A) PCDTBT:fullerene derivative BHJ solar cells with the optimal
donor:acceptor ratio and (B) PCDTBT:[70]PCBM BHJ solar cells with varying donor:acceptor
ratio
As a result, PCDTBT:[70]PCBM solar cells with a donor:acceptor ratio of 1:2 (w/w)
were determined to show the best device performance giving a VOC of 0.87 V, a JSC of
7.86±0.18 mA/cm2, a FF of 57.3±1.3%, and a PCE of 3.86±0.09%. Hence, this system
was used for subsequent optimization experiments, for instance concerning a variation
of the hole-transport layer thickness.
B A
Page 33
Results and Discussion
21
2.1.1.3 PCDTBT:[70]PCBM Single-Junction Solar Cells
According to Shrotriya et al., MoO3 is an efficient hole-transport layer able to
effectively substitute PEDOT:PSS in polymer solar cells.[58]
The transition metal oxide
layer was thermally deposited providing a water-free system, which is important for the
integrated power pack presented. For optimization of PCDTBT:[70]PCBM (1:2 w/w)
single-junction solar cells, the MoO3 layer thickness was varied in the range of 5-20 nm.
The respective characteristic parameters are represented in Figure 16.
Figure 16: (A) Open circuit voltage and power conversion efficiency, and (B) short-circuit current
density and fill factor of PCDTBT:[70]PCBM (1:2 w/w) BHJ solar cells with varying MoO3 layer
thicknesses. Characteristic parameters were averaged over five solar cells.
For the examined PCDTBT:[70]PCBM (1:2 w/w) solar cells, a variation in the MoO3
layer thickness did not greatly affect the VOC but a significant improvement in the JSC
and hence in the PCE were obtained when increasing the hole-transport layer thickness
from 5 nm to 15 nm. A further increase of the MoO3 layer thickness leaded to a decline
in the device performance. This corresponds to the determined Rs-values, where a
minimum series resistance of 15.6±1.5 Ω cm² was found for solar cells with a 15 nm
MoO3 layer. Hence, the optimal MoO3 layer thickness was determined to be 15 nm
giving following average characteristic parameters: a VOC of 0.88±0.01 V, a JSC of
7.67±0.35 mA/cm2, a FF of 58.2±1.4%, and a PCE of 3.86±0.13%.
A B
Page 34
Results and Discussion
22
In addition to the hole-transport layer thickness, the morphology of the active layer
greatly influences the device performance of BHJ solar cells.[65]
The film morphology is
reported to be affected by various processing parameters including donor:acceptor
ratios, solvents and thermal annealing for example.[23,65–68]
Considering the effect of
organic solvents on the solar cell characteristics, chlorobenzene (CB) and
1,2-dichlorobenzene (DCB) were used as solvents for the PCDTBT:[70]PCBM blend.
The donor:acceptor mixture was doctor bladed at different temperatures (40°C and
60°C) for the preparation of BHJ solar cells comprising a MoO3 hole-transport layer
(15 nm and 10 nm for DCB/40°C) and Ti/Cu electrodes. The corresponding
characteristic parameters are shown Figure 17.
Figure 17: (A) Open circuit voltage and power conversion efficiency, and (B) short-circuit current
density and fill factor of PCDTBT:[70]PCBM (1:2 w/w) BHJ solar cells doctor bladed at 40°C /
60°C from different solvents (layer thickness approx. 80 nm). Characteristic parameters were
averaged over five solar cells.
Using CB as solvent for the PCDTBT:[70]PCBM blend, an increase in the blading
temperature from 40°C to 60°C leaded to a decline in the JSC and FF accompanied by a
decline in the efficiency from 3.86±0.17% to 3.45±0.08%, whereas the VOC only
slightly decreased. This positive effect of lower blading temperatures might be due to an
improved film morphology based on a slower evaporation of the solvent. A well-
connected percolation network of donor and acceptor domains within the photo-active
layer can be proposed resulting in an enhanced JSC and FF as well as a reduced
Rs-value.[65]
By substituting CB with DCB (40°C) a further decrease in the device
characteristics was ascertainable. Again, increasing the blading temperature from 40°C
A B
Page 35
Results and Discussion
23
to 60°C (DCB) had a negative effect on the device performance. The decrease in FF and
increase in Rs from CB/40°C to DCB/60°C (from 15.1±1.4 Ω cm² to 45.1±7.0 Ω cm²)
might be caused by an increased number of charge-trapping sites in the percolation
network. Comparing these results with the literature, an improved device performance
was reported when using DCB as solvent for the PCDTBT:[70]PCBM blend based on a
smaller nanoscale phase separation of donor and acceptor domains.[65]
Especially for
lower blend ratios (1:4 w/w), the emergence of fibrillary polymer nanostructures was
reported resulting in prevalent and well-connected percolated networks.[65]
The choice
of the deposition method of the active layer probably caused the difference between the
experimental results presented (doctor blading) and the data reported in the literature
(spin coating). Nevertheless, CB was used as solvent for the PCDTBT:[70]PCBM blend
and the temperature for doctor blading was chosen to be 40°C.
Considering the effect of thermal annealing on the device performance,
PCDTBT:[70]PCBM (1:2 w/w) BHJ solar cells comprising MoO3 as hole-transport
layer (10 nm) and Ti/Cu electrodes were thermally annealed at several stages of
processing in order to investigate the effect of heat treatment on the solar cell
performance.
Figure 18: (A) Open circuit voltage and power conversion efficiency, and (B) short-circuit current
density and fill factor of PCDTBT:[70]PCBM (1:2 w/w) BHJ solar cells (layer thickness approx.
90 nm) with different thermal annealing procedures: (1) no annealing, (2) annealing before
electrode deposition (100°C, 10 min, 15 K/min), (3) annealing after electrode deposition (100°C,
30 min, 15 K/min), (4) annealing before and after electrode deposition (100°C, 10 min, 15 K/min;
100°C, 30 min, 15 K/min). Characteristic parameters were averaged over five solar cells.
A B
Page 36
Results and Discussion
24
Figure 18 shows that the best device performance was obtained without thermal
annealing. Annealing of the active layer after doctor blading leaded to a slight decline in
the performance. In contrast, when annealing BHJ solar cells after deposition of the top
electrodes, a significant decline of the device characteristics was observable. Thermal
annealing before and after the deposition of the top electrode also had a negative impact
on the performance. Comparing the different annealing procedures, by increasing the
duration of heat treatment a decrease in device performance was noticed, which was
valid for all examined characteristic parameters. With ongoing heat treatment (from (1)
to (4)), a decline in the FF and an increase in the Rs-value (from 16.8±0.7 Ω cm² to
23.7±1.8 Ω cm²) was obtained. This implies the formation of an increased number of
charge-trapping sites in the percolated network. As reported in the literature, thermal
annealing at elevated temperatures leaded to a decline of the device performance for
PCDTBT-based solar cells.[65,68]
For all further experiments, PCDTBT:[70]PCBM
(1:2 w/w) BHJ solar cells were not thermally annealed but doctor bladed at 40°C for a
slow evaporation of the solvent.
In conclusion, various parameters were investigated to optimize the solar cell
performance. These included the evaluation of conjugated polymers and fullerene
derivatives as donor and acceptor materials for the active layer, the optimization of the
donor:acceptor ratio, the adjustment of the hole-transport layer thickness and the film
morphology modification via solvent processing and thermal annealing. As a result,
PCDTBT:[70]PCBM (1:2 w/w) solar cells with an optimized total layer thickness in the
range of 90-120 nm were determined to show the best device performance of the
evaluated donor:acceptor blends. However, apart from a good JSC (7.67±0.35 mA/cm2)
and PCE (3.86±0.13%), the VOC (0.88±0.01 V) is too low for a successful
implementation as photovoltaic system in solar battery hybrid devices. Hence, a further
optimization especially with regard to the voltage was necessary in order to provide a
VOC and a voltage at the maximum power point (Vmpp) exceeding 1.15 V, which should
be achieved by organic multi-junction solar cells.
Page 37
Results and Discussion
25
2.1.2 Multi-Junction Solar Cells
Organic multi-junction solar cells can be used for enhanced photo-voltage generation by
stacking of solar cells via recombination layers. The open circuit voltage of multi-
junction solar cells with ideal, fully-transparent intermediate layers enabling loss-free
charge recombination equals the sum of the VOCs of each contributing sub-cell.[34]
This
is why tandem and triple-junction solar cells were fabricated in normal device
architecture in order to achieve a VOC and Vmpp exceeding 1.15 V, which is necessary to
charge the solar battery hybrid device.
In detail, tandem solar cells were prepared on glass substrates coated with an ITO layer
serving as transparent anode, followed by thermal deposition of a MoO3 hole-transport
layer. A blend of PCDTBT:[70]PCBM (1:2 w/w) as active layer within the front cell
was stacked in series with a second active layer forming the back cell of the tandem
device. For this second active layer, various blends of conjugated polymers and
fullerene derivatives serving as donor and acceptor materials were investigated in order
to extend the absorption range and to cover the solar emission spectrum efficiently. The
absorption range of tandem solar cells can be tuned by using donor (e.g. wide and small
band gap polymers) and acceptor materials with complementary absorption behavior
exhibiting absorption maxima in a different region of the electromagnetic spectrum.
Thus, an enhanced light harvesting and photo-current generation can be proposed as a
result of an extended absorption range. Nevertheless, according to Kirchhoff’s law the
maximum short-circuit current density of multi-junction solar cells is limited by the
smallest JSC of each contributing sub-cell.[34]
These active layers were connected in
series via thermally deposited intermediate layers by physical vapor deposition. Various
metals and metal oxides, in some cases modified with interfacial layers, were combined
with MoO3 serving as electron- and hole-transport layer, respectively. The cathode
comprising a titanium interfacial layer and copper top electrode was thermally deposited
onto the second active layer finally obtaining the multi-junction solar cell. A detailed
description of the device fabrication is given in Chapter 3.2.
Page 38
Results and Discussion
26
A graphical representation of the prepared multi-junction solar cells in normal device
architecture is shown in Figure 19.
Figure 19: Multi-junction solar cells comprising two different active layers connected in series via
intermediate layers in normal device architecture
2.1.2.1 Active Layers in Multi-Junction Solar Cells
Donor materials with complementary absorption region should be combined in tandem
solar cells in order to enhance light harvesting. For this purpose, various conjugated
polymers including the small band gap polymers PCDTBT, PSiF-DBT and PCPDTBT,
and the wide band gap polymer F8T2 were examined with regard to their absorption
behavior. Polymer thin films were prepared by doctor blading of a polymer solution
(10 mg/mL in chlorobenzene) onto pre-cleaned microscope slides. The normalized
absorption spectra of the pristine polymer thin films were recorded in the range of
385-900 nm (Figure 20).
Page 39
Results and Discussion
27
Figure 20: Absorption spectra of pristine PCDTBT, PSiF-DBT, PCPDTBT, and F8T2 thin films in
the range of 385-900 nm
Comparing the absorption spectra of the examined polymers, absorption peaks at
396 nm and 578 nm were determined for PCDTBT. PSiF-DBT showed a similar
absorption range compared to PCDTBT with maxima at 404 nm and 575 nm. Thus,
combining these two materials in tandem solar cells would not succeed in extending the
absorption range. The low band gap PCPDTBT (with peak maxima at 420 nm and
736 nm) and the wide band gap F8T2 (459 nm and 480 nm) are donor materials with an
appropriate complementary absorption region. Because of the poor device performance
of F8T2:fullerene derivative BHJ solar cells, only the benzothiadiazole-based polymers
were used as donor materials in tandem solar cells.
Because of the good device performance of PCDTBT:[70]PCBM (1:2 w/w) BHJ solar
cells, the PCDTBT:[70]PCBM blend was used as standard active layer for at least one
sub-cell in multi-junction solar cells. Since PCDTBT (Eg = 1.88 eV[69]
) has the highest
band gap of the examined benzothiadiazole-based donor materials
(Eg (PSiF-DBT) = 1.82 eV[70]
, Eg (PCPDTBT) = 1.46 eV[71]
), PCDTBT:[70]PCBM was
used as active layer in the front cell of multi-junction solar cells. An optimized
intermediate layer combination of 1 nm Al / 15 nm MoO3 was thermally deposited onto
the first active layer.[72]
For the second active layer, the different low band gap polymers
blended with fullerene derivatives were doctor bladed onto the intermediate layer,
Page 40
Results and Discussion
28
followed by thermal deposition of Ti/Cu electrodes. The corresponding J-V curves and
characteristic parameters are represented in Figure 21 and Table 1, respectively.
Figure 21: J-V curves of multi-junction solar cells with PCDTBT:[70]PCBM (1:2 w/w) front cells,
1 nm Al / 15 nm MoO3 intermediate layers and various donor:acceptor blend back cells and of a
single-junction reference cell
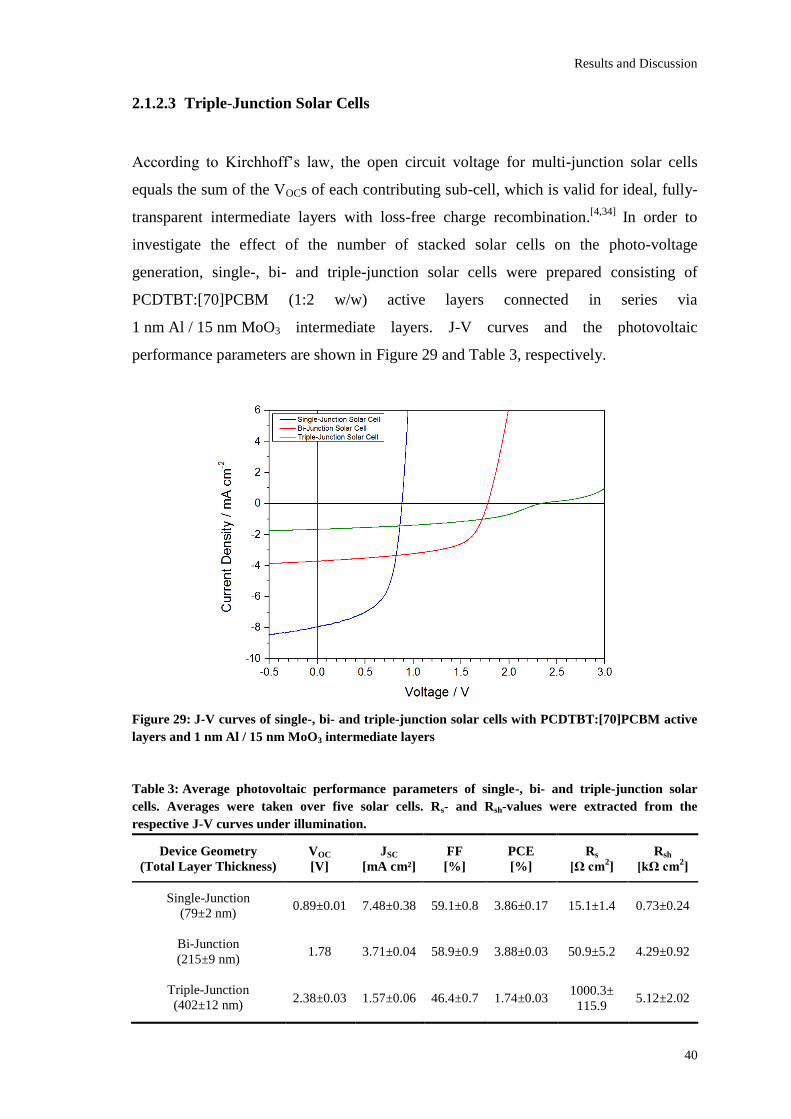
Table 1: Average photovoltaic performance parameters of multi-junction and single-junction
reference solar cells. The general device geometry was glass / ITO / MoO3 / PCDTBT:[70]PCBM
(1:2 w/w) / 1 nm Al / 15 nm MoO3 / active layer / Ti / Cu. Averages were taken over five solar cells.
Rs- and Rsh-values were extracted from the respective J-V curves under illumination.
Active Layer
of Back Cell
VOC
[V]
JSC
[mA cm-2
]
FF
[%]
PCE
[%]
Rs
[Ω cm2]
Rsh
[kΩ cm2]
PCDTBT:[70]PCBM
(1:2 w/w)
1.78 3.71±0.04 58.9±0.9 3.88±0.03 50.9±5.2 4.29±0.92
PCDTBT:[60]PCBM
(1:2 w/w)
1.62 2.61±0.08 57.5±3.5 2.43±0.14 483.5±62.2 2.85±1.10
PSiF-DBT:[60]PCBM
(1:2 w/w)
1.40±0.01 1.91±0.05 46.4±0.4 1.26±0.03 570.6±22.4 1.58±0.32
PCPDTBT:[60]PCBM
(1:2 w/w)
1.41±0.02 3.08±0.06 30.6±0.8 1.34±0.03 978.2±107.5 0.67±0.08
- (single-junction)
0.89±0.01 7.48±0.38 59.0±0.8 3.86±0.17 15.1±1.4 0.73±0.24
Page 41
Results and Discussion
29
The best device performance was obtained using PCDTBT:[70]PCBM (1:2 w/w) in
both sub-cells giving a VOC of 1.78 V, a JSC of 3.71±0.04 mA/cm², a FF of 58.9±0.9%
and a PCE of 3.88±0.03%. Hence, the open circuit voltage reached the sum of the VOCs
of each contributing sub-cell. By substituting [70]PCBM with [60]PCBM in the back
cell, a decline in the cell performance was determined. This improved device
performance of [70]PCBM-based solar cells can be attributed to an increased fraction of
absorbed light in the visible region below 650 nm of the electromagnetic spectrum
compared to [60]PCBM-based systems (Figure 14).[73,74]
Tandem solar cells with
PSiF-DBT:[60]PCBM and PCPDTBT:[60]PCBM back cells exhibited a worse device
performance with lower VOCs, FFs and PCE-values compared to the PCDTBT-based
systems. This decrease in the solar cell performance was also supported by the
significant increase in the Rs-values.
As a result, the best device performance was obtained using PCDTBT:[70]PCBM
(1:2 w/w) as active layer in both sub-cells of multi-junction solar cells with an
optimized active layer thickness of about 90 nm for each sub-cell. Further optimization
of the device performance of multi-junction solar cells included the investigation of the
effect of various intermediate layer combinations, partially modified with interfacial
layers.
Page 42
Results and Discussion
30
2.1.2.2 Intermediate Layers in Multi-Junction Solar Cells
In general, multi-junction solar cells are prepared by stacking active layers via
intermediate layers. The choice of materials for these recombination layers and their
properties are crucial for the overall solar cell performance since various requirements
have to be met including
(i) a high optical transparency over the absorption range of the back cell(s)
in order to reduce optical losses[34]
(ii) low energy barriers for electron- and hole-extraction processes at the
acceptor/electron-transport layer interface and the donor/hole-transport layer
interface[72]
(iii) a high electrical conductivity and charge carrier mobility within the
intermediate layers to minimize the number of occurring charge-trapping
events[75]
(iv) an efficient recombination of electrons coming from one sub-cell and holes
from the other at the interface of electron- and hole-transport layers within
the recombination layer[4]
(v) an easy and low-cost processing method to obtain environmentally stable
and robust intermediate layers with the ability of protecting prior-deposited
active layers from further processing (e.g. solution processing).[34]
Taking these prerequisites into account, layers of highly optical transparent materials
with electron- and hole-transport properties are stacked in series to ensure an effective
recombination of electrons and holes at the interface of the electron- and hole-transport
layers. These recombination layers can be either solution-processed or thermally
deposited under vacuum. Solution-processed intermediate layers based on a
combination of n-type metal oxides like TiOx[76]
or ZnO nanoparticles[77]
and
PEDOT:PSS serving as electron- and hole-transport layer are reported in the literature.
Thermally deposited intermediate layers use combinations of metal thin films as
electron-transport layer and p-type-like transition metal oxides such as NiO, MoO3 or
WO3 as hole-transport layer.[72]
Moreover, ultrathin metal layers of Ag[78]
and Au[79]
as
intermediate layers have been reported but facing problems in solution-processed
tandem solar cells because of dissolution effects of prior-deposited active layers.[72]
Page 43
Results and Discussion
31
Especially for solution-processed organic multi-junction solar cells, a lack in study of
metal/p-type like oxide intermediate layer combinations is reported.[72]
This is why
various metals (Al, Ag, Au, Cu, Ti) and metal oxides (TiOx, ZnO, MoO3) combined
with the p-type-like transition metal oxide MoO3 serving as electron- and hole-transport
layer were investigated with regard to the influence on the device performance.
Different metal (Ca, Ti) and alkali-metal compound (LiF, Cs2CO3) interfacial layers
were thermally deposited under vacuum in order to adjust the work function of the
metals for improved device performances. For investigation of these intermediate layer
combinations in tandem solar cells, sub-cells with PCDTBT:[70]PCBM (1:2 w/w)
active layers were connected in series via various thermally deposited recombination
layers.
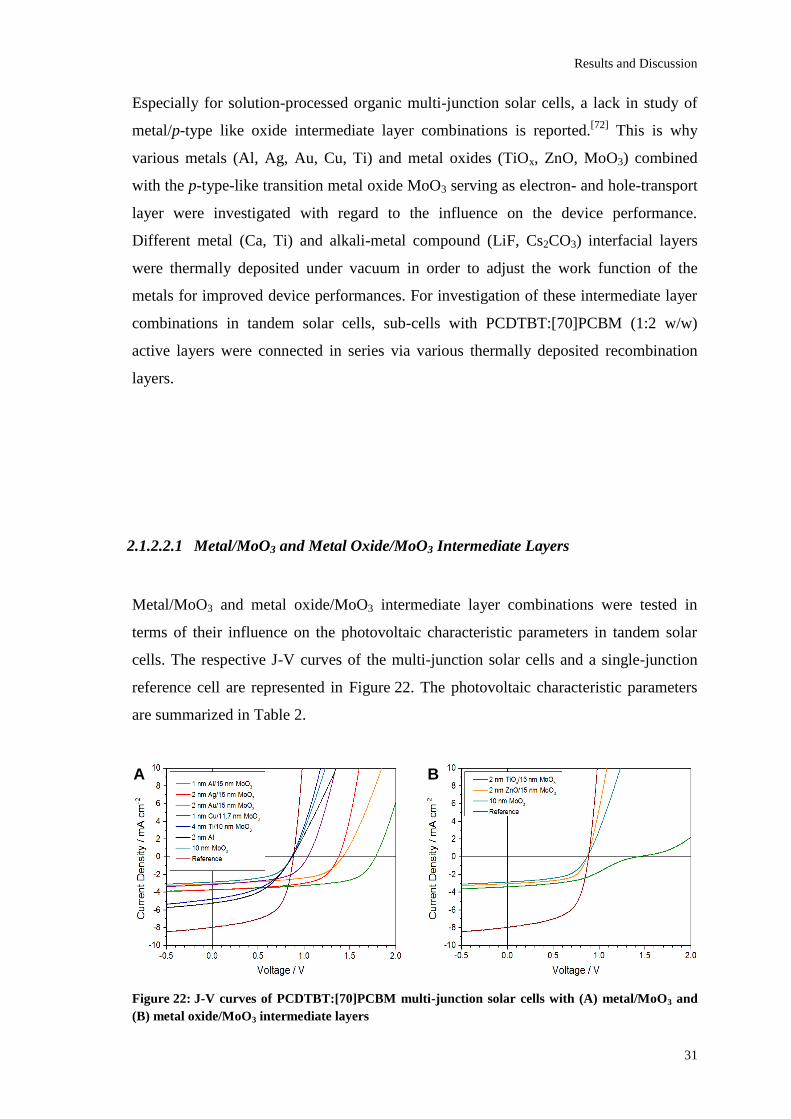
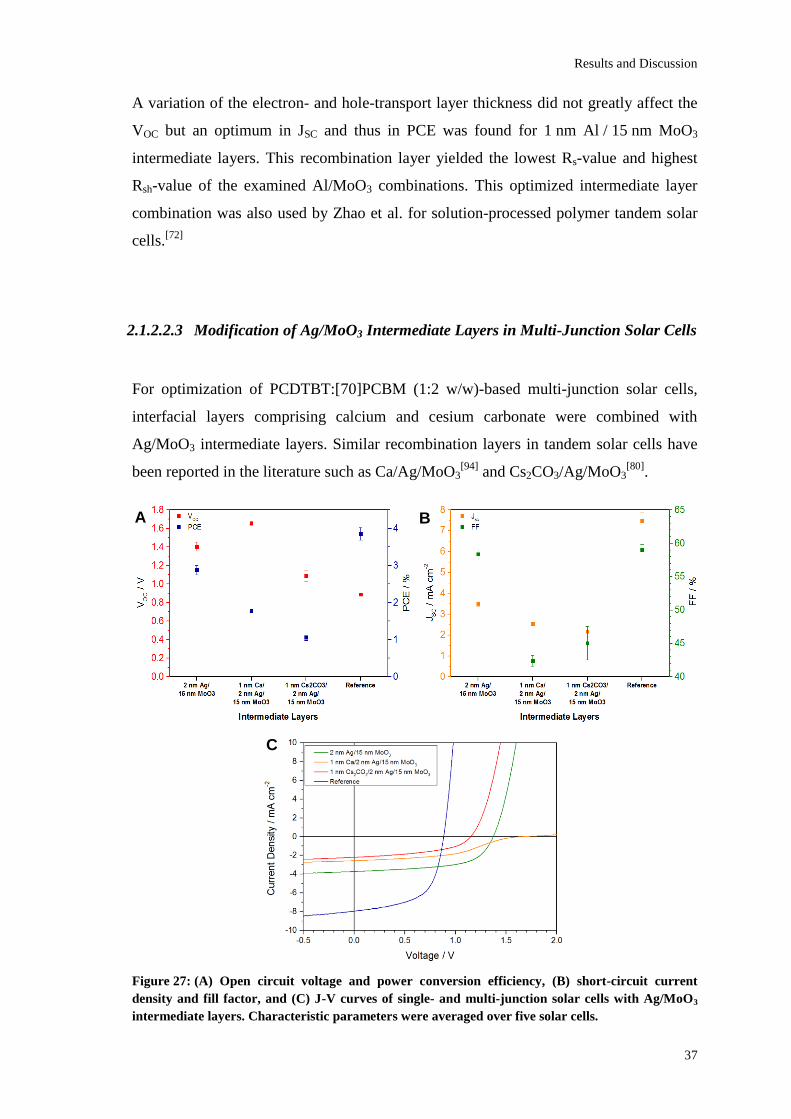
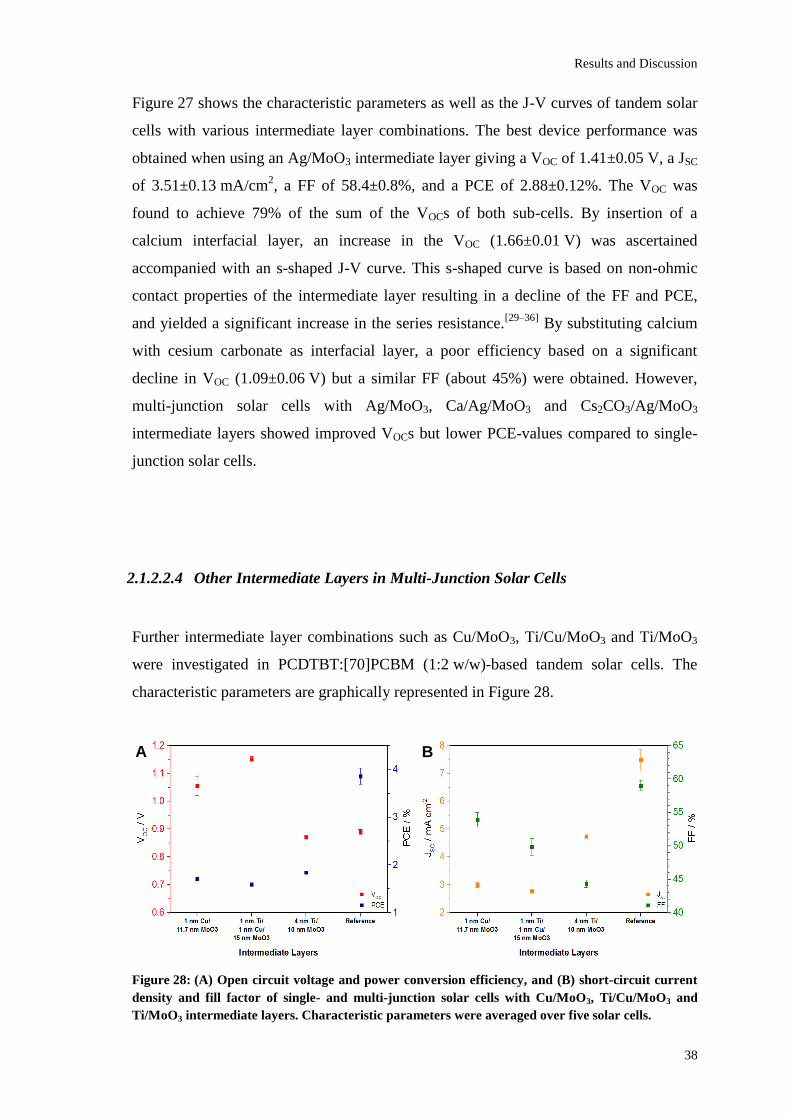
2.1.2.2.1 Metal/MoO3 and Metal Oxide/MoO3 Intermediate Layers
Metal/MoO3 and metal oxide/MoO3 intermediate layer combinations were tested in
terms of their influence on the photovoltaic characteristic parameters in tandem solar
cells. The respective J-V curves of the multi-junction solar cells and a single-junction
reference cell are represented in Figure 22. The photovoltaic characteristic parameters
are summarized in Table 2.
Figure 22: J-V curves of PCDTBT:[70]PCBM multi-junction solar cells with (A) metal/MoO3 and
(B) metal oxide/MoO3 intermediate layers
A B
Page 44
Results and Discussion
32
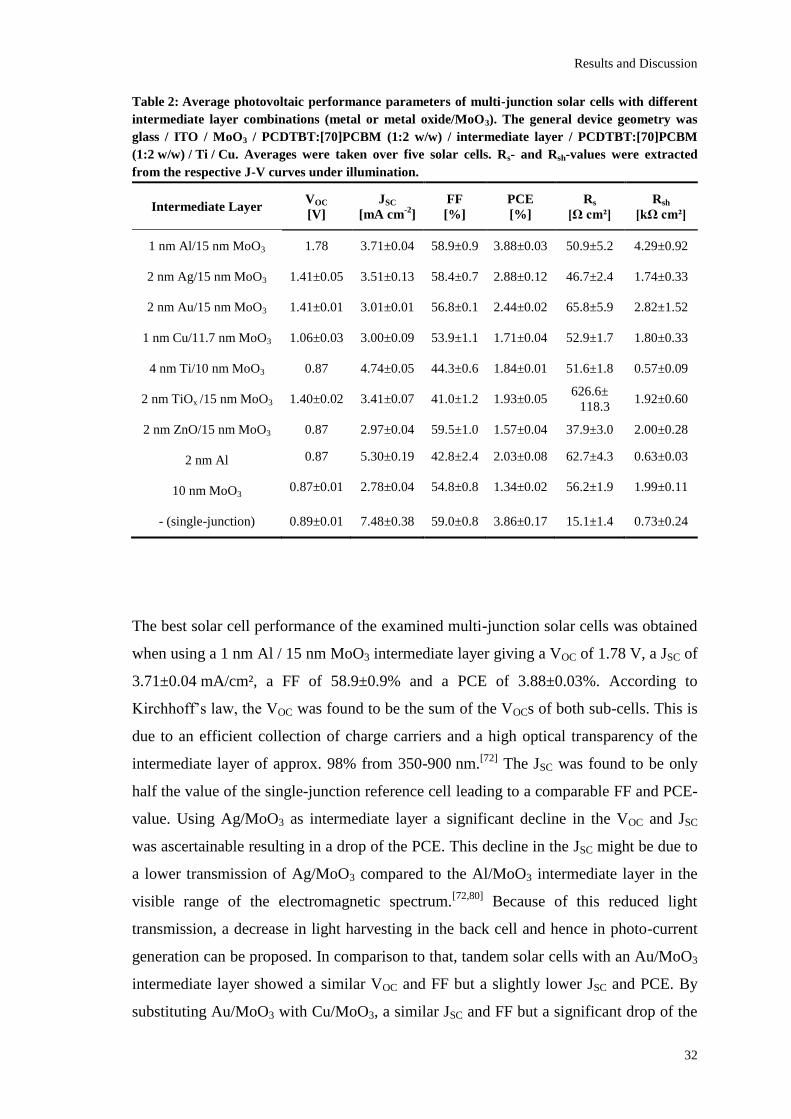
Table 2: Average photovoltaic performance parameters of multi-junction solar cells with different
intermediate layer combinations (metal or metal oxide/MoO3). The general device geometry was
glass / ITO / MoO3 / PCDTBT:[70]PCBM (1:2 w/w) / intermediate layer / PCDTBT:[70]PCBM
(1:2 w/w) / Ti / Cu. Averages were taken over five solar cells. Rs- and Rsh-values were extracted
from the respective J-V curves under illumination.
Intermediate Layer
VOC
[V]
JSC
[mA cm-2
]
FF
[%]
PCE
[%]
Rs
[Ω cm²]
Rsh
[kΩ cm²]
1 nm Al/15 nm MoO3
1.78 3.71±0.04 58.9±0.9 3.88±0.03 50.9±5.2 4.29±0.92
2 nm Ag/15 nm MoO3
1.41±0.05 3.51±0.13 58.4±0.7 2.88±0.12 46.7±2.4 1.74±0.33
2 nm Au/15 nm MoO3
1.41±0.01 3.01±0.01 56.8±0.1 2.44±0.02 65.8±5.9 2.82±1.52
1 nm Cu/11.7 nm MoO3
1.06±0.03 3.00±0.09 53.9±1.1 1.71±0.04 52.9±1.7 1.80±0.33
4 nm Ti/10 nm MoO3
0.87 4.74±0.05 44.3±0.6 1.84±0.01 51.6±1.8 0.57±0.09
2 nm TiOx /15 nm MoO3
1.40±0.02 3.41±0.07 41.0±1.2 1.93±0.05 626.6±
118.3 1.92±0.60
2 nm ZnO/15 nm MoO3
0.87 2.97±0.04 59.5±1.0 1.57±0.04 37.9±3.0 2.00±0.28
2 nm Al 0.87 5.30±0.19 42.8±2.4 2.03±0.08 62.7±4.3 0.63±0.03
10 nm MoO3
0.87±0.01 2.78±0.04 54.8±0.8 1.34±0.02 56.2±1.9 1.99±0.11
- (single-junction)
0.89±0.01 7.48±0.38 59.0±0.8 3.86±0.17 15.1±1.4 0.73±0.24
The best solar cell performance of the examined multi-junction solar cells was obtained
when using a 1 nm Al / 15 nm MoO3 intermediate layer giving a VOC of 1.78 V, a JSC of
3.71±0.04 mA/cm², a FF of 58.9±0.9% and a PCE of 3.88±0.03%. According to
Kirchhoff’s law, the VOC was found to be the sum of the VOCs of both sub-cells. This is
due to an efficient collection of charge carriers and a high optical transparency of the
intermediate layer of approx. 98% from 350-900 nm.[72]
The JSC was found to be only
half the value of the single-junction reference cell leading to a comparable FF and PCE-
value. Using Ag/MoO3 as intermediate layer a significant decline in the VOC and JSC
was ascertainable resulting in a drop of the PCE. This decline in the JSC might be due to
a lower transmission of Ag/MoO3 compared to the Al/MoO3 intermediate layer in the
visible range of the electromagnetic spectrum.[72,80]
Because of this reduced light
transmission, a decrease in light harvesting in the back cell and hence in photo-current
generation can be proposed. In comparison to that, tandem solar cells with an Au/MoO3
intermediate layer showed a similar VOC and FF but a slightly lower JSC and PCE. By
substituting Au/MoO3 with Cu/MoO3, a similar JSC and FF but a significant drop of the
Page 45
Results and Discussion
33
VOC was noticed. Tandem solar cells with a Ti/MoO3 intermediate layer exhibited a
low VOC comparable to the single-junction device resulting in a poor PCE. This low
open circuit voltage is based on the low shunt or parallel resistance Rsh. Low shunt
resistances are known to reduce current flows and voltages resulting in power losses
since an alternative current path is provided.[81]
This might be due to problems during
manufacturing. However, Ti/MoO3 was determined to be an inadequate intermediate
layer for this system, even though titanium has a similar work function (4.33 eV)[82]
compared to aluminum (4.28 eV)[83]
and silver (4.26 eV)[82,83]
. Using an ultrathin
aluminum intermediate layer (2 nm), a rather poor device performance was obtained
with a VOC similar to the single-junction reference cell but an improved JSC compared to
the other multi-junction solar cells. The low open circuit voltage is ascribable to the
missing hole-transport properties of the aluminum intermediate layer responsible for
non-effective electron-hole recombination. A graphical representation of the
corresponding energy level diagram of PCDTBT:[70]PCBM multi-junction solar cells
with metal/MoO3 intermediate layers is given in Figure 23.
Figure 23: Energy level diagram of PCDTBT:[70]PCBM multi-junction solar cells with
metal/MoO3 intermediate layers
With regard to the metal oxide/MoO3 recombination layers, TiOx and ZnO were
prepared by thermal evaporation of metallic Ti or Zn at a pressure of 10-4
mbar,
followed by exposure to air during which a conversion of the metal layers to the
Page 46
Results and Discussion
34
respective metal oxides was assumed. According to the literature, titanium shows a high
affinity to oxygen accompanied by the conversion into TiOx within microseconds,
whereas dense ZnO films are formed upon oxidation of Zn films under ambient air.[84,85]
Comparing the device performance, only tandem solar cells with a TiOx/MoO3
intermediate layer showed good characteristic parameters with a high VOC but exhibited
s-shaped J-V curves resulting in a relative low FF and an extremely high Rs-value.
These s-shaped curves are based on non-ohmic contact properties, which can be
overcome by deposition of metal-based interfacial layers providing an equivalent ohmic
contact between the electron- and hole-transport layer.[34,86–93]
Tandem solar cells with
ZnO/MoO3 intermediate layers exhibited poor photovoltaic performance parameters,
which might be due to manufacturing problems. The poor device performance of
tandem solar cells with a MoO3 intermediate layer is based on missing electron-
transport properties of the transition metal oxide, which is due to its high conduction
band (-2.3 eV).[58]
This additional energy barrier for electron-transport processes
prevents efficient electron-hole recombination within the intermediate layer. This is
why photovoltaic characteristics comparable to single-junction devices were obtained.
A graphical representation of the corresponding energy level diagram of
PCDTBT:[70]PCBM multi-junction solar cells with metal oxide/MoO3 intermediate
layers is given in Figure 24.
Figure 24: Energy level diagram of PCDTBT:[70]PCBM multi-junction solar cells with metal
oxide/MoO3 intermediate layers
Page 47
Results and Discussion
35
2.1.2.2.2 Modification and Optimization of Al/MoO3 Intermediate Layers in Multi-
Junction Solar Cells
In order to determine the influence of additional alkali-metal compound (lithium
fluoride) and metal layers (calcium) combined with Al/MoO3-based intermediate layers
on the device performance, multi-junction solar cells with different recombination
layers were prepared including LiF/Al/MoO3[72]
and Ca/Al/MoO3[94]
. The photovoltaic
characteristic parameters and J-V curves are graphically represented in Figure 25.
Figure 25: (A) Open circuit voltage and power conversion efficiency, (B) short-circuit current
density and fill factor, and (C) J-V curves of single- and multi-junction solar cells with Al/MoO3-
based intermediate layers. Characteristic parameters were averaged over five solar cells.
A B
C
Page 48
Results and Discussion
36
Tandem solar cells with Al/MoO3 recombination layers showed an improved device
performance compared to other intermediate layer combinations. By inserting lithium
fluoride and calcium interfacial layers, s-shaped curves were obtained yielding lower
FFs (about 30%) and PCE-values. These s-shaped curves are based on non-ohmic
contacts of the intermediate layer.[34,86–93]
Multi-junction solar cells with a Ca/Al/MoO3
recombination layer exhibited a higher VOC (1.62±0.11V) compared to the
LiF/Al/MoO3 counterpart. Both intermediate layer combinations exhibited significant
higher Rs- but lower Rsh-values compared to tandem solar cells with an Al/MoO3
recombination layer. However, tandem solar cells with Al/MoO3, LiF/Al/MoO3 and
Ca/Al/MoO3 intermediate layer combinations showed an improved VOC but also lower
JSCs and FFs compared to the single-junction reference cell.
Because of the good device performance of tandem solar cells with Al/MoO3
intermediate layers, the metal and metal oxide layer thicknesses were optimized. The
respective performance parameters and J-V curves are shown in Figure 26.
Figure 26: (A) Open circuit voltage and power conversion efficiency, (B) short-circuit current
density and fill factor, and (C) J-V curves of single- and multi-junction solar cells with Al/MoO3
intermediate layers with varying layer thicknesses. Characteristic parameters were averaged over
five solar cells.
A B
C
Page 49
Results and Discussion
37
A variation of the electron- and hole-transport layer thickness did not greatly affect the
VOC but an optimum in JSC and thus in PCE was found for 1 nm Al / 15 nm MoO3
intermediate layers. This recombination layer yielded the lowest Rs-value and highest
Rsh-value of the examined Al/MoO3 combinations. This optimized intermediate layer
combination was also used by Zhao et al. for solution-processed polymer tandem solar
cells.[72]
2.1.2.2.3 Modification of Ag/MoO3 Intermediate Layers in Multi-Junction Solar Cells
For optimization of PCDTBT:[70]PCBM (1:2 w/w)-based multi-junction solar cells,
interfacial layers comprising calcium and cesium carbonate were combined with
Ag/MoO3 intermediate layers. Similar recombination layers in tandem solar cells have
been reported in the literature such as Ca/Ag/MoO3[94]
and Cs2CO3/Ag/MoO3[80]
.
Figure 27: (A) Open circuit voltage and power conversion efficiency, (B) short-circuit current
density and fill factor, and (C) J-V curves of single- and multi-junction solar cells with Ag/MoO3
intermediate layers. Characteristic parameters were averaged over five solar cells.
A B
C
Page 50
Results and Discussion
38
Figure 27 shows the characteristic parameters as well as the J-V curves of tandem solar
cells with various intermediate layer combinations. The best device performance was
obtained when using an Ag/MoO3 intermediate layer giving a VOC of 1.41±0.05 V, a JSC
of 3.51±0.13 mA/cm2, a FF of 58.4±0.8%, and a PCE of 2.88±0.12%. The VOC was
found to achieve 79% of the sum of the VOCs of both sub-cells. By insertion of a
calcium interfacial layer, an increase in the VOC (1.66±0.01 V) was ascertained
accompanied with an s-shaped J-V curve. This s-shaped curve is based on non-ohmic
contact properties of the intermediate layer resulting in a decline of the FF and PCE,
and yielded a significant increase in the series resistance.[29–36]
By substituting calcium
with cesium carbonate as interfacial layer, a poor efficiency based on a significant
decline in VOC (1.09±0.06 V) but a similar FF (about 45%) were obtained. However,
multi-junction solar cells with Ag/MoO3, Ca/Ag/MoO3 and Cs2CO3/Ag/MoO3
intermediate layers showed improved VOCs but lower PCE-values compared to single-
junction solar cells.
2.1.2.2.4 Other Intermediate Layers in Multi-Junction Solar Cells
Further intermediate layer combinations such as Cu/MoO3, Ti/Cu/MoO3 and Ti/MoO3
were investigated in PCDTBT:[70]PCBM (1:2 w/w)-based tandem solar cells. The
characteristic parameters are graphically represented in Figure 28.
Figure 28: (A) Open circuit voltage and power conversion efficiency, and (B) short-circuit current
density and fill factor of single- and multi-junction solar cells with Cu/MoO3, Ti/Cu/MoO3 and
Ti/MoO3 intermediate layers. Characteristic parameters were averaged over five solar cells.
A B
Page 51
Results and Discussion
39
Tandem solar cells with a Cu/MoO3 intermediate layer exhibited a slightly improved
VOC but a lower FF, JSC and PCE compared to the single-junction reference cell. By
inserting a titanium interfacial layer, a further increase in VOC was obtained
accompanied with a decline in the JSC and PCE. The additional interfacial layer also
yielded a higher series resistance and a reduced FF. However, multi-junction solar cells
with a Ti/MoO3 intermediate layer apparently showed a poor device performance with a
VOC comparable to the single-junction reference cell. This is based on the effect of the
low shunt resistance (0.57±0.09 kΩ cm²). Low shunt resistances provide an alternative,
parallel path for photo-generated current without producing power.[81]
This leakage
currents reduce the solar cell characteristic parameters VOC, JSC and FF, and cause
significant power losses.[81]
Page 52
Results and Discussion
40
2.1.2.3 Triple-Junction Solar Cells
According to Kirchhoff’s law, the open circuit voltage for multi-junction solar cells
equals the sum of the VOCs of each contributing sub-cell, which is valid for ideal, fully-
transparent intermediate layers with loss-free charge recombination.[4,34]
In order to
investigate the effect of the number of stacked solar cells on the photo-voltage
generation, single-, bi- and triple-junction solar cells were prepared consisting of
PCDTBT:[70]PCBM (1:2 w/w) active layers connected in series via
1 nm Al / 15 nm MoO3 intermediate layers. J-V curves and the photovoltaic
performance parameters are shown in Figure 29 and Table 3, respectively.
Figure 29: J-V curves of single-, bi- and triple-junction solar cells with PCDTBT:[70]PCBM active
layers and 1 nm Al / 15 nm MoO3 intermediate layers
Table 3: Average photovoltaic performance parameters of single-, bi- and triple-junction solar
cells. Averages were taken over five solar cells. Rs- and Rsh-values were extracted from the
respective J-V curves under illumination.
Device Geometry
(Total Layer Thickness)
VOC
[V]
JSC
[mA cm²]
FF
[%]
PCE
[%]
Rs
[Ω cm2]
Rsh
[kΩ cm2]
Single-Junction
(79±2 nm)
0.89±0.01 7.48±0.38 59.1±0.8 3.86±0.17 15.1±1.4 0.73±0.24
Bi-Junction
(215±9 nm)
1.78 3.71±0.04 58.9±0.9 3.88±0.03 50.9±5.2 4.29±0.92
Triple-Junction
(402±12 nm)
2.38±0.03 1.57±0.06 46.4±0.7 1.74±0.03 1000.3±
115.9 5.12±2.02
Page 53
Results and Discussion
41
Comparing the device performance of single-, bi- and triple-junction solar cells, the VOC
increased with increasing number of stacked sub-cells, which can be explained by
Kirchhoff’s law. For bi-junction solar cells, the VOC was found to be the sum of the
VOCs of both sub-cells. For triple-junction solar cells, about 89% of the maximal open
circuit voltage was achieved. The decline in JSC with increasing number of stacked
sub-cells can be explained by the photo-current generation. According to Kirchhoff’s
law, the short-circuit current density of a multi-junction solar cell is limited by the
minimum JSC of each contributing sub-cell.[34]
Hence, a smaller fraction of absorbed
light can be proposed for the back cell and thus limiting the overall JSC and PCE of the
multi-junction solar cells. However, increasing the number of stacked sub-cells leaded
to higher layer thicknesses corresponding to an improved light absorption behavior
(Figure 30). Moreover, the Rs-value increased and the FF declined with higher number
of stacked sub-cells. Single- and bi-junction solar cells exhibited comparable
efficiencies, whereas the PCE-value significantly decreased for the triple-junction
device. This is due to the tremendous increase in the series resistance and the lower FF,
which can be assigned to the s-shaped curves obtained from the I-V measurements of
the triple-junction solar cells. Since a VOC and Vmpp exceeding 1.15 V was achieved
with the tandem approach, bi-junction solar cells were used as photovoltaic system for
the integrated solar battery hybrid device.
Figure 30: Absorption spectra of PCDTBT:[70]PCBM (1:2 w/w) single-, bi- and triple-junction
solar cells in the range of 385-800 nm
Page 54
Results and Discussion
42
2.1.3 Multi-Junction Solar Cells for Solar Battery Hybrid Devices
In order to determine the impact of the electrode geometry and active electrode area on
the device performance of multi-junction solar cells, Ti/Cu electrodes with square
(0.09 cm²) and circular (0.79 cm²) geometry were used as electrical contact for
PCDTBT:[70]PCBM (1:2 w/w) tandem solar cells (Figure 31).
Figure 31: (A) J-V curves of multi-junction solar cells for the solar battery hybrid device with an
active area of 0.79 cm² compared to multi-junction solar cells with 0.09 cm² electrode area and a
single-junction solar cell. (B) PCDTBT:[70]PCBM multi-junction solar cells with square and
circular electrode geometry.
For tandem solar cells with Ag/MoO3 intermediate layers, the geometry of the electrode
and the active electrode area exhibited only a minor effect on the device performance.
Using square electrodes, for example, a slight decline in VOC, FF and thus in PCE were
obtained, whereas the JSC was unaffected. Compared with tandem solar cells with
Al/MoO3 intermediate layers, a significant influence of electrode geometry and active
area on the device performance was observed. Using square electrodes an s-shaped
J-V curve was obtained yielding a drop in VOC, FF and PCE but a slight increase in the
JSC. Even though solar cells with square electrode geometry showed better photovoltaic
characteristics, solar cells with circular electrode geometry were required for the
fabrication of integrated solar battery hybrid devices. The average series resistance Rs
and shunt resistance Rsh of standard tandem solar cells for the hybrid device with a
1 nm Al and 15 nm MoO3 intermediate layer was determined to be 240±70 Ω cm² and
1.83±0.68 kΩ cm², respectively.
A B
Page 55
Results and Discussion
43
2.1.4 Characterization
2.1.4.1 Optical Band Gap Determination
In order to determine the optical band gap (Eg) of various conjugated polymers
(PCDTBT, PSiF-DBT, PCPDTBT, F8T2), polymer thin films were prepared by doctor
blading of the respective polymer solution (10 mg/mL, in chlorobenzene) onto
pre-cleaned and oxygen plasma etched microscope slides. The optical band gaps were
ascertained from the onset of the absorption spectra of the polymer thin films.
Figure 32 shows absorption spectra of polymer thin films for determination of the
optical band gaps. The experimental optical band gaps of PCDTBT (1.85 eV),
PSiF-DBT (1.82 eV), PCPDTBT (1.45 eV) and F8T2 (2.38 eV) matched with the
Eg-values reported in the literature.[69,95–97]
Figure 32: Optical band gaps of PCDTBT, PSiF-DBT, PCPDTBT and F8T2 polymer thin films
determined from the onset of the absorption spectra
Page 56
Results and Discussion
44
2.1.4.2 External Quantum Efficiency (EQE)
For the determination of the external quantum efficiency, single-junction solar cells
with a MoO3 hole-transport layer, a PCDTBT:[70]PCBM (1:2 w/w) active layer, and a
Ti/Cu top electrode were prepared as described in Chapter 3.2. The external quantum
efficiency was measured under nitrogen atmosphere in the range of 350-800 nm using
an IPCE (incident photon-to-current efficiency) measuring unit. The recorded
EQE-spectra of two single-junction solar cells with different layer thicknesses, and the
absorption spectra of a PCDTBT thin film and a PCDTBT:[70]PCBM (1:2 w/w) single-
junction solar cell are shown in Figure 33.
Figure 33: (A) External quantum efficiency in the visible region of two single-junction solar cells
with PCDTBT:[70]PCBM active layers having a total layer thickness of 94 nm and 121 nm, and
absorption spectra of a PCDTBT thin film and a PCDTBT:[70]PCBM (1:2 w/w) single-junction
solar cell. (B) Reference AM 1.5 Spectra (ASTM G173-03 solar AM 1.5 emission spectrum)[98,99]
Considering the recorded EQE-spectra, PCDTBT:[70]PCBM solar cells showed a broad
wavelength range for high photo-current generation with EQE-values over 35%
between 380-520 nm and 380-580 nm depending on active layer thickness.
Furthermore, EQE peak maxima at 390 nm, 460-480 nm, and 510 nm with EQE-values
exceeding 36% were determined. In this way, the most important part of the solar
emission spectrum (AM 1.5, Figure 33), namely the peak maximum in the solar
emission spectrum, is covered.
A B
Page 57
Results and Discussion
45
With regard to the determined EQE-values, approx. 1/3 of the incident photons succeed
in the formation of a separated pair of charge carriers that are collected at the electrodes.
The prepared single-junction solar cells exhibited similar EQE-spectra but lower EQE-
values in comparison to the ones reported in the literature for PCDTBT:[70]PCBM-
based BHJ solar cells with a PEDOT:PSS hole-transport layer and Al electrodes
(40-50% in the range of 350-600 nm).[7]
A further improvement of EQE-values
(about 60% in the range of 380-590 nm) was reported by spin-casting of the active layer
from DCB, by adjusting the donor:acceptor ratio (1:4 w/w) and by modifying the top
electrode (TiOx/Al or LiF/Al).[65,100]
Page 58
Results and Discussion
46
2.2 Lithium-Ion Battery Electrode Materials
Lithium-ion battery electrode materials, namely lithium titanate (Li4Ti5O12), cobalt
diantimonide (CoSb2) and cobalt triantimonide (CoSb3), were prepared and investigated
with regard to an application in integrated solar battery hybrid devices. These materials
were chosen for the assembling of low-voltage lithium-ion batteries providing a battery
voltage up to 1.15 V vs. Li/Li+. This was necessary since the battery voltage needed to
be matched to the relatively low voltage supplied by the photovoltaic system, which
was up to about 1.40 V (Vmpp), in order to charge the battery upon illumination of the
solar cell. The electrode materials were characterized in half- and full-cell configuration
using three-electrode Swagelok cells via common electrochemical methods such as
cyclic voltammetry (CV), galvanostatic cycling with potential limitation (GCPL),
galvanostatic intermittent titration technique (GITT), and potentio electrochemical
impedance spectroscopy (PEIS) in order to get information about the electrochemical
behavior of the active materials such as the specific charge/discharge capacity, the
Coulombic efficiency, the cycling stability, the Li+ diffusion coefficient in the active
materials and the dynamic resistance of the galvanic cell.
2.2.1 Lithium Titanate (Li4Ti5O12, LTO)
Lithium titanate is a promising anode material for rechargeable lithium-ion batteries
because of a high theoretical specific capacity (175 mAh/g), a good cycling behavior
with highly reversible Li ion insertion/extraction, structural stability upon lithiation/
de-lithiation processes, a good mobility of Li ions, and a stable voltage plateau at about
1.55 V vs. Li/Li+.[48–53]
This discharge/charge plateau is attributed to the redox reaction
of Ti4+
/Ti3+
in the lithium titanate host lattice and the corresponding two-phase
transition between spinel LTO (Li4Ti5O12) and rock-salt LTO (Li7Ti5O12) upon
reversible Li ion insertion/extraction processes (Scheme 1).[50,101]
This implies that
Li ions are inserted into the spinel-structured LTO under formation of rock-salt LTO
during discharge, and that Li ions are extracted out of the rock-salt LTO,
Page 59
Results and Discussion
47
forming spinel LTO during charging.[48,101]
Upon discharging, up to three Li ions are
inserted per formula unit without considerable volume change (zero-strain insertion).[51]
The insertion reaction corresponds to the reduction of three Ti4+
ions to Ti3+
and the
extraction process to the oxidation of three Ti3+
ions to Ti4+
.
Scheme 1: Two-phase transition reaction of lithium titanate upon reversible Li ion insertion/
extraction processes[50]
Because of these advantageous characteristics, lithium titanate was selected as electrode
material for solar battery hybrid devices. For this purpose, lithium titanate composite
electrodes were prepared by ball milling and doctor blading of the LTO-based slurry
composite on a copper foil as described in Chapter 3.3.1. The electrode material was
electrochemically characterized in half-cell configuration via cyclic voltammetry in
order to get information about the practical capacity and the chemical diffusion
coefficient of Li+ in the lithium titanate host lattice. In addition to that, galvanostatic
cycling measurements were made to determine the discharge/charge capacity, the
Coulombic efficiency and the cycling stability of the electrode material.
2.2.1.1 Cyclic Voltammetry
For electrochemical characterization of lithium titanate, the electrode material was
assembled as working electrode in a three-electrode Swagelok cell in half-cell
configuration with lithium metal as both counter and reference electrode. Figure 34
shows the cyclic voltammogram of lithium titanate, which was recorded in the range of
1.0-2.0 V vs. Li/Li+ using different scan rates.
Page 60
Results and Discussion
48
The CV measurement started with a reduction reaction resulting in a cathodic potential
peak Ep,c at 1.49 V vs. Li/Li+, followed by an oxidation with an anodic potential peak
Ep,a at 1.64 V vs. Li/Li+. During these steps, Li ions are inserted into and extracted out
of the electrode material accompanied by the reversible two-phase transition between
spinel- and rock-salt-structured LTO. In the subsequent reductive and oxidative half-
cycles the cathodic and anodic potential peaks were located in the range of 1.47-1.51 V
and 1.63-1.77 V vs. Li/Li+, respectively.
Figure 34: Cyclic voltammogram of lithium titanate in the potential range of 1.0-2.0 V vs. Li/Li+ at
various scan rates. Cathodic/anodic peaks are associated with Li ion insertion/extraction processes.
The formal potential E0’
, which is the arithmetic mean of cathodic (Ep,c) and anodic
peak potentials (Ep,a)[102]
𝐸0´ =𝐸𝑝,𝑐 + 𝐸𝑝,𝑎
2
(Eq. 1)
was determined to be 1.59±0.02 V vs. Li/Li+. The corresponding cathodic/anodic peaks
can be attributed to the reversible redox reaction of the Ti4+
/Ti3+
redox couple in the
lithium titanate lattice, which is reported to take place at 1.55 V vs. Li/Li+.[48]
Page 61
Results and Discussion
49
The peak separation ΔEp for a reversible system, which is defined as the difference in
anodic and cathodic peak potentials,
∆𝐸𝑝 = 𝐸𝑝,𝑎 − 𝐸𝑝,𝑐
(Eq. 2)
is independent from the scan rate and should present a ΔEp-value of about 59 mV for a
fully reversible one-electron reaction.[102]
With regard to the examined LTO electrode
material, the peaks in the cyclic voltammogram got broader and the anodic potential
peaks were shifted to higher values by increasing the scan rate, whereas the cathodic
ones remained constant. This means that the peak separation ΔEp increased at higher
scan rates and thus indicates electrochemical quasi-reversible or irreversible behavior of
the redox system. This might be based on slow electron transfer processes at the
electrode surface[102]
or, more likely in this case, is due to a slow diffusivity (mass
transport) of Li ions from the surface to the bulk of the LTO material.
In addition to that, the peak current ratio, which is calculated from the modulus of the
ratio of the cathodic (ip,c) and anodic (ip,a) peak currents, decreased with increasing scan
rate and was determined to be below 1.0 for all scan rates.
𝑃𝑒𝑎𝑘 𝐶𝑢𝑟𝑟𝑒𝑛𝑡 𝑅𝑎𝑡𝑖𝑜 = | 𝑖𝑝,𝑐
𝑖𝑝,𝑎 |
(Eq. 3)
The peak current function, which is defined as the ratio of the peak current ip to the
square root of the scan rate, ν1/2
,
𝑃𝑒𝑎𝑘 𝐶𝑢𝑟𝑟𝑒𝑛𝑡 𝐹𝑢𝑛𝑐𝑡𝑖𝑜𝑛 = 𝑖𝑝
𝜈1/2
(Eq. 4)
of the examined lithium titanate electrode material was found to show a slight
dependence on varying scan rates. This gives information about an irreversible behavior
of the electrode material, which can be due to aforementioned slow electron transfer
processes at the electrode surface[102]
or to relatively sluggish ion transport in the active
material.
Page 62
Results and Discussion
50
A graphical representation of the peak separation, the peak current ratio and the peak
current function as function of the logarithm of the scan rate for the respective first and
second cycles is shown in Figure 35.
Figure 35: (A) Peak separation ΔEp and peak current ratio, and (B) peak current function as
function of the logarithm of the scan rate ν of lithium titanate
The practical capacity of lithium titanate was determined from the first anodic
half-cycle of the cyclic voltammogram via peak integration. The specific practical
capacity of lithium titanate was 112.5 mAh/g, which is significant lower compared to
the theoretical capacity (175 mAh/g).[48]
This can be ascribed to the non-optimized
electrode preparation. In this case, not all of the LTO active material is in electronic
contact, through the conductive carbon, with the copper current collector. It has to be
noticed that lithium titanate has a significantly lower theoretical specific capacity
compared to metallic lithium (3,860 mAh/g).[103]
With regard to the theoretical
gravimetric capacity, lithium titanate would be a less favorable electrode material
compared to metallic lithium but lithium metal electrodes have to face problems with
lithium dendrites growth and low Coulombic efficiencies.[103]
Thus, metallic lithium in
its pristine form is not an alternative for good performance battery.
A B
Page 63
Results and Discussion
51
In order to determine the chemical diffusion coefficient D of Li+ in the lithium titanate
electrode material via cyclic voltammetry, the Randles-Sevcik equation for an
irreversible electrochemical reaction at planar electrodes was used.[104,105]
𝑖𝑝 = 0.4958 × 𝑛𝐹𝐴𝐶𝐷1/2 × (𝛼𝑛𝑎𝐹
𝑅𝑇)
1/2
× 𝜈1/2
(Eq. 5)
where ip is the peak current in A, n and na are the numbers of electrons, F is the Faraday
constant in As mol-1
, A is the surface area of the electrode in cm², C is the concentration
of maximum obtainable Ti3+
centers in the lattice, i.e., 22.9×10⁻³
mol cm-³, D is the
chemical diffusion coefficient of the electro-active species in cm² s-1
, α is the transfer
coefficient taken as 0.5, R is the ideal gas constant in J mol-1
K-1
, T is the absolute
temperature in K, ν is the scan rate in V s-1
.
The surface area of the electrode was estimated from the mean particle size of
LTO EXM 1037 (Süd-Chemie) electro-active material. The average particle size
determined via light scattering was found to be 2.4±0.1 µm, which matched quite well
with the d50-value of ca. 2.3 µm reported for the particle size distribution in the
specification sheet of LTO EXM 1037.[106]
Assuming spherical particles, the developed
electrode surface area corresponding to the LTO active material was calculated to be
about 13 cm² for an electrode disk 9.5 mm in diameter. The specific surface area was
estimated to be 0.74 m²/g, which is only about a fourth of the typical specific surface
area of the active material determined by Brunauer-Emmet-Teller (BET) analysis.[106]
Figure 36: Determination of the chemical diffusion coefficient of Li
+ in lithium titanate via Randles-
Sevcik method: Cathodic and anodic peak currents are plotted versus the square root of v
Page 64
Results and Discussion
52
Figure 36 shows the anodic and cathodic peak current ip as function of the square root
of the scan rate, ν1/2
. The peak currents show linear dependence on ν1/2
. Based on this
graphical representation, the chemical diffusion coefficient D was calculated from the
slope of the regression line. The chemical diffusion coefficient of Li+ in the lithium
titanate host lattice was determined to be 1.8×10⁻¹²
cm²/s / 6.0×10⁻¹⁴
cm²/s (using
anodic/cathodic peak currents). The results match quite well with the values reported in
the literature, where chemical diffusion coefficients in the range of 10-8
-10-15
cm²/s were
determined, depending on the particle size, the preparation procedure and the
electrochemical method.[51,107–109]
Consequently, Li ion extraction processes in the
prepared LTO electrodes take place at a higher rate compared to the insertion processes
and therefore are kinetically preferred.
2.2.1.2 Galvanostatic Cycling with Potential Limitation
Based on the data of the previous CV experiment, the potential limits for the GCPL
experiment of lithium titanate were set to 1.0 and 1.8 V vs. Li/Li+. The galvanostatic
cycling measurement was performed at two different C-rates, namely C/2 and C/5, each
one for 50 cycles.
Figure 37 shows the discharge and charge cycling performance as well as the
Coulombic efficiency of lithium titanate. The initial discharge/charge capacity was
determined to be 157 / 74 mAh/g. The discharge capacity significantly dropped to
87 mAh/g in the 2nd
cycle, whereas the charge capacity slightly increased to 78 mAh/g.
Afterwards both values stabilized at about 80 mAh/g at a C-rate of C/2 and at
100 mAh/g at C/5. In addition to that, lithium titanate showed a low initial Coulombic
efficiency of only 47%. The Coulombic efficiency value increased to 97% in the
10th
cycle, first exceeded 98% in the 16th
cycle and stabilized at about 99% in the
following cycles. Lithium titanate showed a quite good electrochemical behavior and
cycling stability.
Page 65
Results and Discussion
53
Figure 37: Discharge and charge cycling performance as well as the Coulombic efficiency of lithium
titanate cycled at C-rates of C/2 and C/5 in the potential range of 1.0-1.8 V vs. Li/Li+
Figure 38 shows voltage profile curves of lithium titanate and the state of Li ion
insertion/extraction for various cycles, which where galvanostatically cycled at C/2 in
the potential range of 1.0-1.8 V vs. Li/Li+. The discharge/charge voltage profiles of
lithium titanate showed a flat voltage plateau at about 1.50-1.55 V vs. Li/Li+ with very
low polarization (below 50 mV). This plateau can be assigned to reversible Li ion
insertion/extraction processes in the lithium titanate host lattice, which is accompanied
by the two-phase transition between spinel- and rock-salt-structured LTO.[50,101]
The
discharge capacity (lithiation reaction) decreased drastically from an initial capacity of
157 mAh/g to 85 mAh/g in the 5th
cycle, followed by a stabilization at about 80 mAh/g
up to the 50th
cycle. In comparison to that, the charge capacity (de-lithiation reaction) in
the initial cycle (74 mAh/g) slightly increased to approximately 80 mAh/g in the
following cycles.
With regard to the composition of the lithium titanate material, Li4+xTi5O12 (x = 2.68)
was initially formed upon Li+ insertion during galvanostatic cycling. In the subsequent
Page 66
Results and Discussion
54
Li+ extraction process, most of the inserted alkali metal ions were removed giving an
averaged composition of Li4+xTi5O12 (x = 1.26). The lithium titanate composition
stabilized at x = 1.3-1.4 in the followed cycles.
Figure 38: Galvanostatic discharge/charge voltage curves and state of Li ion insertion/extraction of
lithium titanate cycled at C/2 for the 1st, 5
th, 10
th, 25
th, and 50
th cycle
Page 67
Results and Discussion
55
2.2.2 Cobalt Diantimonide (CoSb2) and Cobalt Triantimonide (CoSb3)
Co-Sb intermetallic compounds such as CoSb2 and CoSb3 are potential alternative
anode materials for rechargeable lithium-ion batteries because of a good
electrochemical performance, improved theoretical capacities (CoSb2: 530 mAh/g[110]
,
CoSb3: 569 mAh/g[111]
) compared to graphite (372 mAh/g)[55]
, flat voltage plateaus,
a good cycling stability, and less volume change problems compared to pure
antimony.[54,55]
This reduced volume expansion is due to the presence of Li-inert
cobalt.[54,55]
Two possible reactions of Co-Sb intermetallic compounds (CoSby) with
Li ions can be proposed (Scheme 2): Lithium reacts with Co-Sb intermetallics under
formation of (i) a Li-based ternary LixCoSby phase by an insertion/addition reaction or
(ii) a Li3Sb phase well-dispersed in a cobalt matrix through a conversion reaction.[54,57]
Scheme 2: Insertion/addition reaction and conversion reaction of Co-Sb intermetallic compounds
with lithium[54]
Because of these advantageous characteristics, cobalt diantimonide and cobalt
triantimonide were selected as electrode materials for solar battery hybrid devices. For
this purpose, CoSb2 and CoSb3 electrodes were prepared via mechanical alloying by
ball milling of stoichiometric amounts of the respective metal powders and doctor
blading of the Co-Sb-based slurry on a copper foil as described in Chapter 3.3.2.
Subsequently, the Co-Sb intermetallic compounds were electrochemically characterized
in half-cell configuration via cyclic voltammetry in order to get information about the
practical capacity and the diffusion coefficient of Li+ in the CoSb2 and CoSb3 lattice. In
addition to that, galvanostatic cycling measurements were made to determine the
discharge/charge capacity, the cycling stability and electrochemical behavior of the
electrode materials.
Page 68
Results and Discussion
56
2.2.2.1 Cyclic Voltammetry
For electrochemical characterization of cobalt di- and triantimonide via cyclic
voltammetry, the electrode materials were assembled as working electrode in three-
electrode Swagelok cells in half-cell configuration with lithium metal as both counter
and reference electrode. Figure 39 shows the cyclic voltammogram of CoSb2 and
CoSb3, which was recorded in the region of 0.1-2.0 V vs. Li/Li+ using different scan
rates.
Figure 39: (A) Cyclic voltammogram of CoSb2 and CoSb3 in the potential range of 0.1-2.0 V
vs. Li/Li+
at various scan rates. (B) 1st and 2
nd cycle of the cyclic voltammogram of CoSb2 and CoSb3
at a scan rate of 0.1 mV/s.
Basically, cathodic peaks occurring in the reductive half-cycle and anodic peaks in the
oxidative half-cycle correspond to Li ion insertion/extraction processes with respect to
the electrode material. For CoSb2, the initial cathodic and anodic potentials peaked at
0.39 V / 0.52 V and 1.07 V vs. Li/Li+, respectively. In the second cycle, the cathodic
peaks were shifted to 0.71 V and 0.78 V, whereas the anodic one remained constant. For
A
B
Page 69
Results and Discussion
57
subsequent reduction-oxidation half-cycles, the Ep,c and Ep,a values were located in the
range of 0.50-0.72 V and 1.08-1.39 V vs. Li/Li+. The initial reductive and oxidative
potentials of CoSb3 were located at 0.39 V / 0.78 V with a shoulder at 0.52 V, and
1.09 V vs. Li/Li+. In the second cycle, the cathodic peaks were shifted to 0.81 V,
whereas the anodic one remained constant. For the subsequent reduction-oxidation
processes, the peak potentials were found in the range of 0.40-0.81 V and 1.09-1.44 V
vs. Li/Li+. Shifts of the cathodic potential peaks from the first to the second cycle give
information about irreversible processes occurring during the first reduction reaction.
During the first reductive half-cycle, an irreversible decomposition of the CoSby
(y = 2,3) solid takes place concomitant with the reaction with lithium under formation
of a Li3Sb phase well-dispersed in a cobalt matrix via a conversion reaction.[54,57]
The
peak in the first oxidative half-cycle can be attributed to the de-alloying of the
Li3Sb phase forming antimony dispersed in a cobalt matrix without reconstructing
CoSby.[54,112]
Because of this irreversible decomposition, the cathodic peaks shifted to
0.71-0.81 V vs. Li/Li+
in the second cycle. The oxidation peaks, in contrast, remained
unaffected. The reduction/oxidation peaks in the subsequent cycles can be assigned to
reversible antimony alloying/de-alloying processes.
The formal potential E0’
of the examined Co-Sb intermetallics was determined to be
0.94±0.02 V vs. Li/Li+ (for CoSb2) and 0.94±0.01 V vs. Li/Li
+ (for CoSb3). The
corresponding cathodic peaks are attributed to the formation of the binary Li3Sb phase
(0.948 V) and cobalt, whereas the oxidation peaks are assigned to the de-alloying of the
Li3Sb phase forming amorphous antimony dispersed in a cobalt matrix without
reconstruction of CoSby.[44,54,57,112]
By increasing the scan rate, the cathodic and anodic potential peaks in the cyclic
voltammogram of both CoSb2 and CoSb3 got broader and were shifted tendentially to
lower and higher values. Consequently, the peak separation ΔEp showed non-linear
dependence on the scan rate (Figure 40), which might be based on slow electron transfer
processes at the electrode surface[102]
or, more likely in this case, is due to a slow
diffusivity (mass transport) of Li+ from the surface to the bulk of the cobalt antimonide
material. This indicates a quasi-reversible or irreversible behavior of the redox system,
which is supported by a peak separation exceeding 59 mV for a one-electron reaction.
Page 70
Results and Discussion
58
Comparing the cathodic and anodic current peaks in the cyclic voltammogram, CoSb2
exhibited slightly higher currents and hence improved electrochemical activities
compared to CoSb3. In addition to that, the peak current ratio increased at higher scan
rates for both CoSb2 and CoSb3 (Figure 40). A current ratio exceeding 1.0 was found for
scan rates higher than 1 mV/s for CoSb2 compared to 0.2 mV/s for CoSb3. The peak
current function exhibited only a minor dependence on the scan rate in particular at
higher scan rates.
Figure 40: (A) Peak separation ΔEp and peak current ratio, and (B) peak current function as
function of the logarithm of the scan rate ν of CoSb2 and CoSb3
The specific practical capacities of CoSb2 and CoSb3 were calculated from the second
and first anodic half-cycle of the cyclic voltammogram by peak integration. Hence, the
specific capacities of CoSb2 and CoSb3 were determined to be 350 mAh/g and
373 mAh/g, respectively. Both values are far below the theoretical capacities of CoSb2
(530 mAh/g)[110]
and CoSb3 (569 mAh/g)[111]
reported in the literature. The Co-Sb
intermetallics exhibited a significant lower theoretical capacity compared to pure
antimony (660 mAh/g, based on the formation of Li3Sb), which is due to the presence of
Li-inert cobalt.[55,113]
Nevertheless, cobalt antimonides show preferable electrochemical
characteristics since pure antimony electrodes face structural stability problems based
on large volume expansion resulting from repetitive discharge/charge reactions.[54]
A
B
Page 71
Results and Discussion
59
The chemical diffusion coefficients D of Li+ in the CoSb2 and CoSb3 electrode materials
were determined via cyclic voltammetry using the Randles-Sevcik equation for an
irreversible electrochemical reaction at planar electrodes[104]
, as described in (Eq. 5. The
concentration of maximum obtainable Sb centers in the lattice was 55.2×10⁻³
mol/cm³
for CoSb2 and 54.0×10⁻³
mol/cm³ for CoSb3. The surface areas of the electrodes were
estimated from the mean particle sizes of the ball milled cobalt antimonides. The
average particle sizes of CoSb2 (2.6±0.4 µm) and CoSb3 (4.1±1.2 µm) were determined
via light scattering. Assuming spherical particles, the electrode surface areas were
calculated to be 5.6 cm² (CoSb2) and 3.7 cm² (CoSb3) for an electrode disk 9.5 mm in
diameter. The corresponding specific surface area values of 0.26 m2/g (CoSb2) and
0.19 m²/g (CoSb3) are in good agreement with the BET surface for CoSb3 (0.26 m²/g)
reported in the literature.[114]
The peak currents were found to show a linear dependence
on ν1/2
for both CoSb2 and CoSb3 (Figure 41). Based on this graphical representation,
the chemical diffusion coefficients D of Li+ in the Co-Sb intermetallic lattices were
calculated from the slope of the regression line.
Figure 41: Determination of the chemical diffusion coefficients of Li+ in cobalt antimonides via
Randles-Sevcik method: Cathodic and anodic peak currents are plotted versus v1/2
for (A) CoSb2
and (B) CoSb3
Table 4 shows that the Li+ diffusion coefficients in both CoSb2 and CoSb3 are in a
similar range of 1.1-2.5×10⁻¹¹
cm²/s but are higher for the alkali metal ion diffusion in
the cobalt triantimonide. However, both cobalt antimonides have significant higher
chemical diffusion coefficients of one to three orders of magnitudes compared to
lithium titanate.
A B
Page 72
Results and Discussion
60
Table 4: Chemical diffusion coefficient D of Li+ in cobalt antimonides determined via cyclic
voltammetry
Chemical Diffusion Coefficient of Li+
[cm²/s]
using anodic peak currents
using cathodic peak currents
CoSb2
1.1×10⁻¹¹
1.4×10⁻¹¹
CoSb3
2.5×10⁻¹¹
2.4×10⁻¹¹
2.2.2.2 Galvanostatic Cycling with Potential Limitation
Galvanostatic cycling measurements of CoSb2 and CoSb3 were performed at two
different C-rates, namely C/2 and C/5, each one for 50 cycles in the potential range of
0.75 V to 1.1 V vs. Li/Li+. Because of relative low discharge and charge capacities, an
initial galvanostatic cycling sequence was introduced, which consisted of four cycles
cycled at C/2 within the potential limits of 0.2-1.1 V vs. Li/Li+. The low potential limit
in the first cycles was used to allow the formation of the electrode, as noticed in the
cyclic voltammetry experiment. Consequently, higher discharge and charge capacities
were obtained, which is due to the initial formation step occurring at lower potentials.
The discharge and charge cycling performance as well as the Coulombic efficiency of
CoSb2 and CoSb3 without and with the initial formation step are shown in Figure 42 and
Figure 43, respectively. Electrochemical characteristics of CoSb2 and CoSb3 are
summarized in Table 5.
Figure 42: Discharge and charge cycling performance as well as the Coulombic efficiency of CoSb2
cycled at C-rates of C/2 and C/5 (a) without and (b) with the initial formation step
Page 73
Results and Discussion
61
Figure 43: Discharge and charge cycling performance as well as the Coulombic efficiency of CoSb3
cycled at C-rates of C/2 and C/5 (a) without and (b) with the initial formation step
Table 5: Electrochemical characteristics of CoSb2 and CoSb3 determined by galvanostatic cycling
(a) without and (b) with the initial formation sequence
Electrode Formation
Sequence
1st discharge
capacity
[mAh g-1
]
1st charge
capacity
[mAh g-1
]
Initial Coulombic
efficiency
[%]
CoSb2
without
formation step
82 5 6
CoSb2
(initial / after formation step)
with
formation step 511 / 210 405 / 210 79 / 100
CoSb3
without
formation step
202 88 44
CoSb3
(initial / after formation step)
with
formation step 526 / 288 462 / 286 88 / 99
Page 74
Results and Discussion
62
Li insertions/extractions correspond to discharging/charging reactions. During the first
discharge cycle, an irreversible decomposition of the CoSby (y = 2,3) solid takes place
concomitant with the reaction with lithium under formation of a binary Li3Sb phase
well-dispersed in a cobalt matrix via a conversion reaction.[54,57]
In the first charging
cycle, Li ions are extracted from the Sb-alloy forming amorphous antimony dispersed in
cobalt without reconstructing CoSby.[54,112]
In case of nanostructured metals within this
composite, Tarascon et al. reported the conversion back to CoSb3 based on a chemical
reaction between antimony and cobalt nanograins during the Sb-dealloying process.[115]
However, upon galvanostatic cycling, reversible Li insertion/extraction steps can be
proposed concomitant with Li-Sb reactions at about 0.8 V vs. Li/Li+ involving Sb-alloy
formation/decomposition processes (Scheme 3).[54,57]
Scheme 3: Reaction mechanism of Li insertion/extraction during the first discharge/charge cycle
and on galvanostatic cycling of Co-Sb intermetallic compounds (CoSby, with y = 2,3)[54,115]
Comparing the cycling performances, lowering the potential limits for an initial
sequence in galvanostatic cycling measurements of CoSb2 and CoSb3 yielded a drastic
increase in both the discharge and charge capacity. CoSb2 exhibited a very poor
electrochemical behavior during first investigations with an initial discharge/charge
capacity of 82 / 5 mAh/g. By lowering the initial potentials in the galvanostatic cycling
experiment, the electrochemical performance drastically improved. The initial
discharge/charge capacity of CoSb2 in the first cycle was determined to be
511 / 405 mAh/g. A similar trend was also observable for cobalt triantimonide. The
discharge/charge capacity of CoSb3 in the first cycle increased from 202 / 88 mAh/g to
526 / 462 mAh/g. However, the initial discharge capacities of both examined cobalt
antimonides are lower compared to the theoretical capacities of CoSb2 (530 mAh/g[110]
)
and CoSb3 (569 mAh/g[111]
).
Page 75
Results and Discussion
63
Both materials showed an improved discharge/charge capacity after the initial formation
sequence with 210 / 210 mAh/g (CoSb2) and 288 / 286 mAh/g (CoSb3). Although
CoSb3 exhibited better discharge/charge capacities compared to CoSb2 in the first cycle
after the formation sequence, CoSb2 showed a better electrochemical behavior and
cycling stability during prolonged galvanostatic cycling. The discharge/charge
capacities of CoSb2 stabilized after about 15 cycles and remained constant afterwards,
whereas the discharge/charge capacities of CoSb3 dropped during prolonged cycling
showing a significant capacity fading with increasing number of cycles. Especially for
longer galvanostatic cycling experiments, CoSb2 showed a higher discharge/charge
capacity compared to CoSb3. The poor cycling stability and electrochemical behavior of
CoSb3, in particular the rapid decline in discharge/charge capacities, might be due to
tremendous volume changes resulting from repeated Li ion insertion/extraction during
discharge/charge reactions.[55]
According to Park et al., the same problem is basically
known for Sb-based systems.[54]
This volume expansion can be reduced by adding
Li-inert cobalt to the Li-active antimony with the obvious drawback of having even
lower capacities than CoSb3 with respect to pure antimony (660 mAh/g).[54,55]
Indeed,
an improved cycling stability and better electrochemical behavior was recorded for
CoSb2 because of higher amounts of the Li-inert cobalt and thus less problems with
regard to the aforementioned volume expansion of the electrodes. These irreversible
capacities of CoSb3 are associated with the lower potentials set for the initial formation
sequence. This is supported by the improved cycling behavior of CoSb3
galvanostatically cycled without the formation step but significant lower
discharge/charge capacities were obtained.
In addition to that, lowering the initial potential limits in galvanostatic cycling of
Co-Sb intermetallic compounds greatly affected the initial Coulombic efficiency. As a
result, the initial Coulombic efficiency in the 1st cycle increased from 6% to 79%
(for CoSb2) and from 44% to 88% (for CoSb3). Hence, both electro-active materials
showed a high initial Coulombic efficiency in the low-potential formation sequence.
The Coulombic efficiencies in the first cycle after the formation step were quite high
(100% for CoSb2, and 99% for CoSb3). During long-term galvanostatic cycling, CoSb2
showed a higher Coulombic efficiency exceeding 99% and a high-reversible cycling
behavior compared to CoSb3 (97-99%).
Page 76
Results and Discussion
64
As mentioned before, a positive impact on the cycling performance, discharge/charge
capacities and initial Coulombic efficiencies of both CoSb2 and CoSb3 was determined
by introducing an initial formation sequence with lower potential limitations. This
formation sequence is essential for a good cell performance, in particular for
high-capacity applications. It is based on the irreversible decomposition of the CoSby
solid concomitant with the formation of a binary Li3Sb phase at a potential of about
0.5 V vs. Li/Li+.[54,57]
Since galvanostatic cycling without the formation sequence was
performed in the potential range of 0.75 V to 1.1 V vs. Li/Li+, the Li3Sb phase was not
formed or only in small amounts leading to significant lower capacities. Lowering the
potential limits for galvanostatic cycling to 0.2-1.1 V vs. Li/Li+ was necessary for the
Li3Sb phase formation upon discharging, yielding a significant increase in the capacity
values. As a result of this formation sequence, a reversible alloying/de-alloying of
antimony upon galvanostatic cycling with enhanced discharge/charge capacities can be
proposed.
This is supported by the voltage profile curves of CoSb2 and CoSb3 shown in Figure 44.
During the initial discharge sequence of the formation step, small voltage plateaus at
0.87 V and 0.73 V vs. Li/Li+ were found for CoSb3, which are based on the irreversible
decomposition of the CoSby solid and successive formation of Li2Sb and Li3Sb
phases.[116]
Moreover, CoSb2 and CoSb3 both exhibited an edge at about 0.4-0.5 V vs.
Li/Li+, which can be assigned to the conversion to the Li3Sb alloy. The subsequent
discharge voltage plateaus were located at about 0.87 V vs. Li/Li+ and thus give
information about the presence of aforementioned irreversible reactions taking place in
the initial discharge process. However, the charge voltage curves remained unaffected
and were located at about 1.0 V vs. Li/Li+ corresponding to reversible de-alloying of the
formed Li3Sb phase.
Focusing on the voltage profile curves after the initial formation sequence
(Figure 44, B), both examined Co-Sb intermetallic compounds exhibited a voltage
plateau at about 0.94 V vs. Li/Li+ with a low polarization in the range of 150-200 mV.
This relative flat plateau, in particular in the first cycles, can be assigned to the
formation of Li3Sb (0.948 V vs. Li/Li+) upon irreversible decomposition of the CoSby
solid.[44]
Page 77
Results and Discussion
65
Figure 44: Galvanostatic discharge/charge voltage profile curves cycled at a C-rate of C/2 for
(A) the initial formation sequence of CoSb2 and CoSb3 and of (B) the 1st, 5
th, 10
th, 25
th, and 50
th cycle
after initial formation step of CoSb2 and CoSb3
Upon Li ion insertion in the initial discharge cycle, a reversible uptake of 2.4 Li
(for CoSb2) and 4.6 Li (for CoSb3) per formula unit were obtained. The subsequent
charging step showed highly reversible behavior since almost all inserted alkali metal
ions were extracted again. The composition of both Co-Sb intermetallics at the
50th
cycle after the initial formation sequence stabilized at about 1.15 Li (for CoSb2) and
2.2 Li (for CoSb3) per formula unit in discharged state, which is approximately half the
value compared to the initial discharge cycle.
With regard to the application of the electrode materials in full-cell configuration,
CoSb2 showed better electrochemical behavior, cycling stability and Coulombic
efficiencies during galvanostatic cycling but presented lower discharge/charge
capacities than CoSb3. The discharge/charge capacities of both CoSb2 and CoSb3 were
higher compared to lithium titanate (LTO), which limits the capacity of the full-cell.
Because of the advantageous electrochemical behavior of CoSb2 compared to CoSb3,
the cobalt diantimonide was preferably used for the full-cell configuration tests.
A
B
Page 78
Results and Discussion
66
2.2.3 Characterization of Electrode Materials in Full-Cell Configuration
After electrochemical characterization of the electro-active species (lithium titanate,
cobalt di- and triantimonide) in half-cell configuration, the performance of the electrode
materials was evaluated in full-cell configuration in three-electrode Swagelok cells.
Lithium titanate and the Co-Sb intermetallic compounds both are negative electrode
materials in conventional lithium-ion batteries operating at different electrochemical
potentials. For the assembling of a battery in full-cell configuration, LTO was used as
positive electrode (about 1.55 V vs. Li/Li+[48]
), CoSby (y = 2,3) as negative electrode
(about 0.95 V vs. Li/Li+[44]
) and metallic lithium as reference electrode. The theoretical
potential difference between the positive and negative electrode is therefore about 0.6 V
vs. Li/Li+, which should match with the voltage at the maximum power point (Vmpp)
supplied by the tandem solar cell. This is important for charging and discharging of the
battery since this set-up should be used in the integrated power pack.
The electrochemical characterization of the electrode materials in full-cell configuration
included a GITT experiment in order to pre-lithiate the Co-Sb intermetallic compounds
for subsequent galvanostatic cycling measurements. This is a necessary step since none
of the chosen materials contain lithium in their pristine form. GCPL tests were
performed in order to evaluate the cycling stability and electrochemical behavior
(discharge/charge capacity, Coulombic efficiency) of the battery. PEIS measurements
were carried out in order to determine the dynamic resistance and impedance of the
battery.
2.2.3.1 Galvanostatic Intermittent Titration Technique
For pre-lithiation of the Co-Sb intermetallic electrodes for subsequent GCPL tests, a
GITT experiment was performed comprising a series of galvanostatic current pulses at a
C-rate of C/20 interrupted by 30 min relaxation periods. During these negative current
pulses, Li ions are inserted into the electrode material under formation of pre-lithiated
CoSby electrodes, which are referred to as “LixCoSb2” and “LixCoSb3” in the following
chapters. Figure 45 shows the GITT curves for the lithiation process of CoSb2 and
CoSb3.
Page 79
Results and Discussion
67
Figure 45: Galvanostatic intermittent titration technique curves for the pre-lithiation of (A) CoSb2
and (B) CoSb3 in three-electrode Swagelok cells. Insets show potential curves as function of time.
During the insertion of Li ions into the Co-Sb intermetallic compound electrodes, an
irreversible decomposition of the CoSby solid takes place concomitant with the reaction
with lithium forming a well-dispersed mixture of a binary Li3Sb phase dispersed in
cobalt via a conversion reaction.[54,57]
The plateaus in the GITT curves can be assigned
to Li-Sb reactions upon successive formation of Li2Sb and Li3Sb phases during Li ion
insertion.[54,116]
2.2.3.2 Galvanostatic Cycling with Potential Limitation
In order to determine the cycling performance of the examined electrode materials in
full-cell configuration, three-electrode Swagelok cells from the GITT experiment were
used comprising LTO as working electrode (WE), lithiated Co-Sb intermetallic
compounds (“LixCoSb2” and “LixCoSb3”) as counter electrode (CE) and lithium metal
as reference electrode (RE). The galvanostatic cycling experiments were performed at
C-rates of C/2 and C/5 with respect to the LTO electrode each one for 26 cycles. The
potential limits of LTO (1.3-1.8 V vs. Li/Li+), “LixCoSb2” (0.65-1.0 V vs. Li/Li
+) and
“LixCoSb3” (0.65-1.1 V vs. Li/Li+) were chosen based on preliminary experiments. The
respective galvanostatic cycling curves over time are shown in Figure 46.
A B
Page 80
Results and Discussion
68
Figure 46: Galvanostatic cycling curves over time for (A) “LixCoSb2”/LTO and
(B) “LixCoSb3”/LTO. EWE refers to the potential at the LTO electrode vs. Li, ECE to potential at the
“LixCoSby” electrode vs. Li and EWE-ECE to the potential of the full-cell battery device.
Figure 47 shows the discharge and charge cycling performance as well as the
Coulombic efficiency of “LixCoSb2”/LTO and “LixCoSb3”/LTO full-cells cycled at a
C-rate of C/2 and C/5. The respective electrochemical characteristics are summarized in
Table 6.
Figure 47: Discharge and charge cycling performance as well as the Coulombic efficiency of
“LixCoSb2”/LTO and “LixCoSb3”/LTO full-cells cycled at C-rates of C/2 and C/5
A B
Page 81
Results and Discussion
69
Table 6: Electrochemical characteristics of “LixCoSb2”/LTO and “LixCoSb3”/LTO
Battery
1st discharge
capacity
[mAh g-1
]
1st charge
capacity
[mAh g-1
]
Initial Coulombic
efficiency
[%]
“LixCoSb2” / LTO
120 37 31
“LixCoSb3” / LTO
146 61 42
During discharge processes, Li ions are extracted out of the pre-lithiated Co-Sb
intermetallic compounds, namely from the Li3Sb phase, and inserted into the lithium
titanate lattice, which is accompanied by the two-phase transition of the spinel LTO into
the rock-salt LTO.[50]
The “LixCoSby” electrode material is converted to disordered
antimony and cobalt providing a well-dispersed solid mixture.[54]
During charging,
Li ions are extracted out of the rock-salt LTO concomitant with the successive Sb-alloy
formation at about 0.8 V vs. Li/Li+.[54,57]
The rock-salt LTO material is converted back
to the spinel-type LTO.
Comparing the initial capacities of both full-cell assemblies, “LixCoSb3”/LTO showed
better discharge/charge capacities (146 / 61 mAh/g) compared to “LixCoSb2”/LTO
(120 / 37 mAh/g). However, the “LixCoSb3”/LTO full-cell exhibited a rapid decline of
the specific capacity in the first cycles, followed by a significant capacity fading. The
values stabilized at about 62 mAh/g (C/2) and 80 mAh/g (C/5). A similar trend was also
observed for CoSb3 in half-cell configuration (Chapter 2.2.2.2). In contrast,
“LixCoSb2”/LTO showed a better cycling stability and electrochemical behavior during
prolonged galvanostatic cycling. After a decline in the discharge capacity in the first
cycles, the values remained constant at approximately 55 mAh/g (C/2) and 67 mAh/g
(C/5). The charge capacities, on the other hand, increased after the initial cycle,
followed by a similar decline compared to the discharge capacity counterpart. Similar to
the galvanostatic cycling experiment in half-cell configuration, the “LixCoSb2”/LTO
battery showed less capacity decay than the “LixCoSb3”/LTO battery. As mentioned
before, the poor cycling stability and electrochemical behavior, namely the rapid decline
in discharge/charge capacity, might be caused by volume expansion effects in Sb-based
systems resulting from repeated Li-insertion/extraction during galvanostatic cycling.[55]
Page 82
Results and Discussion
70
However, both full-cell assemblies showed low initial Coulombic efficiencies (31% for
“LixCoSb2”/LTO, 42% “LixCoSb3”/LTO) but stabilized over 97% after the 10th
cycle.
During long-term galvanostatic cycling, both batteries showed similar Coulombic
efficiencies exceeding 97%.
Figure 48 shows the galvanostatic discharge/charge voltage profiles of “LixCoSb2”/LTO
and “LixCoSb3”/LTO batteries cycled at a C-rate of C/2 for a various number of cycles.
Both full-cell battery devices showed a flat voltage plateau at about 1.55 V vs. Li/Li+
with very low polarization in the range of 50-70 mV (“LixCoSb2”/LTO) and 40-60 mV
(“LixCoSb3”/LTO). This plateau can be assigned to the insertion/extraction processes of
Li ions into the lithium titanate lattice.[50]
Figure 48: Galvanostatic discharge/charge voltage profile curves of (A) “LixCoSb2”/LTO and
(B) “LixCoSb3”/LTO cycled at a C-rate of C/2 for the 1st, 5
th, 10
th, and 25
th cycle
Based on the galvanostatic cycling experiment, “LixCoSb2”/LTO showed better
electrochemical behavior and cycling stability but lower initial discharge/charge
capacities compared to the “LixCoSb3”/LTO battery. This is why the “LixCoSb2”/LTO
set-up was preferably used for integrated solar battery hybrid devices.
A B
Page 83
Results and Discussion
71
2.2.3.3 Determination of the Dynamic Resistance and Impedance
The dynamic resistance and impedance of the full-cell configuration were determined
using a series of linked DC (direct current) and AC (alternating current) measurement
techniques comprising galvanostatic cycling and potentio electrochemical impedance
spectroscopy (PEIS). The method included a series of negative and positive current
pulses with a C-rate of C/2 with respect to the LTO electrode in the voltage range of
1.3-1.8 V vs. Li/Li+ at the working electrode. Impedance measurements were performed
in the range of 200 kHz-10 mHz with a sinus amplitude of 2 mV after each sequence of
discharge and charge. The dynamic resistance was determined from DC measurements.
Figure 49: “LixCoSb2”/LTO: (A) Voltage evolution versus charge during discharge and charge.
(B) Dynamic resistance change during the whole discharge and charge. Insets show the dynamic
resistance change at a certain period after the pulse: 200 µs, 1.6 ms, 1.6 s, and 15 s for the discharge
and charge step
Figure 49 shows the voltage evolution as function of charge for discharging and
charging of “LixCoSb2”/LTO. For discharging processes, the potential at the working
electrode stabilized at about 1.55 V vs. Li/Li+ after an initial deep voltage drop, whereas
A
B
Page 84
Results and Discussion
72
the potential increased during charging after a constant plateau. The dynamic resistance
decreased during the whole discharge and increased during the whole charge. The
dynamic resistance at a certain period after the pulse rapidly decreased during the
discharge step and started to stabilize afterwards. With increasing time after the current
pulse, higher dynamic resistances were obtained. Upon charging, the dynamic resistance
was found to be quite stable initially but increased drastically afterwards.
For “LixCoSb3”/LTO, a similar trend in voltage evolution as function of charge was
found compared to “LixCoSb2”/LTO (Figure 50). After an initial deep voltage drop, a
constant voltage plateau at the working electrode at 1.55 V vs. Li/Li+ upon discharging
was reached, whereas after a constant plateau a significant increase in voltage was
obtained upon charging. Moreover, the dynamic resistance decreased during the whole
discharge and increased during the whole charge. With increasing time after the current
pulse, higher dynamic resistances were obtained. Again, the dynamic resistance
behavior is quite similar compared to the “LixCoSb2”/LTO counterpart.
Figure 50: “LixCoSb3”/LTO: (A) Voltage evolution versus charge during discharge and charge.
(B) Dynamic resistance change during the whole discharge and charge. Insets show the dynamic
resistance change at a certain period after the pulse: 200 µs, 1.6 ms, 1.6 s, and 15 s for the discharge
and charge step.
A
B
Page 85
Results and Discussion
73
Figure 51 shows the evolution of voltage over time during discharge and charge of
“LixCoSb2“/LTO and “LixCoSb3“/LTO lithium-ion batteries. After an initial voltage
drop to ca. 1.55 V vs. Li/Li+ during discharge, the voltage increased during charge.
Figure 51: Voltage evolution versus time during discharge and charge of (A) “LixCoSb2”/LTO and
(B) “LixCoSb3”/LTO
The impedance of “LixCoSby”/LTO lithium-ion batteries was determined via an
AC measurement technique, namely potentio electrochemical impedance spectroscopy
(PEIS). The obtained impedance diagrams were fitted with a Z Fit EC-LAB® software
using equivalent electrical circuits. Figure 52 shows the equivalent electrical circuit
used to fit the data acquired for the “LixCoSby”/LTO lithium-ion batteries, where Re is
the resistance of the electrolyte, Rct is the charge transfer resistance, CPE is the constant
phase element and W is the Warburg element.
Figure 52: Equivalent electrical circuit for a “LixCoSby”/LTO lithium-ion battery
Figure 53 shows the evolution of the charge transfer resistance (Rct,2) and of the
exponent (a) of the constant phase element (CPE2) over the number of GCPL-PEIS
cycles, which were obtained from AC measurements after galvanostatic discharging and
A B
Page 86
Results and Discussion
74
charging. In all cases, the exponent of the constant phase element was in the range of
0.6-0.8 and therefore showed a behavior between a Warburg element (a = 0.5) and an
ideal capacitor (a = 1).
Figure 53: Evolution of the charge transfer resistance (Rct) and the exponent of the constant phase
element as function of the number of GCPL-PEIS cycles for “LixCoSb2”/LTO and
“LixCoSb3”/LTO lithium-ion batteries after (A) discharging and (B) charging.
The chemical diffusion coefficient of Li+ in the electrode materials (Li4Ti5O12, CoSb2,
CoSb3) was determined from PEIS measurements via the Warburg impedance (Warburg
diffusion element, ZW) and the modulus of the Warburg element (TW). The impedance
of the Warburg diffusion element as function of frequency ZW (ω) for a single charge
carrier is given by[117]
𝑍𝑊 (𝜔) = (𝑗𝜔𝑇𝑊)−0.5
(Eq. 6)
where j is the imaginary number, ω is the angular frequency in rad/s, TW is the modulus
of the Warburg element in Ω s-1/2
.
A
B
Page 87
Results and Discussion
75
The modulus of the Warburg element TW was determined from the slope of the
imaginary part of the impedance Z versus 1/ω1/2
derived from (Eq. 6. According to
Hanzu et al., the chemical diffusion coefficient was calculated from[117]
𝑇𝑊 =𝑅𝑇
𝑛2𝐹2𝐴𝐶√2𝐷
(Eq. 7)
where R is the ideal gas constant in J mol-1
K-1
, T is the absolute temperature in K,
n is the number of exchanged electrons, F is the Faraday constant in As mol-1
, A is the
active electrode area in cm², C is the concentration of inserted species in mol cm-³,
D is the chemical diffusion coefficient in cm² s-1
.
The active electrode areas were estimated from the average particle sizes of LTO
(2.4±0.1 µm), CoSb2 (2.6±0.4 µm) and CoSb3 (4.1±1.2 µm), which were determined via
dynamic light scattering. Assuming spherical particles, the electrode areas were
determined to be in the range of 3.8-12.8 cm² for an electrode disk 9.5 mm in diameter.
The concentration of inserted Li ions in the solid was determined by peak integration of
the reduction peak of the second cycle of the cyclic voltammogram with respect to time.
Table 7 shows the chemical diffusion coefficients D of Li+ in the examined electrode
materials determined via PEIS measurement. The chemical diffusion coefficient of Li+
in the lithium titanate host lattice was determined to be (7.6±4.0)×10-13
cm²/s, which
matches quite well with the values obtained by the Randles-Sevcik method
(10-12
-10-14
cm²/s) and the values reported in the literature (10-8
-10-15
cm²/s).[51,107–109]
The chemical diffusion coefficients of Li+ in the cobalt antimonides were determined to
be in a similar range of 10-13
-10-14
cm²/s but slightly lower compared to lithium titanate.
The values were found to be two to three orders of magnitude lower compared to the
chemical diffusion coefficients obtained by the Randles-Sevcik method (10-11
cm²/s).
Table 7: Chemical diffusion coefficient D of Li
+ in various electro-active materials determined via
potentio electrochemical impedance spectroscopy
Electro-Active
Material
A
[cm²]
C
[mol/cm³]
Diffusion Coefficient D
[cm²/s]
Li4Ti5O12
12.8 7.2×10⁻⁴
(7.6±4.0)×10-13
CoSb2
5.6 4.3×10⁻³
(4.3±5.0)×10-14
CoSb3
3.8 4.5×10⁻³
(1.3±1.4)×10-13
Page 88
Results and Discussion
76
2.2.4 Electrode Materials for Solar Battery Hybrid Devices
In order to fabricate solar battery hybrid devices pre-lithiated electrode materials were
required. Hence, either the positive or the negative electrode needed to be lithiated prior
to assembling of the solar battery hybrid device. This was necessary since a lithiation
process after assembling was not possible. For this purpose, pouch-type cells in
two-electrode configuration were assembled consisting of the respective composite
electrode material (Li4Ti5O12, CoSb2, CoSb3) as working electrode and lithium metal as
counter and reference electrode. Subsequently, GITT experiments comprising a series of
negative galvanostatic current pulses at a C-rate of C/20 interrupted by relaxation
periods (30 min) were performed for the pre-lithiation process. Consequently, the
lithiated electrode materials were used as positive and negative electrode in the
integrated solar battery hybrid devices.
Figure 54: Galvanostatic intermittent titration technique curves for the pre-lithiation of (A) LTO,
(B) CoSb2 and (C) CoSb3 in pouch-type cells. Insets show potential curves as function of time.
A
B C
Page 89
Results and Discussion
77
Figure 54 shows GITT curves for pre-lithiation of LTO, CoSb2 and CoSb3. During the
galvanostatic discharge pulses, Li ions are inserted into the electrode material. In case of
spinel LTO (Li4Ti5O12) electrodes, the insertion resulted in the formation of rock-salt
LTO (Li4+xTi5O12). In case of CoSby electrodes, an irreversible decomposition of the
solid takes place concomitant with Li-Sb reactions forming a well-dispersed mixture of
a Li3Sb phase and cobalt via a conversion reaction.[54,57]
The plateaus in the GITT graph
of CoSb3 can be attributed to the successive formation of Li2Sb and Li3Sb phases upon
decomposition of the skutterudite structure and Li-Sb reactions.[116]
The chemical diffusion coefficients D of Li+ in the examined electrode materials were
determined from the GITT curves according to (Eq. 8 derived from W. Weppner and
R. A. Huggins[118]
𝐷 = 4
𝜋𝜏(
𝑚𝑖 𝑉𝑀
𝑀𝑖 𝑆)
2
(∆𝐸𝑆
∆𝐸𝑡)
2
𝜏 ≪ 𝐿2/𝐷
(Eq. 8)
where D is the chemical diffusion coefficient of Li+ in the electrode material in cm²/s,
τ is the period of the galvanostatic current pulse in s, mi is the mass of active material of
component i in the electrode in g, VM is the molar volume in cm³/mol, Mi is the
molecular weight of component i in g/mol, S is the electrode surface area in cm²,
ΔEs is the change of the steady-state voltage during the current pulse in volt,
ΔEt is the total transient change of the cell voltage during the current pulse in volt.
The surface areas of the electrodes S were estimated from the mean particle sizes of
LTO (2.4±0.1 µm), CoSb2 (2.6±0.4 µm) and CoSb3 (4.1±1.2 µm), which were
determined via dynamic light scattering. Assuming spherical particles, the electrode
surface areas were determined to be in the range of 11-73 cm².
Table 8 shows that the chemical diffusion coefficients of Li+ in the electrode materials
were in a similar range of 10-14
cm²/s but higher for lithium titanate compared to the
cobalt antimonides. The Li+ diffusion coefficient in lithium titanate matched quite well
with the values reported in the literature (10-8
-10-15
cm²/s) and with the ones obtained
Page 90
Results and Discussion
78
from cyclic voltammetry via the Randles-Sevcik method (10-12
-10-14
cm²/s).[51,107–109]
Moreover, the Li+ diffusion coefficient was one order of magnitude lower compared to
the values obtained from the Warburg impedance (PEIS). The chemical diffusion
coefficients of Li+ in the cobalt antimonides were up to three orders of magnitude lower
compared to the values obtained from the Randles-Sevcik method (10-11
cm²/s) but were
found to be in a good agreement with the values obtained from the Warburg impedance
(10-13
-10-14
cm²/s).
Table 8: Chemical diffusion coefficient D of Li+ in various electro-active materials determined via
galvanostatic intermittent titration technique
Electro-Active
Material
S
[cm²]
VM
[cm³/mol]
Diffusion Coefficient D
[cm²/s]
Li4Ti5O12
73 43.7 (5.2±5.5)×10-14
CoSb2
17 18.1 (2.6±3.1)×10-14
CoSb3
11 18.5 (1.7±1.5)×10-14
Page 91
Results and Discussion
79
2.3 Solar Battery Hybrid Devices
An integrated power pack based on the combination of an organic photovoltaic and a
battery system was made for efficient energy harvesting and storage in a three-terminal
assembly with two positive and a shared negative electrode. The power system was
made of an organic multi-junction solar cell connected in series with a lithium-ion
battery. In detail, the lower part of the integrated hybrid device consisted of an organic
multi-junction solar cell comprising PCDTBT:[70]PCBM (1:2 w/w) active layers with
Al/MoO3 or Ag/MoO3 intermediate layers and a Ti/Cu electrode with circular geometry
(0.79 cm² active area). Cu leads were attached to the ITO layer (positive electrode) and
to the Ti/Cu top electrode (negative electrode) of the tandem solar cell providing
electrical contact. The battery system in the center of the power pack, which was
assembled on top of the multi-junction solar cell, based on a combination of
(i) pre-lithiated CoSby (“LixCoSby”, y = 2,3) and LTO or (ii) pre-lithiated LTO
(Li4+xTi5O12) and CoSby (y = 2,3) electrodes. The pre-lithiation process of the electrode
materials was carried out in two-electrode pouch-cells via GITT prior to assembling of
the hybrid device since lithiation by an external lithium source after assembling was not
possible. The upper part consisted of a current collector comprising a glass / ITO / Cu
substrate with a Cu lead attached to the metal contact (positive electrode) to provide
electrical contact to the battery system. Figure 55 shows a schematic representation in
cross section of the design of the solar battery hybrid power pack.
Figure 55: Basic design of the integrated solar battery hybrid power pack in cross section. Two
possible configurations can be distinguished: (i) The negative electrode refers to pre-lithiated
“LixCoSby” (y = 2,3) and the positive electrode to the LTO electrode. (ii) The negative electrode
refers to CoSby and the positive electrode to the pre-lithiated LTO electrode.
Page 92
Results and Discussion
80
Figure 56 shows various components of the integrated power pack such as the current
collector, the multi-junction solar cell as well as the fully-assembled solar battery hybrid
device. The power pack was assembled and sealed under argon atmosphere by applying
pressure onto the O-ring using Plexiglas® plates fixed with screws.
Figure 56: (A) Current collector with a Cu lead, (B) multi-junction solar cell with Cu leads and
(C) a fully-assembled solar battery hybrid device
Hybrid device fabrication, characterization and testing were done on the basis of three
model systems including “LixCoSb2”/LTO, “LixCoSb3”/LTO and CoSb2/Li4+xTi5O12.
The three-terminal assembly of the integrated hybrid device allowed the investigation of
the performance of both photovoltaic and lithium-ion battery sub-devices. The solar cell
performance was evaluated based on J-V curves and photovoltaic characteristic
parameters. The performance of the battery system was determined by galvanostatic
cycling measurements giving information about the cycling stability and the
electrochemical performance.
A
B
C
Page 93
Results and Discussion
81
2.3.1 Performance of Solar Battery Hybrid Devices
The performance of the photovoltaic system in the integrated solar battery hybrid device
was determined via I-V measurements. The corresponding J-V characteristics showed
that the device performance, in particular the VOC, significantly dropped after the
galvanostatic cycling measurements compared to the initial values after the solar cell
fabrication. For example, the VOC dropped from 1.24 V to 0.05 V (for a tandem solar
cell with Ag/MoO3 intermediate layers combined with “LixCoSb2”/LTO) and from
1.38 V to 0.41 V (for a tandem solar cell with Al/MoO3 intermediate layers combined
with “LixCoSb3”/LTO). In order to determine the problematic process step responsible
for the drop of the J-V characteristics, I-V measurements were performed at several
stages of the fabrication process, e.g. after fabrication of the tandem solar cell, after
attachment of Cu leads to the metal contact of the tandem solar cell, after assembling of
the hybrid device and after the GCPL measurement (Figure 57).
Figure 57: (A) Open circuit voltage and power conversion efficiency, and (B) short-circuit current
density and fill factor of a multi-junction solar cell assembled with a CoSb2 vs. Li4+xTi5O12
lithium-ion battery. I-V measurements were performed at several stages of the fabrication process:
Step 1: after fabrication of the tandem solar cell; Step 2: after contacting with Cu leads; Step 3:
after drop-coating of CoSb2; Step 4: after assembling of the hybrid device; Step 5: after GCPL
measurement.
Figure 57 shows that the solar cell performance significantly decreased from the initial
values after the fabrication of the solar cell to the final I-V measurements (for a tandem
solar cell with Al/MoO3 intermediate layers combined with CoSb2/Li4+xTi5O12).
Especially after assembling of the hybrid device (step 4), the open circuit voltage
dropped down to values below 0.5 V, which might be due to the contact of the solar cell
with the electrolyte (1 M LiPF6 in EC:DMC (1:1, v/v), BASF) of the battery.
A B
Page 94
Results and Discussion
82
In order to investigate the effect of the electrolyte on the solar cell performance, in
particular on the open circuit voltage, a WhatmanTM
glass microfiber filter GF/B
(GE Healthcare Life Sciences) soaked with electrolyte was placed on the top electrode
of a tandem solar cell and sealed under argon atmosphere using a similar approach as
described for the assembling of hybrid devices (Chapter 3.4.2). No temporary effect on
the device performance was determined but after three days, a drop in VOC from 1.48 V
to 0.67 V and hence in PCE from 2.68% to 1.08% was obtained resulting from the
effect of the electrolyte.
In general, the battery system should be operated in a voltage regime matching with the
Vmpp of the tandem solar cell. This implies that the lithium-ion battery within the hybrid
device needed to be run in the range of 0.3-1.1 V (for “LixCoSb2”/LTO and
CoSb2/Li4+xTi5O12) and 0.2-1.15 V (for “LixCoSb3”/LTO). Thus, a minimum Vmpp of
1.10-1.15 V was required for charging the lithium-ion battery system during
illumination of the solar cell. The results show that the Vmpp of the photovoltaic system
(below 0.25 V) was too low for charging the lithium-ion battery.
In addition, the cycling performance and electrochemical behavior of the lithium-ion
battery was examined by galvanostatic cycling measurements after assembling of the
hybrid device. Figure 58 shows the discharge/charge cycling performance as well as the
Coulombic efficiency of “LixCoSb2”/LTO, “LixCoSb3”/LTO and CoSb2/Li4+xTi5O12
lithium-ion batteries in fully-assembled hybrid devices.
Figure 58: Discharge and charge cycling performance as well as the Coulombic efficiency of
(A) “LixCoSb2” vs. LTO, (B) “LixCoSb3” vs. LTO, and (C) CoSb2 vs. Li4+xTi5O12
A B C
Page 95
Results and Discussion
83
Considering the lithium-ion battery systems assembled in integrated power packs, the
“LixCoSb2”/LTO battery showed a quite moderate initial discharge/charge capacity
(120 / 96 mAh/g) but a poor cycling performance with a rapid capacity fading in the
first cycles down to 5.2 / 6.2 mAh/g. The battery exhibited a relatively high initial
Coulombic efficiency (80%), which stabilized over 90% after the initial cycle.
Moreover, a huge polarization of about 200-300 mV was obtained for this system
exceeding the value found for the full-cell assembly in three-electrode Swagelok cells
(50-70 mV, Chapter 2.2.3.2). The “LixCoSb3”/LTO battery showed an improved cycling
performance compared to the “LixCoSb2”/LTO system having a high initial
discharge/charge capacity (166 / 148 mAh/g), which stabilized over 150 mAh/g in the
subsequent cycles. Moreover, a quite high initial Coulombic efficiency of 90% was
determined stabilizing between 98-99% in the following cycles. Similar to the
“LixCoSb2”/LTO system, huge polarization effects (about 250-350 mV) were found
compared to the three-electrode Swagelok cell assembly (40-60 mV, Chapter 2.2.3.2).
The CoSb2/Li4+xTi5O12 battery showed a quite low initial discharge/charge capacity
(98.1 / 0.5 mAh/g) with a rapid capacity fading down to values below 1 mAh/g
accompanied with low Coulombic efficiencies in the range of 0.5-45%. Obviously, this
system did not work.
The performance of the solar battery hybrid device, namely the charging of the lithium-
ion battery upon illumination of the organic multi-junction solar cell and discharging
under dark conditions could not be measured, which is based on two main aspects. On
the one hand tandem solar cells showed a poor device performance with Vmpps below
0.25 V after long-term contact with the electrolyte of the lithium-ion battery. This is too
low for charging the lithium-ion battery upon illumination of the photovoltaic system.
On the other hand some lithium-ion batteries showed a poor cycling performance with
rapid capacity fading and thus were not applicable for being charged with the tandem
solar cell. As a consequence, several problems need to be overcome when assembling
such an integrated power pack such as
the choice of electrolyte since negative effects on the solar cell performance
were determined upon long-term contact with the multi-junction solar cell
Page 96
Results and Discussion
84
to avoid piercing of the top electrode of the tandem solar cell with sharp edges
of the copper current collector of the pre-lithiated “LixCoSby” electrode material.
This problem can be met by introducing a conductive intermediate layer such as
an adhesive copper foil or conductive paper, or via drop-coating of the CoSby
slurry as done in one of the model systems.
the conditions for sealing of the power pack: The hybrid device should be
assembled in an air and moisture free atmosphere, i.e. argon atmosphere, since
lithium reacts in moist air under formation of a coating of lithium hydroxide
(LiOH and LiOH∙H2O), lithium nitride (Li3N) and lithium carbonate
(Li2CO3).[119]
the sealing method: Hybrid devices were sealed with O-rings placed between the
tandem solar cell and the glass / ITO / Cu current collector, followed by
applying pressure onto the O-ring using Plexiglas®
plates fixed with screws. The
inner diameter of the O-ring should be large enough to avoid direct contact to
the top electrode of the tandem solar cell since a pressure applied on the
electrode might destroy the solar cell. The applied pressure should be high
enough to provide proper sealing in order to avoid reactions with the ambient
atmosphere and to provide a good contact within the lithium-ion battery but low
enough to prevent piercing of the tandem solar cell with the electrode materials.
Alternatively, the hybrid device could be encapsulated under argon atmosphere
using epoxy in order to provide enhanced sealing properties.
These aspects are important since major problems occurred during assembling of hybrid
devices. Some tandem solar cells, for example, were destroyed by piercing with the
electrode material, by pressing the O-ring on the top electrode or by the effect of the
electrolyte. In addition to that, some lithium-ion batteries showed poor electrochemical
performance upon galvanostatic cycling, which might be due to inappropriate sealing
and contact with ambient atmosphere during long-term storage or by contact problems
of the electrode materials with the current collectors.
Page 97
Experimental
85
3 Experimental
3.1 Chemicals and Materials
Table 9 to Table 11 show a summary of used chemicals and materials including their
purity grade and supplier. All chemicals and materials were used without further
purification unless otherwise stated.
Table 9: List of chemicals
Chemicals
Purity Grade and Description Supplier
acetone
puriss. Sigma-Aldrich
aluminum, Al
99.999%, pellets
Kurt J. Lesker
Company
antimony, Sb
99.5% (metal basis),
powder, ~ 325 mesh
Alfa Aesar
calcium, Ca
99%,
granular, ~ 6 mesh
Sigma-Aldrich
cesium carbonate,
Cs2CO3
99.995% (trace metal basis)
Aldrich Chemistry
chlorobenzene (CB)
99.9%,
CHROMASOLV®, for HPLC
Sigma-Aldrich
cobalt, Co
purum,
powder
-
copper, Cu
99.9+%,
wire, 1.0 mm diam.
Sigma-Aldrich
1,2-dichlorobenzene
(DCB)
99%, CHROMASOLV®
Sigma-Aldrich
ethanol
- -
F8T2
- ADS
Page 98
Experimental
86
Table 10: List of chemicals (continued)
Chemicals
Purity Grade and Description Supplier
gold, Au
24 carats, pellets Ögussa
graphite
C-NERGYTM
KS 6L Graphite,
conductive carbon
Timcal
ICBA
99% Solenne
lithium, Li
99.9% (trace metal basis),
ribbon, 0.38 mm × 23 mm
Aldrich Chemistry
lithium fluoride, LiF
- -
lithium titanate,
Li4Ti5O12
LTO EXM 1037,
powder Süd-Chemie
LP 30 electrolyte
1 M LiPF6 in EC:DMC (1:1, v/v)
BASF
Kynar® 761,
Kynar Flex® 2801
polyvinylidene fluoride resin Arkema
1-methyl-2-
pyrrolidinone (NMP)
99.5%, anhydrous Sigma-Aldrich
molybdenum(VI) oxide,
MoO3
99.99% (trace metal basis),
99.98% (trace metal basis)
Sigma-Aldrich
[60]PCBM
99% Solenne
[70]PCBM
99% Solenne
PCDTBT
OS 0502 One Material
PCPDTBT
OS 0340 One Material
2-propanol
puriss. p.a., ACS reagent, reag.
ISO, reag. Ph. Eur., ≥ 99.8% (GC)
Sigma-Aldrich
PSiF-DBT
OS 0927 One Material
silver, Ag
wire -
Super C65
conductive carbon Timcal
titanium, Ti
99.99% (metals basis),
wire, 1.0 mm diam.
Sigma-Aldrich, abcr
zinc, Zn
wire -
Page 99
Experimental
87
Table 11: List of materials
Materials
Purity Grade and Description
Supplier
copper
foil
Coppertex® Daubert
VCI. Inc.
copper
99.9%,
foil, 17.5 µm
Goodfellow
Cambridge Limited
copper
foil, 50 µm,
with Cu treatment
Schlenk
FB 2190
separator Freudenberg
ITO-coated glass
≤ 10 Ω ,
24 × 75 × 1.1 mm
Xinyan
Technology co,.
Limited
microscope slide
ISO 8037/1,
ca. 76 × 26 mm
Roth
O-ring
FPM,
9.5 mm or 14 mm ID
-
pouch foil
- Dai Nippon Printing
Co., Ltd.
Quick Set Epoxy
Adhesive
- RS Components
silver conductive paint
- RS Components,
Conrad
WhatmanTM
glass
microfiber
filters GF/B
- GE Healthcare Life
Sciences
Page 100
Experimental
88
3.2 Bulk-Heterojunction Solar Cells
3.2.1 General Procedure for Preparation of Bulk-Heterojunction Solar Cells
Bulk-heterojunction single- and multi-junction solar cells prepared in normal device
architecture were used for the determination of the device performance and as
photovoltaic system for the integrated solar battery hybrid device. A general procedure
for the device fabrication is summarized in following chapters.
3.2.1.1 Cleaning and Activation of the ITO Layer
ITO-coated glass (Xinyan Technology co,. Limited) with a sheet resistance ≤ 10 Ω was
used as substrate for the preparation of solar cells. After removal of a protective foil, the
substrates were cleaned with acetone to remove contaminations prior to ultrasonic
treatment in 2-propanol (30°C, 30 min, VWR ultrasonic cleaner). Next, the substrates
were rinsed with acetone followed by blow-drying with compressed air. The ITO-coated
glass substrates were oxygen plasma etched (Femto, Diener Electronics) at a constant
oxygen gas flow of 10 sccm for 3 min in order to activate the ITO layer. The cleaned
and activated substrates were transferred into a glovebox system (LABmaster dp,
MBraun) filled with nitrogen for subsequent process steps.
3.2.1.2 Hole-Transport Layer
MoO3 (15 nm) was thermally deposited onto activated ITO-coated glass substrates at a
rate below 5 Å/s serving as hole-transport layer. Thermal deposition processes of metal
and metal oxide layers were performed in an evaporation chamber (MB EVAP,
MBraun) equipped with a SQM-160 Deposition Rate/Thickness Monitor (Inficon)
recording layer thicknesses and deposition rates at a pressure of approx. 1×10⁻⁵
mbar
unless otherwise stated.
Page 101
Experimental
89
3.2.1.3 Active Layer
The polymer (PCDTBT, PSiF-DBT, PCPDTBT, F8T2) was dissolved in chlorobenzene
(10 mg/mL) and stirred overnight to obtain a homogeneous solution. After addition of
the fullerene derivative ([60]PCBM, [70]PCBM, ICBA) at varying donor:acceptor
ratios, the mixture was stirred for at least 15 min to provide proper mixing.
Subsequently, the donor:acceptor blend was doctor bladed onto the glass/ITO/MoO3
substrate using an Erichsen doctor blading machine (at 40°C, 200 µm casting gap,
7.5 mm/s or 12.5 mm/s), followed by drying at 40°C for slow evaporation of the
solvent.
3.2.1.4 Intermediate Layers (for Multi-Junction Solar Cells)
Intermediate layers based on a combination of metal or metal oxides with MoO3
(15 nm) were deposited onto the active layer. Metals such as Al, Ag, Au, Cu and Ti
were thermally deposited with layer thicknesses in the range of 1-4 nm. For evaporation
of the metal oxides TiOx and ZnO, metallic Ti and metallic Zn were thermally deposited
(2 nm) onto the active layer under reduced pressure (approx. 10-4
mbar) using a
BAL-TEC MED020 coating system equipped with a QSG 100 Quartz Film Thickness
Monitor unit. Conversion to the respective metal oxides was assumed to occur under
ambient atmosphere.[84,85]
MoO3 was thermally deposited on top of the metal or metal
oxide layer as described in Chapter 3.2.1.2. Additional metal layers (Ca, Ti) and alkali-
metal compound layers (LiF, Cs2CO3) were thermally deposited (0.5-1 nm) prior to the
physical vapor deposition of the recombination layer in order to investigate the impact
of interfacial layers on the device performance. For the preparation of multi-junction
solar cells, active layers were doctor bladed onto the intermediate layers as described in
Chapter 3.2.1.3.
3.2.1.5 Interfacial Layers and Top Electrodes
Titanium interfacial layers (4 nm) and copper top electrodes (100 nm) were thermally
deposited onto the active layer. For single- and multi-junction solar cells, the electrodes
were thermally deposited through a shadow mask with square geometry giving an active
electrode area of 0.09 cm². For the preparation of multi-junction solar cells for the
integrated solar battery hybrid device, a shadow mask with circular geometry
(1 cm diam.) was used giving an active electrode area of 0.79 cm².
Page 102
Experimental
90
3.2.2 Characterization
3.2.2.1 I-V Characteristics
I-V curves were monitored under illuminated and dark conditions in the range of 1.5 V
to -0.5 V for single-junction, 2.0 V to -2.0 V for tandem, and 3.0 V to -3.0 V for
triple-junction solar cells using a Keithley 2400 SourceMeter, a custom-made Lab-View
software and a Dedolight DLH400D lamp. The light intensity of the light source was set
to 100 mW/cm² providing a spectrum similar to AM 1.5 G. For solar cells with square
electrode geometry (0.09 cm² active area), the effective area of the device was defined
by shadow masks (3 × 3 mm²), which were put onto the solar cells during the
I-V measurements in a custom-made measuring box. Solar cells with circular electrode
geometry (0.79 cm² active area) were measured manually with contact pins for the
positive and negative electrode. J-V curves were obtained by considering the active
electrode area. Thus, photovoltaic characteristic parameters such as VOC, Jsc, FF and
PCE were determined from the J-V curves and averaged over the best five solar cells.
Rs- and Rsh-values were extracted from the J-V curves under illumination.
3.2.2.2 UV/VIS-Spectroscopy and Optical Band Gap Determination
Absorption spectra of solar cells, polymer thin films and polymer:fullerene derivative
thin films were recorded using a UV/VIS Spectrometer Lambda 35 (Perkin Elmer)
equipped with an integrating sphere in the range of 350-1000 nm (slit width: 1 nm,
scan speed: 480 nm/min). Solar cells were characterized as prepared. Polymer and
polymer:fullerene derivative thin films of various conjugated polymers (PCDTBT,
PSiF-DBT, PCPDTBT, F8T2) and fullerene derivatives ([60]PCBM, [70]PCBM,
ICBA) were prepared by doctor blading of the respective polymer solution (10 mg/mL,
in chlorobenzene) or of the donor:acceptor blend on ultrasonically cleaned (2-propanol,
30°C, 30 min, VWR ultrasonic cleaner) and oxygen plasma etched (3 min, 10 sccm,
Femto, Diener Electronics) microscope slides (Roth) in a nitrogen-filled glovebox
(LABmaster dp, MBraun), followed by drying at 40°C for slow evaporation of the
solvent. Optical band gaps of the polymers were determined from the onset of the
absorption spectra.
Page 103
Experimental
91
3.2.2.3 Layer Thickness and Roughness
In order to ascertain the layer thickness and roughness of the solar cells, the samples
were scratched with a knife blade, followed by thickness and roughness measurements
at four positions using a Dektak XT surface profiler (Bruker; Software: Vision 64TM
).
3.2.2.4 External Quantum Efficiency (EQE)
EQE measurements were carried out for single-junction solar cells fabricated as
described in Chapter 3.2.1. The IPCE (incident photon-to-current efficiency) measuring
system consisted of a MuLTImode 4-AT monochromator (Amko) equipped with a
xenon lamp (LPS 210-U, Amko) and a Keithley 2400 SourceMeter. In order to contact
the ITO layer, the active layer was scratched, followed by applying conductive silver
paint. Afterwards, the solar cells were cut into a size of approximately 25 × 25 mm and
sealed under nitrogen in a custom made measuring box. After calibration with a photo
diode (1.2 mm²), the EQE spectra of the solar cells (9 mm²) were monitored in the range
of 350-1000 nm.
Page 104
Experimental
92
3.3 Lithium-Ion Battery Electrode Materials
Electro-active materials for lithium-ion batteries such as lithium titanate (Li4Ti5O12),
cobalt diantimonide (CoSb2) and cobalt triantimonide (CoSb3) were used for the
preparation of composite electrodes, which were characterized in half- and full-cell
configuration using three-electrode Swagelok cells via common electrochemical
methods such as cyclic voltammetry (CV), galvanostatic cycling with potential
limitation (GCPL), galvanostatic intermittent titration technique (GITT) and potentio
electrochemical impedance spectroscopy (PEIS).
3.3.1 Lithium Titanate (Li4Ti5O12, LTO)
3.3.1.1 Electrode Preparation
The active material LTO EXM 1037 (Süd-Chemie) was dried in a Büchi Glass Oven
B-585 (60°C, approx. 10-3
mbar) overnight. For the preparation of the composite slurry,
80 wt.% active material, 13 wt.% conductive carbon (Super C65) and 7 wt.% binder
(Kynar® 761 or Kynar Flex
® 2801) were weighed into a polypropylene vessel and the
solvent NMP was added in small portions. The mixture was homogenized in a planetary
ball mill (Pulverisette 7, Fritsch) using 10 mm zircona balls at 300 rpm for 4 cycles each
with 15 min in forward and reverse operation to obtain a homogeneous, viscous,
greyish-black slurry, which was used for the subsequent casting process.
For preparing LTO composite electrodes, the slurry was cast (doctor blade method) with
an Erichsen Film Applicator (100 µm, 5 mm/s) on a copper foil (Schlenk), followed by
drying of the wet film at 60°C overnight. Next, circular electrodes were punched
(9.5 mm diam.), dried in a Büchi Glass Oven B-585 (60°C, approx. 10-3
mbar) for at
least 6 h and weighed. After further drying at 60°C under reduced pressure, the
composite electrodes were transferred into an argon-filled glovebox (MB150 B-G,
Braun) with an oxygen and moisture content below 1 ppm, where the electrodes were
stored until assembling in Swagelok cells.
Page 105
Experimental
93
3.3.2 Cobalt Diantimonide (CoSb2) and Cobalt Triantimonide (CoSb3)
3.3.2.1 Preparation of CoSb2 and CoSb3 Powders via Mechanical Alloying
CoSb2 and CoSb3 powders were prepared by ball milling of stoichiometric amounts
of cobalt and antimony metal powders in a molar ratio of 1:2 (for CoSb2) and
1:3 (for CoSb3) in a planetary ball mill (Pulverisette 7, premium line, Fritsch) with
5 mm zirconia balls under argon atmosphere. The ball to powder weight ratio was
15.2:1. The mechanical alloying process consisted of 48 cycles, each with a 30 min
sequence of milling at 600 rpm in forward and reverse operation interrupted by a 15 min
resting period. Finally, a black to greyish, slightly shiny powder of CoSb2 and CoSb3 in
a quantitative yield was obtained, which was used as active material for subsequent
slurry and electrode preparation.
3.3.2.2 Electrode Preparation
For the preparation of the cobalt antimonide composite slurry, 84 wt.% active material
(CoSb2 or CoSb3), 10 wt.% conductive carbon (Super C65) and 6 wt% binder
(Kynar® Flex 2801) were weighed into a polypropylene vessel and the solvent NMP
was added in small portions. The mixture was homogenized in a planetary ball mill
(Pulverisette 7, Fritsch) using 10 mm zirconia balls at 300 rpm for 4 cycles each with
15 min in forward and reverse operation to obtain a homogeneous, viscous suspension,
which was used for the subsequent casting process.
The slurries were cast (doctor blade) with an Erichsen Film Applicator (100 µm,
5 mm/s) on a Cu foil (Coppertex®
Daubert VCI. Inc.), followed by drying of the wet
film at 60°C overnight. Next, circular electrodes were punched (9.5 mm diam.), dried in
a Büchi Glass Oven B-585 (60°C, approx. 10-3
mbar) for at least 8 h and weighed. After
further drying at 60°C under reduced pressure, the composite electrodes were
transferred into an argon-filled glovebox (MB150 B-G, Braun) with an oxygen and
moisture content below 1 ppm, where the electrodes were stored until assembling in
Swagelok cells.
Page 106
Experimental
94
3.3.3 Characterization of Electro-Active Materials
3.3.3.1 Dynamic Light Scattering (DLS)
The average particle sizes of LTO EXM 1037, CoSb2 and CoSb3 were determined via
dynamic light scattering (DLS) of 0.001 wt.% and 0.01 wt.% particle solutions in
ethanol. DLS measurements were performed on a Zetasizer Nano ZS instrument
(Malvern Instruments) equipped with a Nano ZS red laser (633 nm) using a Light
Scattering Zetasizer software.
Page 107
Experimental
95
3.3.4 Characterization of Electrode Materials in Half-Cell Configuration
All electrochemical characterization measurements in half- and full-cell configuration
were performed at room temperature using a multichannel MPG-2 potentiostat
(Biologic Science Instruments) with an EC-LAB VIO-34 software unless otherwise
stated.
Cyclic voltammetry and galvanostatic cycling experiments were carried out for
electrochemical characterization of the prepared Li4Ti5O12, CoSb2 and CoSb3 composite
electrodes. For this purpose, three-electrode Swagelok cells in half-cell configuration
were assembled under argon atmosphere using the prepared electrode materials as
working electrode and lithium metal as counter and reference electrode. WhatmanTM
glass microfiber filters GF/B (GE Healthcare Life Sciences) were used as separator. The
separator was soaked with a LP 30 electrolyte (BASF), which consisted of a solution of
1 M LiPF6 in a 1:1 (v/v) mixture of ethylene carbonate (EC) and dimethyl carbonate
(DMC).
Both experiments started with a 12 h resting period during which an OCV (open circuit
voltage) was recorded in order to ensure complete soaking of the separator with the
electrolyte providing a good ionic contact prior to electrochemical characterization.
3.3.4.1 Cyclic Voltammetry
Cyclic voltammetry measurements were performed in the range of 1.0-2.0 V vs. Li/Li+
for LTO and 0.1-2.0 V vs. Li/Li+ for CoSb2 and CoSb3 using different scan rates
(0.1 mV/s, 0.2 mV/s, 0.5 mV/s, 1 mV/s, 2 mV/s and 5 mV/s) with two cycles for each
scan rate.
3.3.4.2 Galvanostatic Cycling with Potential Limitation
Galvanostatic cycling experiments were carried out at two different C-rates, namely C/2
and C/5. Using LTO as working electrode, the cells were cycled between
1.0-1.8 V vs. Li/Li+ for 50 cycles at each C-rate. CoSb2 and CoSb3 half-cells without the
initial formation sequence were cycled in the potential range of 0.75 V to 1.1 V vs.
Li/Li+ at C/2 and C/5 each for 50 cycles. CoSb2 and CoSb3 half-cells with the initial
formation sequence were cycled for four cycles at C/2 in the potential range of 0.2 to
1.1 V vs. Li/Li+, followed by 50 cycles at C/2 and 50 cycles at C/5 in the range of
0.75 V to 1.1 V vs. Li/Li+.
Page 108
Experimental
96
3.3.5 Characterization of Electrode Materials in Full-Cell Configuration
For electrochemical characterization of electrode materials in full-cell configuration,
three-electrode Swagelok cells were assembled under argon atmosphere using CoSb2
and CoSb3 as working electrode, LTO as counter electrode and lithium metal as
reference electrode. WhatmanTM
glass microfiber filters GF/B (GE Healthcare Life
Sciences) and LP 30 electrolyte (BASF) were used as separator and electrolyte,
respectively. In order to ensure complete soaking of the separator with the electrolyte a
12 h resting period was introduced before each electrochemical measurement.
3.3.5.1 Galvanostatic Intermittent Titration Technique
Galvanostatic intermittent titration technique experiments were performed in order to
pre-lithiate the CoSb2 and CoSb3 electrodes for subsequent GCPL tests. For this
purpose, CoSb2 and CoSb3 were used as working electrode and lithium metal as both
counter and reference electrode. The GITT experiments included a series of negative
galvanostatic current pulses at a C-rate of C/20, each followed by a relaxation period of
30 min with no current passing through the cell. Pre-lithiated cobalt antimonide
electrodes are referred to as “LixCoSb2” and “LixCoSb3” in the following chapters.
3.3.5.2 Galvanostatic Cycling with Potential Limitation
Galvanostatic cycling experiments were carried out at two different C-rates, namely C/2
and C/5, with respect to the LTO electrode material. The full-cells with LTO as working
electrode, “LixCoSb2” and “LixCoSb3” as counter electrode and lithium metal as
reference electrode were cycled 26 times at each C-rate. The potential limits of LTO
(1.3-1.8 V vs. Li/Li+), “LixCoSb2” (0.65-1.0 V vs. Li/Li
+) and “LixCoSb3” (0.65-1.1 V
vs. Li/Li+) were chosen based on preliminary experiments, giving a limitation for the
full-cell of 0.3-1.15 V vs. Li/Li+ (for “LixCoSb2”/LTO) and 0.2-1.15 V vs. Li/Li
+
(for “LixCoSb3”/LTO).
Page 109
Experimental
97
3.3.5.3 Determination of the Dynamic Resistance and Impedance
The dynamic resistance and impedance of the full-cell configuration were determined
using a series of linked DC (direct current) and AC (alternating current) measurement
techniques including galvanostatic cycling and potentio electrochemical impedance
spectroscopy. The method included a series of negative and positive current pulses at a
C-rate of C/2 with respect to the LTO electrode in a voltage range of 1.3-1.8 V vs.
Li/Li+ at the working electrode. Impedance measurements were performed in the range
of 200 kHz-10 mHz with a sinus amplitude of 2 mV after each discharge and charge
sequence. LTO was used as working electrode, “LixCoSby” as counter electrode and
metallic lithium as reference electrode. Measurements were performed at room
temperature using a VMP3 multi-channel potentiostat (Biologic Science Instruments)
and an EC-LAB VIO-34 software.
3.3.6 Electrode Materials for Solar Battery Hybrid Devices
Li4Ti5O12, CoSb2 and CoSb3 electrode materials were pre-lithiated in pouch-type cells
(6 × 7 cm, Dai Nippon Printing Co., Ltd.) in two-electrode configuration consisting of
the respective composite electrode as working electrode and lithium metal as counter
and reference electrode. The electrodes (1.5 × 1.5 cm) were attached on copper current
collectors (Goodfellow Cambridge Limited) and dried at 60°C in vacuum (Büchi Glass
Oven B-585) prior to assembling under argon atmosphere. FB 2190 (Freudenberg) and
LP 30 electrolyte (BASF) were used as separator and electrolyte, respectively.
The electrodes were pre-lithiated via galvanostatic intermittent titration technique. The
GITT experiment was started after a 12 h resting period and consisted of a series of
negative galvanostatic current pulses with a C-rate of C/20 each one interrupted by
relaxation periods of 30 min with no current passing through the cell. The pre-lithiated
electrode materials (Li4+xTi5O12, “LixCoSb2” and “LixCoSb3”) were used for the
fabrication of integrated solar battery hybrid devices.
Page 110
Experimental
98
3.4 Solar Battery Hybrid Devices
A general procedure for the preparation of materials for the solar battery hybrid device
and for the subsequent assembling and characterization of the integrated power pack is
given in following chapters.
3.4.1 Preparation of Materials for Solar Battery Hybrid Devices
3.4.1.1 Multi-Junction Solar Cells
Organic multi-junction solar cells in normal device architecture with a MoO3
hole-transport layer, PCDTBT:[70]PCBM (1:2 w/w) active layers, Al/MoO3 or
Ag/MoO3 intermediate layers, a titanium interfacial layer and copper top electrode with
circular electrode geometry (0.79 cm² active area) were prepared as described in
Chapter 3.2.1. The substrates were cut into a size of approx. 25 × 25 mm. In order to
provide electrical contact to the ITO layer (positive electrode) and the Cu top electrode
(negative electrode), Cu leads were attached to the metal contact of the tandem solar
cell using silver conductive paint, epoxy and paper for electrical insulation.
3.4.1.2 Lithium-Ion Battery Electrode Materials
For integrated solar battery hybrid devices with a “LixCoSby”/LTO-based lithium-ion
battery, the electrode materials (Li4Ti5O12, CoSb2 and CoSb3) were used as prepared
(Chapter 3.3.1-3.3.2) or were pre-lithiated in pouch-type cells (Chapter 3.3.6). For
integrated solar battery hybrid devices with a CoSb2/Li4+xTi5O12-based lithium-ion
battery, pre-lithiated LTO (Chapter 3.3.6) and drop coated CoSb2 electrodes were used.
For preparation of the CoSb2 slurry for drop coating, 88 wt.% active material (CoSb2)
were mixed with the solvent NMP (1:1 w/w with respect to the total amount of solid
components of the slurry) in a plastic container on a magnetic stirrer for about 1 h.
Conductive carbon (3 wt.% Super C65 and 3 wt.% C-NERGYTM
KS 6L Graphite) was
added and mixed well overnight. The binder (2 wt.% Kynar Flex® 2801 and
4 wt.% Kynar® 761) was added in small portions over 2 h and mixed over the weekend.
Page 111
Experimental
99
The CoSb2 slurry was directly drop coated onto the copper top electrode of the multi-
junction solar cell after contacting with Cu leads, followed by drying at 60°C in drying
oven and in a Büchi Glass Oven B-585 (60°C, approx. 10-3
mbar) overnight.
3.4.1.3 Copper Current Collectors
Current collectors were prepared by thermal deposition of Cu electrodes with circular
geometry (0.79 cm² active area) onto ITO-coated glass substrates (approx.
2.5 × 2.5 cm², Xinyan Technology co,. Limited) after cleaning and activation of the ITO
layer as described in Chapter 3.2.1.1. In order to provide an electrical contact, a Cu lead
was attached to the metal contact (positive electrode) using silver conductive paint,
epoxy and paper for electric insulation.
3.4.2 Assembling of Solar Battery Hybrid Devices
The integrated power pack was assembled and sealed under argon atmosphere. The
lower part of the hybrid device was made by the organic multi-junction solar cell with
Cu leads in order to provide electrical contact to the ITO layer and the Cu top electrode.
For integrated solar battery hybrid devices with a “LixCoSby”/LTO-based lithium-ion
battery, the pre-lithiated “LixCoSby” electrode (approx. 5 × 5 mm) was placed on the
circular top electrode of the solar cell. Next, WhatmanTM
glass microfiber filters GF/B
(8 mm diam., GE Healthcare Life Sciences) were placed on top of the negative
electrode, followed by soaking with LP 30 electrolyte (BASF). The LTO electrode
(6 mm diam.) was placed on top of the soaked separator. For integrated solar battery
hybrid devices with a CoSb2/Li4+xTi5O12-based lithium-ion battery, WhatmanTM
glass
microfiber filters GF/B (8 mm diam., GE Healthcare Life Sciences) were placed on top
of the CoSb2 electrode, which had already been drop coated on the multi-junction solar
cell, followed by soaking with LP 30 electrolyte (BASF). The pre-lithiated Li4+xTi5O12
electrode (approx. 5 × 5 mm) was placed on top of the soaked separator. The current
collector with the Cu lead was placed on top in order to provide electrical contact to the
battery system. The whole device was sealed by applying pressure on the O-ring
(9.5 mm or 14 mm ID), which was placed between the multi-junction solar cell and the
current collector, using Plexiglas® plates fixed with screws.
Page 112
Experimental
100
3.4.3 Characterization
3.4.3.1 I-V Characteristics
I-V measurements of the tandem solar cells (0.79 cm² active area) were performed
under illuminated (100 mW/cm², AM 1.5 G) and dark conditions in the range of 2.0 V
to -2.0 V at various stages of the fabrication process of the hybrid device as described in
Chapter 3.2.2.1. Measurements were performed manually using contact pins for the
positive and negative electrode, which were placed on the Cu leads attached to the ITO
layer and the Cu top electrode. J-V curves were obtained by considering the active
electrode area. Thus, photovoltaic characteristic parameters such as VOC, Jsc, FF and
PCE were determined from the J-V curves.
3.4.3.2 Galvanostatic Cycling with Potential Limitation
Galvanostatic cycling measurements were performed at room temperature using a
multichannel MPG-2 potentiostat (Biologic Science Instruments) with an EC-LAB
VIO-34 software. After a 12 h OCV period to ensure sufficient soaking of the separator
with the electrolyte, the Li ion test battery in the integrated power pack was cycled five
to seven times at a C-rate of C/2 in the potential range of 0.3-1.1 V vs. Li/Li+
(for “LixCoSb2”/LTO and CoSb2/Li4+xTi5O12) and 0.2-1.15 V vs. Li/Li+ (for
“LixCoSb3”/LTO). For “LixCoSby”/LTO-based systems, “LixCoSby” served as counter
and reference electrode and LTO as working electrode. For CoSb2/Li4+xTi5O12-based
systems, CoSb2 was used as working electrode and Li4+xTi5O12 as counter and reference
electrode.
Page 113
Summary and Outlook
101
4 Summary and Outlook
Integrated power packs combine the advantages of solar energy conversion and storage
technologies in a single device comprising a three-terminal assembly with two positive
and a shared negative electrode. Such solar battery hybrid devices provide major
potential for future applications, for example in self-powering portable and mobile
energy systems like mobile phones or wireless sensors.[11,12,14,18]
This work introduces a
novel concept of an integrated solar battery hybrid device based on the combination of
an organic multi-junction solar cell and a low-voltage lithium-ion battery. For this
purpose, bulk-heterojunction solar cells and electrode materials for lithium-ion batteries
were prepared and characterized, followed by assembling and testing of the integrated
power pack.
Bulk-heterojunction (BHJ) single-junction solar cells were prepared in normal device
architecture on glass substrates coated with indium tin oxide (ITO) consisting of a
MoO3 hole-transport layer, a blend of conjugated polymers and fullerene derivatives
serving as donor and acceptor material, and a titanium/copper top electrode. Different
conjugated polymers (PCDTBT, PSiF-DBT, PCPDTBT, F8T2) blended with fullerene
derivatives ([60]PCBM, [70]PCBM, ICBA) were evaluated in varying donor:acceptor
ratios (1:1 w/w, 1:2 w/w, 1:4 w/w) for the application in BHJ solar cells aiming at a
good device performance, in particular a high photo-voltage generation. Amongst the
examined donor:acceptor combinations, PCDTBT:[70]PCBM (1:2 w/w)-based solar
cells were determined to exhibit the best device performance giving a VOC of 0.87 V,
a JSC of 7.86±0.18 mA/cm2, a FF of 57.3±1.3%, a PCE of 3.86±0.09%, and an external
quantum efficiency of 35% (380-580 nm). Single-junction solar cells were further
investigated with regard to the effect of the hole-transport layer thickness, the solvent
for solution processing and thermal annealing giving following optimized parameters
for device fabrication: 15 nm MoO3, chlorobenzene, and 40°C for slow evaporation of
the solvent. Nevertheless, the photo-voltage of the single-junction solar cell was too low
for a successful implementation as photovoltaic system in solar battery hybrid devices.
This is why organic multi-junction solar cells were prepared in order to supply a voltage
exceeding 1.15 V, which is required for charging the low-voltage lithium-ion battery
upon illumination of the solar cell.
Page 114
Summary and Outlook
102
Tandem solar cells were prepared by stacking PCDTBT:[70]PCBM (1:2 w/w)-based
sub-cells with a second sub-cell comprising various donor:acceptor blends. Amongst the
examined combinations, the best device performance was obtained using
PCDTBT:[70]PCBM (1:2 w/w) as active layer in both sub-cells. In order to investigate
the influence of various intermediate layers on the device performance, metals (Al, Ag,
Au, Cu, Ti) and metal oxides (TiOx, ZnO, MoO3) were combined with MoO3 serving as
electron- and hole-transport layer, respectively. The best photovoltaic characteristics
were obtained using a 1 nm Al / 15 nm MoO3 intermediate layer giving a VOC of
1.78 V, a JSC of 3.71±0.04 mA/cm², a FF of 58.9±0.9%, and a PCE of 3.88±0.03%.
Further optimization of the electron- and hole-transport layer thicknesses as well as
modification of intermediate layers with additional metal (Ca, Ti) and alkali-metal
compound layers (LiF, Cs2CO3) did not succeed in improved device performances.
However, the photo-voltage provided by PCDTBT:[70]PCBM (1:2 w/w)-based tandem
solar cells with Al/MoO3 intermediate layers upon illumination was in principle high
enough to charge the low-voltage lithium-ion battery.
A low-voltage lithium-ion battery with a battery voltage up to 1.15 V vs. Li/Li+ was
chosen as energy storage system of the integrated power pack because of the limitation
in the photo-voltage generation by the organic tandem solar cell. For this purpose,
composite electrodes based on lithium titanate (Li4Ti5O12, LTO), cobalt diantimonide
(CoSb2) and cobalt triantimonide (CoSb3) were prepared and characterized in half- and
full-cell configuration in three-electrode Swagelok cells via common electrochemical
methods including cyclic voltammetry (CV), galvanostatic cycling with potential
limitation (GCPL), galvanostatic intermittent titration technique (GITT), and potentio
electrochemical impedance spectroscopy (PEIS). Lithium titanate showed a very good
electrochemical behavior and cycling stability with an initial discharge/charge capacity
of 157 / 74 mAh/g, a Coulombic efficiency over 97% after the 10th
cycle, a flat voltage
plateau at about 1.50-1.55 V vs. Li/Li+ with very low polarization (below 50 mV) and a
specific practical capacity of 112.5 mAh/g, which is significant lower compared to the
theoretical capacity (175 mAh/g).[48]
The voltage plateau can be attributed to reversible
Li ion insertion/extraction processes in the lithium titanate host lattice accompanied by
the two-phase transition between spinel and rock-salt LTO.[50,101]
CoSb2 and CoSb3
showed an improved electrochemical behavior and discharge/charge capacity as a result
of an initial formation sequence with lower potential limits in galvanostatic cycling
Page 115
Summary and Outlook
103
measurements. This is based on the irreversible decomposition of the CoSby (y = 2,3)
solid concomitant with the reaction with lithium under formation of a binary Li3Sb
phase well-dispersed in a cobalt matrix during Li ion insertion without reconstruction of
CoSby upon Li ion extraction.[54,57,112]
This irreversible reaction mechanism was
supported by CV measurements. However, CoSb2 showed better electrochemical
behavior, cycling stability and Coulombic efficiencies during galvanostatic cycling but
slightly lower initial discharge/charge capacities (511 / 405 mAh/g) than CoSb3
(526 / 462 mAh/g). The specific practical capacities of both CoSb2 (350 mAh/g) and
CoSb3 (373 mAh/g) were lower compared to the theoretical ones (CoSb2:
530 mAh/g[110]
, CoSb3: 569 mAh/g[111]
).
The low-voltage lithium-ion battery with a battery voltage up to 1.15 V vs. Li/Li+
consisted of lithium titanate as positive electrode and pre-lithiated CoSby (“LixCoSby”)
as negative electrode. The “LixCoSb2”/LTO battery showed better cycling stability and
electrochemical behavior during prolonged galvanostatic cycling but lower
discharge/charge capacities (120 / 37 mAh/g) compared to the “LixCoSb3”/LTO battery
(146 / 61 mAh/g), which showed a significant higher capacity fading. Both full-cell
assemblies showed quite reasonable Coulombic efficiencies over 97% after the
10th
cycle. Because of the better characteristics, the “LixCoSb2”/LTO set-up was
preferably used as low-voltage lithium-ion battery for solar battery hybrid devices.
Table 12 shows chemical diffusion coefficients of Li+ in the examined composite
electrode materials determined from the Randles-Sevcik method (CV), the Warburg
diffusion element (PEIS) and a method derived from W. Weppner and R. A. Huggins
(GITT). The chemical diffusion coefficients determined via PEIS and GITT are in good
agreement but are up to three orders of magnitude lower compared to the data obtained
from the Randles-Sevcik method.
Table 12: Chemical diffusion coefficients of Li+ in various electrode materials
Electrode
Material
Chemical Diffusion Coefficient D
[cm²/s]
CV (Randles-Sevcik)
PEIS (Warburg diffusion element)
GITT (Weppner-Huggins)
Li4Ti5O12
1.8×10⁻¹²
- 6.0×10⁻¹⁴
(7.6±4.0)×10-13
(5.2±5.5)×10-14
CoSb2
1.1×10⁻¹¹
- 1.4×10⁻¹¹
(4.3±5.0)×10-14
(2.6±3.1)×10-14
CoSb3
2.4×10⁻¹¹
- 2.5×10⁻¹¹
(1.3±1.4)×10-13
(1.7±1.5)×10-14
Page 116
Summary and Outlook
104
The integrated power pack was fabricated by combining an organic multi-junction solar
cell with a low-voltage lithium-ion battery in a three-terminal assembly. The lower part
consisted of a PCDTBT:[70]PCBM (1:2 w/w)-based tandem solar cell with a Ti/Cu top
electrode with circular geometry (0.79 cm² active area). The battery system in the center
of the power pack was assembled on top of the multi-junction solar cell including a
combination of (i) pre-lithiated CoSby (“LixCoSby”) and LTO or (ii) pre-lithiated LTO
(Li4+xTi5O12) and CoSby electrodes. The upper part consisted of a current collector made
of a glass / ITO / Cu substrate with a Cu lead attached to the metal contact to provide
electrical contact to the battery system. The device was assembled and sealed under
argon atmosphere by applying pressure onto an O-ring using Plexiglas® plates. The
hybrid device was characterized on the basis of the performance of the solar cell and the
lithium-ion battery. The results showed that the solar cell characteristics, in particular
the open circuit voltage, significantly decreased caused by the influence of the
electrolyte (1 M LiPF6 in EC:DMC (1:1, v/v)) of the lithium-ion battery system on the
solar cell during long-term contact. With regard to the implemented lithium-ion
batteries, only the “LixCoSb3”/LTO battery showed adequate performance during
galvanostatic cycling with high initial discharge/charge capacities and Coulombic
efficiencies. The other examined battery systems (“LixCoSb2”/LTO, CoSb2/Li4+xTi5O12)
showed poor electrochemical behavior and cycling stability with significant capacity
fading.
However, it was not possible to measure the performance of the integrated solar battery
hybrid device, namely the charging of the lithium-ion battery upon illumination of the
organic tandem solar cell and discharging under dark conditions. This was based on the
one hand on the voltage drop of the solar cell caused by the electrolyte during long-term
contact. As a consequence, the voltage supplied by the multi-junction solar cell was too
low for charging the lithium-ion battery upon illumination requiring a minimum Vmpp of
1.15 V. On the other hand, the poor cycling performance with rapid capacity fading
upon galvanostatic cycling was problematic and might be due to inappropriate sealing
or contact with ambient atmosphere during long-term storage or by contacting
problems.
Thus, there is still much effort required to improve the performance of the energy
conversion and storage systems as well as to optimize the assembling procedure and
packaging process in order to succeed in the fabrication of a working hybrid device.
Page 117
Summary and Outlook
105
Further research includes the optimization of the solar cell performance, the
characterization of electrode materials and investigations with regard to the fabrication,
assembling and packaging procedure of integrated solar battery hybrid devices. The
solar cell performance, in particular the generated photo-voltage, needs to be improved
in order to combine the photovoltaic system with common lithium-ion electrode
materials such as graphite and LiCoO2. This is important for future high-voltage
applications such as self-powering and portable electronics. Moreover, appropriate low
and wide band gap polymers with complementary absorption behavior need to be
evaluated with regard to the application in multi-junction solar cells in order to improve
photon harvesting and the device performance.
Further work is required for characterization of the prepared electro-active materials and
composite electrodes. X-ray diffraction technique (XRD), for example, enables the
determination of the crystal structure of the cobalt antimonide powders and thus
provides the possibility to verify the formation of the respective compounds. Brunauer-
Emmet-Teller (BET) analysis is a useful method to determine the specific surface area
of the electro-active powder materials and the surface area of the prepared composite
electrodes. In order to examine the changes in the morphology of the electrodes by
insertion/extraction of lithium, the electrode materials can be characterized via scanning
electron microscopy (SEM) before and after lithiation. The insertion mechanism of
lithium in cobalt di- and triantimonides can be investigated by 121
Sb Mössbauer
spectroscopy.[120]
With regard to integrated solar battery hybrid devices, several problems need to be
overcome especially in terms of assembling and packaging in order to provide an air-
and moisture-tight sealing. Piercing of the top electrode of the tandem solar cell with
sharp edges of the current collector can be avoided by using conductive intermediate
layers or by drop coating of the electrode onto the solar cell. The present sealing method
using O-rings requires optimization and alternative sealing strategies need to be
investigated such as encapsulation with epoxy. In addition to that, the influence of the
electrolyte on the solar cell performance and alternative electrolytes (e.g. solid state
electrolytes) need to be examined. Furthermore, the stability of the photovoltaic system,
the battery system and the integrated solar battery hybrid device needs to be
investigated.
Page 118
References
106
5 References
[1] Key World Energy Statistics, International Energy Agency
http://www.iea.org/publications/freepublications/publication/KeyWorld2014.pdf
(accessed Aug 15, 2015).
[2] Liu, P.; Cao, Y.; Li, G.-R.; Gao, X.-P.; Ai, X.-P.; Yang, H.-X. ChemSusChem
2013, 6, 802–806.
[3] Snaith, H. J.; Schmidt-Mende, L. Adv. Mater. 2007, 19, 3187–3200.
[4] Ameri, T.; Dennler, G.; Lungenschmied, C.; Brabec, C. J. Energy Environ. Sci.
2009, 2, 347–363.
[5] World Energy Outlook 2013, Renewable Energy Outlook
http://www.worldenergyoutlook.org/media/weowebsite/2013/WEO2013_Ch06_
Renewables.pdf (accessed Aug 15, 2015).
[6] Energy and the Challenge of Sustainability, World Energy Assessment
http://www.undp.org/content/dam/aplaws/publication/en/publications/environme
nt-energy/www-ee-library/sustainable-energy/world-energy-assessment-energy-
and-the-challenge-of-sustainability/World Energy Assessment-2000.pdf
(accessed Aug 15, 2015).
[7] Chen, H.; Cong, T. N.; Yang, W.; Tan, C.; Li, Y.; Ding, Y. Prog. Nat. Sci. 2009,
19 (3), 291–312.
[8] Luo, X.; Wang, J.; Dooner, M.; Clarke, J. Appl. Energy 2015, 137, 511–536.
[9] Zhao, H.; Wu, Q.; Hu, S.; Xu, H.; Rasmussen, C. N. Appl. Energy 2014, 137,
545–553.
[10] Evans, A.; Strezov, V.; Evans, T. J. Renew. Sustain. Energy Rev. 2012, 16 (6),
4141–4147.
[11] Guo, W.; Xue, X.; Wang, S.; Lin, C.; Wang, Z. L. Nano Lett. 2012, 1–5.
[12] Chakrapani, V.; Rusli, F.; Filler, M. A.; Kohl, P. A. J. Power Sources 2012, 216,
84–88.
[13] Yu, M.; Ren, X.; Ma, L.; Wu, Y. Nat. Commun. 2014, 5, 5111.
[14] Xu, X.; Li, S.; Zhang, H.; Shen, Y.; Zakeeruddin, S. M.; Graetzel, M.;
Cheng, Y.-B.; Wang, M. ACS Nano 2015, 9 (2), 1782–1787.
Page 119
References
107
[15] Westover, A. S.; Share, K.; Carter, R.; Cohn, A. P.; Oakes, L.; Pint, C. L.
Appl. Phys. Lett. 2014, 104, 1–4.
[16] Fu, Y.; Wu, H.; Ye, S.; Cai, X.; Yu, X.; Hou, S.; Kafafy, H.; Zou, D.
Energy Environ. Sci. 2013, 6, 805.
[17] Chien, C.-T.; Hiralal, P.; Wang, D.-Y.; Huang, I.-S.; Chen, C.-C.; Chen, C.-W.;
Amaratunga, G. A. J. Small 2015, 11 (24), 2929-2937.
[18] Chen, T.; Qiu, L.; Yang, Z.; Cai, Z.; Ren, J.; Li, H.; Lin, H.; Sun, X.; Peng, H.
Angew. Chem. Int. Ed. 2012, 51, 11977–11980.
[19] Green, M. A. Phys. E Low-Dimensional Syst. Nanostructures 2002, 14 (1-2),
65–70.
[20] Aberle, A. G. Thin Solid Films 2009, 517, 4706–4710.
[21] Jackson, P.; Hariskos, D.; Lotter, E.; Paetel, S.; Wuerz, R.; Menner, R.;
Wischmann, W.; Powalla, M. Prog. Photovoltaics Res. Appl. 2011, 19 (7),
894–897.
[22] Yan, J.; Saunders, B. R. RSC Adv. 2014, 4, 43286–43314.
[23] Günes, S.; Neugebauer, H.; Sariciftci, N. S. Chem.Rev. 2007, 107, 1324–1338.
[24] Zhong, Y.; Trinh, M. T.; Chen, R.; Wang, W.; Khlyabich, P. P.; Kumar, B.;
Xu, Q.; Nam, C.-Y.; Sfeir, M. Y.; Black, C.; Steigerwald, M. L.; Loo, Y.-L.;
Xiao, S.; Ng, F.; Zhu, X.-Y.; Nuckolls, C. J. Am. Chem. Soc. 2014, 136,
15215–15221.
[25] Etxebarria, I.; Ajuria, J.; Pacios, R. Org. Electron. 2015, 19, 34–60.
[26] Veldman, D.; Offermans, T.; Sweelssen, J.; Koetse, M. M.; Meskers, S. C. J.;
Janssen, R. A. J. Thin Solid Films 2006, 511-512, 333–337.
[27] Udum, Y.; Denk, P.; Adam, G.; Apaydin, D. H.; Nevosad, A.; Teichert, C.;
White, M. S.; Sariciftci, N. S.; Scharber, M. C. Org. Electron. 2014, 15,
997–1001.
[28] Blom, P. W. M.; Mihailetchi, V. D.; Koster, L. J. A.; Markov, D. E. Adv. Mater.
2007, 19, 1551–1566.
[29] Tamai, Y.; Ohkita, H.; Benten, H.; Ito, S. J. Phys. Chem. Lett. 2015, 6,
3417–3428.
[30] Veldman, D.; Meskers, S. C. J.; Janssen, R. A. J. Adv. Funct. Mater. 2009, 19,
1939–1948.
[31] Heeger, A. J. Adv. Mater. 2014, 26, 10–28.
Page 120
References
108
[32] Shockley, W.; Queisser, H. J. J. Appl. Phys. 1961, 32 (3), 510–519.
[33] Würfel, P. Physics in Solar Cells; Wiley-VCH: Berlin, Germany, 2004.
[34] Ameri, T.; Li, N.; Brabec, C. J. Energy Environ. Sci. 2013, 6, 2390–2413.
[35] De Vos, A. J. Phys. D. Appl. Phys. 1980, 13, 839–846.
[36] Wang, Y.; Cao, G. Adv. Mater. 2008, 20, 2251–2269.
[37] Whittingham, M. S. Prog. Solid State Chem. 1978, 12 (1), 41–99.
[38] Winter, M.; Besenhard, J. O.; Spahr, M. E.; Novák, P. Adv. Mater. 1998, 10 (10),
725–763.
[39] Zaghib, K.; Mauger, A.; Groult, H.; Goodenough, J. B.; Julien, C. M.
Materials (Basel). 2013, 6, 1028–1049.
[40] Buqa, H.; Goers, D.; Holzapfel, M.; Spahr, M. E.; Novak, P. J. Electrochem. Soc.
2005, 152 (2), A474–A481.
[41] Chen, J. S.; Archer, L. A.; Lou, X. W. (David). J. Mater. Chem. 2011, 21,
9912–9924.
[42] Hwang, H.; Kim, H.; Cho, J. Nano Lett. 2011, 11 (11), 4826–4830.
[43] Rao, B. M. L.; Francis, R. W.; Christopher, H. A. J. Electrochem. Soc. 1977, 124
(10), 1490–1492.
[44] Wang, J.; Raistrick, I. D.; Huggins, R. A. J. Electrochem. Soc. 1986, 133 (3),
457–460.
[45] Arora, P.; Zhang, Z. Chem. Rev. 2004, 104, 4419–4462.
[46] Zhang, S. S.; Xu, K.; Jow, T. R. J. Electrochem. Soc. 2002, 149 (5), A586–A590.
[47] Marom, R.; Haik, O.; Aurbach, D.; Halalay, I. C. J. Electrochem. Soc. 2010, 157
(8), A972–A983.
[48] Sun, X.; Radovanovic, P. V.; Cui, B. New J. Chem. 2015, 39 (1), 38–63.
[49] Hsiao, K.-C.; Liao, S.-C.; Chen, J.-M. Electrochim. Acta 2008, 53, 7242–7247.
[50] Ohzuku, T.; Ueda, A.; Yamamoto, N. J. Electrochem. Soc. 1995, 142 (5),
1431–1435.
[51] Zaghib, K.; Simoneau, M.; Armand, M.; Gauthier, M. J. Power Sources 1999,
81-82, 300–305.
[52] Chen, J.; Yang, L.; Fang, S.; Tang, Y. Electrochim. Acta 2010, 55, 6596–6600.
Page 121
References
109
[53] Naoi, K.; Ishimoto, S.; Isobe, Y.; Aoyagi, S. J. Power Sources 2010, 195,
6250–6254.
[54] Park, M.-G.; Song, J. H.; Sohn, J.-S.; Lee, C. K.; Park, C.-M. J. Mater. Chem. A
2014, 2, 11391–11399.
[55] Xie, J.; Zheng, Y.-X.; Liu, S.-Y.; Song, W.-T.; Zhu, Y.-G.; Cao, G.-S.;
Zhu, T.-J.; Zhao, X.-B. Int. J. Electrochem. Sci. 2012, 7, 1319–1331.
[56] Amornpitoksuk, P.; Suwanboon, S. J. Alloys Compd. 2009, 473, 373–375.
[57] Alcántara, R.; Fernández-Madrigal, F. J.; Lavela, P.; Tirado, J. L.; Jumas, J. C.;
Olivier-Fourcade, J. J. Mater. Chem. 1999, 9, 2517–2521.
[58] Shrotriya, V.; Li, G.; Yao, Y.; Chu, C.-W.; Yang, Y. Appl. Phys. Lett. 2006, 88,
073508.
[59] Brunetti, F. G.; Kumar, R.; Wudl, F. J. Mater. Chem. 2010, 20, 2934–2948.
[60] Xin, H.; Guo, X.; Kim, F. S.; Ren, G.; Watson, M. D.; Jenekhe, S. A.
J. Mater. Chem. 2009, 19, 5303–5310.
[61] Wang, F.; Xu, Q.; Tan, Z.; Li, L.; Li, S.; Hou, X.; Sun, G.; Tu, X.; Hou, J.; Li, Y.
J. Mater. Chem. A 2014, 2, 1318–1324.
[62] Zhang, F.; Zhuo, Z.; Zhang, J.; Wang, X.; Xu, X.; Wang, Z.; Xin, Y.; Wang, J.;
Wang, J.; Tang, W.; Xu, Z.; Wang, Y. Sol. Energy Mater. Sol. Cells 2012, 97,
71–77.
[63] Cheng, P.; Li, Y.; Zhan, X. Energy Environ. Sci. 2014, 7 (6), 2005–2011.
[64] Lin, S.-H.; Lan, S.; Sun, J.-Y.; Lin, C.-F. Org. Electron. 2013, 14 (1), 26–31.
[65] Park, S. H.; Roy, A.; Beaupré, S.; Cho, S.; Coates, N.; Moon, J. S.; Moses, D.;
Leclerc, M.; Lee, K.; Heeger, A. J. Nat. Photonics 2009, 3 (5), 297–302.
[66] Yao, Y.; Hou, J.; Xu, Z.; Li, G.; Yang, Y. Adv. Funct. Mater. 2008, 18,
1783–1789.
[67] Zhang, F.; Jespersen, K. G.; Björström, C.; Svensson, M.; Andersson, M. R.;
Sundström, V.; Magnusson, K.; Moons, E.; Yartsev, A.; Inganäs, O.
Adv. Funct. Mater. 2006, 16, 667–674.
[68] Synooka, O.; Eberhardt, K.-R.; Singh, C. R.; Hermann, F.; Ecke, G.; Ecker, B.;
von Hauff, E.; Gobsch, G.; Hoppe, H. Adv. Energy Mater. 2014, 4, 1300981.
[69] Blouin, N.; Michaud, A.; Gendron, D.; Wakim, S.; Blair, E.; Neagu-Plesu, R.;
Belletête, M.; Durocher, G.; Tao, Y.; Leclerc, M. J. Am. Chem. Soc. 2008, 130
(2), 732–742.
Page 122
References
110
[70] Muzafarov, A. M.; Bockholt, A. Silicon Polymers; Advances in Polymer Science;
Springer-Verlag: Berlin, Heidelberg, 2010.
[71] Peet, J.; Kim, J. Y.; Coates, N. E.; Ma, W. L.; Moses, D.; Heeger, A. J.;
Bazan, G. C. Nat. Mater. 2007, 6, 497–500.
[72] Zhao, D. W.; Sun, X. W.; Jiang, C. Y.; Kyaw, A. K. K.; Lo, G. Q.; Kwong, D. L.
Appl. Phys. Lett. 2008, 93 (8), 1–4.
[73] Kraffert, F.; Steyrleuthner, R.; Albrecht, S.; Neher, D.; Scharber, M. C.; Bittl, R.;
Behrends, J. J. Phys. Chem. C 2014, 118, 28482–28493.
[74] Troshin, P. A.; Hoppe, H.; Peregudov, A. S.; Egginger, M.; Shokhovets, S.;
Gobsch, G.; Sariciftci, N. S.; Razumov, V. F. ChemSusChem 2011, 4, 119–124.
[75] Kaltenhauser, V. In situ synthesis of metal sulphide / polymer nanocomposites in
single junction and tandem solar cells. Dissertation, Graz University of
Technology, 2013.
[76] Kim, J. Y.; Lee, K.; Coates, N. E.; Moses, D.; Nguyen, T.-Q.; Dante, M.;
Heeger, A. J. Science 2007, 317, 222–225.
[77] Gilot, J.; Wienk, M. M.; Janssen, R. A. J. Appl. Phys. Lett. 2007, 90, 143512.
[78] Yakimov, A.; Forrest, S. R. Appl. Phys. Lett. 2002, 80 (9), 1667–1669.
[79] Hiramoto, M.; Suezaki, M.; Yokoyama, M. Chem. Lett. 1990, 327–330.
[80] Chen, F.-C.; Lin, C.-H. J. Phys. D. Appl. Phys. 2009, 43, 025104.
[81] Dhass, A. D.; Natarajan, E.; Ponnusamy, L. Proc. - ICETEEEM 2012, Int. Conf.
Emerg. Trends Electr. Eng. Energy Manag. 2012, 382–386.
[82] Yan, X.; Hao, H.; Chen, Y.; Shi, S.; Zhang, E.; Lou, J.; Liu, B.
Nanoscale Res. Lett. 2014, 9 (1), 548.
[83] Brabec, C. J.; Cravino, A.; Meissner, D.; Sariciftci, N. S.; Fromherz, T.;
Rispens, M. T.; Sanchez, L.; Hummelen, J. C. Adv. Funct. Mater. 2001, 11 (5),
374–380.
[84] Kasemo, B.; Lausmaa, J. J. Biomed. Mater. Res. 1988, 22 (A2), 145–158.
[85] Tjong, S. C.; Mai, Y.-W. Physical Properties and Applications of Polymer
Nanocomposites; Woodhead Publishing: Cambridge, 2010.
[86] Dennler, G.; Prall, H.-J.; Koeppe, R.; Egginger, M.; Autengruber, R.;
Sariciftci, N. S. Appl. Phys. Lett. 2006, 89 (7), 73502.
[87] Colsmann, A.; Junge, J.; Kayser, C.; Lemmer, U. Appl. Phys. Lett. 2006, 89 (20),
203506.
Page 123
References
111
[88] Janssen, A. G. F.; Riedl, T.; Hamwi, S.; Johannes, H.-H.; Kowalsky, W.
Appl. Phys. Lett. 2007, 91, 073519.
[89] Hadipour, A.; De Boer, B.; Blom, P. W. M. Adv. Funct. Mater. 2008, 18 (2),
169–181.
[90] Sun, X. W.; Zhao, D. W.; Ke, L.; Kyaw, A. K. K.; Lo, G. Q.; Kwong, D. L.
Appl. Phys. Lett. 2010, 97, 053303.
[91] Yuan, Y.; Huang, J.; Li, G. Green 2011, 1, 65–80.
[92] Ajuria, J.; Etxebarria, I.; Cambarau, W.; Muñecas, U.; Tena-Zaera, R.;
Jimeno, J. C.; Pacios, R. Energy Environ. Sci. 2011, 4, 453–458.
[93] Olthof, S.; Timmreck, R.; Riede, M.; Leo, K. Appl. Phys. Lett. 2012, 100,
113302.
[94] Fan, X.; Guo, S.; Fang, G.; Zhan, C.; Wang, H.; Zhang, Z.; Li, Y.
Sol. Energy Mater. Sol. Cells 2013, 113, 135–139.
[95] Wang, E.; Wang, L.; Lan, L.; Luo, C.; Zhuang, W.; Peng, J.; Cao, Y.
Appl. Phys. Lett. 2008, 92 (3), 033307.
[96] Dennler, G.; Scharber, M. C.; Brabec, C. J. Adv. Mater. 2009, 21, 1323–1338.
[97] Huang, J.-H.; Lee, C.-P.; Ho, Z.-Y.; Kekuda, D.; Chu, C.-W.; Ho, K.-C.
Sol. Energy Mater. Sol. Cells 2010, 94 (1), 22–28.
[98] Reference Solar Spectral Irradiance: Air Mass 1.5
http://rredc.nrel.gov/solar/spectra/am1.5/ (accessed Jul 31, 2015).
[99] Gueymard, C. A.; Myers, D.; Emery, K. Sol. Energy 2002, 73 (6), 443–467.
[100] Chu, T.-Y.; Alem, S.; Verly, P. G.; Wakim, S.; Lu, J.; Tao, Y.; Beaupre, S.;
Leclerc, M.; Belanger, F.; Desilets, D.; Rodman, S.; Waller, D.; Gaudiana, R.
Appl. Phys. Lett. 2009, 95, 063304.
[101] Jiang, Y.-M.; Wang, K.-X.; Zhang, H.-J.; Wang, J.-F.; Chen, J.-S. Sci. Rep. 2013,
3, 3490.
[102] Kissinger, P. T.; Heineman, W. R. J. Chem. Educ. 1983, 60 (9), 702–706.
[103] Xu, W.; Wang, J.; Ding, F.; Chen, X.; Nasybulin, E.; Zhang, Y.; Zhang, J.-G.
Energy Environ. Sci. 2014, 7, 513–537.
[104] Bard, A. J.; Faulkner, L. R. Electrochemical Methods: Fundamentals and
Applications; John Wiley & Sons: New York, 1980.
[105] Lindström, H.; Södergren, S.; Solbrand, A.; Rensmo, H.; Hjelm, J.; Hagfeldt, A.;
Lindquist, S.-E. J. Phys. Chem. B 1997, 101, 7717–7722.
Page 124
References
112
[106] Holzapfel, M. Lithium Titanium Spinel - Li4Ti5O12, An Inherently Safe Anode
Material for Lithium Ion Batteries – EXM 1037
http://www.phostechlithium.com/documents/TechnicalDataSheetEXM1037.pdf
(accessed Jul 18, 2015).
[107] Rho, Y. H.; Kanamura, K. J. Solid State Chem. 2004, 177, 2094–2100.
[108] Kavan, L.; Prochazka, J.; Spitler, T. M.; Kalbac, M.; Zukalova, M.; Drezen, T.;
Gratzel, M. J. Electrochem. Soc. 2003, 150 (7), A1000–A1007.
[109] Takami, N.; Hoshina, K.; Inagaki, H. J. Electrochem. Soc. 2011, 158 (6),
A725–A730.
[110] Xie, J.; Zhao, X. B.; Cao, G. S.; Zhong, Y. D.; Zhao, M. J.; Tu, J. P.
Electrochim. Acta 2005, 50, 1903–1907.
[111] Zhu, J.; Sun, T.; Chen, J.; Shi, W.; Zhang, X.; Lou, X.; Mhaisalkar, S.;
Hng, H. H.; Boey, F.; Ma, J.; Yan, Q. Chem. Mater. 2010, 22 (18), 5333–5339.
[112] Xie, J.; Zhao, X.; Cao, G.; Zhong, Y.; Zhao, M. J. Electroanal. Chem. 2003, 542,
1–6.
[113] Hong, K.-S.; Nam, D.-H.; Lim, S.-J.; Sohn, D.; Kim, T.-H.; Kwon, H.-S.
ACS Appl. Mater. Interfaces 2015.
[114] Toprak, M. S.; Stiewe, C.; Platzek, D.; Williams, S.; Bertini, L.; Müller, E.;
Gatti, C.; Zhang, Y.; Rowe, M.; Muhammed, M. Adv. Funct. Mater. 2004, 14
(12), 1189–1196.
[115] Tarascon, J.-M.; Morcrette, M.; Dupont, L.; Chabre, Y.; Payen, C.; Larcher, D.;
Pralong, V. J. Electrochem. Soc. 2003, 150 (6), A732–A741.
[116] Park, C.-M.; Yoon, S.; Lee, S.-I.; Kim, J.-H.; Jung, J.-H.; Sohn, H.-J.
J. Electrochem. Soc. 2007, 154 (10), A917–A920.
[117] Hanzu, I.; Djenizian, T.; Knauth, P. J. Phys. Chem. C 2011, 115, 5989–5996.
[118] Weppner, W.; Huggins, R. A. J. Electrochem. Soc. 1977, 124 (10), 1569–1578.
[119] Kamienski, C. W.; McDonald, D. P.; Stark, M. W.; Papcun, J. R. In Kirk-Othmer
Encyclopedia of Chemical Technology; John Wiley & Sons, Inc., 2004.
[120] Ionica, C. M.; Aldon, L.; Lippens, P. E.; Morato, F.; Olivier-Fourcade, J.;
Jumas, J.-C. Hyperfine Interact. 2004, 156-157 (1-4), 555–561.