Preparation and characterization of porous (Si1−xTix)O2 (x ≤ 0.25)prepared by sol–gel hydrothermal process
ROBERTO MENDOZA-SERNA1,∗ , JOSÉ OCOTLÁN FLORES-FLORES2,MARINA CABALLERO-DÍAZ1, ATENEA JOSEFINA CHONG-SANTIAGO1,LUCILA VALDEZ-CASTRO3 and ROBERTO YSACC SATO-BERRÚ2
1Carrera de Ingeniería Química, Unidad Multidisciplinaria de Investigación Experimental Zaragoza (UMIEZ), Facultad deEstudios Superiores Zaragoza, Universidad Nacional Autónoma de México, CD de México 09230, México2Departamento de Micro y Nanotecnologías, Instituto de Ciencias Aplicadas y Tecnología (ICAT), Universidad NacionalAutónoma de México, CD de México 04510, México3Departamento de Ingeniería en Biotecnología, Universidad Politécnica de Puebla, Puebla 72640, México∗Author for correspondence ([email protected])
MS received 13 March 2019; accepted 25 September 2019
Abstract. An experimental strategy was developed to obtain (Si1−xTix )O2 (x ≤ 0.25) porous materials via the sol–gelhydrothermal process. The sol was prepared from Si(OEt)4 (TEOS), Ti(OBu)4 (OBu: OCH2CH2CH2CH3), anhydrousethanol, deionized water and nitric acid. The reagents were mixed at room temperature (293 K) to obtain a homogeneouscolourless liquid which was subjected to a hydrothermal process at 473 K using a stainless steel container. Finally, the materialobtained was treated at 873 K in air. The surface area of the treated solids was determined by N2 adsorption/desorptionisotherms. The corresponding average pore diameter was evaluated using the Barret, Joiner and Halenda and Horváth-Kawazoe methods. Porous structures were obtained, in which the average pore diameter of the microporous ones was 1.4nm. The characterization techniques employed were Fourier transform infrared spectroscopy (FTIR), X-ray diffraction,Raman spectroscopy, scanning electron microscopy, thermal gravimetric analysis, differential scanning calorimetry andUV–Vis diffuse reflectance spectroscopy. The Si–O–Ti bonds were detected by FTIR.
One of the main technological interests of the sol–gel processis related to the preparation of amorphous solids with largespecific surface area and high porosity. TiO2/SiO2 has beeninvestigated to obtain films with better properties than those ofTiO2 and SiO2 pure thin films. SiO2 supported TiO2 materialshave been extensively used as catalysts for a wide variety ofreactions because their physicochemical properties are supe-rior than those of the single oxides [1]. SiO2 itself does notexhibit photocatalytic properties; however, given its largespecific surface area and high porosity, SiO2 can act as anadsorbent to improve the reactant concentration on TiO2 sur-face, thereby improving the photocatalytic activity of TiO2
[2–5]. It was observed that titanosilicates play an importantrole in producing the nucleophile, which leads to smoothnucleophilic reactions with high product selectivity [6]. Thehydrothermal method is of great interest because it is a safesynthesis performed at moderate temperature [7], and it makesit possible to synthesize materials with high specific surfacearea [8,9]. The objective of this research is to obtain porousmaterials with high specific surface area, with possibilities tobe used in the preparation of membranes for gas separation,
using a conventional sol–gel process combined with ahydrothermal one.
2. Experimental
The synthesis of the (Si1−xTix )O2 (x ≤ 0.25) oxides beganwith the formation of a gel from the mixture of the followingreagents: titanium butoxide, tetraethylorthosilicate (TEOS),anhydrous ethanol, deionized water and nitric acid, for whichthe following procedure was performed under normal condi-tions. In a 20 ml glass flask, 5 ml of titanium tetrabutoxide(Sigma, Aldrich, CAS-5593-70-4) was dissolved in 10 ml ofanhydrous ethanol (Sigma, Aldrich, CAS-64-17-5) and keptunder constant stirring for 30 min, using a magnetic stirrerand a Teflon magnetic rod in a dry atmosphere. This solu-tion was labelled as ‘solution A’. In a second container of thesame volume, 5 ml of TEOS (Sigma, Aldrich, CAS-78-10-4) and 5 ml of deionized water were added, in addition to0.05 ml of nitric acid (Sigma, Aldrich, CAS-7697-37-2) as acatalyst to induce the hydrolysis process that was producedand accelerated by constant mechanical agitation of the mix-ture for 30 min. We used acid catalysis because we aimed
0123456789().: V,-vol
67 Page 2 of 7 Bull. Mater. Sci. (2020) 43:67
to obtain materials with small pore diameter, and it has beenreported that in acid conditions, a material with a pore size of<2 nm is obtained, while under alkaline conditions, materi-als with pore diameter between 2 and 50 nm are obtained[10]. The resulting colourless solution was labelled as‘solution B’. Solution A was slowly added to solution B,which was kept under constant mechanical agitation for 2h, obtaining a homogeneous mixture of light yellow colour.The sample obtained was transferred to a Teflon container andleft to gel for a period of 24 h at normal conditions, and inthat period, it continued with the polymerization process. Thegelled samples placed in the Teflon container with lid, werethen placed in an ASI 316 stainless steel container that has alid with rope and that closes hermetically with a Teflon seal.The reactor was put in a Novatech H535-AIA stove and leftthere for 24 h, at a constant temperature of 473 K. The approx-imate calculation of the water and alcohol pressure using thefree volume of the reactor was 227 atm. Finally, the solventsobtained as condensation reaction products were removed byevaporation at 423 K, obtaining a white material.
3. Characterization techniques
The N2 adsorption/desorption isotherms of the solids treatedat 873 K were measured at 77 K in a Quantachrome Autosorb-1 after outgassing at 423 K for 12 h. The surface areameasurements of solids were obtained with the Brunauer,Emmet and Teller (BET) and Dollimore Heal (DH) methods.To account for the meso- and micro-porous regions of thesolid surface, we used the Barret, Joiner and Halenda (BJH)and the Horváth-Kawazoe (HK) methods of calculation.
The Fourier transform infrared spectroscopy (FTIR) spec-tra of the oxides treated at 873 K were obtained using a Nicolet
Figure 1. Nitrogen adsorption/desorption isotherms of the solidstreated at 873 K.
Nexus 670 FTIR spectrophotometer in the 4000–400 cm−1
region. KBr pellets were prepared grounding the samples inan agate mortar and mixing with anhydrous KBr in a weightratio of 99:1 KBr:sample, respectively.
X-ray diffraction (XRD) patterns were obtained using aRingaku Ultima IV diffractometer with zirconium-filteredmolybdenum X-rays (or coupled to a copper anode X-raytube). The intensity values were read at intervals �2� =0.02◦ from 2� = 10–60◦.
The Raman spectroscopy analyses were done using theRaman micro technique that consists a Raman NicoletAlmega XR spectrometer adapted to a microscope, whichallowed analysing the presence of different phases in the solid.
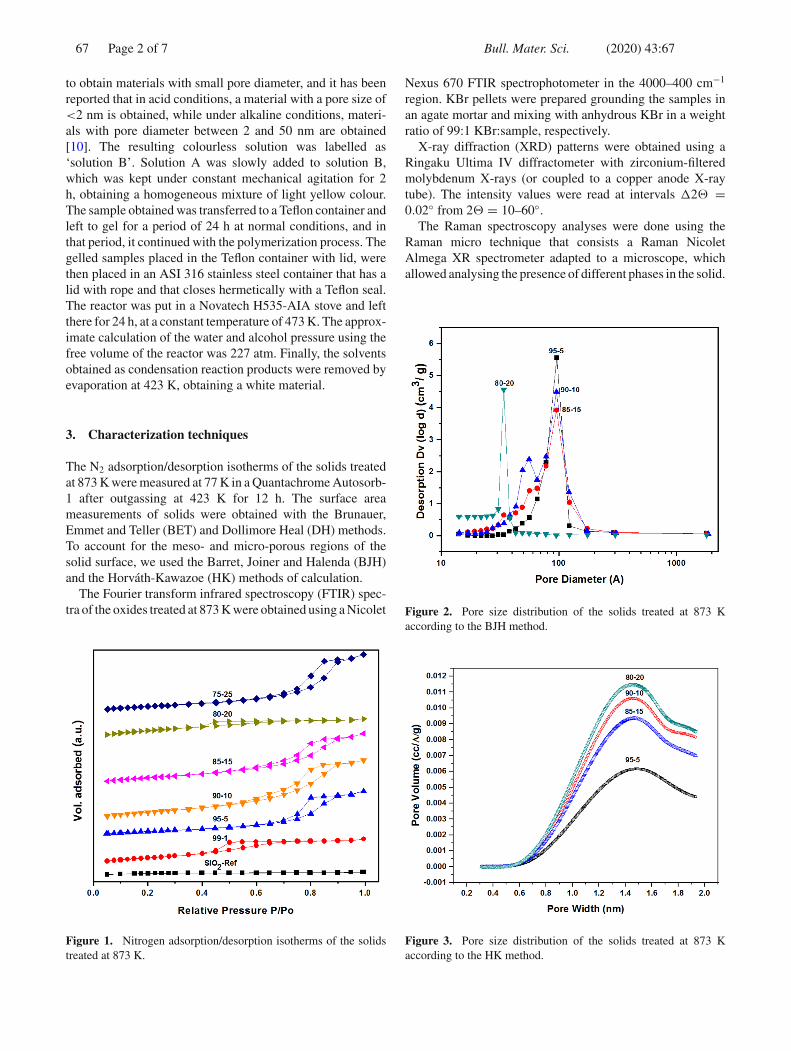
Figure 2. Pore size distribution of the solids treated at 873 Kaccording to the BJH method.
Figure 3. Pore size distribution of the solids treated at 873 Kaccording to the HK method.
Bull. Mater. Sci. (2020) 43:67 Page 3 of 7 67
Table 1. Porosimetry data of the solids treated at 873 K.
The scanning electron microscopy (SEM) results wereobtained using a Zeiss Digital Scanning Microscope DSM940A. The grids were coated with carbon by sputtering. Adrop of a sonicated slurry prepared using EtOH to suspendthe xerogel, was poured over a coated grid and left to dryslowly overnight. An additional coating was done with car-bon to ensure that the samples were electrically conductiveand stable during the analysis.
Thermal gravimetric analyses (TGA) and differential scan-ning calorimetry (DSC) of powders were performed in aNET-ZSCH STA 409 EP equipment, in air atmosphere at 10 Kmin−1 heating rate from 303 to 1273 K.
UV–Vis diffuse reflectance spectroscopy (DRS) of thesolids was done in a UV–Vis–NIR Cary 5000 spectropho-tometer.
4. Results and discussion
The isotherms for the (Si1−xTix )O2 (x ≤ 0.25) at 873 Kare shown in figure 1. The 95:5, 90:10, 85:15 and 75:25samples exhibit a type IV isotherm according to the IUPACclassification [11], indicating that microporous materials arepresent along with mesoporous ones, the hysteresis loops aretype H1, which is characteristic of materials with cylindri-cal pore geometry and a high degree of pore size uniformity[12,13]. The 99:1 and 80:20 samples exhibit an isotherm typeI [14,15], usually considered to be indicative of adsorption inmicropores materials or monolayer adsorption due to a strongadsorbent–adsorbate interaction, the hysteresis loop is typeH4 characteristic of materials with large mesopores embed-ded in a matrix with pores of much smaller size [16]. Thepore size distribution in the mesoporous zone was evaluatedusing the BJH method [17] (see figure 2), the average porediameter decreases as the TiO2 content increases. The poresize distribution in the microporous zone was evaluated usingthe HK method [18] (see figure 3), the average pore diameterof microporous was 1.4 nm. The results are shown in table 1.The achievement of the high specific surface area was basedon a difference in the hydrolysis rate between Ti(OBu)4 andSi(OEt)4 under the same hydrothermal condition [19]. TheFTIR bands assignment for the solids treated at 873 K isgiven in table 2. The most important feature in these spectra
Table 2. FTIR bands assignment.
AssignmentWavenumber (cm−1)
SiO2–TiO2
O–H stretching [20] 3438C–H stretching [21] 2924C–H stretching of CH2
and CH3 groups [22]2850
Si–O overtone [23] 1632Si–O stretch. In linear Si–O–Si [24] 1107Si–O–Ti [25] 973(–Si–O)–n [26] 802Si–O–Si [27,28] 472
Figure 4. FTIR spectra of the solids treated at 873 K.
was the detection of the Si–O–Ti bonds at 973 cm−1, whichare present in every sample of hybrid oxides. Moreover, thereare two near absorption bands in the same range of vibration,one of them is attributed to the stretching vibration of Si–OHor Si(OCH2CH3) groups at 960 and 970 cm−1, respectively[29], superimposed onto that by Si–O–Ti stretching [30]. Thespectra are shown in figure 4.
67 Page 4 of 7 Bull. Mater. Sci. (2020) 43:67
Figure 5. XRD patterns of the solids treated at 873 K.
Figure 6. Raman spectra of the solids treated at 873 K.
The XRD patterns of the (Si1−xTix )O2 (x ≤ 0.25) powdersare shown in figure 5. It is observed that the resulting XRDpatterns present low intensity peaks characteristic of theanatase phase at 2θ = 25.3, 37.9, 38.576, 48.2, 54.1 and55.2 (JCPDS no. 73-1764). Wide and low intensity diffractionpeaks associated with the anatase phase, in particular the peakat 2θ = 25.28, which maintains its intensity even though themolar concentration of TiO2 increases. which is associatedwith an amorphous material doped with the anatase phase,presumably of nanometric size and that is formed as a conse-quence of the instability of the titanium alkoxide during theinitial mixing.
As can be seen in the Raman spectra of figure 6, thematerials do not show any signs of Raman shifts associated
Figure 7. SEM of SiO2–TiO2 85:15 treated at 873 K.
Figure 8. SEM of SiO2–TiO2 80:20 treated at 873 K.
with any allotropic phase of TiO2. In addition, this type ofspectrum is characteristic of an amorphous material. To reaf-firm the previous discussion corresponding to the surface areaand pore diameter of the synthesized materials, the SEM ofthe materials synthesized with a molar ratio is presented as85:15 in figure 7, and 80:20 in figure 8. You can see the poresizes, which according to the scale, have an average diam-eter of 5 nm. It is confirmed that the materials obtained aremesoporous.
Bull. Mater. Sci. (2020) 43:67 Page 5 of 7 67
Figure 9. TGA curves of SiO2–TiO2 samples.
Figure 10. DSC curve of SiO2–TiO2 80:20.
The materials synthesized were dried and later analysed bythe technique of TGA and DSC. The TGA curves are shownin figure 9 and the DSC ones are shown in figure 10. For abetter description of the thermogravimetric study, it has beendivided into three temperature ranges.
(1) In the range of 303–533 K, a greater weight loss isobserved by the evaporation of water and alcohols(ethanol and butanol) from silicon and titanium precur-sors. Process that is justified by the endothermic peaksassociated to the same temperature range, present inthe DSC curve.
(2) A weight loss observed in the range of 533–953 Kassociated to the combustion of alcohols (ethanol andbutanol) as well as to the groups of ethoxide andperoxides of the condensation. The DSC graph of
Figure 11. UV–Vis spectrum (DRS) of SiO2–TiO2 samples.
Figure 12. Calculated band gap for SiO2–TiO2 75:25.
this temperature range only shows exothermic signals,which strengthen the aforementioned discussion.
(3) Finally, in the temperature range 953–1273 K, a smallweight change is observed, corresponding to the con-tinuous dehydroxylation at high temperature of theformed material. In this temperature range, there is noclear indication of the formation of allotropic phases ofany silicate or titanate, as shown by the correspondingDSC graph.
Figure 11 shows the UV–Vis spectra of the diffuse reflectanceof the synthesized mixed oxides. The SiO2 does not absorbsignals between 240 and 500 nm within the UV–Vis spectrum,because it has electronic transitions at smaller wavelengthsbelow 200 nm. On the other hand, the increase in the molarratio of TiO2, as observed, produces an increase in the absorp-tion of signals between 240 and 380 nm. In addition, the
increase in TiO2 within the synthesized materials, displacesthe absorption edges at larger wavelengths, possibly caused bythe formation of small crystals of TiO2 (anatase phase) associ-ated with a coordination number of Ti tetrahedral [31]. Fromthe absorption bands obtained, the values for the band gap(Eg) were obtained by the Kubelka–Munk function [32]. Forstudying the optical band gap of the (Si1−xTix )O2 (x ≤ 0.25)samples, a DRS analysis was done using Tauc equation[33,34], for the 75:25 sample shown in figure 12, and theresults are presented in table 3.
5. Conclusions
It was possible to synthesize mixed oxides of silica–titaniathrough the combined sol–gel process by hydrothermal treat-ment at 473 K. Through the BET method, type IV adsorption–desorption isotherms were obtained with a type H1 hystere-sis loop, indicating that microporous structures are presentalong with mesoporous ones, with high surface areas(400–700 m2 g−1) and average pore diameters in the rangefrom 1.4 to 10.2 nm.
The infrared spectra of the synthesized mixed oxides exhib-ited characteristic bands of a silicate, with the appearanceof a new absorption band at 973 cm−1 associated with theformation of ≡Si–O–Ti≡ bonds. The XRD patterns of thesynthesized materials exhibited the formation of an allotropicphase of TiO2 (anatase) at the level of impurities, when themolar ratio and temperature are increased. The signals of theRaman spectra of the materials obtained showed that a amor-phous material was synthesized. Through MEB, the pores ofthe material were observed and a homogenous distribution ofsize could be seen. By means of the TGA study, the weightlosses of the material were associated to the process of dehy-dration and combustion of alcohols and alkoxide groups. TheDSC analysis allowed verifying the endothermic and exother-mic processes related to the evaporation of water, alcohols andcombustion of residual ethoxide and butoxide groups duringthe hydrolysis and condensation reactions. Eg values of thesynthesized mixed oxides are semiconductor type, they areclose to the value of commercial TiO2 (Degusa 25), which is3.3 eV.
Acknowledgements
RM-S, MC-D, AJCh-S and LV-C gratefully acknowledgeDGAPA U.N.A.M. (grant PAPIIT no. IN 114516) for thefunding for the fulfilment of this work. We would also like tothank LUCE-UNAM, for the spectroscopic Raman and FTIRanalysis.
References
[1] Bellardita M, Addamo M, Di Paola A, Marc G, Palmisano L,Cassar L et al 2010 J. Hazard. Mater. 174 707
[2] Wu L, Yan H, Xiao J, Li X and Wang X 2017 Ceram. Int. 439377
[3] Wang X, Yu J C, Ho Ch, Hou Y and Fu X 2005 Langmuir 212552
[4] Sanjini N S and Velmathi S 2015 J. Porous Mater. 22 1549[5] Yu J, Zhang L, Cheng B and Su Y 2007 J. Phys. Chem. C 111
10582[6] Sasidharan M and Bhaumik A 2011 J.Mol.Catal. A:Chem.346
87[7] Fuentes S, Zarate R A, Chavez E, Muñoz P, Díaz-Droguett D
and Leyton P 2010 J. Mater. Sci. 45 1448[8] Yu H, Ouyang Sh, Yan Sh, Li Zh, Yu T and Zou Zh 2011
J. Mater. Chem. 21 11347[9] Canu G and Buscaglia V 2017 CrystEngComm 19 3867
[10] Milea C A, Bogatu C and Duta A 2011 Bull. Transylv. Univ.Bras. ov. Ser. I Eng. Sci. 4 59
[11] Sing K S W, Everett D H, Haul R A W, Moxcou L, PierottiR A, Rouquerol J et al 1985 Pure Appl. Chem. 157 603
[12] Huo Q, Margolese D I and Stucky G D 1996 Chem. Mater. 81147
[13] Kruk M, Jaroniec M and Sayari A 1997 Langmuir 13 6267[14] Lowell S and Shields J E 1991 in Powder surface area and
porosity B Scarlett (ed) (Great Britain: Chapman & Hall) p 72[15] Gregg S J and Sing K S W 1982 Adsorption, surface area and
porosity (London: Academic Press) chap 4, p 195[16] Michal K and Mietek J 2001 Chem. Mater. 13 3169[17] Barret E P, Joyner L G and Halenda P P 1951 J. Am. Chem.
Soc. 73 373[18] Horvát G and Kawazoe K 1983 J. Chem. Eng. Jpn. 16 470[19] Dong R-L, Na Ch, Zhang H-P, Chen Z-D and Jin Ch-Ch 2016
Mater. Design 89 830[20] Duran A, Serna C, Fornes V and Fernández Navarro J M 1986
J. Non-Cryst. Solids 82 69[21] Nakamoto K (ed) 1997 in Infrared and Raman spectra of
inorganic and coordination compounds, Part A: theory andapplications in inorganic chemistry (New York: John Wiley &Sons Inc) p 356
[22] Sun J, Xu K, Shi Ch, Ma J, Li W and Shen X 2017 Constr.Build. Mater. 156 114
[23] Pathé M, Palipou J, Corriu R, Leclercq D and Vioux A 1989J. Non-Cryst. Solids 113 21
[24] Méndez-Vivar J, Mendoza-Serna R and Valdez-Castro L 2001J. Non-Cryst. Solids 288 200
[25] Congshen Z, Lisong H, Fuxi G and Zhonghong J 1984 J. Non-Cryst. Solids 63 105
[26] Méndez-Vivar J, Bosch P, Lara V H and Mendoza-Serna R2002 J. Porous Mater. 9 231
Bull. Mater. Sci. (2020) 43:67 Page 7 of 7 67
[27] Pouchert C J (ed) 1981 The Aldrich library of infrared spectra(Milwaukee, WI) p 246
[28] Jung H Y, Gupta R K, Oh E O, Kim Y H and Whang C M 2005J. Non-Cryst. Solids 351 372
[29] Almeida R M, Guitton T A and Pantano G C 1990 J. Non-Cryst.Solids 121 193
[30] Whang Ch M, Yeo Ch S and Kim Y H 2001Bull. KoreanChem.Soc. 22 1366
[31] Ren J, Li Zh, Liu Sh, Xing Y and Xie K 2008 Catal. Lett. 124185
[32] Safajou H, Khojasteh H, Salavati-Niasari M and Mortazavi-Derazkola S 2017 Colloid Interface Sci. 498 423
[33] Mir N and Salavati-Niasari M 2013 Electrochim. Acta 102274
[34] Mortazavi-Derazkola S, Zinatloo-Ajabshir S and Salavati-Niasari M 2017 Adv. Powder Technol. 28 747