Mindanao Journal of Science and Technology Vol.12 (2014) 68-85 Preparation, Characterization and NH 3 -sensing Test of HCl-doped Polyaniline Thin Films Marissa G. Cordova 1* , Reynaldo M. Vequizo 2 , Romeo M. Del Rosario 1 , Majvell Kay G. Odarve 2 , Bianca Rae B. Sambo 2 , Filchito Renee G. Bagsican 2 and Girlie D. Leopoldo 1 1 College of Arts and Sciences Mindanao University of Science and Technology Cagayan de Oro City, 9000 Philippines *[email protected]2 College of Science and Mathematics Mindanao State University-Iligan Institute of Technology Iligan City, 9200 Philippines Date received: June 06, 2013 Revision accepted: May 26, 2014 Abstract This study is aimed to monitor the effects of varying the polymerization time of aniline on the morphology, electrical conductance, oxidation states, optical properties, and ammonia gas sensitivity of hydrochloric acid (HCl)-doped polyaniline (PAni) as the synthesized thin film. In this work, chemical oxidative polymerization of aniline was carried out using the rapid mixed method with ammonium peroxydisulfate, (NH 4 ) 2 S 2 O 8 as the oxidant and 0.4 M HCl as dopant. Temperature changes were also monitored from the start of the chemical reaction to describe the different phases of the chemical oxidative polymerization of aniline. The PAni thin films were deposited by taking the substrates from the reaction mixture after 2 minutes and 8 minutes polymerization time. FTIR spectroscopy, UV-vis spectroscopy and scanning electron microscopy (SEM) were used to conduct spectroscopic and morphological characterizations of the produced PAni, respectively. The two-probe method was used for electrical characterization of the samples. The FTIR spectrum of the 2-min deposited film with oxidation state of 43% revealed a band at 1309 cm -1 assigned to π-electron delocalization indicating that doping started at the onset of polymerization of aniline. With the 8-min deposited film, the C-N +. stretching vibration in the polaron structure confirmed the formation of emeraldine-salt oxidation state of PAni . Along with this, energy band gap values of about 3.65 and 3.72 eV were obtained from UV-vis analyses. The degree of oxidation, conductance and ammonia sensing responses of the two film samples increased with polymerization time. The degree of doping, however, has no significant relationship with increasing time of polymerization. SEM micrographs of the samples showed porous nanostructures with interconnected networks of globular formations. The film produced within 8-min polymerization period has better sensitivity than the one produced within 2 minutes. Keywords: polyaniline, rapid mixed polymerization, FTIR, UV-vis
Transcript
Mindanao Journal of Science and Technology Vol.12 (2014) 68-85
Preparation, Characterization and NH3-sensing Test of HCl-doped Polyaniline Thin Films
Marissa G. Cordova1*, Reynaldo M. Vequizo2, Romeo M. Del Rosario1, Majvell Kay G. Odarve2, Bianca Rae B. Sambo2,
Filchito Renee G. Bagsican2 and Girlie D. Leopoldo1
1College of Arts and Sciences Mindanao University of Science and Technology
Mindanao State University-Iligan Institute of Technology Iligan City, 9200 Philippines
Date received: June 06, 2013 Revision accepted: May 26, 2014 Abstract
This study is aimed to monitor the effects of varying the polymerization time of aniline on the morphology, electrical conductance, oxidation states, optical properties, and ammonia gas sensitivity of hydrochloric acid (HCl)-doped polyaniline (PAni) as the synthesized thin film. In this work, chemical oxidative polymerization of aniline was carried out using the rapid mixed method with ammonium peroxydisulfate, (NH4)2S2O8 as the oxidant and 0.4 M HCl as dopant. Temperature changes were also monitored from the start of the chemical reaction to describe the different phases of the chemical oxidative polymerization of aniline. The PAni thin films were deposited by taking the substrates from the reaction mixture after 2 minutes and 8 minutes polymerization time. FTIR spectroscopy, UV-vis spectroscopy and scanning electron microscopy (SEM) were used to conduct spectroscopic and morphological characterizations of the produced PAni, respectively. The two-probe method was used for electrical characterization of the samples. The FTIR spectrum of the 2-min deposited film with oxidation state of 43% revealed a band at 1309 cm-1 assigned to π-electron delocalization indicating that doping started at the onset of polymerization of aniline. With the 8-min deposited film, the C-N+. stretching vibration in the polaron structure confirmed the formation of emeraldine-salt oxidation state of PAni . Along with this, energy band gap values of about 3.65 and 3.72 eV were obtained from UV-vis analyses. The degree of oxidation, conductance and ammonia sensing responses of the two film samples increased with polymerization time. The degree of doping, however, has no significant relationship with increasing time of polymerization. SEM micrographs of the samples showed porous nanostructures with interconnected networks of globular formations. The film produced within 8-min polymerization period has better sensitivity than the one produced within 2 minutes. Keywords: polyaniline, rapid mixed polymerization, FTIR, UV-vis
M. G. Cordova et al / Mindanao Journal of Science and Technology Vol. 12 (2014) 68-85
69
1. Introduction Polyaniline (PAni) has been proven to be a more conducting material compared with other polymers (Timmer et al., 2005), making it of considerable interest in many theoretical and experimental studies involving chemical sensor materials in the family of conducting polymers. Its easy synthesis, which comes to completion within ten minutes (Stejskal and Sapurina, 2005) makes it a good choice for fabricating light-emitting diodes, electrode material, electromagnetic shield, and as a sensitive layer of chemical vapor sensors (Li et al., 2009). Among the family of conjugated polymers, PAni is one of the most useful since it is air-and moisture-stable in both its conducting form and insulating form (Virji et al., 2008). Thus, PAni film as a chemical vapor sensor has high environmental stability, stable electrical conduction and room temperature operation compared to metal oxide based gas sensors (Bavane et al., 2010). In some studies involving the detection of aromatic organic compounds, however, humidity overrides the signal from a target analyte, resulting in an increase in resistance that may be due to polar water vapor causing a swell in the polymer networks. The hopping distance for the charge carriers may increase causing a decrease in conductivity and sensitivity. This phenomenon may be eliminated by flowing dry air into the test chamber before introducing the analyte (Li et al., 2009). It was considered that PAni gas sensors with excellent properties may be formed before the polymerization process terminates, a possibility which has not been attempted so far. In a study conducted by Stejskal et al., (2008), polymerization of aniline was monitored and some samples were isolated after 4 min of reaction time but the product was not tested for NH3 sensing. The focus was on the mechanism of oxidation, depending on the initial and the final acidity of the reaction mixture. In this present work the samples were isolated after 2 minutes and 8 minutes of the reaction time and the focus was on monitoring the effects of varying the polymerization time of PAni thin films on its morphologies, electrical conductance, oxidation states, optical properties, and ammonia sensing characteristics. Thus, this study attempts to develop protonated emeraldine salt form of PAni that can be used to detect basic vapors, such as ammonia or organic amines. These gases can deprotonate the polymer and decrease its conductivity. Redox active chemicals such as Cl2, F2, Br2, I2, N2H4, NOx, and SOx can also be used as analyte since they can change the inherent oxidation state of PAni, which can also result in large changes in conductivity (Li et
M.G. Cordova et al / Mindanao Journal of Science and Technology Vol. 12 (2014) 68-85
70
al., 2008). The Polyaniline gas sensor can be used in environmental gas analysis, air quality control in the passenger compartment of automobiles, alarm systems in chemical industries and fertilizer factories where almost pure ammonia is used, and possibly in ammonia breath analyzers for the diagnosis of certain diseases.
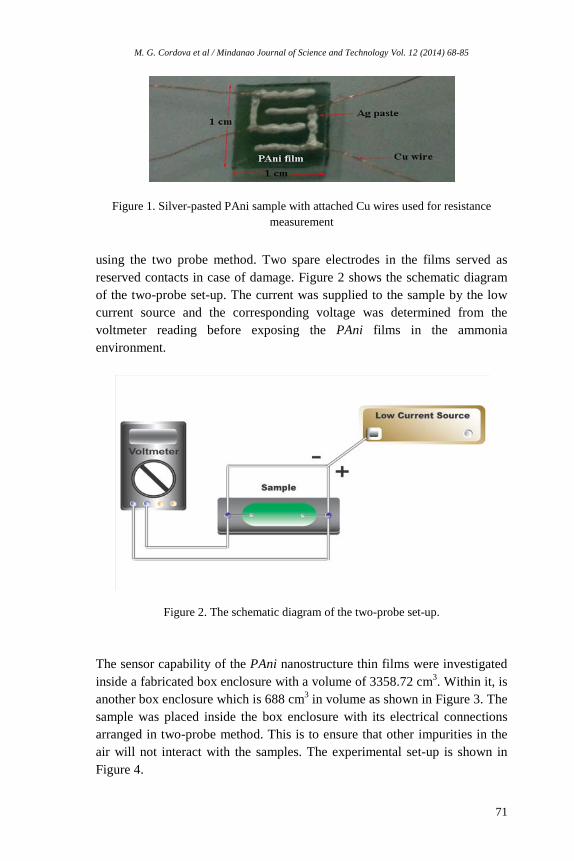
2. Methodology 2.1 Sample Preparation Polyaniline films were synthesized at room temperature by rapid mixed method using chemical oxidative polymerization of aniline. Ammonium peroxydisulfate, (NH4)2S2O8 / (APS) was used as the oxidizing agent and hydrochloric acid (HCl) as dopant. Hydrochloric acid has been used more frequently as dopant in producing protonated PAni film because unlike many other strong acids it is volatile, thereby preventing the presence of excess dopants in the PAni structure (Detsri and Dubas, 2009). This leads to the production of PAni conducting polymer (Stejskal, Sapurina, and Trchova, 2010) which can be used as an efficient NH3 gas sensor. The prepared APS solution was quickly poured into the aniline solution to ensure sufficient mixing before the polymerization begins. The first glass slide (borosilicate glass) was taken from the reaction mixture after 2 minutes of the reaction period and the second sample was taken after 8 minutes of the polymerization process. This polymerization time interval corresponds to the deposition time of PAni onto the glass substrates. After taking out each synthesized PAni film from the mixture, it was immediately washed with 0.2 M HCl and then similarly with ethanol. The PAni films were then dried out for characterization. 2.2 Thin Film Characterization 2.2.1 Conductance/Resistance and Ammonia Sensitivity Measurements of Samples The ammonia gas sensor was fabricated (Figure 1) by applying a mesh of silver (Ag) paste on the film’s conductive part. Copper electrodes were attached to the Ag paste to establish contacts for resistance measurement
M. G. Cordova et al / Mindanao Journal of Science and Technology Vol. 12 (2014) 68-85
71
Figure 1. Silver-pasted PAni sample with attached Cu wires used for resistance measurement
using the two probe method. Two spare electrodes in the films served as reserved contacts in case of damage. Figure 2 shows the schematic diagram of the two-probe set-up. The current was supplied to the sample by the low current source and the corresponding voltage was determined from the voltmeter reading before exposing the PAni films in the ammonia environment.
Figure 2. The schematic diagram of the two-probe set-up. The sensor capability of the PAni nanostructure thin films were investigated inside a fabricated box enclosure with a volume of 3358.72 cm3. Within it, is another box enclosure which is 688 cm3 in volume as shown in Figure 3. The sample was placed inside the box enclosure with its electrical connections arranged in two-probe method. This is to ensure that other impurities in the air will not interact with the samples. The experimental set-up is shown in Figure 4.
M.G. Cordova et al / Mindanao Journal of Science and Technology Vol. 12 (2014) 68-85
72
Figure 3. The box enclosure used during NH3 sensing experiment
Figure 4. The set-up of the resistance measurement and NH3 sensing experiment
M. G. Cordova et al / Mindanao Journal of Science and Technology Vol. 12 (2014) 68-85
73
2.3 Gas Sensor Characterization Ammonia which is a gas at room temperature is a soluble gas and remains in the solution because of its ability to form hydrogen bonds with water. When ammonia is in water in the form of ammonium hydroxide it undergoes some equilibria. When the bottle containing ammonium hydroxide (NH4OH) is opened, the NH4OH dissociates to give both ammonia gas and water vapor (Saroch et al., 2008). To facilitate the flow of NH3 gas into the test chamber, the exhaust fan was turned on to introduce 3,505 ppm of NH3 from 1 M NH4OH solution. Two cycles of NH3 exposure were made for each film, which incurred 30 minutes. To do one cycle of exposure, the operating current which was determined from the I-V curve of each film before NH3 exposure, was supplied to the sample while the voltage reading was recorded every 5 seconds for the first five minutes. The exhaust fan was then turned on to introduce NH3 gas to the sample. The length of exposure to NH3 was 5 minutes with the voltage reading recorded every 5 seconds. The NH3 supply was then cutoff with the corresponding voltage recorded again for five minutes every 5 seconds. The sample responses or sensitivities with and without the presence of NH3 were then calculated using the equation:
% (1)
where the ratio of the sum of Re and Rne with Rne corresponds to the sensitivity of the sample. Rne is the resistance of the sample before it was exposed to the analyte and this corresponds to the operating current of the sample. On the other hand, Re is the resistance of the sample after it was exposed to the analyte applied to the operating current. In using this equation, sensitivity can reach a value higher than 100% since the fraction of the change in the resistance reading was compared to the resistance of the sample before it was exposed to the analyte (Odarve and Vequizo, 2011). 3. Results and Discussion 3.1 Scanning Electron Microscopy (SEM) Micrographs of Polyaniline Nanostructures The data obtained from SEM was used to determine the morphology of the films produced in the experiment. The samples were characterized using JEOL JSM-6510LA analytical scanning electron microscope at 15000x
M.G. Cordova et al / Mindanao Journal of Science and Technology Vol. 12 (2014) 68-85
74
magnification. The SEM images of the PAni thin films deposited onto the glass substrates are shown in Figure 5 (a) and (b). The nanostructures of hundreds of nanometer in length formed porous interconnected networks of globular formations. The advantage of such porous nanostructure, which is also observed with PAni nanofibers is the easy diffusion of NH3 gas analyte molecules into and out of the film structure, leading to a fast response and high sensitivity.
(a) (b)
Figure 5. The SEM micrographs (15,000x) of PAni deposited onto a glass substrate at
(a) 2-minute and (b) 8-minute polymerization periods 3.2 Current-Voltage (I-V) Measurements In Figure 6 (a), the current-voltage (I-V) measurement of the films showed a linear behavior as an indication of the metallic nature of the PAni as well as an ohmic contact established between PAni and the silver electrode. This, together with the green color of the films, revealed the emeraldine salt oxidation state of the synthesized PAni. It was observed that the resistance of the films increased after exposure to NH3 environment. This indicates that the initial resistance of the PAni films was a sensitive parameter in the presence of NH3 gas. This increase in resistance after the first and second NH3 gas exposure is shown in Figure 6 (b) and (c) that can be attributed to some structural changes in the polymer and also possibly to the NH4Cl formation that did not dissociate completely to protons and NH3 molecules. This further means that the initial resistance of the films was not totally recovered after every exposure to the analyte. In this figure, RBE stands for
M. G. Cordova et al / Mindanao Journal of Science and Technology Vol. 12 (2014) 68-85
75
(a)
(b)
(c)
Figure 6. The I-V curve of PAni films on glass substrates at (a) 2-min and 8-min before NH3 exposure, (b) 2-min and (c) 8-min with lines, black: before exposure
to NH3, red: after first exposure to NH3, green: after second exposure to NH3, and blue: after one week of exposure to NH3 .
M.G. Cordova et al / Mindanao Journal of Science and Technology Vol. 12 (2014) 68-85
76
resistance before exposure, RAE1 and RAE2 as resistances after the first and second exposure to NH3. One week after the films were exposed to NH3 gas and after mild heat treatment at 45oC for 5 minutes, the resistance of each sample was determined again through the two-probe method right after cooling. RA1week represents the resistance after one week time and it was observed to decrease. Thus, it can be inferred that mild heat treatment of the samples was favorable to the crystallization of the doped PAni. This can be attributed to the increase in re-protonation, enhanced cross-linking reactions and possible structural rearrangements resulting in a regular and ordered structure. 3.3 Attenuated Total Reflectance-Fourier Transform Infrared Spectroscopy (ATR-FTIR) Results ATR-FTIR spectroscopy in the scanning range of 650-4000 cm-1 was used to determine the oxidation states and vibrational modes of the PAni films. The spectra of the samples were obtained using the Perkin Elmer Spectrum 100 FT-IR Spectrometer using the ATR technique. The evolution of Fourier Transform Infrared (FTIR) Spectra of the samples that are shown in Figure7 further confirmed the oxidation states of the PAni thin films. The spectra of the films in this experiment exhibited two main bands, with maxima situated at peaks 1577 cm-1 and 1575 cm-1 (quinoid) and 1494 cm-1 and 1491 cm-1
(benzenoid) for the two-minute and 8-minute deposited films, respectively (Tai et al., 2010). The integrated intensity of peaks Figure (a) and Figure (b) was used to determine the oxidation state of PAni films using Equation 2, x 100% (2)
through the QtiPlot software version 9.7.10. In this equation, Aquinoid and Abenzenoid are the respective integrated intensity of the quinoid (peak a) and benzenoid (peak b) rings (Odarve et al., 2011). The calculated oxidation states 43% and 57% for 2 min and 8 min polymerization times, respectively, indicate the nearly equal occurrence of quinoid and benzenoid rings of the emeraldine form of PAni. In Figure 7 (c), the spectrum of the 2-minute deposited film, revealed a band at 1309 cm-1 assigned to π-electron delocalization induced in the polymer by protonation (Li, et al., 2008) indicating that protonation started at the onset of polymerization of aniline and that PAni film was already formed even at this early stage. At 8 minutes,
M. G. Cordova et al / Mindanao Journal of Science and Technology Vol. 12 (2014) 68-85
77
Figure 7. For 2 min at a) 1577 cm-1, b) 1494 cm-1 and for both 2 and 8-min at c) 1309
cm-1; for 8 min at a) 1575 cm-1, b) 1491 cm-1, d) 1256 cm-1, e) 1236 cm-1, f) 1145 cm-1, g) 1101 cm-1 and h) 1053 cm-1
a number of new peaks were observed. In Figure 7 (d) and Figure (e), the band characteristic of the conducting protonated form interpreted as a C-N+. stretching vibration in the polaron structure was located at 1256 cm-1 and 1236 cm-1. The prominent 1145 cm-1 in Figure 7(f) band which is assigned to the vibration mode of the –NH.+ = structure was formed during protonation of the imine group. In addition, peaks at 1101 cm-1 and 1053 cm-
1 in Figure 7 (g) and (h) indicate that the oxidant was depleted and the pernigraniline was reduced at a faster rate by the residual aniline to the emeraldine form. 3.4 Energy Band Gap Results The UV- Vis spectra were obtained using the Perkin Elmer Lambda 35 UV/Vis Spectrometer. The obtained transmittance spectra from UV-Vis were used to derive the absorption coefficient and the corresponding band gap of the sample produced. The energy band gap of the PAni films was determined using absorption spectra with the help of Tauc relation. Using this relation, the square of (αhv) versus the photon energy (hv) was plotted to obtain a straight line (Figure 8). The straight line was then extrapolated to (αhv)2 = 0 which gives the value of the band gap (Patidar et al., 2008). The energy band gap of the samples is about 3.65 eV and 3.72 eV belonging to
M.G. Cordova et al / Mindanao Journal of Science and Technology Vol. 12 (2014) 68-85
78
(a) (b)
Figure 8. Energy band gap values for a) 2-min and b) 8 min deposited PAni
films. the semiconductor regime, for the 2-min and 8-min polymerization time, respectively. 3.5 Electronic Levels The absorbance spectra of samples showed absorption peaks at Figure 9 (a) 296 nm assigned to the benzenoid structure, 362 nm (Figure 9 (b)) indicating principal absorption of the π - π*orbital transitions of the emeraldine form of PAni (Zujovic et al, 2009). Also, the sharp trough at 477 nm (Figure 9 (c)) can be assigned to the localized polaron which are characteristics of the protonated PAni, together with extended tail nearly 758 nm (Figure 9 (d)) representing the conducting emeraldine salt form of the sample (Bavane, et al., 2010).
Figure 9. The absorbance spectra of PAni films with peaks at (a) 296 nm, (b) 362 nm, (c) 477, (d) 758 nm
M. G. Cordova et al / Mindanao Journal of Science and Technology Vol. 12 (2014) 68-85
79
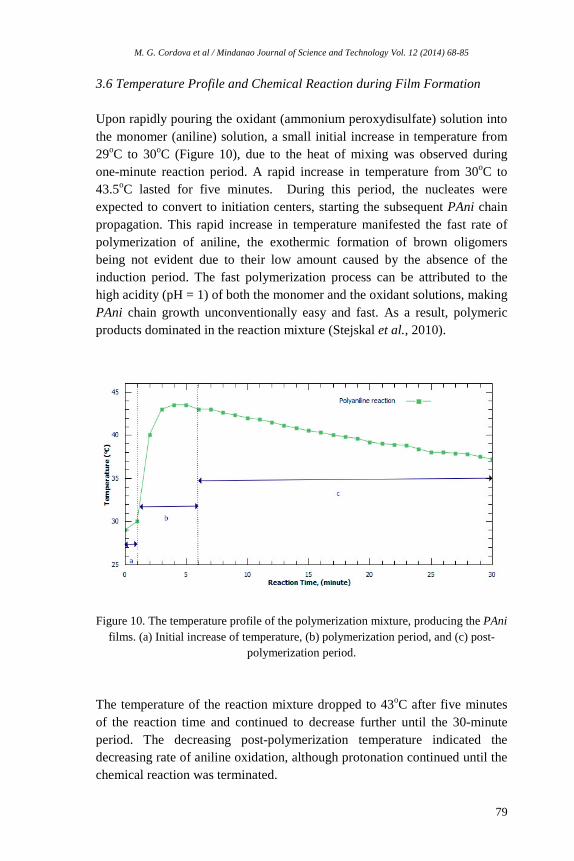
3.6 Temperature Profile and Chemical Reaction during Film Formation Upon rapidly pouring the oxidant (ammonium peroxydisulfate) solution into the monomer (aniline) solution, a small initial increase in temperature from 29oC to 30oC (Figure 10), due to the heat of mixing was observed during one-minute reaction period. A rapid increase in temperature from 30oC to 43.5oC lasted for five minutes. During this period, the nucleates were expected to convert to initiation centers, starting the subsequent PAni chain propagation. This rapid increase in temperature manifested the fast rate of polymerization of aniline, the exothermic formation of brown oligomers being not evident due to their low amount caused by the absence of the induction period. The fast polymerization process can be attributed to the high acidity (pH = 1) of both the monomer and the oxidant solutions, making PAni chain growth unconventionally easy and fast. As a result, polymeric products dominated in the reaction mixture (Stejskal et al., 2010).
Figure 10. The temperature profile of the polymerization mixture, producing the PAni films. (a) Initial increase of temperature, (b) polymerization period, and (c) post-
polymerization period. The temperature of the reaction mixture dropped to 43oC after five minutes of the reaction time and continued to decrease further until the 30-minute period. The decreasing post-polymerization temperature indicated the decreasing rate of aniline oxidation, although protonation continued until the chemical reaction was terminated.
M.G. Cordova et al / Mindanao Journal of Science and Technology Vol. 12 (2014) 68-85
80
3.7 Degree of doping [(Cl/N) ratio] and Degree of oxidation of the Films Produced The degree of doping in the films is associated with the ratio of the Cl atoms with the N atoms in the films. The elemental composition of the films shown in Table 1 was determined using Energy Dispersive X-ray spectroscopy (EDX). The largest percentage of carbon (C) atoms are indicative of the benzene and quinone ring that formed the polymer chain. The existence of the imine and amine nitrogen groups also constituting the polymer chain was detected by the presence of the nitrogen (N) atoms. The trace amounts of chlorine (Cl) atoms can be attributed to the dopants inserted in the polymer backbone. Also, the presence of silicon (Si) and oxygen (O) in the film samples can be attributed to the glass substrates used which are made of silica. On the other hand, from Table 2, it can be observed that the oxidation state increased with polymerization time, but polymerization time is not relative to the degree of doping [ ratio]. This means that increasing the
polymerization time does not relatively increase the ratio of the Cl- in the films. On the other hand, the increase in polymerization time corresponds to conductance and sensitivity of the films, with the 8-minute deposited PAni gaining a higher conductance and thus a relatively higher sensing response towards NH3 gas.
Table 1. Elemental composition of PAni samples obtained from Energy Dispersive X-ray Spectroscopy (EDX)
Atom % of Elements
C N O S Cl Si 2 22.67±0.26 3.94±0.51 39.12±0.22 0.22±0.12 0.54±0.13 22.74±0.10
8 22.87±0.21 3.37±0.41 39.96±0.18 0.21±0.09 0.36±0.11 22.32±0.08 Table 2. The relationship of the increasing polymerization time of PAni to the degree
of oxidation, ratio, conductance and its respective NH3 sensitivity values.
Polymerization time (min), degree of
oxidation ratio Conductance
(S)
Sensitivity (%) (2 cycles)
(1st) (2nd) 2, 43% 0.137 2.67 x 10⁻⁶ 109 109 8, 57% 0.107 6.53 x 10⁻⁵ 896 893
M. G. Cordova et al / Mindanao Journal of Science and Technology Vol. 12 (2014) 68-85
81
3.8 Gas Sensor Sensitivity The response time and the recovery time are defined as the time required for PAni film resistance to reach 90% of its saturation value from the starting value on gas exposure, and upon removal of the gas, respectively (Deshpande et al., 2009). In the case of this experiment, the PAni films had relatively faster response times ~ 5s, but the recovery times were relatively larger, around 300 s. Figure 11 shows the responding behaviors of the PAni sensors toward NH3 gas.
(a)
(b)
Figure 11. The response plot (in six regions) of the (a) 2-min and (b) 8-min deposited PAni films upon exposure to NH3 gas from the 1 M NH4OH (~3,505 ppm of NH3), first cycle (a) 5-minute before exposure, (b) 5-minute exposure, (c) 5 minutes after exposure and second cycle (d) 5-minute before exposure, (e) 5-minute exposure,
(f) 5 minutes after exposure.
M.G. Cordova et al / Mindanao Journal of Science and Technology Vol. 12 (2014) 68-85
82
From the dynamic ammonia response curves in Figure 11 (a) and (b), it can be inferred that the two PAni samples exhibited reproducible responses with high baseline stability to NH3 gas indicated by the increase in their resistances upon exposure. This occurred because when the conductive emeraldine salt was exposed to NH3 gas, the dopant was partially dedoped. In Figure 11 (a), the PAni film obtained during the 2-min polymerization time reached a 109% response for the first and second cycles. In Figure 11 (b), a dramatic increase in sensing response was achieved by the 8-minute obtained a sample that reached to 896% and 893% for the first and second cycles, respectively This high increase in the PAni film’s sensing response is attributed to the greater surface area of the porous nanostructures evident in the SEM micrograph, high conductance value and nearly 50% degree of oxidation. Specifically, high surface area brings about faster diffusion of NH3 molecules into and out of the PAni structure, upon introducing and cutting-off NH3 supply respectively. In addition to the enhanced porosity of the 8-minute deposited sample, results from FTIR analyses showed that protonation was completed in the film produced during this time. This is evidenced by the vibration mode of –NH. += structure present in the spectrum. The re-occurrence of 1309 cm-1 band indicates that protonation was completed. This means that just enough Cl- ions as dopants were inserted into the polymer resulting to the easy abstraction of the Cl- ions during deprotonation or exposure to NH3 gas. Thus, the PAni film became very reactive with NH3 gas molecules which resulted in a relatively higher sensitivity.
4. Conclusions and Recommendations PAni thin films of emeraldine-salt forms were fabricated before the 10-minute optimum polymerization period. As the polymerization period of aniline increases from 2 - 8 minutes, enhancement in optical, morphological, and electrical properties is supported by the results of FTIR and UV-Vis spectra. Meanwhile, SEM of the PAni thin films clearly shows network morphology with porous nanostructure, and electrical analysis reveals increasing conductance as polymerization time increases. On the other hand, the NH3 gas sensitivity measurement shows that PAni film sensors have faster response, good sensitivity, and good reproducibility. The result of thermal treatment showed that the loss in conductance after NH3 gas exposure is mostly reversible although this needs more explanation. Thus, the PAni nanostructured thin film sensors produced before 10 minutes of
M. G. Cordova et al / Mindanao Journal of Science and Technology Vol. 12 (2014) 68-85
83
polymerization time are potential candidates for use in NH3 gas detection, with potential for industrial, environmental, and medical diagnostic applications. In line with these findings, the following further studies are recommended:
• Although the PAni samples achieved very good sensitivities toward NH3 gas, these were not able to fully recover their original forms. It is therefore recommended to explore more processes to achieve this goal.
• To carry out the oxidative polymerization process of aniline using a
stoichiometric oxidant to monomer ratio that is lower and higher than 1.25 could also be explored to verify the possibility of producing PAni nanofiber structures which are considered to possess superior characteristics for chemical vapor sensing application.
• Since the resistance of the two samples decreased after mild heat
treatment, it is best to test again the sensing responses of the films after one week time to verify enhancement in its properties. This promises an easy way to perfectly recover or even improve the films’ NH3 sensing characteristics.
• For greater accuracy in data recording, the use of a computer that is
interfaced with the sensing test is recommended if measurements are to be made in the order of seconds.
6. Acknowledgement The authors would like to thank the Institutional Development Program of PCASTRD-DOST and the Commission on Higher Education-Center for Excellence Grant for generously supplying the equipment used in this study. 7. References Bavane, R., Shirsat, M., and Mahajan, A. (2010). Ammonia Gas Sensing Characterisitics of chemically Synthesized Polyaniline Matrix. Sensory &
M.G. Cordova et al / Mindanao Journal of Science and Technology Vol. 12 (2014) 68-85
84
Transducers Journal 113 (2), 63-70. Retrieved June 10, 2011 from http://www.sensorsportal.com Deshpande, N.G., Gudage, Y.G., Sharma, R., Vyas, J.C., Kim, J.B., and Lee, Y.P. (2009). Studies on tin oxide-intercalated polyaniline nanocomposite for ammonia gas sensing applications. Sensors and Actuators B: Chemical.138, 76-84. Retrieved from www.elsevier.Com/locate/snb Detsri, E. and Dubas, S.T., (2009). Interfacial Polymerization of Water-Soluble Polyaniline and Its Assembly Using Layer-By-Layer Technique. Journal of Metals, Materials and Minerals.19(1), 39-44.Retrieved March 3, 2011, from http://www. material.chula.ac.th/Journal/v19-1/39-44%20Detsiri,%20E.pdf Li, W., Duc Hoa, N., Cho, Y., Kim, D., Soo and Kim, J. (2009). Nanofibers of conducting polyaniline for aromatic organic compound sensor. Sensors and Actuators B: Chemical.143, 132-138. Retrieved from www.elsevier.com/locate/snb Li, D., Huang, J. and Kaner, R. (2008). Polyaniline Nanofibers: A unique Polymer Nanostructure for Versatile Applications. Accounts of Chemical Research, 42(1), 135-145.Retrieved from www.elsevier.com/locate/snb Odarve, M.K. and Vequizo, R. (2011). Synthesis and Characteristics of Nanostructured Polyaniline/Silica on Glass and Stainless Steel Mesh Substrates for Ammonia Sensing Application. Unpublished masters thesis, Mindanao State University, Iligan Institute of Technology, Iligan City. Patidar, D., Rathore, K.S., Saxena, N.S., Sharma, K. and Sharma, T.P. (2008). Energy Band Gap and Conductivity Measurement of CdSe Thin Films.Chalcogenide Letters, 5(2), 21-25 Saroch, M., Srivastava, S., Fink, D. and Chandra, A. (2008). Room Temperature Ammonia Gas Sensing Using Mixed Conductor based TEMPOS Structures. Sensors (Basel). 8(10), 6355-6370. Stejskal, J. and Sapurina, I. (2005). Polyaniline: Thin Films and Colloidal Dispesions. Pure Appl. Chem. 77(5), 815-826. Stejskal, J., Sapurina, I. and Trchova, M., (2010). Polyaniline nanostructures and the role of aniline oligomers in their formation. Progress in Polymer Science. 35, 1420-1481. Stejskal J., Sapurina, I., Trchova’, M. and Konyunshenko, E., (2008). Oxidation of aniline Polyaniline Granules, Nanotubes, and Oligoaniline Microspheres. Macromolecules. 41, 3530-3536.
M. G. Cordova et al / Mindanao Journal of Science and Technology Vol. 12 (2014) 68-85
85
Tai, H., Jiang, Y., Xie, G. and Yu, J. (2010). Preparation, Characterization and Comparative NH3 –sensing Characteristic Studies of PANI/inorganic Oxides Nanocomposite Thin Films. J. Mater. Sci., 26(7), 605-613. Retrieved from www.sciencedirect.com Timmer, B., Olthuis, W. and Van den Berg, A. (2005). Ammonia sensors and their applications– a review. Sensors and Actuators B. 107, 666-677. Retrieved February 1, 2011 from http://www.bios.el.utwente.nl Virji, S., Weiller, B., Huang, J., Blair, R., Shepherd, H., Faltens, T., Hausmann, P., Kaner, R. and Tolbert, S. (2008). Construction of a Polyaniline Nanofiber Gas Sensor. Journal of Chemical Education. 85(8), 1102-1104. Retrieved January 26, 2011, from www.JCE.DiV CHED.org Zujovic, Z., Laslau, C., Bowmaker, G., Kilmartin, P., Webber, A., Brown, S., and Sejdic, J. (2009). Role of Aniline Oligomeric Nanosheets in the Formation of Polyaniline Nanotubes. Macromolecules. 43, 662-670.