36


Preparation of Filters for HIPS Analysis UCD TI #276A, Version 5.4
June 15, 2021 Page 2 of 14
DOCUMENT HISTORY
Date Modified
Initials Section/s Modified
Brief Description of Modifications
05/20/21 SRS All Previous anthologized version separated into individual TIs.

Preparation of Filters for HIPS Analysis UCD TI #276A, Version 5.4
June 15, 2021 Page 3 of 14
TABLE OF CONTENTS
1. Purpose and Applicability ....................................................................................................... 4
2. Summary of the Method ......................................................................................................... 4 3. Definitions............................................................................................................................... 4
4. Cautions .................................................................................................................................. 4
5. Equipment and Supplies ......................................................................................................... 4
6. Procedural Steps...................................................................................................................... 5 6.1 Generating Filter Slide Labels.......................................................................................... 5
6.2 Printing Tray Stickers....................................................................................................... 6
6.3 Labeling IMPROVE Slides and Slide Trays .................................................................... 7
6.4 Performing Tray Checks .................................................................................................. 9 6.5 Transferring Samples to Slides ...................................................................................... 10
6.6 Generating Slides Trays ................................................................................................. 11
6.7 Additional Information for Transferring IMPROVE Samples ...................................... 14
7. References ............................................................................................................................. 14
LIST OF FIGURES
Figure 1. Slide Tray Label. ............................................................................................................. 7 Figure 2. Example of labeled and unlabeled slide. ......................................................................... 8 Figure 3. Left is for a 1A Petri label, right is for a 5A Petri label. ................................................. 9 Figure 4. Left is for a 1A slide label, right is for a 5A slide label. ................................................. 9 Figure 5. Left is for a 1A normal (NM) filter, right is for a 1A field blank (FB) label. ................. 9 Figure 6. Build a Tray IMPROVE. ............................................................................................... 12

Preparation of Filters for HIPS Analysis UCD TI #276A, Version 5.4
June 15, 2021 Page 4 of 14
1. PURPOSE AND APPLICABILITY
This technical instruction (TI) describes the procedure used for preparing filters for HIPS analysis. All routine, valid IMPROVE 1A module filters are prepared for HIPS analysis using the described method.
2. SUMMARY OF THE METHOD
All valid, routine IMPROVE 1A module filters are transferred from Petri dishes or similar containers to 2” x 2” slide frames. Slides are stored in slide trays that hold 40 filters. Filters are transferred into slides by sampling month and year.
3. DEFINITIONS
• HIPS: Hybrid Integrating Plate/Sphere • IMPROVE: Interagency Monitoring Program of Visual Environments • TI: Technical Instruction • XRF: X-ray Fluorescence
4. CAUTIONS
Many site codes are similar. Ensure the identifying information on the Petri dish, slide and LabVIEW all match prior to transferring the filter to the slide.
Make sure the filter is placed in the slide so the sampled side of the filter is facing away from the labeled slide piece.
Note any mishaps that occur while transferring the filters (such as dropping a filter) on a status adjustment sheet.
Verify the slide sandwich is secured tightly after the filter is transferred.
5. EQUIPMENT AND SUPPLIES
• Slide trays containing labeled slides organized by month and site • Forceps • Slide block • Slide press • Slide labels • 2x2 Slides

Preparation of Filters for HIPS Analysis UCD TI #276A, Version 5.4
June 15, 2021 Page 5 of 14
6. PROCEDURAL STEPS
Filters ready for HIPS analysis are in labeled Petri trays that have been analyzed via X-ray fluorescence (XRF) located in the XRF lab. Following XRF analysis, Petri trays are relocated to the Optical Analysis lab.
The station for transferring filters from Petri dishes to slide trays is located in the Optical Analysis lab. All pertinent equipment and supplies (pre-labeled slide trays, slide blocks, etc.) for transferring filters from Petri dishes to slides are at the station.
Labels are printed for slides by sampling month and year, and are based on inventory order generated in the Sample Handling Lab. Information is copied from files exported from the IMPROVE web app and pasted into a sticker template.
6.1 Generating Filter Slide Labels
1. From the U:\drive open the LASER labels folder: U:\IMPROVE_Lab\LASER\Labels
2. Open the “Slide Label Template: "U:\IMPROVE_Lab\LASER\Labels\Slide Label Template.xls"
3. From the U:\ drive open the Lab Gravimetric folder, U:\IMPROVE_Lab\Lab_Gravimetric.
4. Click on Applications and Macros folder: U:\IMPROVE_Lab\Lab_Gravimetric\Applications and Macros
5. Click on the XRF folder
6. Click on the folder for the year corresponding to the year needed for printing (example 2020 Closed). The year folder contains “Sets” and a Master list. Open the excel file for the Master list. The Master list contains multiple worksheets and will be filtered by month. Information from each worksheet in the Master list workbook will be sorted and copied.
7. Select the worksheet labeled “A SET 1-10”, highlight row 1 and click on “Sort and Filter” from the ribbon and select “Filter”. Column C is labeled “SAMDAT”, click on the dropdown arrow and deselect all months except the month that will be printed and click “Ok”. For example, if printing June 2020, deselect all months except June 2020.
8. Copy the information from the “Master List” in columns B-I (starting with Row 2), then paste this information into the “Slide Label Template” under the worksheet “Master”.
9. Column I will auto-populate once information is pasted into columns B-I.
10. Repeat steps 7-9 for additional worksheets contained in the “Master List” workbook.
11. Copy the information from column I and paste the information into the “List for Printing” worksheet.

Preparation of Filters for HIPS Analysis UCD TI #276A, Version 5.4
June 15, 2021 Page 6 of 14
12. Field blanks need to be filtered out before printing the labels. Filter column D on the Master worksheet by “FB” for field blank. Copy the field blank information in columns A-I and paste the information into columns A-I of the Field Blank worksheet. Delete the information in these rows from “Master”. Remove the filter from column D.
13. Delete the blanks rows from the Master worksheet, type CTRL + A to select all. With the sheet highlighted click “Find and Select” from the ribbon, click “Go to special”. From the list click on “Blanks” and ok. All blank rows and possibly some blank columns will be highlighted. Right-click and select “delete”, and then shift rows up.
14. From the field blank worksheet highlight the information in columns A-H (do not highlight I), and paste this information at the bottom of the list on the Master worksheet. Column I will auto-populate. If Column I does not have the correct formula, drag the formula down from the rows above it.
15. Starting with row 2 highlight the information in column I, paste this information into the “List for printing” worksheet. Verify the label information is correct on each print worksheet (print 1-18) and then print the individual sheets. Not all sheets will need to be printed for each sampling month.
16. Click “Save As” and save the file in the following format “Slide Label sampling month and year” in the folder for the current year located here, U:\IMPROVE_Lab\LASER\Labels. Example for June 2020, “Slide Label June 2020”
17. Printed slide labels are placed in the Optical Analysis lab for labeling, process is described in section 5.3 “Labeling IMPROVE slides and slide trays.
6.2 Printing Tray Stickers
1. Open the Microsoft Word document “Slide Tray Label Printout” located here, U:\IMPROVE_Lab\LASER\Labels\Slide Tray Labels Printout.,.
2. Update the sampling month to the month needed and print the number of labels needed.
3. Place the labels in the printer and select print, save and close the file.
4. Printed labels are placed in the Optical Analysis lab for labeling slide trays, process is described in Section 7.3 Labeling IMPROVE slides and slide tray.

Preparation of Filters for HIPS Analysis UCD TI #276A, Version 5.4
June 15, 2021 Page 7 of 14
Figure 1. Slide Tray Label.
6.3 Labeling IMPROVE Slides and Slide Trays
Before transferring filters can begin, slides and slide trays need to be labeled. A lab technician will print out labels for the current month being transferred.

Preparation of Filters for HIPS Analysis UCD TI #276A, Version 5.4
June 15, 2021 Page 8 of 14
1. A red sharpie and ruler are used to draw a line down the center of each slide label (the same way it is done for A filters in the sample lab).
2. Fill out the slide tray number beginning with 1 prior to placing labels on the slide trays. Additionally, the last slide tray for the month will contain field blanks, write field blanks on this label. Begin by labeling the front of the empty slide trays with the slide tray stickers. Place the labeled slide trays on the tray rack (located on the IMPROVE HIPS desk). The LabVIEW tray number will be empty, this will be filled in as trays are created in the tray building program.
3. Locate the first tray in the set being transferred and verify the first slide sticker matches the first sample to be transferred for the month. This is to help ensure labels are in the same order as the physical filters. Grab an unlabeled, empty slide from the stack and place the first sticker above the cutout on the slide.
Figure 2. Example of labeled and unlabeled slide.
4. When placing labeled slides into slide trays make sure the numbers 1-40 (printed on the side of the slide tray) are positioned on the right-hand side when the labeled slides are facing toward you. This guarantees the small cutouts on the bottom of the slide tray (on the opposite side on the numbers) will be the side in contact with the instrument when slide trays are loaded for analysis.
5. Once all slides within a set have been labeled, creating trays and transferring filters can begin.
Note: the following sites have 1A and 5A modules: BYIS1, MEVE1, PMRF1, SAMA1, and YOSE1. These sites will have two sets of filters that are routinely mixed together within a white Petri tray. Petri labels for 1A modules will have a 1A and red line down the center of the label. Petri labels for 5A modules will have a 5A and an orange line down the center of

Preparation of Filters for HIPS Analysis UCD TI #276A, Version 5.4
June 15, 2021 Page 9 of 14
the label, Figure 3. The slide labels will also contain information to differentiate 1A and 5A slides, Figure 4.
Figure 3. Left is for a 1A Petri label, right is for a 5A Petri label.
Figure 4. Left is for a 1A slide label, right is for a 5A slide label.
Slide Labels will also contain either an NM for normal or FB for field blank as seen in Figure 5. Figure 5. Left is for a 1A normal (NM) filter, right is for a 1A field blank (FB) label.
Each IMPROVE sampling month contains approximately 40 field blanks. Petri dishes containing field blanks will have an “FB-A” on the label and are typically hand-written labels. Field blanks are placed in a separate slide tray by sampling month and year. The slide tray for field blanks is the last slide tray for each sampling month.
BYIS is a special site and has a mixture of 37 mm and 25 mm filters. The 37 mm slides are kept in a separate cabinet in the Optical Lab, please ask a lab lead to show you where. Labeled 37 mm slides are placed in a separate slide tray (they will be analyzed separately). Additionally, take care to not label 25 mm slides with stickers that are meant for 37 mm slides (the labels used in HIPS are not removable and difficult to clean off the slides). Ask a lab lead if unsure.
6.4 Performing Tray Checks Filters ready for HIPS analysis will be placed in the HIPS lab following XRF analysis. A tray check will be performed prior to transferring any filters to ensure order integrity. The filter inventory label is removed from the Petri tray and placed on a blank HIPS analysis form and is used to perform a tray check. Blank HIPS analysis forms are located here, U:\IMPROVE_Lab\LASER\Templates\template status adjustment form (Laser).
1. Locate a blank HIPS Analysis form (in a tray on the IMPROVE desk, ask a lab lead if more need to be printed).
2. Locate the Petri tray with the lowest set number and tray number (ex. Set 3 Tray 1 would be transferred before Set 3 Tray 2). Once all of the filters from the lowest set number

Preparation of Filters for HIPS Analysis UCD TI #276A, Version 5.4
June 15, 2021 Page 10 of 14
have been verified then move on to the next set (based on the previous example would be Set 4 Tray 1). If unsure or trays are missing please ask a lab lead.
3. Fill out the date, set number and tray number on the HIPS analysis form.
4. Remove the inventory label from the front/top of the Petri tray and place it in the designated box on the HIPS analysis form.
5. Open the Petri tray and perform a tray check by beginning with the filter in position 1 (the top-left side) verify this sample matches the first sample listed on the inventory label. Continue on until all 50 filters have been verified. If you find any discrepancies in the order, notify a lab lead immediately (DO NOT move the filters into the correct order). If a lab lead is not available please mark the information on the HIPS analysis form and notify a lead as soon as possible. No filters will be transferred from this tray until the order discrepancy has been resolved. In this case you would begin transferring filters from the next tray in the set provided the tray check is good.
6. Once all filters in a Petri tray have been verified, fill out your initials and the date in the designated “Filter Check” box on the HIPS analysis form.
7. Wrap the HIPS analysis form around the Petri tray and place it in the designated area on the desk.
6.5 Transferring Samples to Slides
Prepare the workstation; ensure the correct Slide Trays are on the racks. Note the Petri trays belong to multiple sets, only transfer samples from one set at a time. Petri trays ready for transferring will be in the area labeled “ready for transferring”. A tray check is performed prior to scanning or transferring filters, refer to section 5.4 for performing tray checks. A HIPS analysis form with an inventory label adhered to the form will be wrapped around the Petri tray indicating a tray check has been performed. Additionally, on the HIPS analysis form the box for “Filter Check” will be filled in with a completion date and initials. Filters are scanned into the Build a Tray software prior to transferring into slides, refer to section 5.6 for step-by-step procedure. Transfer samples from the lowest set number, with the lowest tray number. Locate the first Petri dish containing a sample from the Petri tray. Note the sample’s site and sampling date (sampleidentity on the Filter Inventory), this information will be used to select the slide tray and should match the slide in position 1 of slide tray 1. Slide trays are organized by sampling month and should be in the same order as the Petri tray inventory. Locate the slide within the slide tray that matches the Petri dish selected. Exercise caution when selecting the slide, many IMPROVE site codes have similar site names e.g. BADL1 and BALD1 or SAGA1, SAGO1, and SAGU1, it is important to ensure the filter is transferred to the correct slide. The slide will be placed label side down on the arbor press and then the filter will be placed sample-side up on this slide (centered with the hole). A blank slide will be used to sandwich the filter, the sandwiched filter is then placed back in the correct slide tray/position.

Preparation of Filters for HIPS Analysis UCD TI #276A, Version 5.4
June 15, 2021 Page 11 of 14
1. Filters are transferred one at a time, beginning with the filter in position 1 (the top-left side of the Petri tray). Remove the Petri dish from the tray and then locate the slide tray that contains the site for the selected filter. Remember to only have 1 filter/Petri dish out at time.
2. Remove the lid from the slide tray and then locate the slide that matches the Petri dish you selected in the previous step. Place this slide on the arbor press with the label facing down.
3. Remove the lid from the Petri dish and leave the opened dish on the counter. Then use the handheld Cognex scanner to scan the barcode located on the filter support ring into the tray building software. For step by step instructions on using the Build a Tray software refer to Section 7.6: Generating Slide Trays.
4. Using forceps remove the filter from the Petri dish and place it in the designated spot on the slide (the hole shaped cutout). Remember the filter remains with the deposit/sample side face up (the labeled part of the slide is the non-sample side of the filter).
5. Grab an unlabeled slide and line it up with the filter and bottom slide (the bottom slide is the labeled slide) and then using the handle on the press, sandwich the two slides together. Double check the filter is not caught between the two slides before pressing them together (as long as the filter was aligned properly this should not be an issue).
6. Remove the sandwiched filter by gently pulling it through the slot at the front of the slide press. If the sandwich does not fit through this slot, it usually indicates the two slides are not pressed together all the way. You can lower the press again to finish the process. If that does not work then you made need to remove the unlabeled slide and then try another unlabeled slide. Another option is to carefully press the two slides together with your hands. Once the filter is properly sandwiched in the slides place it back in the correct slot of the slide tray you removed it from in step 2.
7. Place the now empty Petri dish back in the Petri tray in the same location you removed it from. It is important for the Petri dishes to stay in the correct order in the event that filters are transferred incorrectly, the order will be used for reconciliation.
8. Note any anomalies for the filters on the HIPS analysis form, such as; holes, particles, fibers, dropped filter etc. Draw a picture of the filter issue and list the site, date and module (1A or 5A). There are columns to mark the issue and an “other” option. Fill in any additional comments in the other box that are relevant.
6.6 Generating Slides Trays The Build a Tray software within LabVIEW is utilized for generating slide trays. There are two versions of the “Build a Tray” software, one is for IMPROVE the other is for CSN (Chemical Speciation Network). Please ensure you are using the IMPROVE software for creating IMPROVE trays, you will see IMPROVE in blue in the top right corner, refer to Figure 7 Build a Tray IMPROVE. If you do not see this and instead see Chemical Speciation Network in red

Preparation of Filters for HIPS Analysis UCD TI #276A, Version 5.4
June 15, 2021 Page 12 of 14
please click on the other open version of “Build a Tray” in the taskbar. The file is located here, U:\SharedData\HIPStrays - DO NOT EDIT\BuildTrayApp_IMPROVE.
Figure 6. Build a Tray IMPROVE.
Once the IMPROVE Build a Tray software is open some fields will auto-populate while others will need to be filled in by the operator. If you see a tray in progress on the “build a tray” software please do not automatically click “create tray” until you have verified the tray is finished (meaning it contains 40 filters). A typical slide tray will contain 40 filters, with the exception of special circumstances.
1. Fill in the “Sampling Month” field with the correct month(s) and year. This information is located on the HIPS analysis form or the individual Petri dish labels.
2. Fill in your initials in the “USER” field. 3. The “New Tray Number” field will auto-populate and this is referred to as the LabVIEW
tray number. It is important to note this field will always increase by 1 (it does not start over with a new set).
4. The database field should always be set to “Production” this will auto-populate (however can be changed, for routine tray building leave on “Production”).
5. Locate the Petri tray with the lowest set number and tray number (ex. Set 3 Tray 1 would be transferred before Set 3 Tray 2). Once all of the filters from the lowest set number

Preparation of Filters for HIPS Analysis UCD TI #276A, Version 5.4
June 15, 2021 Page 13 of 14
have been transferred then move on to the next set (based on the previous example would be Set 4 Tray 1). If unsure or trays are missing please ask a lab lead.
6. Filters are transferred one at a time, beginning with the filter in position1 (the top-left side). Remove the Petri dish from the tray and then locate the corresponding slide tray (the set number is listed on the Petri tray and slide tray). Remember to only have 1 filter/Petri dish out at time.
7. Remove the lid from the slide tray and then locate the slide that matches the Petri dish you selected in the previous step. Place this slide on the arbor press with the label facing down. Before transferring the filter, you will need to scan it into the Build a Tray software.
8. Before you begin scanning, ensure the cursor is in the “Barcode ID” box for position #1 (if you are at the start of a slide tray).
9. Remove the lid from the Petri dish and using the Cognex 2d scanner, scan the barcode located on the support ring of the filter. Leave the filter in the bottom of the Petri dish while scanning (to help ensure the filter is not dropped while scanning).
10. Verify the Barcode ID on the Build a Tray software matches the barcode ID you scanned. Also verify the sample date on the screen matches the sample date on the Petri dish and the slide label. Refer to Section 7.5: Transferring Samples to Slides for step-by-step procedure.
11. Place the sandwiched filter into the correct position in the slide tray, ensure the slide is visible at the top and facing toward you. Place the empty Petri dish back in the Petri tray, in the same location it was removed from.
12. Repeat steps 6-11 until the slide tray is full. A slide tray can hold 40 filters but may have less than 40. Empty slots are permissible in a slide tray provided the empties are in consecutive order. For example, if a tray contains 30 filters, the last 10 slots are allowed to remain empty.
13. Write the “New Tray Number” from the tray building software on the slide tray label in the LabVIEW tray number field.
14. Click the green “Create Tray” button on the Build a Tray software and when prompted “Are you ready to create a new tray?” select YES. The tray will be sent to a spreadsheet that is later used for analyzing the samples. The Build a Tray software is now ready for the next tray to be built. Place the completed slide tray back on the designated rack.
15. For any Petri trays that have been emptied of all filters (typically 50 filters, but can vary), set the empty tray in a bankers box. Fill out any information needed on the HIPS analysis form (date, your initials and positions transferred) and place these sheets in the completed tray. Any comments listed on the completed HIPS analysis forms will be added to the IMPROVE webapp and the forms are filed in a binder.

Preparation of Filters for HIPS Analysis UCD TI #276A, Version 5.4
June 15, 2021 Page 14 of 14
6.7 Additional Information for Transferring IMPROVE Samples In the event you have a filter in a Petri that does not have a labeled slide, check the status of the filter via the IMPROVE webapp. If the filter is valid status then you will hand write a label and place it on the unlabeled slide before transferring the filter. If the filter is determined to be “terminal” status then you will write the status on the petri label and give the filter (still in the Petri) to the sample handling lab.
In the event you are preparing to transfer a filter into a slide and find there is already a filter in this slide, double check the label on the Petri matches the label on the slide you selected. If the two labels match notify the lab lead of the issue. If the filter has a barcode etched on the support ring this will be used to verify the filter with the IMPROVE web app. A secondary way to verify the filter, is by weighing it in the sample lab. The weight for the filter can also be looked up in the web app. The filter that was erroneously transferred into the slide will also need to be looked up using the barcode, again if no barcode exists then the filter will need to be weighed. Notes will be made on the inventory analysis sheet to keep track of the transferring error and reconciliation.
Not all filters will have a barcode on the support ring. For filters without a barcode to scan the Filter ID will be typed into the tray builder software in the Filter ID field. The other fields will be left blank when a Filter ID is manually added to the tray builder software. If a filter has a barcode on the support ring that will not scan, the alphanumeric code next to the barcode can be typed into the tray builder software in the Barcode ID field. After typing the barcode ID in, the other fields should auto-populate. If the Filter ID, sample date, and site code remain blank, locate the barcode in the IMPROVE webapp and verify it is in the database. If the barcode is not listed in the IMPROVE webapp, the Filter ID will need to be typed into the tray builder software.
Transfer any 37 mm filters into slides and place in a separate slide tray. This tray will be created in the tray building software separately. Filter IDs will be used to generate the 37 mm slide tray.
7. REFERENCES
UCD IMPROVE SOP #276: Optical Absorption Analysis of PM2.5 Samples


Performing HIPS Analysis UCD TI #276B, Version 5.4
June 15, 2021 Page 2 of 10
DOCUMENT HISTORY
Date Modified
Initials Section/s Modified
Brief Description of Modifications
05/20/21 SRS All Previous anthologized document version separated into individual TIs.

Performing HIPS Analysis UCD TI #276B, Version 5.4
June 15, 2021 Page 3 of 10
TABLE OF CONTENTS
1. Purpose and Applicability ...................................................................................................... 4
2. Summary of the Method ........................................................................................................ 4 3. Definitions.............................................................................................................................. 4
4. Cautions ................................................................................................................................. 4
5. Personnel Qualifications ........................................................................................................ 4
6. Equipment and Supplies ........................................................................................................ 4 7. Procedural Steps..................................................................................................................... 5
7.1. Preparation ....................................................................................................................... 5
7.2. Registration of HIPS Detectors ........................................................................................ 5
7.3. Detector Registration Verification and Adjustments ....................................................... 7 7.4. Reanalysis......................................................................................................................... 8
7.5. IMPROVE Samples ......................................................................................................... 8
7.6. Troubleshooting ............................................................................................................... 9
8. References ............................................................................................................................ 10
LIST OF FIGURES
Figure 1. HIPS LabVIEW main screen........................................................................................... 5 Figure 2. LabVIEW Real-Time tab. ............................................................................................... 6 Figure 3. Slide tray orientation. ...................................................................................................... 7 Figure 4. Write Tray Data to Database. .......................................................................................... 8

Performing HIPS Analysis UCD TI #276B, Version 5.4
June 15, 2021 Page 4 of 10
1. PURPOSE AND APPLICABILITY
The purpose of this technical instruction (TI) document is to describe the process of performing light absorption analysis on routine IMPROVE samples and field blanks with the Hybrid Integrating Plate/Sphere System (HIPS).
2. SUMMARY OF THE METHOD
The HIPS system is stabilized at least 4 hours prior to use. The detectors are registered to a set value. A registration verification is performed using a set of 15 selected IMPROVE samples serving as verification filters. In addition, reanalysis of a selected set of previously analyzed IMPROVE filters is done to monitor system stability. After the verification and reanalysis filters have been measured and the results meet designated criteria, IMPROVE filters are then analyzed. A LabVIEW program is used to collect data and write it to the database.
3. DEFINITIONS
• HIPS: Hybrid Integrating Plate/Sphere System • IMPROVE: Interagency Monitoring Program of Visual Environments • TI: Technical Instruction
4. CAUTIONS
Make sure the correct slide tray is being loaded for analysis. Loading the wrong tray will cause the recorded data to be incorrect.
Do not forget to write to database after each tray has been analyzed, as the values recorded on the LabVIEW program will be written over as soon as analysis of the next tray begins. There is also an option to “write to file” this will only be used under special circumstances.
5. PERSONNEL QUALIFICATIONS
A trained laboratory technician, under the supervision of the spectroscopist and/or the laboratory manager, performs all analyses utilizing the HIPS system, including registration verifications, adjustments (if necessary), reanalysis, and analysis of routine IMPROVE samples.
6. EQUIPMENT AND SUPPLIES
The following equipment and supplies are used for HIPS analysis:
• Hybrid Integrating Plate/Sphere System • Registration filter and registration verification set • Reanalysis set • Slides with IMPROVE filters

Performing HIPS Analysis UCD TI #276B, Version 5.4
June 15, 2021 Page 5 of 10
• Computer connected to HIPS
7. PROCEDURAL STEPS
7.1. Preparation
1. Turn on the HIPS system at least 4 hours prior to intended use so the laser and detectors can stabilize.
2. Before starting analysis, make sure that the air compressor system is functional.
7.2. Registration of HIPS Detectors
1. Go to C:\HIPS\Applications\HIPSTRv2.exe
Figure 1. HIPS LabVIEW main screen.
2. Click the white arrow in the top left corner to engage the program (the arrow changes to black when the program is engaged).
3. Enter your initials in the “Analyst name” box. 4. Navigate to the “Real-Time” tab.

Performing HIPS Analysis UCD TI #276B, Version 5.4
June 15, 2021 Page 6 of 10
Figure 2. LabVIEW Real-Time tab.
5. Retrieve the verification slide tray and place it in the instrument, the tray is labeled “Detector Verification Set December 2011”. Ensure the slide tray is in the correct orientation and properly aligned, refer to Figure 10 below (numbers 1-40 will be visible on the side of the slide tray). Line position 1 up with the slide arm. Slide position 1 (first filter in the slide tray) in by clicking “Filter In”. To slide this filter back out click “Filter Out”. If the arm jams while attempting to load position 1, gently push or pull on the arm to correct it. The slide tray can be unloaded from the instrument and reloaded if misaligned. Once position 1 has been properly aligned, proceed to step 6.

Performing HIPS Analysis UCD TI #276B, Version 5.4
June 15, 2021 Page 7 of 10
Figure 3. Slide tray orientation.
6. Click the “Advance Tray” button to move the tray one position at a time until position 3 is aligned to load into the instrument (the filter in position 3 is ACAD1 07/07/10). This is the current registration filter.
7. Once position 3 is lined up slide the filter in by clicking “Filter in”. 8. With position 3 inserted wait a few seconds for the Transmittance (T) and Reflectance
(R) values on the screen to stabilize. Once the values stabilize, click the “Registration” button. The T and R values should now read 437 and 332, respectively. If they are not within ± 1% of these values, click “Registration” again.
9. Slide the position 3 filter out and back in and verify the values are still within ± 1% of 437 and 332. If not, click the “Registration” button again and repeat. Once complete, remove the tray from the instrument.
7.3. Detector Registration Verification and Adjustments
1. Navigate to the “Set-up” tab, from the Study dropdown box select “IMPROVE” and type a “1” in the “Tray ID” field.
2. The filter information will auto-populate and the tray label on the screen will read “Detector Verification Set December 2011”.
3. Place the verification set slide tray in the instrument and line up position 1. Refer to step 5 in section 6.2 “Registration of HIPS Detector” if further instructions are needed for proper alignment.
4. Select the green “Engage” button and the system will automatically analyze all filters in the slide tray. Scroll down to see the data recorded in real-time.

Performing HIPS Analysis UCD TI #276B, Version 5.4
June 15, 2021 Page 8 of 10
5. When the tray is finished analyzing, click “Write Tray Data to Database.”
Figure 4. Write Tray Data to Database.
6. Perform a QC check on the verification results to ensure the system is suitable for use. See TI 276C, “Quality Assurance/Quality Check of PM2.5 Loaded Filters Using Hybrid Integrating Plate/Sphere (HIPS) Method for Measuring Light Absorption” for details.
7.4. Reanalysis
1. Navigate to the “Set-up” tab and from the Study dropdown box select “IMPROVE” and type a ‘2’ in the “Tray ID” field.
2. The filter information will auto-populate and the tray label on the screen will read “Reanalysis Set June 2010.”
3. Retrieve the reanalysis slide tray and place it in the instrument lining up position 1, the tray is labeled “Reanalysis Set June 2010”. Refer to step 5 in section 6.2 “Registration of HIPS Detector” if further instructions are needed for proper alignment.
4. Select the green “Engage” button and the system will automatically analyze all filters in the slide tray. Scroll down to see the data recorded in real-time.
5. When the tray is finished analyzing, click “Write Tray Data to Database”.
6. Perform a QC check on the reanalysis results to ensure the system is fit for use. See TI 276C, “Quality Assurance/Quality Check of PM2.5 Loaded Filters Using Hybrid Integrating Plate/Sphere (HIPS) Method for Measuring Light Absorption” for details.
7. Steps 1-6 are repeated following the completion of sample analysis each day as and end of day QC check.
7.5. IMPROVE Samples
1. Verify T and R values for the registration filter, position 3 of the verification set before beginning routine analysis. Retrieve the verification slide tray and align position 1.

Performing HIPS Analysis UCD TI #276B, Version 5.4
June 15, 2021 Page 9 of 10
Navigate to the “Real-Time” tab. Then click the “Advance Tray” button on the screen twice to align position 3, then click “Filter In”. If the values are within ± 1% of 437 (for T) and 332 (for R) then proceed with routine analysis. If the values are not within ± 1% of 437 (T) and 332 (R) press the registration button on the screen. The values will reset to 437 (T) and 332 (R). Slide the filter out by clicking “Filter Out” and remove the verification slide tray.
2. Navigate to the “Set-up” tab of the LabVIEW program. 3. In the “Analyst Name” field, fill in your initials. 4. From the study dropdown box select “IMPROVE” 5. Select the first tray for analysis and enter the LabVIEW tray number indicated on the tray
label into the “Tray ID” field. The filter ID information will auto-populate on the screen. 6. Verify the first and last filter barcode IDs in the slide tray with the information on the
screen. The slide(s) will need to be opened to view the barcode on the filter support ring. Once verified sandwich the filter between the slides and place back in the slide tray. Exercise caution when opening slides and only remove one slide at time from the slide tray to ensure order integrity.
7. Load the slide tray to the instrument, lining up position 1. 8. On the screen click “Engage” and the tray will run automatically. Scroll down to see the
data recorded in real time. 9. When the tray finishes analyzing, verify T and R values were recorded for every filter in
the slide tray and for the neutral density material (NDM), once verified click “Write Tray Data to Database.”
10. Remove the tray from the HIPS instrument and place the tray back on the rack (in the position it was removed from).
11. Repeat steps 5-10 for analyzing additional routine IMPROVE samples. 12. Every 200 filters (typically 5 trays), the registration filter needs to be re-registered. Refer
to section 6.2 Registration of HIPS Detector for step-by-step procedure. Additionally, if the HIPS instrument is left idle for more than 10 minutes the registration filter will need to be re-registered.
13. Following the completion of routine sample analysis each day the reanalysis set is reanalyzed. Data for the reanalysis set is immediately ingested and exported for end of day QC. Refer to Section 7.4: Reanalysis for step-by-step procedure.
When analyzing the slide tray containing 37 mm filters (this will be a separate labeled tray for 37 mm filters) use the “write to file” option. The file will be named as: Year_Month_BYIS_37mm.csv
and saved here:
U:\IMPROVE_Lab\LASER\000-WorkingSpreadsheet-000.
7.6. Troubleshooting

Performing HIPS Analysis UCD TI #276B, Version 5.4
June 15, 2021 Page 10 of 10
1. If the system jams, just give the slide arm a gentle push or pull. The system should continue on as if nothing happened. It may be necessary to reanalyze samples immediately following a jam of the slide arm. If the arm bumps into the system aggressively this can shift the alignment and adjustments may be needed.
2. To check the alignment after a slide arm jam, load position 3 of the verification set and verify T and R values, are within ± 1% 437 (T) and 332 (R). If the values are within 1% continue with analysis, if not additional troubleshooting is required.
3. If the values for position 3 (registration filter) are not within ± 1% of 437 and 332 then the Registration of HIPS Detectors will need to be done again. Refer to Section 6.3 for detector registration steps. Once this step is complete confer with the spectroscopist before resuming analysis of routine IMPROVE samples.
4. If a slide tray is not aligned properly start by removing the slide tray from the slide changer. Place the tray back in the slide changer and use the slide arm as a guide. When properly aligned the number 1 on the side of the slide tray will be covered by the slide arm, refer to Section 6.3, Figure 11. Slide the first filter in with the program. Once the arm moves slide 1 in without jamming you may proceed with analysis.
5. If the software freezes please wait a couple of minutes before getting a lab lead. 6. If the software has an error during analysis, the entire tray will need to be reanalyzed. Do
not transmit data until the entire tray has been reanalyzed. 7. If filter information between LabVIEW and the physical samples does not match, stop
analysis and get a lab lead.
8. REFERENCES
UCD TI 276C: Quality Assurance/Quality Check of PM2.5 Loaded Filters Using Hybrid Integrating Plate/Sphere (HIPS) Method for Measuring Light Absorption


QA/QC of HIPS Analysis of Loaded Filters UCD TI #276C, Version 5.4
June 15, 2021 Page 2 of 12
DOCUMENT HISTORY
Date Modified
Initials Section/s Modified
Brief Description of Modifications
05/20/21 SRS All Previous anthologized document version separated into individual TIs.

QA/QC of HIPS Analysis of Loaded Filters UCD TI #276C, Version 5.4
June 15, 2021 Page 3 of 12
TABLE OF CONTENTS
1. Purpose and Applicability ....................................................................................................... 4
2. Summary of the Method ......................................................................................................... 4 3. Definitions............................................................................................................................... 4
4. Equipment and Supplies ......................................................................................................... 5
5. Procedural Steps...................................................................................................................... 5
5.1 Detector Registration Verification ................................................................................... 5 5.2 Reanalysis Check ............................................................................................................. 6
5.3 Sample Check ................................................................................................................... 8
5.4 Final Check ...................................................................................................................... 8
5.5 Troubleshooting ............................................................................................................... 9 6. References ............................................................................................................................. 11
LIST OF FIGURES
Figure 1. IMPROVE Management Site Network Summary. ....................................................... 12

QA/QC of HIPS Analysis of Loaded Filters UCD TI #276C, Version 5.4
June 15, 2021 Page 4 of 12
1. PURPOSE AND APPLICABILITY
The purpose of this technical instruction (TI) is to describe the process of performing quality control checks of the transmittance (T) and reflectance (R) values of PM2.5 loaded samples using the Hybrid Integrating Plate/Sphere (HIPS) system. This document provides:
• The steps to ensure proper setting of the optical detectors. • Quality control checks of the reanalysis set results. • Review of sample results.
2. SUMMARY OF THE METHOD
No standards for light absorption of particulate matter on filter media exist. Therefore, all quality control checks for the HIPS instrument are performed on sampled filters. Reference values for these filters are set based on multiple measurements performed over multiple days. Consistency is paramount when no standards exist to check accuracy. To maintain this consistency the raw detector response to a set of 15 filters is checked to be within ± 3% of the reference values. Then a reanalysis set of filters is measured and calibrated results are checked against reference values. Only after these checks pass all acceptance criteria are samples analyzed on the system. A final review of the sample results is performed to check for instrument drift or individual filter issues prior to finalizing the results.
3. DEFINITIONS
• Field blanks: PTFE filters which travel to field sampling sites with sample filters but are not sampled.
• T: Transmittance measurement; measured by the integrating plate in the HIPS system. Transmittance is the ratio of light passing through the filter/deposit to the incident light.
• R: Reflectance measurement; measured by the integrating sphere in the HIPS system. Reflectance is the ratio of light back-scattered by the filter to the incident light.
• t: The field blank corrected transmittance value. Field blank correction is found by the equation, 𝑡𝑡 = 𝑇𝑇 𝑎𝑎0⁄ , where 𝑎𝑎0 is the intercept of the linear regression of the field blank results to the line, 𝑟𝑟 + 𝑡𝑡 = 1.
• r: The field blank corrected reflectance value. Field blank correction is found by the equation, 𝑟𝑟 = −𝑎𝑎1𝑅𝑅 𝑎𝑎0⁄ , where 𝑎𝑎0 is the intercept and 𝑎𝑎1 is the slope of the linear regression of the field blank results to the line, 𝑟𝑟 + 𝑡𝑡 = 1.
• 𝑏𝑏: Raw absorption optical depth, .
• 𝜏𝜏𝑎𝑎𝑎𝑎𝑎𝑎: Field blank corrected absorption optical depth, .
• fAbs: Inferred atmospheric absorption coefficient, , where 𝑓𝑓 is the area of the sample deposit and 𝑉𝑉 is the volume (at local conditions) of air sampled. This is the calculated value in which all HIPS data are reported.

QA/QC of HIPS Analysis of Loaded Filters UCD TI #276C, Version 5.4
June 15, 2021 Page 5 of 12
• Verification filters: set of sampled filters chosen to represent a range of mass loadings and composition used to verify the registration of the HIPS detectors for long-term consistency of results.
• Reanalysis filters: a set of sampled filters chosen to represent a range of mass loadings and composition used to monitor performance of the HIPS system.
• Neutral density material (NDM): a material which reduces the intensity of all wavelengths of light equally. The NDM in HIPS acts as a reference absorber, providing reference reflectance and transmittance values during HIPS analysis.
• Acceptance limits: - Verification filters: analyzed daily during HIPS operation, are determined as ± 3% of
the reference values for T and R, except for filter #3, the registration filter, which is ± 1% of its reference values for T and R. Reference values are determined as the mean of 15 measurements after registration of the detectors.
- Reanalysis linearity: The coefficient of determination of the measured and calculated τ values plotted against the reference τ values must be ≥ 0.90.
- Reanalysis accuracy: τ must be within ± 3% of the reference values. Reference values are calculated as the mean of 15 measurements of the reanalysis set.
• Reanalysis precision: Current reanalysis measurement of τ will be added to the previous 7 measurements (for a total of 8) and the relative standard deviation (RSD) will be calculated. The RSD for τ > 0.1 (approximately 5*MDL) must be ≤ 3%.
4. EQUIPMENT AND SUPPLIES
• HIPS: Hybrid Integrating Plate/Sphere Method for Measuring reflectance and transmittance
• Verification filters.
• Reanalysis (RA) filters.
• Sample filters: Set of IMPROVE samples from a given sampling month that is to be analyzed through HIPS.
5. PROCEDURAL STEPS
5.1 Detector Registration Verification
1. To ensure consistency in measurements from day to day, the transmittance and reflectance detectors are registered to set values at the beginning of every day of analysis. This ensures consistent detector readings between the days the field blanks (used for correcting the absorption) are run and the days the sampled filters are run. Registration of the detectors is verified by running the verification filters. Position 3 in the verification filter set is the registration filter. The transmittance and reflectance detectors are set to values of 437 and 332 respectively for this filter.
2. Refer to TI 276B for specific instructions to perform the detector registration and run the verification filters. Results are written to the database following analysis. Results for T

QA/QC of HIPS Analysis of Loaded Filters UCD TI #276C, Version 5.4
June 15, 2021 Page 6 of 12
and R of the verification filters are then exported from the database and recorded in the Excel workbook “U:\IMPROVE_Lab\Laser\Detector Verification\laser_detector_verification”.
3. Once the results of the verification filters are complete they are checked against the acceptance criteria. All T and R values must be within ± 3%, except position 3 (the registration filter) which must be within ± 1%, of the accepted values listed at the top of the laser_detector_verification Excel sheet. If any measurement result is outside of this acceptable range it will turn red in the Excel worksheet.
4. Accepted values for the verification filters were determined as the mean of sixteen measures of each filter over the course of three days. These were performed 11/6/2018 – 11/8/2018 after the HIPS system underwent an upgrade including a new laser, new four inch integrating sphere, new reflectance detector, new integrating plate, and new transmittance detector.
5. If any value fails to meet the acceptance criteria, then the following steps must be completed:
i. Check that the detectors have not drifted by re-measuring the registration filter. The T and R values must be within ± 1% of the registration values (T=437, R=332). If they are outside of this range, perform a new detector registration and verification according to TI 276B. If the registration values are acceptable then continue to the next step.
ii. Re-measure the verification filter which failed acceptance. If the new values are acceptable then replace the original result in the laser_detector_verification sheet with the new ones and continue to reanalysis. If the re-measurement fails again, see the troubleshooting section and notify the spectroscopist and/or laboratory manager before proceeding.
5.2 Reanalysis Check
1. To ensure final results are consistent with historical results, a set of reanalysis filters is analyzed at the beginning and end of every day of analysis. The main difference between the reanalysis filters and the verification filters is that the reanalysis filters will undergo calculation of the field blank corrected optical absorption coefficient, 𝜏𝜏𝑎𝑎𝑎𝑎𝑎𝑎, for monitoring the long-term performance of the final HIPS result.
2. Refer to TI 276B for specific instructions to measure the reanalysis filters. Results are written to the database following analysis. Results for T and R of the reanalysis filters are exported from the database and recorded in the Excel workbook “U:\IMPROVE_Lab\Laser\Reanalysis\HIPS_Reanalysis_QC”.
3. The linear regression coefficients, 𝑎𝑎0 and 𝑎𝑎1, have been determined from a selection of IMPROVE field blanks from July, August, and September 2010 to match the reanalysis filters. These field blanks were measured five times over three days with the current HIPS system. The linear regression coefficients from the non-absorbing field blanks are used to calculate the field blank corrected absorption coefficient, 𝜏𝜏𝑎𝑎𝑎𝑎𝑎𝑎, for

QA/QC of HIPS Analysis of Loaded Filters UCD TI #276C, Version 5.4
June 15, 2021 Page 7 of 12
the reanalysis filters. For details of these calculations, see UCD SOP #276: Optical Absorption Analysis.
4. Accuracy check: The 𝜏𝜏𝑎𝑎𝑎𝑎𝑎𝑎 results are then compared to the reference values determined from ten measures of the reanalysis filters collected over two days. For each reanalysis filter the 𝜏𝜏𝑎𝑎𝑎𝑎𝑎𝑎 must be within the expanded uncertainty of the reference value. The expanded uncertainty, 𝑈𝑈(𝜏𝜏𝑎𝑎𝑎𝑎𝑎𝑎), considers the uncertainties from each part of the analysis and is shown in Equation 1.
Eq. 1 where,
Eq. 2
Eq. 3
𝑢𝑢(𝑟𝑟) and 𝑢𝑢(𝑡𝑡) are the uncertainties of the blank corrected reflectance and transmittance and are given by Equations 2 and 3, 𝑢𝑢(𝑎𝑎0) and 𝑢𝑢(𝑎𝑎1) are the standard errors in the intercept and slope of the linear regression of field blank filters, 𝑢𝑢(𝑅𝑅) and 𝑢𝑢(𝑇𝑇) are the uncertainties of the raw reflectance and transmittance which are estimated as the median standard deviation from seven measures of the reanalysis filters in November and December 2018, and 𝑘𝑘 is the coverage factor. In this work the coverage factor is set to 2, which is approximately the 95% confidence interval.
5. Linearity check: The 𝜏𝜏𝑎𝑎𝑎𝑎𝑎𝑎 results for the reanalysis run are plotted against the reference values and a linear regression is applied. The coefficient of determination must be greater than 0.95 and the slope must be within 0.95 and 1.0.
6. Long-term reanalysis: To monitor the long-term trend of the reanalysis results a z-score is calculated for each reanalysis sample, i, according to Equation 4. The z-scores for all n reanalysis samples in a day are then averaged to determine the mean z-score, Equation 5, which is then added to an on-going plot. The mean z-score must be ≤ 1 to be acceptable and any sudden jumps in the plotted mean z-score value compared to

QA/QC of HIPS Analysis of Loaded Filters UCD TI #276C, Version 5.4
June 15, 2021 Page 8 of 12
previous values should be investigated.
Eq. 4
Eq. 5 7. Failure of QC checks:
a. If any sample fails the accuracy check or is the cause of failure of the linearity or long-term checks then it should be reanalyzed. If it continues to fail the check, see the troubleshooting section and notify the spectroscopist or laboratory manager.
b. If the linearity or long-term checks fail and no single filter is obviously at fault, then see the troubleshooting section and notify the spectroscopist or laboratory manager.
c. If the end-of-day reanalysis QC check fails any test, then the results for all samples analyzed that day are suspect and should be invalidated. Samples will need to be reanalyzed once the problem is corrected and QC tests pass.
5.3 Sample Check
1. Routine analysis of sample filters is monitored by checking the NDM reference filter values recorded with every sample measurement. The reference T and R values from the NDM filter are exported from the database and plotted along with acceptance limits. The acceptance limits will be automatically calculated as ± 5% of the mean result for the first 200 measures of the NDM. Ensure that the reference T and R values stay within the limits and there are no sudden large jumps in the values. If a failure is observed, see the troubleshooting section and notify the spectroscopist or laboratory manager before proceeding.
2. The registration filter is analyzed after 200 sample filters have run through HIPS analysis. This is done to ensure that the detector registration has not changed. See TI 276B for details. If the registration values are found to be outside of ± 1% of their set values (T = 437, R = 332) then follow the directions in TI 276B and notify the spectroscopist or laboratory manager.
5.4 Final Check
1. After all analysis for the sampling month is complete and the QC checks have passed, notify the spectroscopist or laboratory manager that the data are ready for review.
2. The spectroscopist or laboratory manager will review all the HIPS data and QC checks and ensure the integrity of the data.

QA/QC of HIPS Analysis of Loaded Filters UCD TI #276C, Version 5.4
June 15, 2021 Page 9 of 12
5.5 Troubleshooting
1. Failure of a single verification or reanalysis filter a. This section assumes you have checked the registration filter is still within 1%
of the set values for T and R. b. For any filters which fail acceptance, begin troubleshooting by visually
inspecting the filter for any holes, tears, or other defects. If any are found, notify the spectroscopist or lab manager. Analysis can continue as the issue is with the filter and not the instrument. The damaged filter will have to be removed from service.
c. If no damage or defects are discovered during visual inspection, try rotating the filter slide in the slide tray and measure again.
d. If rotating the slide does not resolve the problem, perform a new detector registration and verification regardless of whether the registration filter is still within 1% of its set values. If this does not resolve the issue continue to the steps below.
2. Detector registration verification failure a. If step 1 above did not resolve the issue or more than one filter is failing, then
perform a new detector registration and verification. b. If the verification continues to fail, stop analysis and notify the spectroscopist
or laboratory manager. Then, proceed to the “Instrument troubleshooting” section below.
3. Reanalysis check failure a. If step 1 above did not resolve the issue or more than one filter is failing, then
perform a new detector registration and verification. b. If the registration verification check passes and the reanalysis check continues
to fail, stop analysis and notify the spectroscopist or laboratory manager. Then, proceed to the “Instrument troubleshooting” section below.
c. In the event that some maintenance has been performed on the HIPS instrument or some part has been replaced (especially an optical component), then the values measured for the field blanks which correct the transmittance and reflectance of the reanalysis filters may no longer hold. In this case, the reanalysis field blanks should be re-measured and new field blank linear regression coefficients (𝑎𝑎0 and 𝑎𝑎1) will need to be determined to properly correct 𝜏𝜏𝑎𝑎𝑎𝑎𝑎𝑎.
4. NDM reference value failure a. If the NDM reference value drifts outside of the acceptance limits, you should
stop analysis of samples. b. Take a measure of the registration filter and verify it is within 1% of its set
values. Then, take a measure of the NDM (slide arm out) and check if it is
QA/QC of HIPS Analysis of Loaded Filters UCD TI #276C, Version 5.4
June 15, 2021 Page 10 of 12
within 5% of the mean value calculated for the day. If it is acceptable, then proceed by re-measuring the affected sample filters. Monitor the NDM reference values during re-measurement and ensure the NDM is acceptable. If it is, continue with sample analysis.
c. If the registration filter is still within 1% of its set values and the NDM fails acceptance then review the results from a previous week of analysis and determine if the NDM reference is more than 5% different from the mean value obtained then.
d. If the unacceptable NDM value is within 5% of the previous week’s mean NDM value then it is likely that there was a problem with the first 200 NDM measurements which determine the mean for that day. Notify the spectroscopist or laboratory manager so they can review the data and decide whether the day’s analyses must be repeated.
e. If the unacceptable NDM value is different from the previous week’s then it is likely the alignment of the laser has changed. Notify the spectroscopist or lab manager and proceed to the “Instrument troubleshooting” section below.
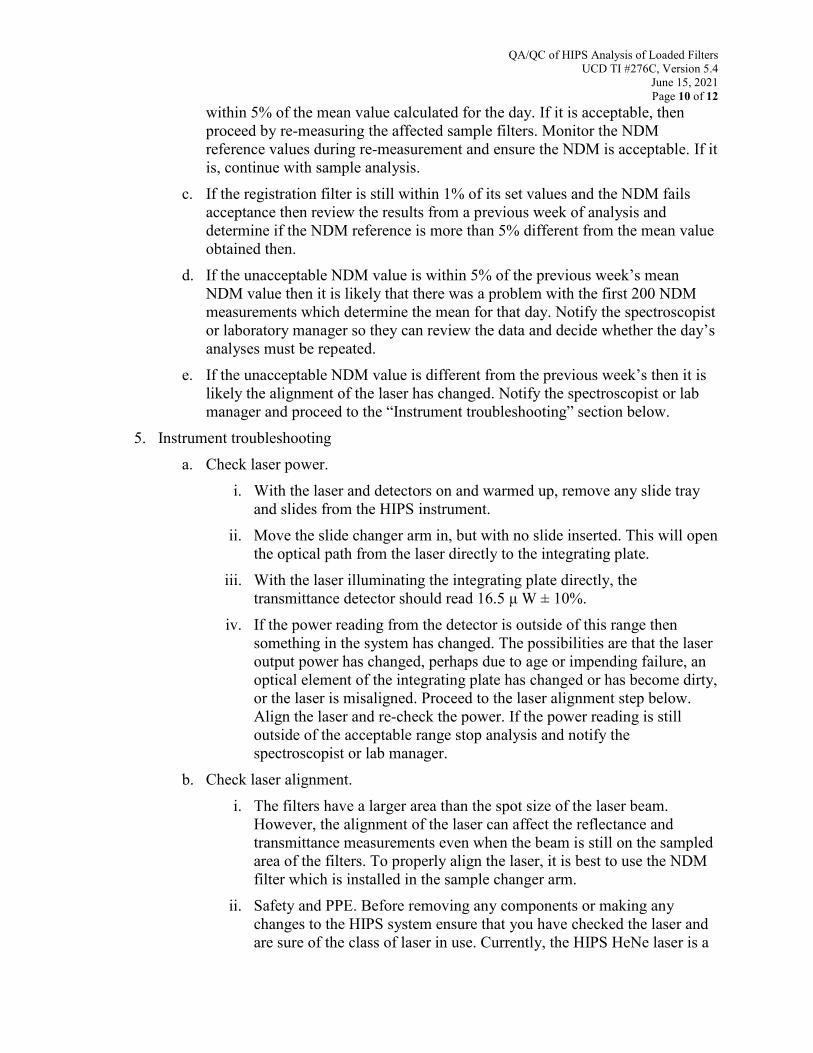
5. Instrument troubleshooting a. Check laser power.
i. With the laser and detectors on and warmed up, remove any slide tray and slides from the HIPS instrument.
ii. Move the slide changer arm in, but with no slide inserted. This will open the optical path from the laser directly to the integrating plate.
iii. With the laser illuminating the integrating plate directly, the transmittance detector should read 16.5 μ W ± 10%.
iv. If the power reading from the detector is outside of this range then something in the system has changed. The possibilities are that the laser output power has changed, perhaps due to age or impending failure, an optical element of the integrating plate has changed or has become dirty, or the laser is misaligned. Proceed to the laser alignment step below. Align the laser and re-check the power. If the power reading is still outside of the acceptable range stop analysis and notify the spectroscopist or lab manager.
b. Check laser alignment. i. The filters have a larger area than the spot size of the laser beam.
However, the alignment of the laser can affect the reflectance and transmittance measurements even when the beam is still on the sampled area of the filters. To properly align the laser, it is best to use the NDM filter which is installed in the sample changer arm.
ii. Safety and PPE. Before removing any components or making any changes to the HIPS system ensure that you have checked the laser and are sure of the class of laser in use. Currently, the HIPS HeNe laser is a

QA/QC of HIPS Analysis of Loaded Filters UCD TI #276C, Version 5.4
June 15, 2021 Page 11 of 12
class 3b unit, but this could change if the laser is changed. Make sure you have the proper PPE for the type of laser in use. Eye protection is required when working with the laser in any capacity other than routine HIPS measurement (when the system is closed and no light escapes).
iii. To align the laser, remove the transmittance detector and plate optics assembly from behind the slide holder. This allows you to see the backside of the NDM filter when the slide changer arm is in the “out” position. Observe the laser light on the NDM filter and adjust the laser mount to center the laser spot on the NDM filter. The laser spot is nearly as large as the NDM filter so centering is fairly easy to determine visually.
iv. Once aligned, reinstall the plate optics and transmittance detector. v. Perform a laser power check and detector registration and verification to
ensure the alignment is good. vi. A final check of the reanalysis filters will determine, based on passing
acceptance, if the alignment change will require a new field blank correction for the reanalysis set. If the reanalysis set requires the field blanks be re-measured, then sample filter field blanks will also have to be re-measured to determine new linear regression coefficients which will then need to be entered into the database. If the reanalysis check does not pass acceptance after laser alignment, notify the spectroscopist or laboratory manager.
6. REFERENCES
1. Evaluation of measurement data-Guide to the expression of uncertainty in measurement, 2008. Joint Committee for Guides in Metrology, JCGM 100:2008. www.bipm.org.
2. UCD SOP #276: Optical Absorbance Analysis 3. UCD SOP #276 Technical Instruction – TI 276B: Performing HIPS Analysis

QA/QC of HIPS Analysis of Loaded Filters UCD TI #276C, Version 5.4
June 15, 2021 Page 12 of 12
Figure 1. IMPROVE Management Site Network Summary.


