Page 1
HAL Id: hal-00115962https://hal.archives-ouvertes.fr/hal-00115962
Submitted on 9 Dec 2006
HAL is a multi-disciplinary open accessarchive for the deposit and dissemination of sci-entific research documents, whether they are pub-lished or not. The documents may come fromteaching and research institutions in France orabroad, or from public or private research centers.
L’archive ouverte pluridisciplinaire HAL, estdestinée au dépôt et à la diffusion de documentsscientifiques de niveau recherche, publiés ou non,émanant des établissements d’enseignement et derecherche français ou étrangers, des laboratoirespublics ou privés.
Preparation of Supported Gold Nanoparticles by aModified Incipient Wetness Impregnation Method
Laurent Delannoy, Nissrine El Hassan, Andrea Musi, Nga Nguyen Le To,Jean-Marc Krafft, Catherine Louis
To cite this version:Laurent Delannoy, Nissrine El Hassan, Andrea Musi, Nga Nguyen Le To, Jean-Marc Krafft, et al..Preparation of Supported Gold Nanoparticles by a Modified Incipient Wetness Impregnation Method.2006. <hal-00115962>
Page 2
1
Preparation of supported gold nanoparticles by a modified incipient
wetness impregnation method
Laurent Delannoy*, Nissrine El Hassan, Andrea Musi, Nga Nguyen Le To, Jean-Marc Krafft,
Catherine Louis
Laboratoire de Réactivité de Surface, UMR 7609 CNRS, Université Pierre et Marie Curie, 4
place Jussieu, 75252 Paris Cedex 05, France
Running title: Modified method of impregnation of Au/oxide
Figures: 8
Tables: 3
* Corresponding author :
Laurent Delannoy
e-mail: [email protected]
tel. +33 (0)1 44 27 21 13
fax. +33 (0)1 44 27 60 33
Page 3
2
Abstract
In this work, we show that if the mere procedure of impregnation of oxide supports with
chloroauric acid, which is well-known to lead to large gold particles, is followed by a step of
washing with ammonia, small gold particles (3-4 nm) can be obtained after a treatment of
calcination at 300°C on any type of oxide supports (alumina, titania, silica). Moreover, gold
leaching is very limited during the washing step, and a large range of gold loadings (0.7 to 3.5
wt %) can be achieved. Elemental analysis, Raman spectroscopy and temperature
programmed desorption under argon show that this ammonia post-treatment results in the
removal of chloride ligands from the coordination sphere of Au(III) precursor and their
replacement by ammine, leading to an ammino-hydroxo or an ammino-hydroxo-aquo gold
complex and not to gold hydroxide. The Au/TiO2 catalysts prepared with this modified
procedure of impregnation are almost as active as those prepared by deposition-precipitation
with urea in the CO oxidation reaction performed at room temperature.
Keywords : Au/TiO2, Au/Al2O3, Au/SiO2, impregnation, preparation, CO oxidation,
DRIFTS, Raman
Page 4
3
1. Introduction
Among the various methods used to prepare supported gold catalysts, impregnation
with the most common gold precursor, HAuCl4, is considered as an inappropriate path to
achieve highly active catalysts. Indeed, this method results in the formation of large and
therefore catalytically inactive gold particles after thermal treatment. Such large particles arise
from to the high amount of chlorine residues present in the solids after impregnation, which
induce sintering of gold during the activation procedure.1-3 Since this was the first method
used to prepare gold based catalysts, this metal has long been considered as fairly inactive.
Since the late eighties, several other preparation methods have been developed. Among them,
the deposition-precipitation (DP) procedure allowed to produce small gold particles, and
highly active gold catalysts in various reactions, and in particular in the extensively studied
CO oxidation reaction.
This paper deals with the use of a modified impregnation procedure to obtain highly
dispersed gold catalysts. In this procedure, the incipient wetness impregnation of oxide
supports (TiO2, Al2O3, SiO2) was followed by a post-treatment of the resulting solid with an
aqueous ammonia solution. Washing with ammonia has already been used to remove most of
the chlorines present in Au/Al2O3 samples prepared by anion adsorption and to favour the
formation of small gold particles during thermal activation.4-6 Another group has also recently
used a treatment under gaseous ammonia at room temperature followed by washing with
water to remove the chlorines after impregnation and get small gold particles on titania.7 In
the present paper, catalysts with various gold loadings were prepared by the modified
impregnation procedure mentioned just above, and the nature of the supported gold phase was
characterized. Their activity in the CO oxidation reaction was compared with those of
reference samples prepared by deposition-precipitation with urea (DP Urea).8,9 DRIFTS
Page 5
4
analyses under reaction mixture were also conducted in order to interpret the differences in
activity.
2. Experimental
2.1 Sample preparation
The catalysts were prepared with supports TiO2 P25 (titanoxid Degussa, 50 m2/g, 70%
Anatase, 30% Rutile), γ-Al2O3 (aluminoxid, Degussa, 110 m2/g) and SiO2 (Aerosil 300,
Degussa, 250 m2/g). Two preparation procedures were used, and in both cases the desired
gold loadings were 0.7, 1 and 4 wt %.
Au/TiO2, Au/γ-Al2O3 and Au/SiO2 reference catalysts were prepared by the method of
deposition-precipitation with urea (DP Urea) described in detail elsewhere.8,9 Typically, a
solution of HAuCl4 (concentration depending on the desired gold loading) was prepared by
dissolving the appropriate amount of HAuCl4,3H2O in 100 mL of deionized water. Urea was
added to the gold solution to achieve a concentration 100 times higher than the HAuCl4
concentration. The support (1g) was then added and the suspension was stirred and heated to
80°C during 16 h in a reactor closed and kept away from light. Then, the solid was separated
by centrifugation, washed three times with deionized water (with centrifugation between each
washing) and dried under vacuum at room temperature for 2 h.
The modified impregnation procedure (ImpN) consisted of preparing samples with
various gold loadings by incipient wetness impregnation of the supports, titania, alumina and
silica (1-3g), with aqueous solution of HAuCl4 of appropriate concentrations (typically
0.8mL/g support). The solution pH�s were lower than 1. The samples were aged at room
temperature (RT) for 1 h and then were washed twice with an aqueous ammonia solution (30
Page 6
5
mL, 1M, pH=11.5) and twice with deionized water (30 mL), the solids were centrifuged
between each washing. For SiO2, the washings were performed at lower pH (pH=8) with a
solution of NH4Cl (0.25M) to avoid the dissolution of silica at high pH. The samples were
dried under vacuum at room temperature for 2h.
2.2 Techniques
Chemical analyses were performed by inductively coupled plasma atom emission
spectroscopy at the CNRS Center of Chemical Analysis (Vernaison, France).
Before characterization, all the samples, whatever the preparation procedure, were
calcined in air at 300°C for 4 h (100 mL/min, 2°C/min from RT to 300°C then 4h at 300 °C).
XRD analysis was carried out with a Siemens D500 diffractometer with Cu Kα radiation.
TEM analysis was performed using a JEOL 100 CX II microscope. The histograms of the
metal particle sizes were established from the measurement of 300 to 1000 particles. The size
limit for the detection of gold particles on these supports is about 1 nm.
Temperature programmed desorption of the dried samples were performed under
argon (TPD) (100 mL/min, 5°C/min from RT to 300 °C). The compounds produced during
the TPD were monitored by mass spectrometry (Hiden Quadrupole HPR20). The main
molecules detected in the gas phase during this treatment were H2O (m/e=18 and 17), NH3
(m/e=17 and 15), N2 (m/e=28) and N2O (m/e=44). Traces of NO (m/e=30) and NO2 (m/e=46)
were also detected.
The Raman spectra were recorded on a commercial RAMAN RXN1 analyser from
Kaiser Optical Systems, Inc., (KOSI). It incorporates a laser working at 785 nm, a CCD
detector providing full spectral collection of Raman data from 200 to 3500 cm-1 with a
resolution of at least 4 cm-1 and holographic notch filters.
Page 7
6
The infrared study was conducted with an IFS 66V (Bruker) using a DRIFTS cell. The
sample compartment was filled with the dried solids. The samples (20 mg) were treated in situ
in the DRIFTS cell under 20%O2 in He (25 mL/min) from RT to 300 °C (2°C/min) then 300
°C for 4h in order to reproduce the ex situ calcination conditions. The cell was purged with He
at room temperature before introduction of 1%CO/He (50 mL/min) or 1%CO/2%O2/He (50
mL/min). The spectrum recorded under He was used as reference and the intensity of the
spectrum under CO and CO/O2 atmosphere was expressed as Log(ICO/Iref). The spectra are
presented after substraction of the CO gas-phase.
CO oxidation reaction was performed at room temperature and atmospheric pressure with a
feed of 1% CO and 2% O2 (balanced with He), with a total flow rate of 230 mL/min, in a
flow-type packed-bed reactor. Before reaction, the dried gold catalysts (25 or 50 mg) were
pretreated with a mixture of 20% O2 in He (25 mL/min) from RT to 300 °C (2°C/min) then
300 °C for 4h in order to reproduce the ex situ calcination conditions. The CO consumption
and CO2 production were monitored with a Maihak Gas Analyser S710. The activity was
expressed as the number of mole of CO converted by second and gram of gold (mol.CO.s-
1.molAu-1). The turnover frequency (TOF) was calculated with the assumption that the gold
particles are cubo-octahedral, and that all the surface gold atoms are equally active, which is
obviously not correct since only low coordinated gold sites can adsorb CO. The dispersion
was expressed as the Ns/Nt ratio, where Ns represents the number of surface atoms and Nt the
total number of atoms in the particle. An average dispersion D was calculated using the
particle size distribution estimated by TEM and the weighed dispersions calculated for each
particle size range of the histogram.
Page 8
7
3. Results and discussion
3.1 Characterization of the gold catalysts
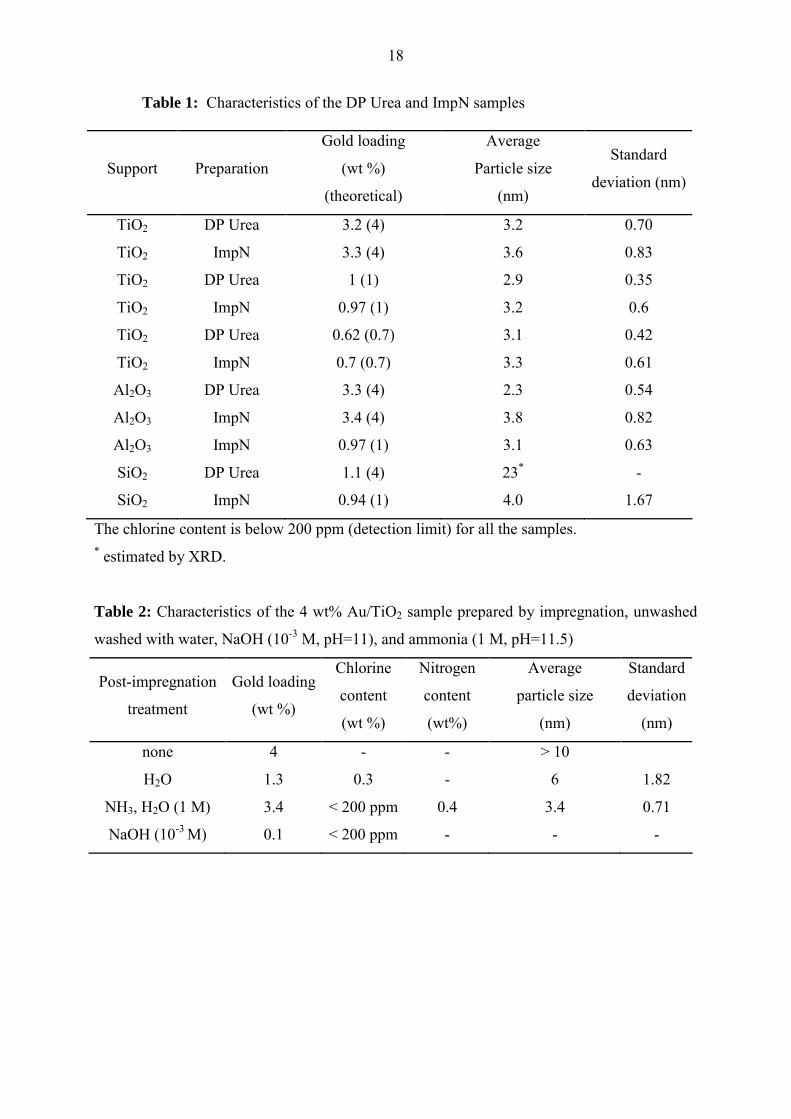
Table 1 reports the gold loading in the DP Urea and ImpN samples, as well as the
average gold particle size measured by TEM after calcination at 300 °C. As expected from
our former studies,8,9 most of the gold in solution is deposited on the supports with the
method of deposition-precipitation with urea, and the average gold particle sizes are small
except for silica, which presents a low gold loading and a very large particle size.
More unexpected is that in the case of the ImpN samples, the gold loading is also close
to the nominal gold amount. This result indicates that the loss of gold during the ammonia
post-treatment of the impregnated samples is limited, whatever the support and the gold
loading. The chlorine content is also very low for all the samples (< 200 ppm, which is the
detection limit of ICP-EOS), which suggests that the ammonia treatment is very efficient in
the removal of the chlorine residues after impregnation. Probably as a consequence of that, as
indicated in section Introduction, the average gold particle sizes are small and close to those
obtained from DP Urea samples. Moreover, the particle size obtained on silica after the post-
impregnation treatment with ammonium chloride are much smaller than that achieved by DP
Urea and close to those observed for the other supports. This is quite interesting because it is
still challenging to prepare small gold particles on SiO2 using a simple method.
Figures 1 and 2A reveal that the particle size distribution of ImpN Au/TiO2 (4 wt %)
(Figure 1B) is slightly broader and shifted towards larger size (Figure 2A) than for the DP
Urea sample (Figures 1A). The TEM micrographs also show that the repartition of the gold
particles onto the support is less homogeneous for the ImpN than for the DP Urea sample.
Indeed, for the ImpN sample although most of the gold particles are well separated from each
Page 9
8
other, some metallic particles are gathered on the same particle of support while other areas
seem to be free of gold particles (Figure 1B). For lower gold loading (0.7 wt %) (Figure 3),
the gold particles of the two types of samples are more similar in average size and size
distribution. The same trends are observed for the other supports. The non uniform repartition
of the gold particles on support for the high loaded sample probably arises from the step of
incipient wetness impregnation itself since there is no specific interaction between most of the
gold precursor and the support in contrast with DP Urea.8,9
Figure 4 presents the TEM pictures of gold particles supported on TiO2, Al2O3 and
SiO2 prepared by the ImpN method with a gold loading of 1 wt%. It shows that the repartition
of the gold nanoparticles on the surface of the different supports is homogeneous. The particle
size distributions and average particle sizes are similar for the TiO2 and Al2O3 supports, but
for silica, the size distribution is broader, and the average particle size slightly larger.
Figure 5 shows two sets of Raman spectra for the 4 wt % Au/TiO2 and Au/Al2O3
impregnated samples, one after impregnation and drying at RT (spectra a) and the other after
the ammonia treatment and drying at RT (spectra b). The Raman spectra of the unwashed
samples (spectra a) exhibit two intense bands at 323 and 346 cm-1, which both are
characteristic of Au-Cl vibrations. Indeed, in the literature,10 these peaks are respectively
attributed to the out-of phase stretching mode (ν5) (323 cm-1) and the symmetric stretching
vibrations (ν1) (346 cm-1) of the Au-Cl bonds in the [AuCl4]- complex in solution. Thus, one
can deduce that gold chloride species is present onto the support after impregnation and that
drying at room temperature probably does not change the gold speciation. After the ammonia
treatment, the Au-Cl stretching bands have totally disappeared in both spectra (spectra b). A
very weak and broad band centered at 560 cm-1 can be observed for the Au/Al2O3 catalyst. In
the other sample, it may be also present, but hidden by the vibration bands of titania. Such a
Page 10
9
peak can be assigned to Au-O or Au-N vibrations, due to the replacement of chlorine by
oxygen or nitrogen atoms in the coordination sphere of Au3+ during the washing step.10
Some authors claimed that the Au chloride present on the support is converted into a
gold hydroxide Au(OH)3 during the ammonia post-treatment in liquid,4-6 or in gas phase.7 In
order to investigate this assumption, the 4 wt% Au/TiO2 sample prepared by impregnation
was washed with water on the one hand, and with NaOH (10-3 M, pH=11) at the same pH as
for ammonia washing on the other hand, and in both cases according to the same procedure as
for the ammonia treatment. The results are reported in Table 2. Only the ammonia post-
treatment leads to the preservation of a high gold loading. In contrast, most of the gold is
removed upon washing with NaOH and small amount of gold still remains on the support
after washing with water, in agreement with former results.8 Thus, the nature of the basic
solution used during the post-impregnation treatment has a stronger influence on the gold
loading in the final catalyst than the pH. Elemental analysis reveals that the sample washed
with ammonia contains nitrogen with an N/Au atomic ratio around 2 (Table 2).
In an attempt to identify the nature of the gold species present in the ImpN samples,
we monitored by mass spectrometry the species produced during TPD under argon with the 4
wt% Au/TiO2 ImpN sample (Figure 6A). A blank experiment was also performed with the
TiO2 support impregnated by an HCl solution of the same chlorine concentration as that of the
HAuCl4 impregnation solution, and then washed with the ammonia solution (Figure 6B). For
Au/TiO2 and TiO2, a broad peak of water (m/e = 18) is observed between 80 and 300 °C.
Around 270 °C, the release of NH3 (m/e = 17 and 15) is also observed in both samples, and
could arise from the desorption of NH3 from the support. For the Au/TiO2 sample, additional
peaks are observed around 140 °C with sharp peaks of production of H2O, N2 and N2O. No
NH3 is released, as confirmed by the monitoring of m/e=15 (not shown). Since the
experiments were carried out under inert atmosphere, the production of N2 and N2O can only
Page 11
10
arise from the decomposition of the gold (III) species formed during the ammonia post-
treatment. This may indicate that this species contained NH3 ligands and that the auto-
reduction of AuIII into Au0 by the ammine ligands occurred around 140 °C, leading to the
formation of N2 and N2O. The gold (III) species present on the titania surface after the
ammonia washings could then contain ammine ligands, but is certainly not Au(OH)3.
According to papers reporting ammonia washing,4-6 gold chloride is claimed to be
transformed into gold hydroxide, but no characterization was performed to prove it, the only
element of information provided being that chlorine was eliminated. It is known that in a
solution of HAuCl4 at high pH (around 11), there is hydrolysis of the Au-Cl bonds and
replacement by Au-OH bonds to give [Au(OH)3Cl]- and/or [Au(OH)4]- complexes, but not
Au(OH)3.10-12 The washing of the 4 wt% Au/TiO2 sample with a NaOH solution at pH 11
results in the removal of a large part of the gold (Table 2). This is consistent with the fact that
the [Au(OH)4]- or [Au(OH)3Cl]- complex cannot interact with the titania surface also
negatively charged (pH> PZC(TiO2) = 4-6). One can deduce that the gold species formed
during washing with ammonia and sodium hydroxide are different since they remain on the
support. We therefore propose that the gold species formed during the ammonia post-
treatment could be an ammino-hydroxo or an ammino-hydroxo-aquo gold cation complex
[Au(NH3)2(H2O)2-x(OH)x](3-x)+. Reaction between chlorinated gold complexes and ammonia is
described in the literature and several ammine gold complexes have been studied.13-15 The
cationic nature of this complex consistent with the fact that almost no gold is leached out
during the washing step with ammonia. Indeed, at the pH of the washing (pH 11), the support
surfaces of TiO2 (PZC =4-6), Al2O3 (PZC =7-9), SiO2 (PZC =1-2) are all negatively charged,
so electrostatic interaction between the cation gold complex and the support surface is
possible. If such interpretation is correct, one should expect that the samples reach an upper
limit in gold loading due the limited capacity of cation adsorption of the supports. This may
Page 12
11
be the reason for which a higher proportion of gold is leached out at high loading (4 wt %)
than at low loading (Table 1). It must be added that it is also possible that the cationic gold
complex formed during the ammonia post-treatment is grafted onto the support, and that some
oxygen atoms of the gold complex belong to the oxide surface. However, it is not easy to go
much further in the characterization of the gold complex. The XAFS technique, which a
priori is the best method of characterization of the coordination sphere of metal complexes is
helpless in the present case since it cannot allow to distinguish N from O atoms, and the peak
of second neighbour, which would allow to determine whether the complex is grafted or in
electrostatic interaction, is too weak to provide reliable information.
3.2 CO oxidation activity and DRIFTS analysis
The catalytic properties of gold catalysts supported on TiO2, Al2O3 and SiO2 prepared
by ImpN and DP Urea were compared in the reaction of CO oxidation at 25 °C, after in situ
calcination at 300 °C for 4 hours under 20% O2 in He. First of all, the catalysts supported on
Al2O3 and SiO2 are inactive at room temperature, whatever the preparation methods. These
results are consistent with previous studies, which showed that the catalytic activity in CO
oxidation strongly depends on the nature of the support, and that reducible supports such as
TiO2 or Fe2O3, usually lead to catalysts much more active than unreducible ones such as SiO2
or Al2O3, and even if the gold particle sizes are identical.16-18
In the following, we will only consider the results obtained for the Au/TiO2 samples.
Comparisons of the CO oxidation activities and Turnover Frequency (TOF) of the two types
of catalysts at the pseudo-steady state (after 90 min) for equivalent gold content are reported
in Table 3. All the catalysts on TiO2 are active, but a general trend is that the catalysts
prepared by DP Urea are more active than those prepared by ImpN, whatever the gold
content. The TOF, calculated from the average gold dispersion of each sample, which takes
Page 13
12
into account the number of surface atoms exposed, are similar for a given procedure of
preparation, DP Urea or ImpN, whatever the gold loading. The performances of the ImpN
catalysts approach those of DP Urea catalysts, with a TOF ratio close to 2. It is known that not
only the activity, but also the TOF of the gold catalysts in CO oxidation strongly increase
when the gold particles reach size smaller than 2-3 nm.19-21, 22-24 Here, the lower activity of the
ImpN catalysts can be related to the fact that their average particle size is slightly larger and
their particle size is broader than those of the DP Urea samples (Table 1 and Figure 2).
Figure 7 shows the DRIFTS spectra in the carbonyl region of the 4 wt % Au/TiO2
catalysts prepared by ImpN and DP Urea, in situ calcined and exposed to a flow of 1%CO in
He at RT. After exposure of the DP Urea sample to CO for one minute, two CO bands can be
observed at 2107 (intense) and 2164 cm-1 as well as a double band at 2340 and 2360 cm-1
characteristic of CO2 in the gas phase. The band at 2107 cm-1 is assigned to CO adsorbed on
the low coordination sites of metallic gold particles.25-28 This band is broad and may contain
several contributions. The peak at 2164 cm-1 can be attributed to CO adsorbed on cations,
either Au+ gold species,27,29-32 or cations of the support.33 For the ImpN sample after one
minute of exposure, these two bands are shifted to 2119 and 2169 cm-1 respectively, and two
other bands at 2183 and 2349 cm-1 are also visible. They can be assigned respectively to the
adsorption of CO and CO2 on support Ti4+ cations.25,34 It is worth noting that the band at 2164
(DP Urea) or 2169 cm-1 (ImpN) is the only one still present after flushing the cell by He for
10 min (not shown), which indicates a strong interaction of CO with the associated adsorption
sites. The high stability of this CO band allows us to assign it to CO adsorbed on Au+ and not
on the support, since CO adsorbed on support cations is known to be easily eliminated during
evacuation at room temperature.33,35 Regarding the metallic gold sites, which are considered
as the active sites or at least as one of the active sites in the CO oxidation reaction, the
difference of CO frequency between both samples (2107 for DP Urea and 2119 cm-1 for
Page 14
13
ImpN) may result from a difference of CO coverage on the metal particle surface. Indeed, a
shift towards higher wavenumber is usually observed when the CO coverage on gold particle
decreases.25,36,37 Since the number of low coordination sites decreases when the gold particle
size increases, and CO adsorbs on low coordination sites, this result can be interpreted by a
lower density of adsorbed CO molecules on the gold particles of the ImpN sample. This is
consistent with the fact that this sample contains a lower proportion of small particles (Figures
1 and 2A), and that it is less active than the 4 wt % DP Urea sample.
Figure 7 also shows the evolution of these spectra after exposure to 1%CO/He at RT
for longer time, 10 and 60 min. An additional band can be observed at 2075 cm-1 in the
spectrum of the ImpN sample after 10 min of exposure. This contribution is not clearly visible
in that of the DP Urea sample after 10 min, but may be present as a shoulder; after 60 min of
exposure, the band is clearly visible. Moreover, the band at 2164 cm-1 has almost disappeared
after 10 min under CO for the DP Urea sample, while the bands at 2169 and 2183 cm-1 are
still present for the ImpN sample.
The presence of CO bands at lower frequency than that of CO adsorbed on Au0 around
2100 cm-1 has been reported in several papers. 25,28,38-40 Bands of bridge-bonded CO on gold
are located at still lower frequency, 1950-2000 cm-1, 25,28,38 therefore this assignement can be
discarded. Bands in the same range as ours (2050-2080 cm-1) have been observed on Au/TiO2
and assigned by Boccuzzi et al., first to CO adsorbed on metallic gold sites at the perimeter
of the particle in contact with the support 39,40 and then to CO adsorbed on Auδ- sites of small
gold clusters, the negative arising from electron transfer from the partially reduced support
towards metallic gold particles. 28
Figure 8 shows the DRIFTS spectra of the same samples after 60 min of exposure at
RT to a flow of 1%CO/2%O2/He to reproduce the conditions of CO oxidation reaction. The
two spectra are almost similar except a small band at 2168 cm-1 that is only visible in the
Page 15
14
spectrum of the ImpN sample. The band of CO adsorbed on metallic gold have almost the
same position (2115 cm-1). CO2 in the gas phase, produced by the reaction of CO oxidation, is
clearly visible with the bands at 2361 and 2340 cm-1, indicating that both catalysts are active.
Interestingly, the band at 2075 cm-1 has disappeared, which would suggest that the
corresponding gold adsorption site is highly unstable under oxidizing atmosphere. Boccuzzi et
al. also observed that CO band (2055 cm-1) present on Au/TiO2 samples reduced under H2, 28
disappeared upon O2 adsorption due to annealing of the negative charge on gold. We can
tentatively propose that the band at 2075 cm-1, which appears with time under CO atmosphere
(Figure 7), could be related to the progressive formation of oxygen vacancies on the TiO2
surface under CO, resulting in an electron transfer from these oxygen vacancies towards the
metallic gold particles located in their vicinity. To confirm this hypothesis, additional
experiments of EPR spectroscopy for instance are needed to investigate the formation of Ti3+
sites after CO adsorption, but this is beyond the scope of the present paper.
5. Conclusion
In this work, we have been successful in the preparation of small gold particles on
various supports (alumina, titania, silica) by incipient wetness impregnation followed by an
ammonia post-treatment. This procedure is easy to handle and the ammonia washing removes
the chloride ligands responsible for the formation of large gold particles after classical
impregnation followed by thermal treatment, but keeps a large part of gold on the support. We
got evidence that the new gold compound formed upon washing is not an hydroxide as
proposed in the literature, but an ammino-hydroxo-aquo cationic gold complex
Page 16
15
[Au(NH3)2(H2O)2-x(OH)x](3-x)+, which can interact with the support surface either
electrostatically, or through grafting, and then prevent the gold leaching. The resulting gold
particles are slightly larger and moderately less active in CO oxidation than those prepared by
deposition-precipitation with urea. This difference in activity is related to the lower CO
coverage observed for the ImpN sample by DRIFTS analysis under CO/He mixture.
Acknowledgement
The authors are grateful to Mrs. Fabienne Warmont for her help regarding the TEM analysis.
References
(1) Hutchings, G.J. Catal. Today 2005, 100, 55.
(2) Park, E.D.; Lee, J.S. J. Catal. 1999, 186, 1.
(3) Kozlova, A.P.; Kozlov, A.I.; Sugiyama, S.; Matsui, Y.; Asakura, K.; Iwasawa, Y. J.
Catal. 1999, 181, 37.
(4) Xu, Q.; Kharas, K.C.C.; Datye, A.K. Catal. Lett. 2003, 85, 229.
(5) Ivanova, S.; Petit, C.; Pitchon, V. Appl. Catal. A 2004, 267, 191.
(6) Ivanova, S.; Pitchon, V.; Zimmermann, Y.; Petit, C. Appl. Catal. A 2006, 298, 57.
(7) Li, W.-C.; Comotti, M.; Schuth, F. J. Catal. 2006, 237, 190.
(8) Zanella, R.; Giorgio, S.; Henry, C.R.; Louis, C. J. Phys. Chem. B 2002, 106, 7634.
(9) Zanella, R.; Delannoy, L.; Louis, C. Appl. Catal A 2005, 291, 62.
(10) Peck, J. A.; Brown, G.E. Geochim. Cosmochim. Acta 1991, 55, 671.
(11) Farges, F.; Sharps, J.A.; Brown, G.E. Geochim. Cosmochim. Acta 1993, 57, 1243.
(12) Murphy, P.J.; LaGrange, M.S. Geochim. Cosmochim. Acta 1998, 62, 3515.
(13) Manfait, M.; Alix, A. J. P.; Kappenstein, C. Inorg. Chem. Acta 1981, 50, 147.
Page 17
16
(14) Skibsted, L. H.; Bjerrum, J. Acta Chem. Sand. Ser. A 1974, 28, 740.
(15) Mason, W. R.; Gray, H. B. J. Am. Chem. Soc. 1968, 90, 5721.
(16) Schubert, M.M.; Hackenberg, S.; Veen, A. C. V.; Muhler, M.; Plzak, V.; Behm,R.J. J.
Catal. 2001, 197, 113.
(17) Arii, S.; Morfin, F.; Renouprez, A.J.; Rousset, J.L. J. Am. Chem. Soc. 2004, 126,
1199.
(18) Grunwaldt, J.D.; Kierner, C.; Wogerbauer, C.; Baiker, A. J. Catal. 1999, 181, 223.
(19) Zanella, R.; Giorgio, S.; Shin, C.H.; Henry, C.R.; Louis, C. J. Catal. 2004, 222, 357.
(20) Haruta, M.; Tsubota, S.; Kobayashi, T.; Kageyama, H.; Genet, M.J.; Delmon, B. J.
Catal. 1993, 144, 175.
(21) Kozlov, A.I.; Kozlova, A.P.; Asakura, K.; Matsui, Y.; Kogure, T.; Shido, T.; Iwasawa,
Y. J. Catal. 2000, 196, 56.
(22) Valden, M.; Lai, X.; Goodman, D.W. Science 1998, 281, 1647.
(23) Schwartz, V.; Mullins, D.R.; Yan, W.; Chen, B.; Dai, S.; Overbury, S.H. J. Phys.
Chem. B 2004, 108, 15782.
(24) Lopez, N.; Janssens, T.V.W.; Clausen, B.S.; Xu, Y.; Mavrikakis, M.; Bligaard, T.;
Nørskov, J.K. J. Catal. 2004, 223, 232.
(25) Bollinger, M.A.; Vannice, M.A. Appl. Catal. B 1996, 8, 417.
(26) Haruta, M. Catal. Surv. Jpn. 1997, 1, 61.
(27) Minico, S.; Scire, S.; Crisafalli, C.; Visco, A.M.; Galvagno, S. Catal. Lett. 1997, 47,
273.
(28) Boccuzzi, F.; Chiorino, A.; Manzoli, M.; Andreeva, A.; Tabakova, T. J. Catal. 1999,
188, 176.
(29) Meyer, R.; Lemire, C.; Shaikhutdinov, S.K.; Freund, H.-J. Gold Bull. 2004, 37, 72.
(30) Yates, D.J.C. J. Phys. Chem. 1961, 65, 746.
Page 18
17
(31) Qiu, S.; Ohnishi, R.; Ichikawa, M. J. Chem. Soc. Chem. Commun. 1992, 1425.
(32) Salama, T.M.; Ohnishi, R.; Shido, T.; Ichikawa, M. J. Catal. 1196, 162, 169.
(33) Hadjiivanov, K.; Lamotte, J.; Lavalley, J.-C. Langmuir 1997, 13, 3374.
(34) Morterra, C. J Chem. Soc. Faraday Trans. I 1988, 84, 1617.
(35) Venkov, T.; Fajerwerg, K.; Delannoy, L.; Klimev, H.; Hadjiivanov, K.; Louis,
C. Applied Catal. A 2006, 301, 106.
(36) Bond, G.C.; Thompson, D.T. Catal. Rev.-Sci. Eng. 1999, 41, 319.
(37) Hadjiivanov, K.; Vayssilov, G. Adv. Catal. 2002, 47, 347.
(38) Lee, J.Y.; Schwank, J. J. Catal. 1986, 102, 207.
(39) Manzoli, M.; Chorino, A.; Boccuzzi, F. Surf. Sci. 2003, 532, 377.
(40) Boccuzzi, F.; Chiorino, A; Tsubota, S; Haruta, M. Catal. Lett. 1994, 29, 225.
Page 19
18
Table 1: Characteristics of the DP Urea and ImpN samples
Support Preparation
Gold loading
(wt %)
(theoretical)
Average
Particle size
(nm)
Standard
deviation (nm)
TiO2 DP Urea 3.2 (4) 3.2 0.70
TiO2 ImpN 3.3 (4) 3.6 0.83
TiO2 DP Urea 1 (1) 2.9 0.35
TiO2 ImpN 0.97 (1) 3.2 0.6
TiO2 DP Urea 0.62 (0.7) 3.1 0.42
TiO2 ImpN 0.7 (0.7) 3.3 0.61
Al2O3 DP Urea 3.3 (4) 2.3 0.54
Al2O3 ImpN 3.4 (4) 3.8 0.82
Al2O3 ImpN 0.97 (1) 3.1 0.63
SiO2 DP Urea 1.1 (4) 23* -
SiO2 ImpN 0.94 (1) 4.0 1.67
The chlorine content is below 200 ppm (detection limit) for all the samples. * estimated by XRD.
Table 2: Characteristics of the 4 wt% Au/TiO2 sample prepared by impregnation, unwashed
washed with water, NaOH (10-3 M, pH=11), and ammonia (1 M, pH=11.5)
Post-impregnation
treatment
Gold loading
(wt %)
Chlorine
content
(wt %)
Nitrogen
content
(wt%)
Average
particle size
(nm)
Standard
deviation
(nm)
none 4 - - > 10
H2O 1.3 0.3 - 6 1.82
NH3, H2O (1 M) 3.4 < 200 ppm 0.4 3.4 0.71
NaOH (10-3 M) 0.1 < 200 ppm - - -
Page 20
19
Table 3: Comparison of the CO conversion rates and TOF at room temperature (25°C) of DP
Urea and ImpN Au/TiO2 catalysts after 90 min of reaction at the pseudo-steady state
Catalyst CO conversion rate
(molCO.s-1.molAu-1)
Average
Dispersion
TOF
(s-1)
Samples DPU / ImpN
TOF Ratio
4 wt% DP Urea 0.39 0.74
4 wt% ImpN
0.29
0.12 0.35 0.34 2.2
1 wt% DP Urea 0.45 0.77
1 wt% ImpN
0.35
0.11 0.39 0.28 2.7
0.7 wt% DP Urea 0.47 0.74
0.7 wt% ImpN
0.35
0.15 0.40 0.37 2
Page 21
20
Figure Captions
Figure 1. TEM image and particle size distribution of the 4 wt% Au/TiO2 catalysts prepared
by DP Urea (A) and ImpN (B) after calcination at 300°C.
Figure 2. Shapes of the particle size distributions for A) the 4 wt% Au/TiO2 and B) the 0.7
wt% Au/TiO2 prepared by DP Urea (solid line) and ImpN(dashed line).
Figure 3. TEM image and particle size distribution of the 0.7 wt% Au/TiO2 catalysts prepared
by DP Urea (A) and ImpN (B) after calcination at 300°C.
Figure 4. TEM images and particle size distribution of samples prepared by ImpN (1 wt%
Au) on TiO2 (A), Al2O3 (B) and SiO2 (C).
Figure 5. Raman spectra of the 4 wt% Au/TiO2 (A) and Au/Al2O3 (B) samples prepared by
ImpN before (a) and after (b) the ammonia post-treatment.
Figure 6. TPD under Argon followed by mass spectrometry of a) 4 wt%Au/TiO2 and b) TiO2
after post-impregnation treatment with ammonia. The monitored species are H2O (m/e=18
and 17), NH3 (m/e=17), N2 (m/e)=28 and N2O (m/e)=44.
Figure 7. DRIFTS spectra of the 4 wt% Au/TiO2 catalysts prepared by DP Urea and ImpN
after exposure to 1%CO/He for 1, 10 or 60 minutes.
Figure 8. DRIFTS spectra of the 4 wt% Au/TiO2 catalysts prepared by DP Urea (grey line)
and ImpN (black line) after exposure to 1%CO / 2%O2 / He for 60 min.
Page 22
21
0%
5%
10%
15%
20%
25%
30%
35%
40%
0-1 1-2 2-3 3-4 4-5 5-6 6-7 7-8 8-9
particle size (nm)
Freq
uenc
y
0%
5%
10%
15%
20%
25%
30%
35%
40%
0-1 1-2 2-3 3-4 4-5 5-6 6-7 7-8
particle size (nm)
Freq
uenc
y
B50 nm
50 nm
Average particle size3.2 nm
Average particle size3.6 nm
0%
5%
10%
15%
20%
25%
30%
35%
40%
0-1 1-2 2-3 3-4 4-5 5-6 6-7 7-8 8-9
particle size (nm)
Freq
uenc
y
0%
5%
10%
15%
20%
25%
30%
35%
40%
0-1 1-2 2-3 3-4 4-5 5-6 6-7 7-8
particle size (nm)
Freq
uenc
y
B50 nm
50 nm
Average particle size3.2 nm
Average particle size3.6 nm
Fig. 1
Page 23
22
0%
10%
20%
30%
40%
50%
60%
70%
0 1 2 3 4 5 6 7 8 9
particle size (nm)
Freq
uenc
y
0%
5%
10%
15%
20%
25%
30%
35%
40%
0 1 2 3 4 5 6 7 8 9
particle size (nm)
Freq
uenc
y
A
B
0%
10%
20%
30%
40%
50%
60%
70%
0 1 2 3 4 5 6 7 8 9
particle size (nm)
Freq
uenc
y
0%
5%
10%
15%
20%
25%
30%
35%
40%
0 1 2 3 4 5 6 7 8 9
particle size (nm)
Freq
uenc
y
A
B
Fig. 2
Page 24
23
0%
10%
20%
30%
40%
50%
60%
0-1 1-2 2-3 3-4 4-5 5-6 6-7 7-8 8-9particle size (nm)
Freq
uenc
y
0
0.1
0.2
0.3
0.4
0.5
0.6
0.7
0-1 1-2 2-3 3-4 4-5 5-6 6-7 7-8 8-9particle size (nm)
Freq
uenc
y
Average particle size3.1 nm
Average particle size3.3 nm
0%
10%
20%
30%
40%
50%
60%
0-1 1-2 2-3 3-4 4-5 5-6 6-7 7-8 8-9particle size (nm)
Freq
uenc
y
0
0.1
0.2
0.3
0.4
0.5
0.6
0.7
0-1 1-2 2-3 3-4 4-5 5-6 6-7 7-8 8-9particle size (nm)
Freq
uenc
y
Average particle size3.1 nm
Average particle size3.3 nm
Fig. 3
Page 25
24
0%
5%
10%
15%
20%
25%
30%
35%
40%
45%
50%
0-1 1-2 2-3 3-4 4-5 5-6 6-7 7-8 8-9 9-10
Diameter (nm)
Freq
uenc
y
0%
5%
10%
15%
20%
25%
30%
35%
40%
45%
0-1 1-2 2-3 3-4 4-5 5-6 6-7 7-8 8-9 9-10
Diameter (nm)
Freq
uenc
y
0%
5%
10%
15%
20%
25%
30%
35%
0-1 1-2 2-3 3-4 4-5 5-6 6-7 7-8 8-9 9-10
Diameter (nm)
Freq
uenc
y
A
B
C
0%
5%
10%
15%
20%
25%
30%
35%
40%
45%
50%
0-1 1-2 2-3 3-4 4-5 5-6 6-7 7-8 8-9 9-10
Diameter (nm)
Freq
uenc
y
0%
5%
10%
15%
20%
25%
30%
35%
40%
45%
0-1 1-2 2-3 3-4 4-5 5-6 6-7 7-8 8-9 9-10
Diameter (nm)
Freq
uenc
y
0%
5%
10%
15%
20%
25%
30%
35%
0-1 1-2 2-3 3-4 4-5 5-6 6-7 7-8 8-9 9-10
Diameter (nm)
Freq
uenc
y
A
B
C
50 nm
50 nm
50 nm
Average particle size3.2 nm
Average particle size3.1 nm
Average particle size4 nm
0%
5%
10%
15%
20%
25%
30%
35%
40%
45%
50%
0-1 1-2 2-3 3-4 4-5 5-6 6-7 7-8 8-9 9-10
Diameter (nm)
Freq
uenc
y
0%
5%
10%
15%
20%
25%
30%
35%
40%
45%
0-1 1-2 2-3 3-4 4-5 5-6 6-7 7-8 8-9 9-10
Diameter (nm)
Freq
uenc
y
0%
5%
10%
15%
20%
25%
30%
35%
0-1 1-2 2-3 3-4 4-5 5-6 6-7 7-8 8-9 9-10
Diameter (nm)
Freq
uenc
y
A
B
C
0%
5%
10%
15%
20%
25%
30%
35%
40%
45%
50%
0-1 1-2 2-3 3-4 4-5 5-6 6-7 7-8 8-9 9-10
Diameter (nm)
Freq
uenc
y
0%
5%
10%
15%
20%
25%
30%
35%
40%
45%
0-1 1-2 2-3 3-4 4-5 5-6 6-7 7-8 8-9 9-10
Diameter (nm)
Freq
uenc
y
0%
5%
10%
15%
20%
25%
30%
35%
0-1 1-2 2-3 3-4 4-5 5-6 6-7 7-8 8-9 9-10
Diameter (nm)
Freq
uenc
y
A
B
C
50 nm
50 nm
50 nm
0%
5%
10%
15%
20%
25%
30%
35%
40%
45%
50%
0-1 1-2 2-3 3-4 4-5 5-6 6-7 7-8 8-9 9-10
Diameter (nm)
Freq
uenc
y
0%
5%
10%
15%
20%
25%
30%
35%
40%
45%
0-1 1-2 2-3 3-4 4-5 5-6 6-7 7-8 8-9 9-10
Diameter (nm)
Freq
uenc
y
0%
5%
10%
15%
20%
25%
30%
35%
0-1 1-2 2-3 3-4 4-5 5-6 6-7 7-8 8-9 9-10
Diameter (nm)
Freq
uenc
y
A
B
C
0%
5%
10%
15%
20%
25%
30%
35%
40%
45%
50%
0-1 1-2 2-3 3-4 4-5 5-6 6-7 7-8 8-9 9-10
Diameter (nm)
Freq
uenc
y
0%
5%
10%
15%
20%
25%
30%
35%
40%
45%
0-1 1-2 2-3 3-4 4-5 5-6 6-7 7-8 8-9 9-10
Diameter (nm)
Freq
uenc
y
0%
5%
10%
15%
20%
25%
30%
35%
0-1 1-2 2-3 3-4 4-5 5-6 6-7 7-8 8-9 9-10
Diameter (nm)
Freq
uenc
y
A
B
C
50 nm50 nm
50 nm50 nm
50 nm50 nm
Average particle size3.2 nm
Average particle size3.1 nm
Average particle size4 nm
Fig. 4
Page 26
25
1000
2000
3000
4000
5000
Cou
nts
300 400 500 600 700
Raman Shift (cm-1)
a
b
A
Au-Cl stretching mode
TiO2
500
1000
1500
2000
2500
3000
3500
Cou
nts
300 400 500 600 700
Raman Shift (cm-1)
a
b
B
Au-Cl stretching mode
Cou
nts
300 400 500 600 700 Raman Shift (cm-1)
1000
2000
3000
4000
5000
Cou
nts
300 400 500 600 700
Raman Shift (cm-1)
a
b
A
Au-Cl stretching mode
TiO2
1000
2000
3000
4000
5000
Cou
nts
300 400 500 600 700
Raman Shift (cm-1)
a
b
A
Au-Cl stretching mode
TiO2
500
1000
1500
2000
2500
3000
3500
Cou
nts
300 400 500 600 700
Raman Shift (cm-1)
a
b
B
Au-Cl stretching mode
Cou
nts
300 400 500 600 700 Raman Shift (cm-1)
500
1000
1500
2000
2500
3000
3500
Cou
nts
300 400 500 600 700
Raman Shift (cm-1)
a
b
B
Au-Cl stretching mode
Cou
nts
300 400 500 600 700 Raman Shift (cm-1)
Fig. 5
Page 27
26
1.0E-09
1.5E-09
2.0E-09
2.5E-09
3.0E-09
3.5E-09
4.0E-09
4.5E-09
5.0E-09
5.5E-09
6.0E-09
25 45 80 115 145 175 205 235 270 3002.0E-10
3.0E-10
4.0E-10
5.0E-10
6.0E-10
7.0E-10
8.0E-10
9.0E-10
1.0E-09
m/e=18
m/e=17
m/e=28
m/e=44
110°C 140°C 270°C
Inte
nsity
(a.u
.) Intensity ( a.u.)
Temperature (°C)
a)
1.0E-09
1.5E-09
2.0E-09
2.5E-09
3.0E-09
3.5E-09
4.0E-09
4.5E-09
5.0E-09
5.5E-09
6.0E-09
25 45 80 115 145 175 205 235 270 3002.0E-10
3.0E-10
4.0E-10
5.0E-10
6.0E-10
7.0E-10
8.0E-10
9.0E-10
1.0E-09
m/e=18
m/e=17
m/e=28
m/e=44
110°C 140°C 270°Ca)
Temperature (°C)
1.0E-09
1.5E-09
2.0E-09
2.5E-09
3.0E-09
3.5E-09
4.0E-09
4.5E-09
5.0E-09
5.5E-09
6.0E-09
25 50 110 160 210 270 3002.0E-10
3.0E-10
4.0E-10
5.0E-10
6.0E-10
7.0E-10
8.0E-10
9.0E-10
1.0E-09160°C
280°C
m/e=17
m/e=18
m/e=28
m/e=44
Inte
nsity
(a.u
.) Intensity (a.u.)
b)
Temperature (°C)
1.0E-09
1.5E-09
2.0E-09
2.5E-09
3.0E-09
3.5E-09
4.0E-09
4.5E-09
5.0E-09
5.5E-09
6.0E-09
25 50 110 160 210 270 3002.0E-10
3.0E-10
4.0E-10
5.0E-10
6.0E-10
7.0E-10
8.0E-10
9.0E-10
1.0E-09160°C
280°C
m/e=17
m/e=18
m/e=28
m/e=44
Inte
nsity
(a.u
.) Intensity (a.u.)
b)
1.0E-09
1.5E-09
2.0E-09
2.5E-09
3.0E-09
3.5E-09
4.0E-09
4.5E-09
5.0E-09
5.5E-09
6.0E-09
25 45 80 115 145 175 205 235 270 3002.0E-10
3.0E-10
4.0E-10
5.0E-10
6.0E-10
7.0E-10
8.0E-10
9.0E-10
1.0E-09
m/e=18
m/e=17
m/e=28
m/e=44
110°C 140°C 270°C
Inte
nsity
(a.u
.) Intensity ( a.u.)
Temperature (°C)
a)
1.0E-09
1.5E-09
2.0E-09
2.5E-09
3.0E-09
3.5E-09
4.0E-09
4.5E-09
5.0E-09
5.5E
1.0E-09
1.5E-09
2.0E-09
2.5E-09
3.0E-09
3.5E-09
4.0E-09
4.5E-09
5.0E-09
5.5E-09
6.0E-09
25 45 80 115 145 175 205 235 270 3002.0E-10
3.0E-10
4.0E-10
5.0E-10
6.0E-10
7.0E-10
8.0E-10
9.0E-10
1.0E-09
m/e=18
m/e=17
m/e=28
m/e=44
110°C 140°C 270°C
Inte
nsity
(a.u
.) Intensity ( a.u.)
Temperature (°C)
a)
1.0E-09
1.5E-09
2.0E-09
2.5E-09
3.0E-09
3.5E-09
4.0E-09
4.5E-09
5.0E-09
5.5E-09
6.0E-09
25 45 80 115 145 175 205 235 270 3002.0E-10
3.0E-10
4.0E-10
5.0E-10
6.0E-10
7.0E-10
8.0E-10
9.0E-10
1.0E-09
m/e=18
m/e=17
m/e=28
m/e=44
110°C 140°C 270°Ca)
Temperature (°C)
1.0E-09
1.5E-09
2.0E-09
2.5E-09
3.0E-09
3.5E-09
4.0E-09
4.5E-09
5.0E-09
5.5E-09
6.0E-09
25 50 110 160 210 270 3002.0E-10
3.0E-10
4.0E-10
5.0E-10
6.0E-10
7.0E-10
8.0E-10
9.0E-10
1.0E-09160°C
280°C
m/e=17
m/e=18
m/e=28
m/e=44
Inte
nsity
(a.u
.) Intensity (a.u.)
b)
Temperature (°C)Temperature (°C)
1.0E-09
1.5E-09
2.0E-09
2.5E-09
3.0E-09
3.5E-09
4.0E-09
4.5E-09
5.0E-09
5.5E-09
6.0E-09
25 50 110 160 210 270 3002.0E-10
3.0E-10
4.0E-10
5.0E-10
6.0E-10
7.0E-10
8.0E-10
9.0E-10
1.0E-09160°C
280°C
m/e=17
m/e=18
m/e=28
m/e=44
Inte
nsity
(a.u
.) Intensity (a.u.)
b)
Temperature (°C)
1.0E-09
1.5E-09
2.0E-09
2.5E-09
3.0E-09
3.5E-09
4.0E-09
4.5E-09
5.0E-09
5.5E-09
6.0E-09
25 50 110 160 210 270 3002.0E-10
3.0E-10
4.0E-10
5.0E-10
6.0E-10
7.0E-10
8.0E-10
9.0E-10
1.0E-09160°C
280°C
m/e=17
m/e=18
m/e=28
m/e=44
Inte
nsity
(a.u
.) Intensity (a.u.)
b)
Fig. 6
Page 28
27
2500 2400 2300 2200 2100 2000 1900 Wavenumber (cm-1)
2107
2119
2075
2169
2183
2349
2164
DP Urea 1 min
DP Urea 10 min
DP Urea 60 min
ImpN 1 min
ImpN 10 min
Log
(I CO/I r
ef)
0.05
2500 2400 2300 2200 2100 2000 1900 Wavenumber (cm-1)
2107
2119
2075
2169
2183
2349
2164
DP Urea 1 min
DP Urea 10 min
DP Urea 60 min
ImpN 1 min
ImpN 10 min
Log
(I CO/I r
ef)
0.05
Fig. 7
Page 29
28
2361
2340
2115
2168
0
.05
.1
.15
2500 2400 2300 2200 2100 2000 1900 Wavenumber (cm-1)
Log
(I CO/I r
ef)
2361
2340
2115
2168
0
.05
.1
.15
2500 2400 2300 2200 2100 2000 1900 Wavenumber (cm-1)
Log
(I CO/I r
ef)
Fig. 8


![Magnetic nanoparticles supported ionic liquids for lipase ...sourcedb.ipe.cas.cn/zw/lwlb/200908/P020090901287922534554.pdf · nanoparticles [3–5]. The magnetite-loaded enzymes are](https://static.documents.pub/doc/80x56/5f36f13cb95d7d6ff46da159/magnetic-nanoparticles-supported-ionic-liquids-for-lipase-nanoparticles-3a5.jpg)


