David Hamilton, PhD Managing Director, Singapore Glenn Levine Senior Economic Research Analyst, New York Preparing for Defaults in China’s Corporate Credit Market 1 Irina Baron Quantitative Credit Risk, New York
Transcript
David Hamilton, PhDManaging Director, Singapore
Glenn LevineSenior Economic Research Analyst, New York
Preparing for Defaults in
China’s Corporate Credit
Market
1
Irina BaronQuantitative Credit Risk, New York
Today’s Presenters
2
David Hamilton, PhD
Managing DirectorStress Testing and Credit Risk Analytics, Asia-Pacific
Singapore
Glenn Levine
Corporate Stress Testing Model Lead, Capital Markets Research Group
New York
Irina Baron
Quantitative Credit Risk Research Analyst, Capital Markets Research Group
New York
About Moody’s Analytics
3
Credit RatingsCredit Research
Credit Risk and Macroeconomic ModelsSoftwareDataMacroeconomic and Credit ResearchTraining and CertificationConsulting and Advisory Services
Global Presence, Local Expertise
Preparing for Defaults in China’s Corporate
Credit Market
4
1. China’s macroeconomic and credit risk outlook
What are key statistics telling us about future risk?
2. Measuring and managing the default risk of Chinese firms
What strategies are effective for spotting the riskiest exposures in a credit portfolio?
3. Incorporating macroeconomic variables into default risk forecasts
How can we condition PDs on macroeconomic variables?
How can we utilize such conditioned PDs for stress testing and IFRS 9 impairment calculations?
Definition of Default
5
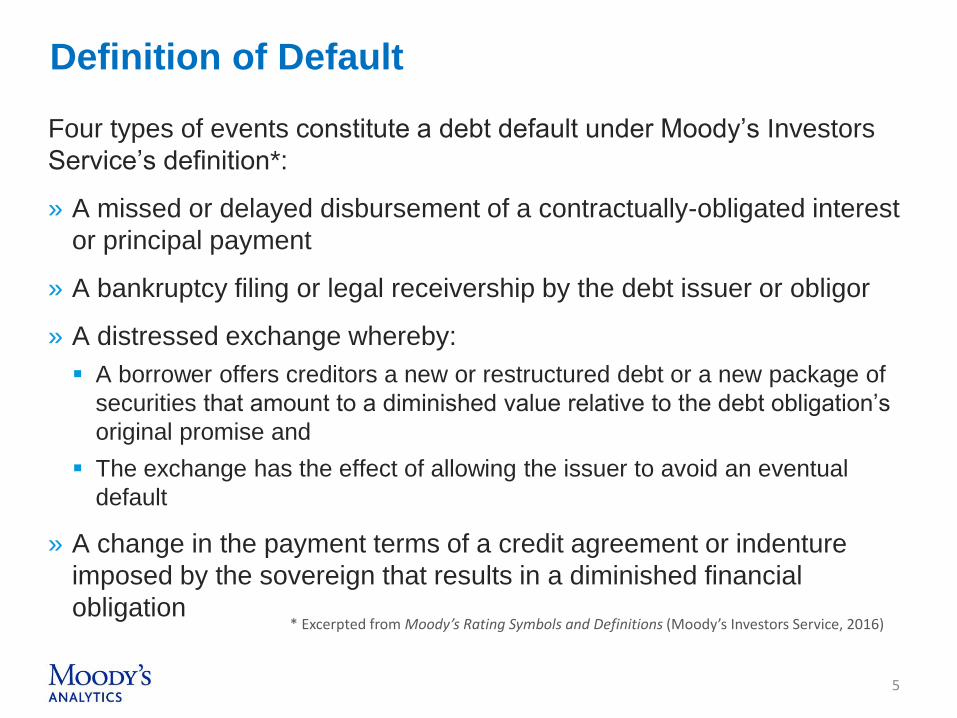
Four types of events constitute a debt default under Moody’s Investors
Service’s definition*:
» A missed or delayed disbursement of a contractually-obligated interest
or principal payment
» A bankruptcy filing or legal receivership by the debt issuer or obligor
» A distressed exchange whereby:
A borrower offers creditors a new or restructured debt or a new package of
securities that amount to a diminished value relative to the debt obligation’s
original promise and
The exchange has the effect of allowing the issuer to avoid an eventual
default
» A change in the payment terms of a credit agreement or indenture
imposed by the sovereign that results in a diminished financial
obligation* Excerpted from Moody’s Rating Symbols and Definitions (Moody’s Investors Service, 2016)
Corporate Debt in China Has Grown Rapidly
Since 2008
6
China’s corporate debt as a percent of GDP has grown sharply since 2008…
… and has surpassed most other major economies globally.
Data sources: Moody’s Investors Service and Bank for International Settlements
Growth in Risky Corporate Debt Has
Historically Led to Surges in Default Rates
7
Data set includes US bond and loan issuers rated by Moody’s Investors Service between 1992 and 2015
An Independent, Quantitative Credit Risk Model
Can Be Useful
8
AA-3.3%
Distribution of China Onshore Ratings by 10 Domestic Ratings Agencies
Distribution of Ratings Implied by Moody’s Analytics’ Probabilities of Default
Non-Investment Grade0.05%
Data sources: Financial Times (Wind Information) and Moody’s Analytics
The Number of Firms with EDFs Has Nearly
Tripled Since 2002 as Listings Have Boomed
9
Data source: Moody’s Analytics
10
China’s
Macroeconomic and
Credit Risk Outlook
Despite Challenges, China’s Economy Has
Been Proven to Be Resilient
11
GDP Growth, % Change Year Ago
Sources: National Bureau of Statistics, Moody’s Analytics
Moody’s Analytics Baseline Outlook is for Solid
Economic Growth
12
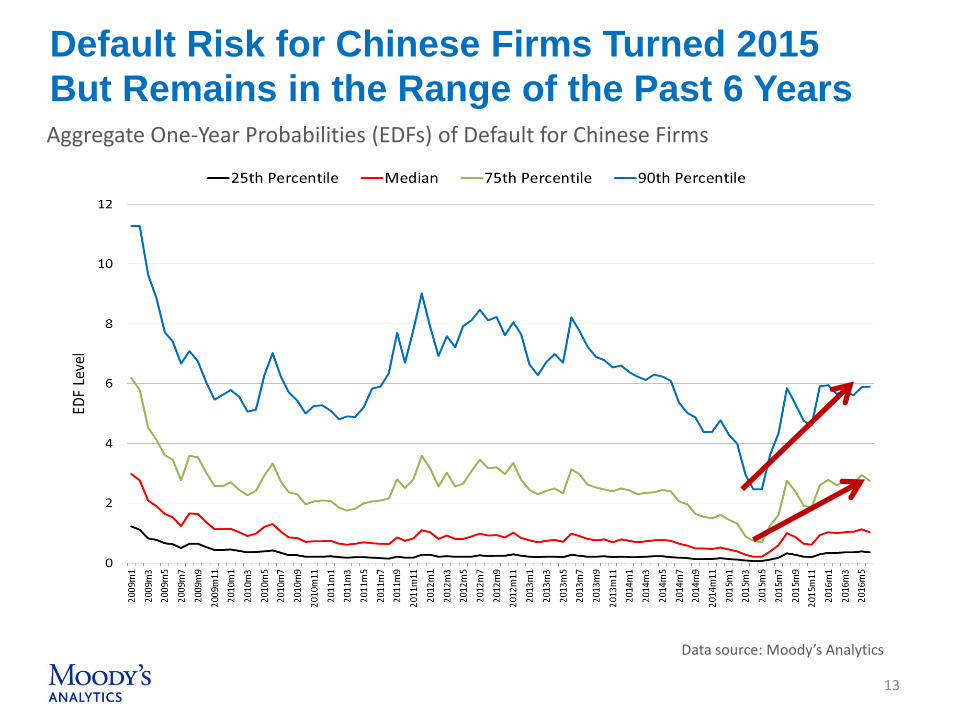
13
Aggregate One-Year Probabilities (EDFs) of Default for Chinese Firms
Default Risk for Chinese Firms Turned 2015
But Remains in the Range of the Past 6 Years
Data source: Moody’s Analytics
Sources: National Bureau of Statistics, Moody’s Analytics
14
China’s Economic Outlook + 4 Alternative
Macroeconomic ScenariosGDP Growth, % Change Year Ago
Default Risk Forecasts Under Alternative
Macroeconomic Scenarios
China – All sectors Consumer Discretionary
Health CareEnergy
Median One-Year Default Probabilities (EDFs) for Selected Industry Sectors
15Data source: Moody’s Analytics
16
Measuring and Managing
the Default Risk of Chinese
Firms
∙ 𝑒−𝑟𝑇Φ(𝑑2)Default Point
Measuring PD: Moody’s Analytics’ Expected
Default Frequency Model
17
Assets =Assets Equity+ Φ(𝑑1)
Expected Default Frequencies (EDFs) are derived from a causal model driven by
fundamental credit risk factors: when the market value of a firm’s assets is insufficient to
cover its liabilities, then the firm defaults.
The market value of a firm’s assets is not directly observable. The EDF model utilizes a
key insight to estimate the market value of assets: a firm’s equity is like a call option on
its asset value, with a strike price equal to liabilities due.
There are 3 main drivers of the EDF model:
1. The default point: derived from a firm’s liability structure
2. Market value of assets: inferred from equity prices
3. Volatility of the market value of assets: inferred from equity volatility
Do Models Informed by Equity Market Prices
“Work” for Chinese Companies?
18
» Model accuracy depends on the availability and quality of input data. A major
advantage of Moody’s Analytics models is the decades of experience developing
models for many different economies world-wide.
» EDF measures have proven to be effective measures of default risk in markets
with distinctive or unique institutional features (e.g. Japan).
» EDF measures do not include the effect of external support. They are useful
stand-alone measures of risk that can and should be compared with measures
that do include external support (e.g. ratings).
» Chinese share prices (as well as other asset prices) are reliable enough that the
PBOC uses them in policy decision making.
» Institutional or market features that attempt to mitigate default may affect the
expected level of PD at a given point in time, but as we will show effective early
warning can still be achieved by observing relative PDs.
One-Year Accuracy Ratios for Chinese
Companies Compare Favorably to Other Markets
19
1-Year Accuracy Ratio # Firms # Defaults
China 62.64% 3,724 77
Japan 77.88% 4,558 93
Australia 70.06% 2,525 171
USA 78.14% 9,243 1,126
W. Europe 68.40% 7,459 509
Data set includes all firms in respective countries between 2007 and 2015.
The Accuracy Ratio is a rank correlation statistic that tell us how well a forward-looking risk scoring system identifies defaulters as well as non-defaulters.
Data source: Moody’s Analytics
Developing Strategies for Early Warning of
Default Risk
20
» One of the primary use cases for EDF measures is for early warning
of potential credit events.
» Monitoring and early warning are problems of classification: which
firms in a portfolio should be considered relatively more risky, and
therefore merit deeper investigation?
» Moody’s Analytics’ research has identified several useful strategies for
developing early warning signals:
1. Absolute EDF level
2. Relative EDF level
3. EDF change
4. Relative EDF change
5. Slope of PD term structure
The EDF Measure for Hidili Surpassed the Early
Warning Level in Mid-2011 and Stayed On Alert
Strategy 1: EDF Level vs. Warning Level
21
Data source: Moody’s Analytics
Hidili’s EDF Measure Began to Underperform
Its Industry 63 Months Prior To Default
Hidili’s EDF measure broke above the median of its industry peer group
The company’s EDF measure crossed and remained above the 90th percentile of its peer group
The EDF measure for Ansteeltracked the trigger level from 2011 until late 2014. The company's current EDF measure of 1.78% is below the China steel and metal products group's trigger of 5.76%.
Ansteel’s EDF measure has deteriorated to the point that it is worse than over 75% of firms in its industry sector.
Data source: Moody’s Analytics
24
Incorporating Macroeconomic
Variables Into Default Risk
Forecasts
25
EDF Stressed EDF
Unconditional PD (no assumption about the economy) Conditional PD (based on an economic forecast)
The 1-year PD forecast as of today Output is a 60 month time series forecast of the 1-year PD
1 to 10 year term structure; longer available 1-year horizon only
Around 40,000 firms daily, globally 20,000 firms daily in North America, Western Europe, Japan, Australia/NZ, China/HK
EDF and Stressed EDF Measures
Data source: Moody’s Analytics
Stressed EDF Models Are Historically Accurate
Australia & New ZealandChina & Hong Kong
Japan Western Europe North America
In-Sample, Perfect Foresight Median Stressed EDF vs. Median Unconditional EDF
26Data source: Moody’s Analytics
CCAR Simulations Using Stressed EDFs Yielded EL
Rates for Corporate Exposures Very Close to the Fed’s
27
Moody’s Analytics Forecasted C&I Portfolio EL Rates vs. FRB Reported C&I EL Rates
Data Sources: Moody’s Analytics and The Federal Reserve Board
IFRS 9 Compliant PD Models Must Satisfy
Several Requirements
28
(IFRS 9减值计提要求)
Economic Scenarios (GDP)
Probability-Weighted EDF
1
4
Stressed EDF Measures
Probability Density Function (GDP)
2
3
IFRS 9 Scenario-Conditioned, Probability-
Weighted PDs
29
Data Source: Moody’s Analytics
Bank of China Stressed EDFs and IFRS 9
Probability-Weighted PDs
30
%
Data Source: Moody’s Analytics
Summary and Conclusion
31
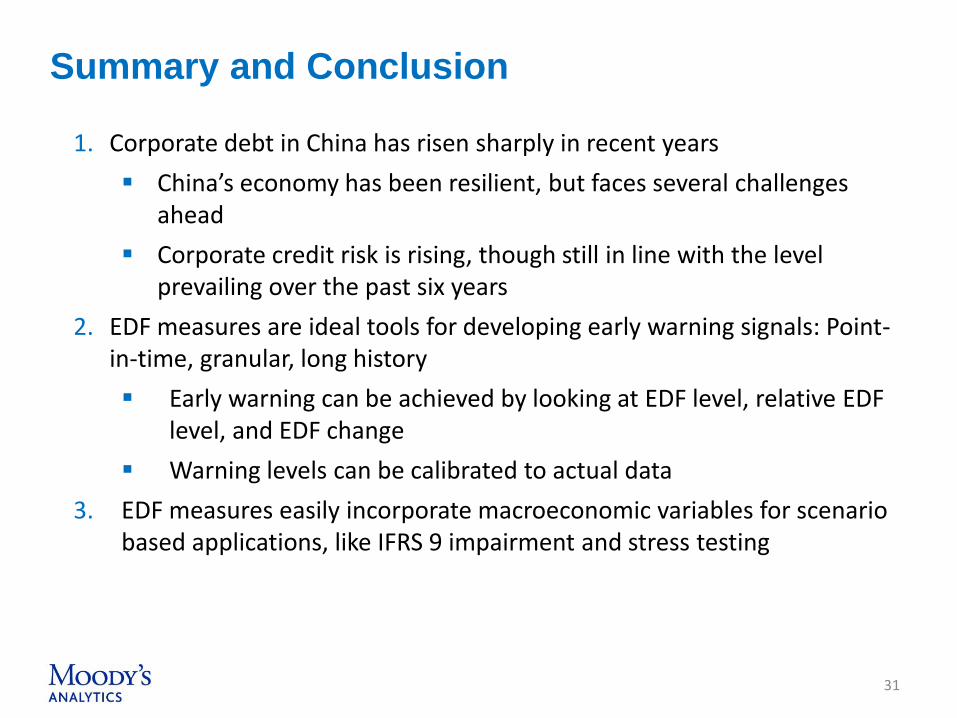
1. Corporate debt in China has risen sharply in recent years
China’s economy has been resilient, but faces several challenges ahead
Corporate credit risk is rising, though still in line with the level prevailing over the past six years
2. EDF measures are ideal tools for developing early warning signals: Point-in-time, granular, long history
Early warning can be achieved by looking at EDF level, relative EDF level, and EDF change
Warning levels can be calibrated to actual data
3. EDF measures easily incorporate macroeconomic variables for scenario based applications, like IFRS 9 impairment and stress testing
Contact Us
32
David Hamilton
Managing DirectorStress Testing and Credit Risk Analytics, Asia Pacific+65 6511 4650 tel+65 9236 1556 [email protected]
Moody’s Analytics6 Shenton Way #14-08OUE Downtown 2Singapore 068809
Glenn Levine
Corporate Stress Testing Model Lead, Capital Markets Research Group+1 212 553-9595 tel+1 646 28077-44 [email protected]
Moody’s Analytics7 World Trade CenterNew York, NY 10007USA
Irina Baron
Quantitative Credit Risk Research Analyst, Capital Markets Research Group+1 212 553-4307 [email protected]
Moody’s Analytics7 World Trade CenterNew York, NY 10007USA
Research Insights
33
From Moody’s Analytics
From Moody’s Investors Service
China Outlook: The Cycle Turns Up, July 2016
Probability-Weighted Outcomes Under IFRS 9: A Macroeconomic Approach, in Moody’s Analytics Risk Perspectives, June 2016
Using EDF Measures to Identify At-Risk Names – A Monitoring & Early Warning Toolkit, April 2016
Spillover from Potential Dislocation in Onshore Bond Market Would Be Limited, August 2016
Authorities Have Tools to Avert Financial Crisis, but Erosion of Credit Quality Likely, June 2016
Estimating US Credit Risk Under the Fed's CCAR 2016 Severely Adverse Scenario, May 2016