28
Analysis, Preparation, and Working to Minimize Impact and Streamline Processes MYRA L WILKERSON, MD Chair of Laboratory Medicine Geisinger Health Danville, PA Preparing for PAMA
Analysis, Preparation, and Working to Minimize Impact and Streamline Processes MYRA L WILKERSON, MD Chair of Laboratory Medicine Geisinger Health Danville, PA
Preparing for PAMA
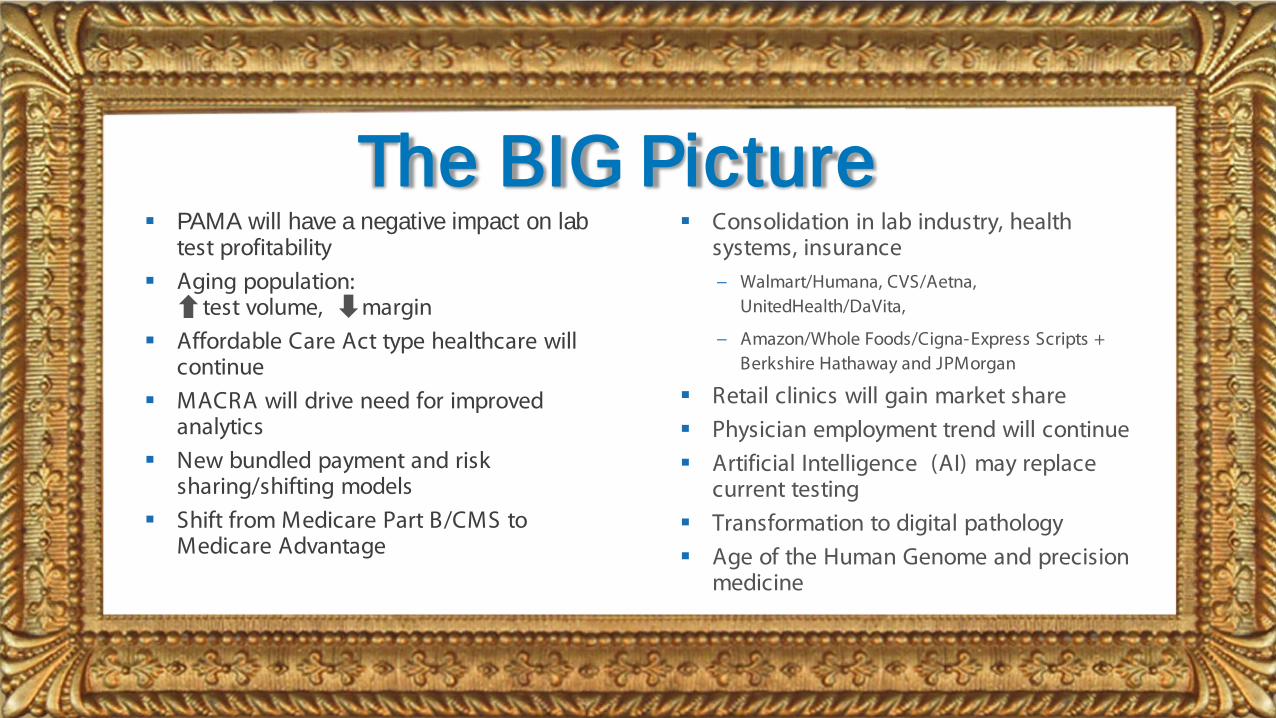
PAMA will have a negative impact on lab test profitability
Aging population: test volume, margin
Affordable Care Act type healthcare will continue
MACRA will drive need for improved analytics
New bundled payment and risk sharing/shifting models
Shift from Medicare Part B/CMS to Medicare Advantage
The BIG Picture
Consolidation in lab industry, health systems, insurance − Walmart/Humana, CVS/Aetna,
UnitedHealth/DaVita,
− Amazon/Whole Foods/Cigna-Express Scripts + Berkshire Hathaway and JPMorgan
Retail clinics will gain market share Physician employment trend will continue Artificial Intelligence (AI) may replace
current testing Transformation to digital pathology Age of the Human Genome and precision
medicine
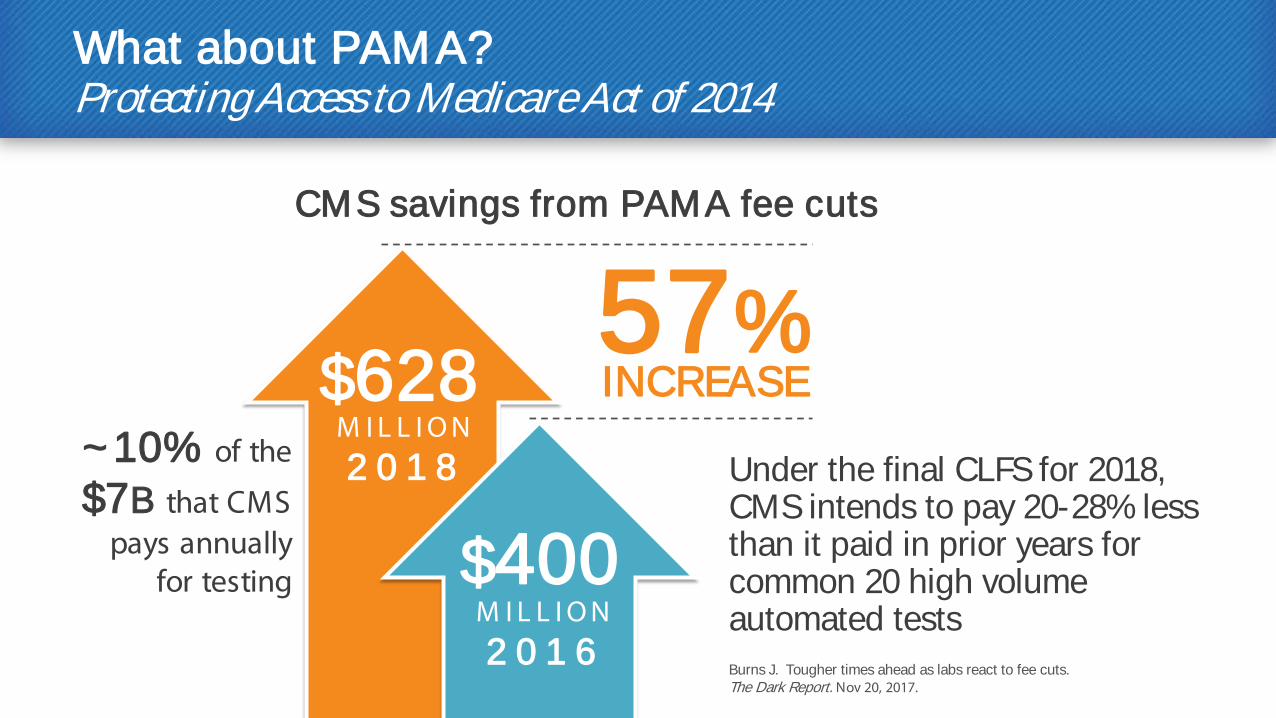
What about PAMA? Protecting Access to Medicare Act of 2014
Under the final CLFS for 2018, CMS intends to pay 20-28% less than it paid in prior years for common 20 high volume automated tests Burns J. Tougher times ahead as labs react to fee cuts. The Dark Report. Nov 20, 2017.
INCREASE 57%
$628 M I L L I O N 2 0 1 8
$400 M I L L I O N 2 0 1 6
CMS savings from PAMA fee cuts
~10% of the
$7B that CMS pays annually
for testing
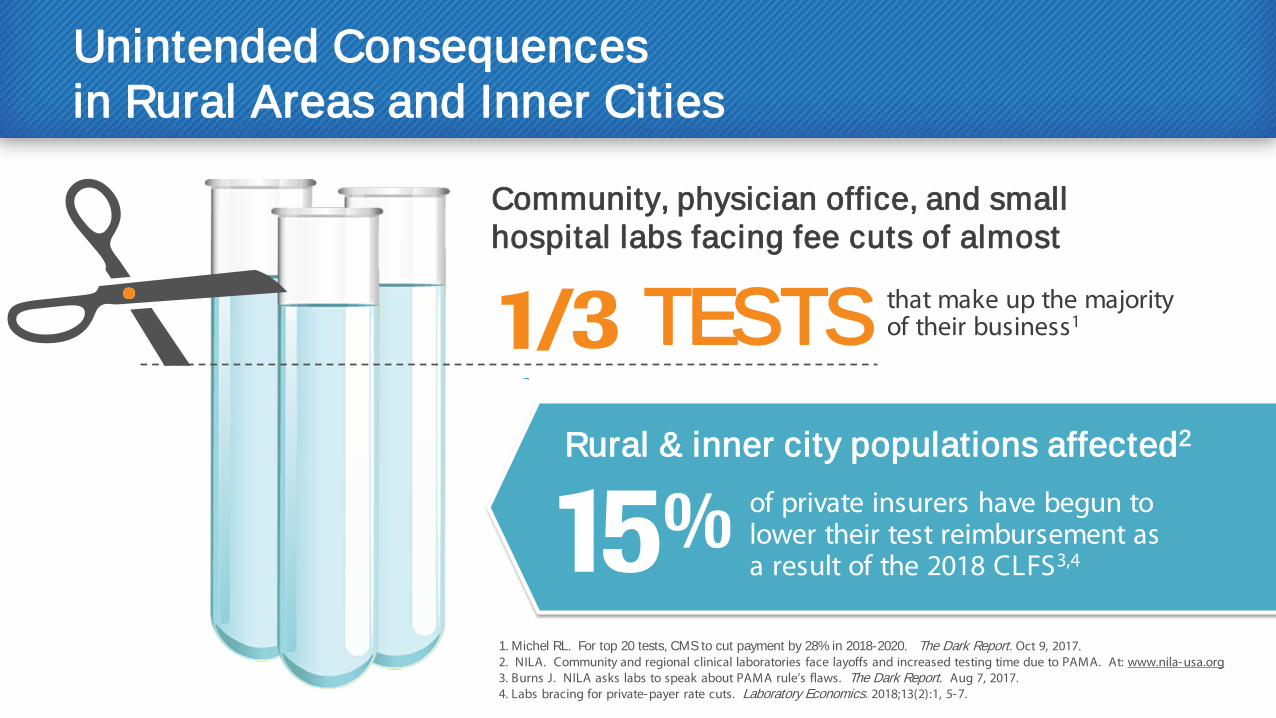
Unintended Consequences in Rural Areas and Inner Cities
1. Michel RL. For top 20 tests, CMS to cut payment by 28% in 2018-2020. The Dark Report. Oct 9, 2017. 2. NILA. Community and regional clinical laboratories face layoffs and increased testing time due to PAMA. At: www.nila-usa.org 3. Burns J. NILA asks labs to speak about PAMA rule’s flaws. The Dark Report. Aug 7, 2017. 4. Labs bracing for private-payer rate cuts. Laboratory Economics. 2018;13(2):1, 5-7.
Rural & inner city populations affected2
Community, physician office, and small hospital labs facing fee cuts of almost
that make up the majority of their business1 TESTS
of private insurers have begun to lower their test reimbursement as a result of the 2018 CLFS3,4
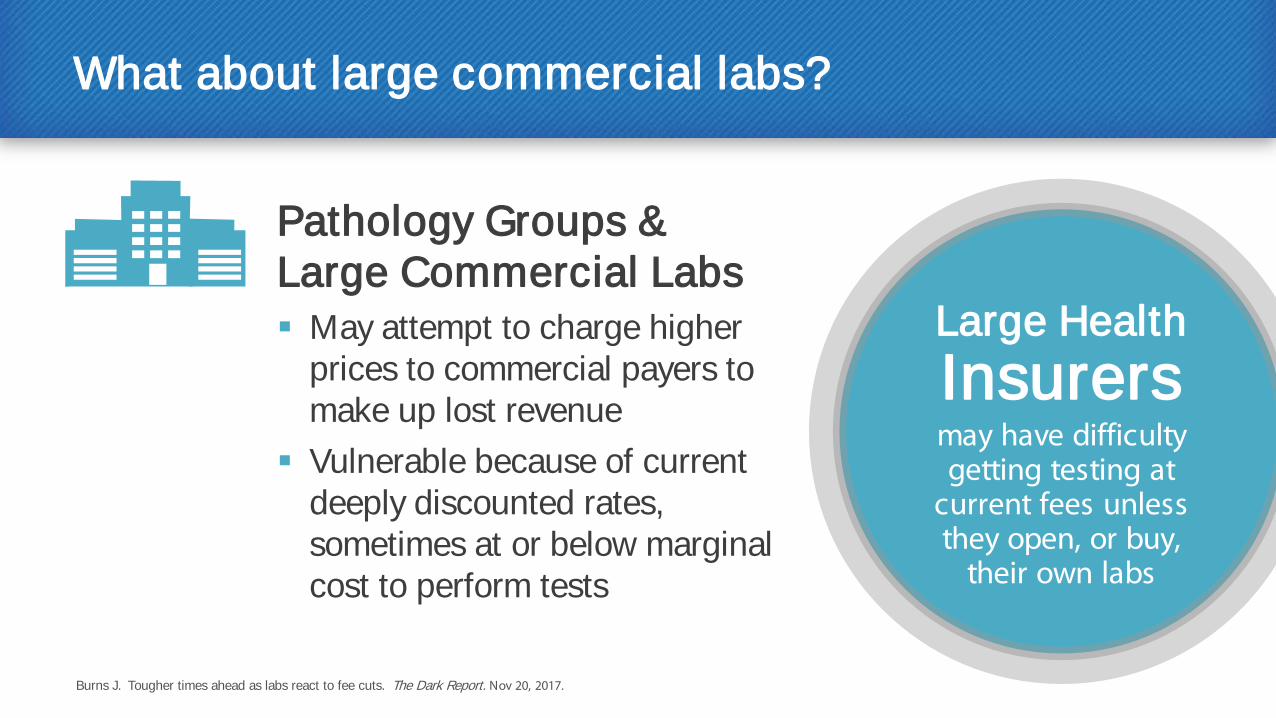
What about large commercial labs?
Pathology Groups & Large Commercial Labs May attempt to charge higher
prices to commercial payers to make up lost revenue
Vulnerable because of current deeply discounted rates, sometimes at or below marginal cost to perform tests
Burns J. Tougher times ahead as labs react to fee cuts. The Dark Report. Nov 20, 2017.
Large Health Insurers may have difficulty getting testing at
current fees unless they open, or buy,
their own labs
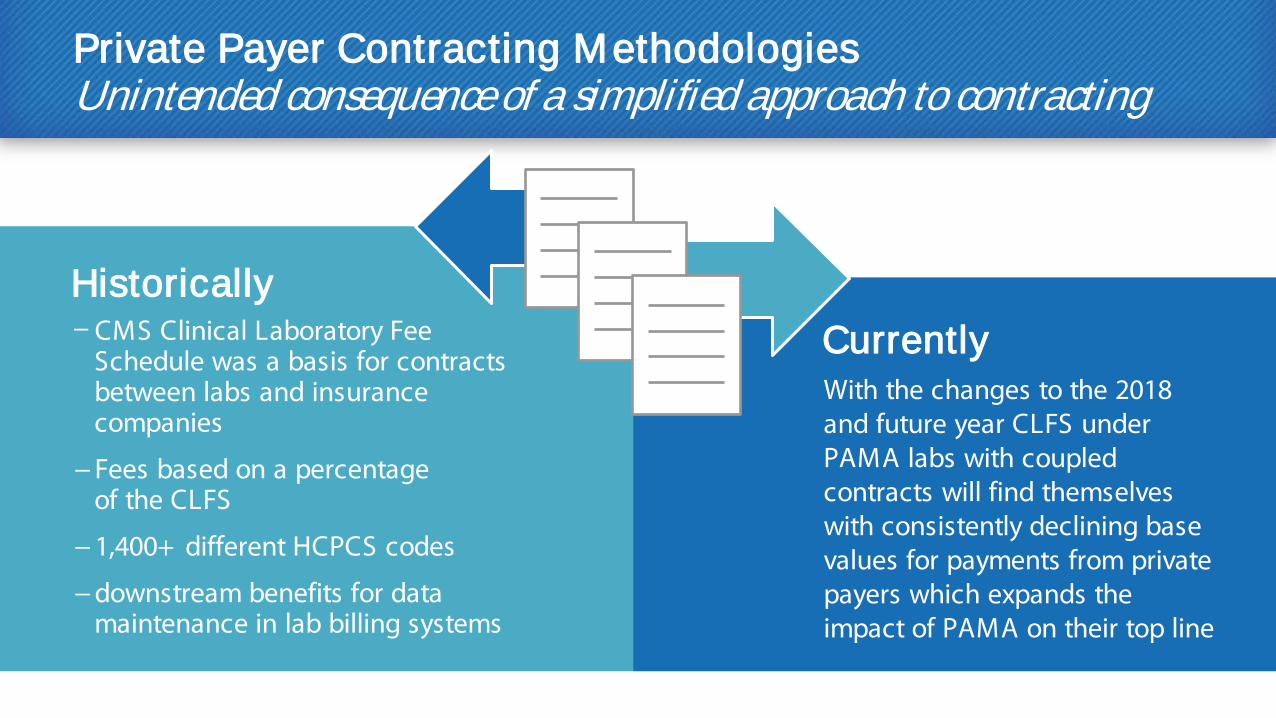
Private Payer Contracting Methodologies Unintended consequence of a simplified approach to contracting
Historically Currently − CMS Clinical Laboratory Fee
Schedule was a basis for contracts between labs and insurance companies
− Fees based on a percentage of the CLFS
− 1,400+ different HCPCS codes
− downstream benefits for data maintenance in lab billing systems
With the changes to the 2018 and future year CLFS under PAMA labs with coupled contracts will find themselves with consistently declining base values for payments from private payers which expands the impact of PAMA on their top line
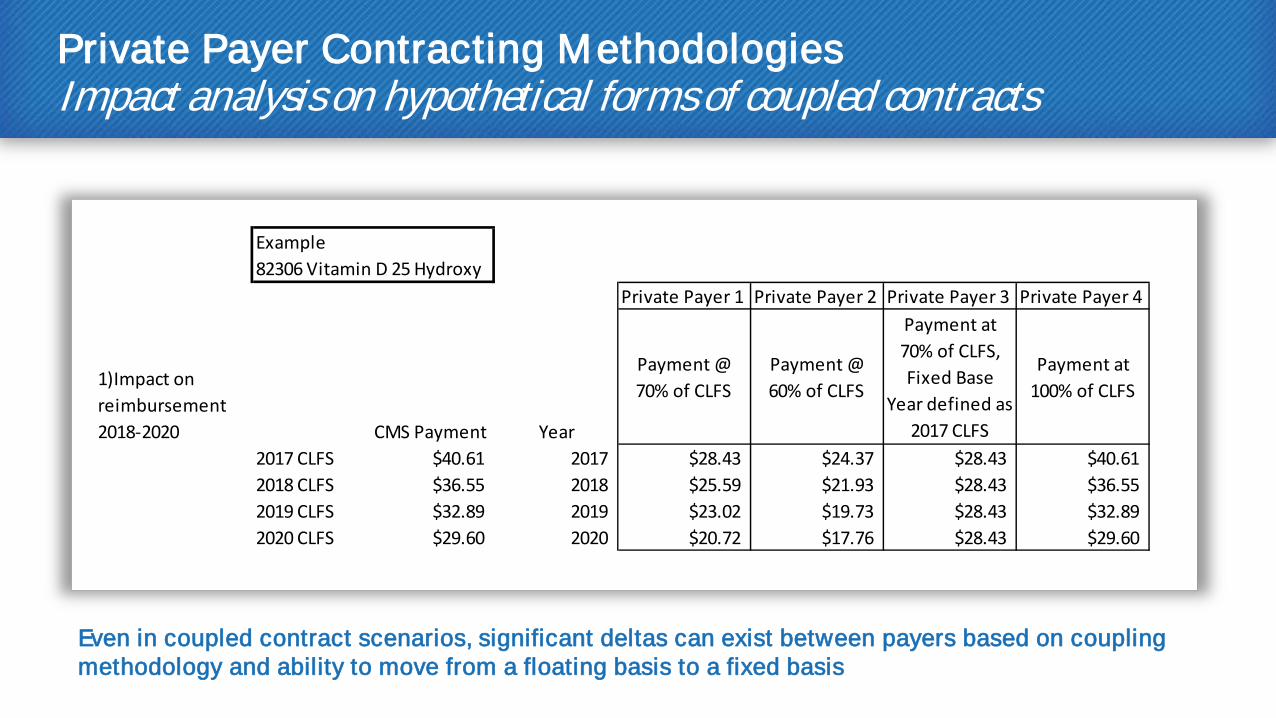
Private Payer Contracting Methodologies Impact analysis on hypothetical forms of coupled contracts
Even in coupled contract scenarios, significant deltas can exist between payers based on coupling methodology and ability to move from a floating basis to a fixed basis
Example82306 Vitamin D 25 Hydroxy
Private Payer 1 Private Payer 2 Private Payer 3 Private Payer 4
1)Impact on reimbursement 2018-2020 CMS Payment Year
Payment @ 70% of CLFS
Payment @ 60% of CLFS
Payment at 70% of CLFS, Fixed Base
Year defined as 2017 CLFS
Payment at 100% of CLFS
2017 CLFS $40.61 2017 $28.43 $24.37 $28.43 $40.612018 CLFS $36.55 2018 $25.59 $21.93 $28.43 $36.552019 CLFS $32.89 2019 $23.02 $19.73 $28.43 $32.892020 CLFS $29.60 2020 $20.72 $17.76 $28.43 $29.60

Private Payer Contracting Methodologies
2) Potential Impact on reimbursement 2021-2023 Private Payer 1 Private Payer 2 Private Payer 3 Private Payer 4
2020 CLFS $29.60 2020 $20.72 $17.76 $28.43 $29.60
CMS will run a second PAMA data collection to determine the CLFS rates for 2021-2023
The more labs participating in the data collection which have remained in coupled contracts with payers as illustrated by Payer 1 & Payer 2, the greater the potential for disparity between CMS rates and "market rates" as determined by the CMS data collection
As a result, the CLFS for 2021-2023 could reflect additional reductions in reimbursement rates
Why action now can drive future sustainability: avoiding the “ Death Spiral”
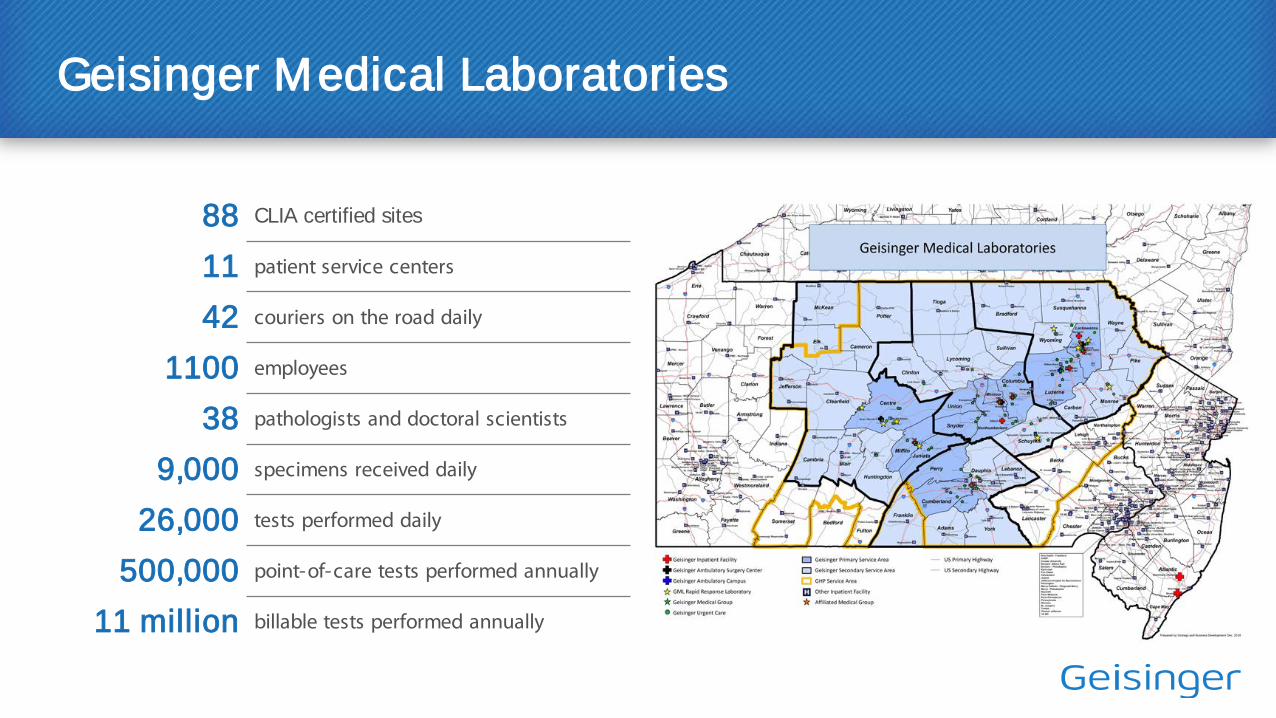
Geisinger Medical Laboratories
88 CLIA certified sites
11 patient service centers
42 couriers on the road daily
1100 employees
38 pathologists and doctoral scientists
9,000 specimens received daily
26,000 tests performed daily
500,000 point-of-care tests performed annually
11 million billable tests performed annually
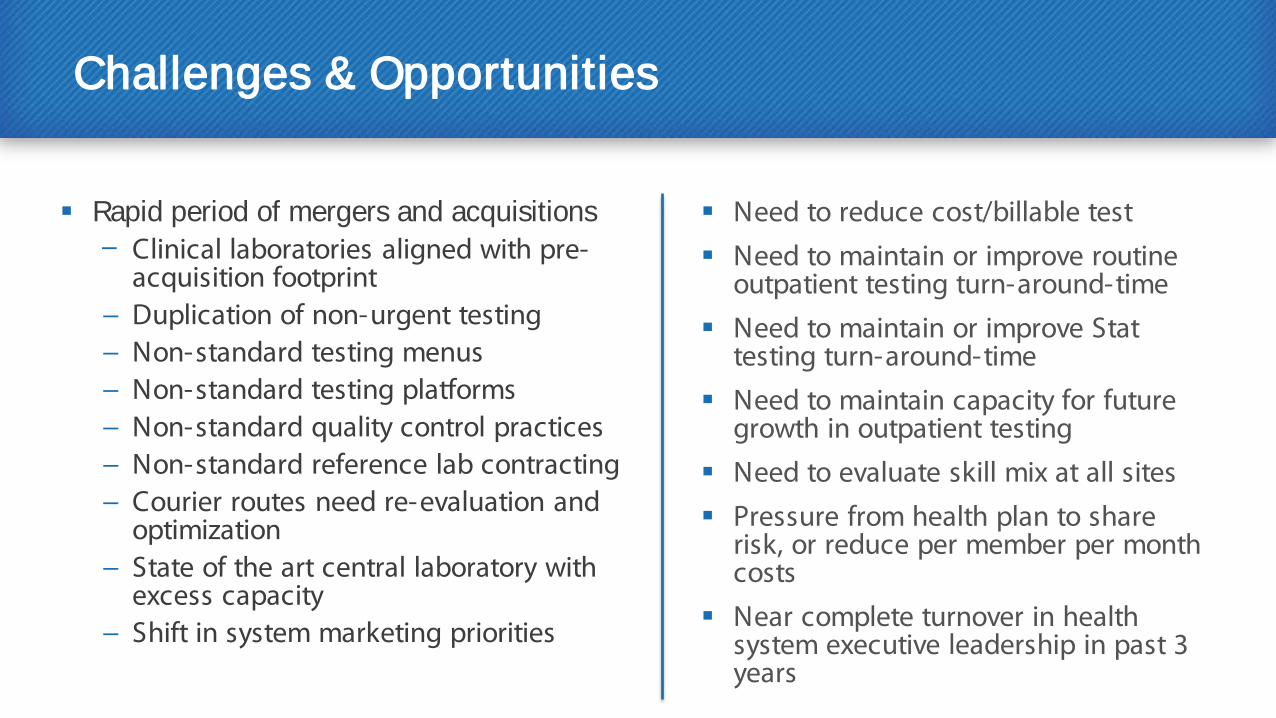
Challenges & Opportunities
Rapid period of mergers and acquisitions − Clinical laboratories aligned with pre-
acquisition footprint − Duplication of non-urgent testing − Non-standard testing menus − Non-standard testing platforms − Non-standard quality control practices − Non-standard reference lab contracting − Courier routes need re-evaluation and
optimization − State of the art central laboratory with
excess capacity − Shift in system marketing priorities
Need to reduce cost/billable test
Need to maintain or improve routine outpatient testing turn-around-time
Need to maintain or improve Stat testing turn-around-time
Need to maintain capacity for future growth in outpatient testing
Need to evaluate skill mix at all sites
Pressure from health plan to share risk, or reduce per member per month costs
Near complete turnover in health system executive leadership in past 3 years
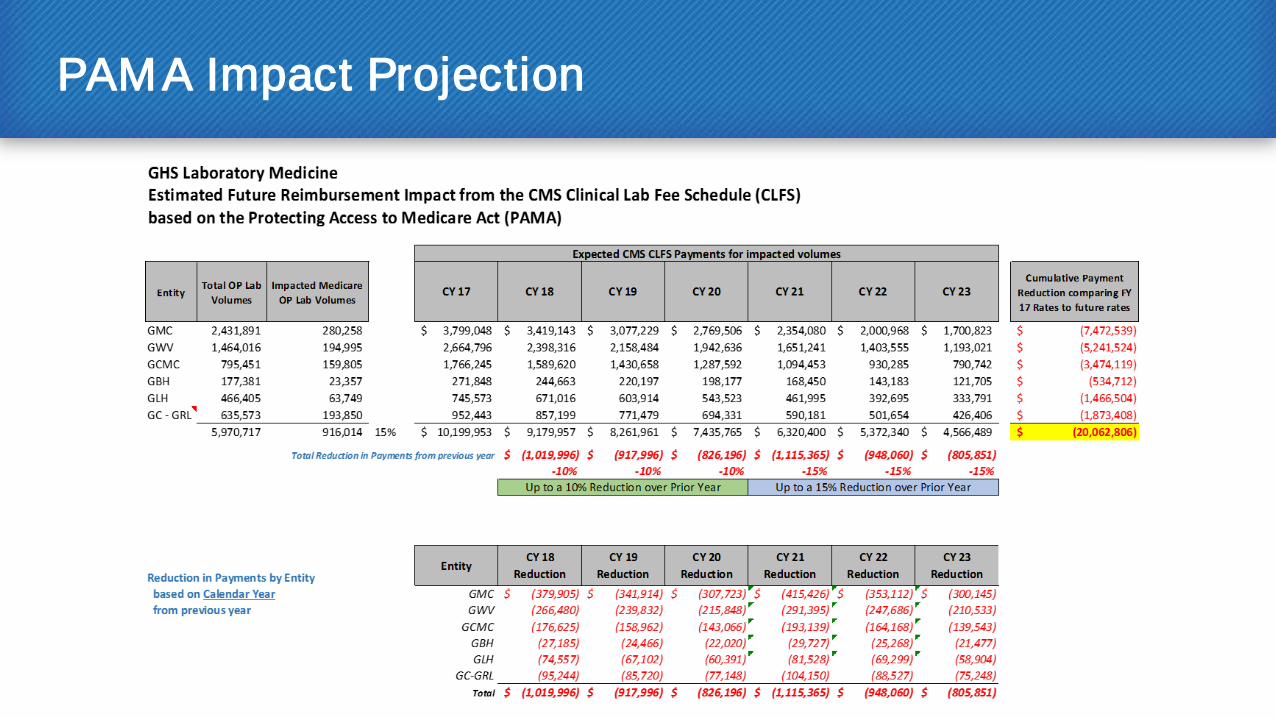
PAMA Impact Projection
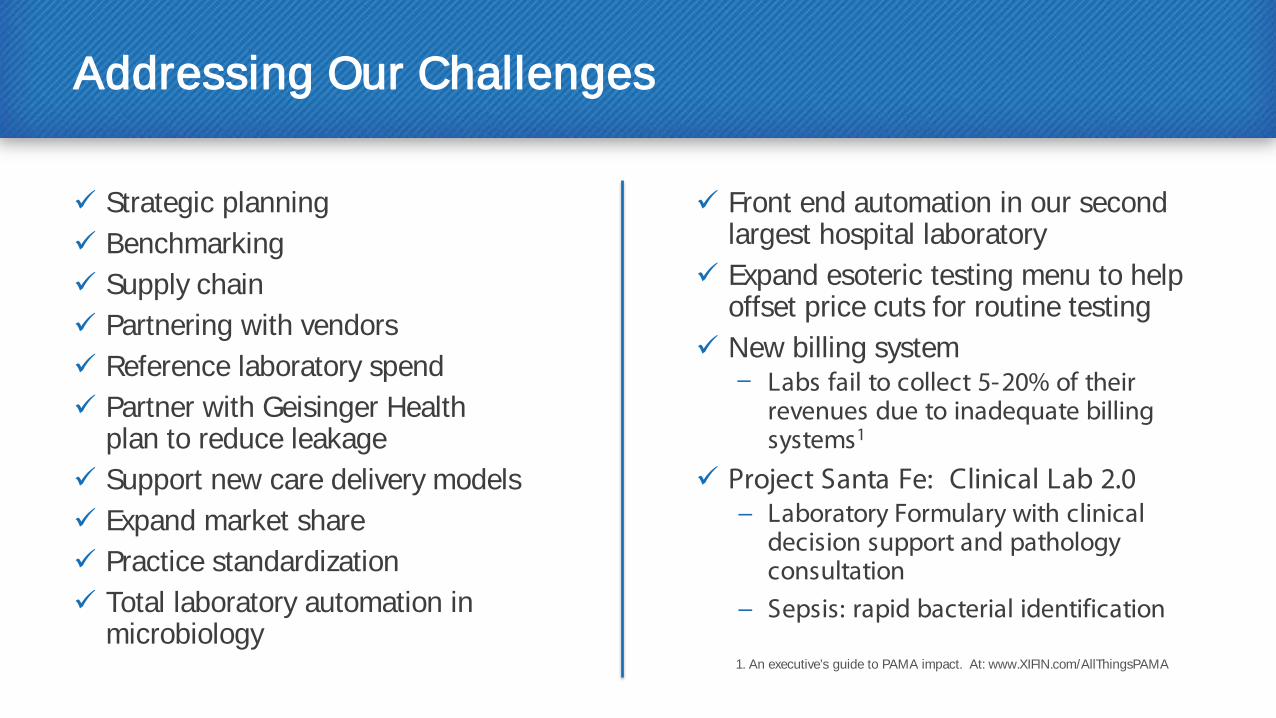
Addressing Our Challenges
Strategic planning Benchmarking Supply chain Partnering with vendors Reference laboratory spend Partner with Geisinger Health
plan to reduce leakage Support new care delivery models Expand market share Practice standardization Total laboratory automation in
microbiology 1. An executive’s guide to PAMA impact. At: www.XIFIN.com/AllThingsPAMA
Front end automation in our second largest hospital laboratory
Expand esoteric testing menu to help offset price cuts for routine testing
New billing system − Labs fail to collect 5-20% of their
revenues due to inadequate billing systems1
Project Santa Fe: Clinical Lab 2.0 − Laboratory Formulary with clinical
decision support and pathology consultation
− Sepsis: rapid bacterial identification
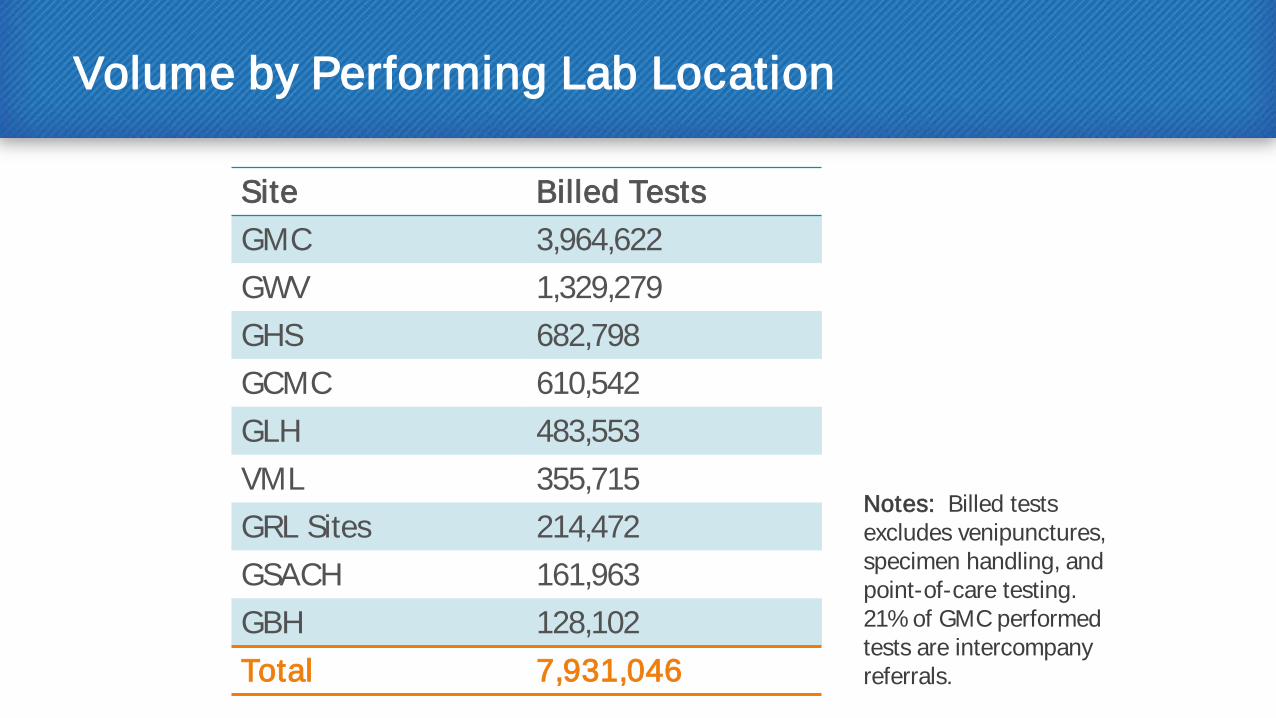
Volume by Performing Lab Location
Site Billed Tests GMC 3,964,622 GWV 1,329,279 GHS 682,798 GCMC 610,542 GLH 483,553 VML 355,715 GRL Sites 214,472 GSACH 161,963 GBH 128,102 Total 7,931,046
Notes: Billed tests excludes venipunctures, specimen handling, and point-of-care testing. 21% of GMC performed tests are intercompany referrals.
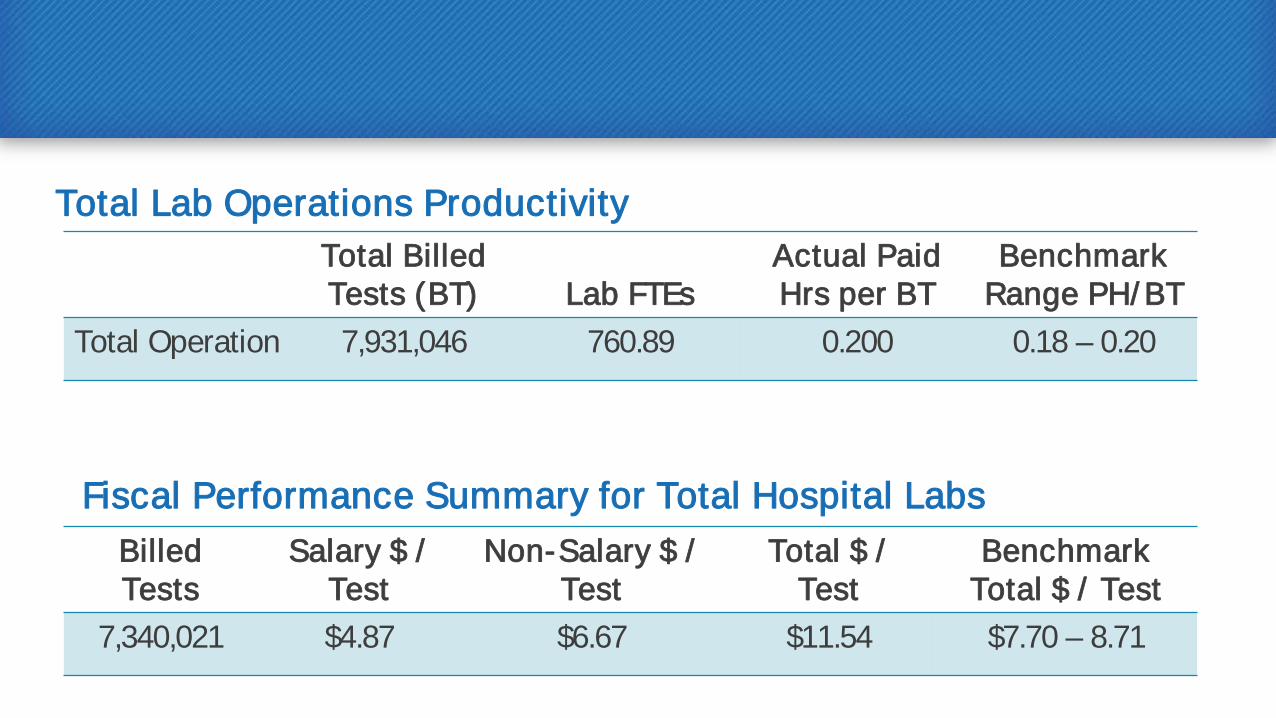
Total Lab Operations Productivity Total Billed Tests (BT) Lab FTEs
Actual Paid Hrs per BT
Benchmark Range PH/ BT
Total Operation 7,931,046 760.89 0.200 0.18 – 0.20
Fiscal Performance Summary for Total Hospital Labs Billed Tests
Salary $ / Test
Non-Salary $ / Test
Total $ / Test
Benchmark Total $ / Test
7,340,021 $4.87 $6.67 $11.54 $7.70 – 8.71
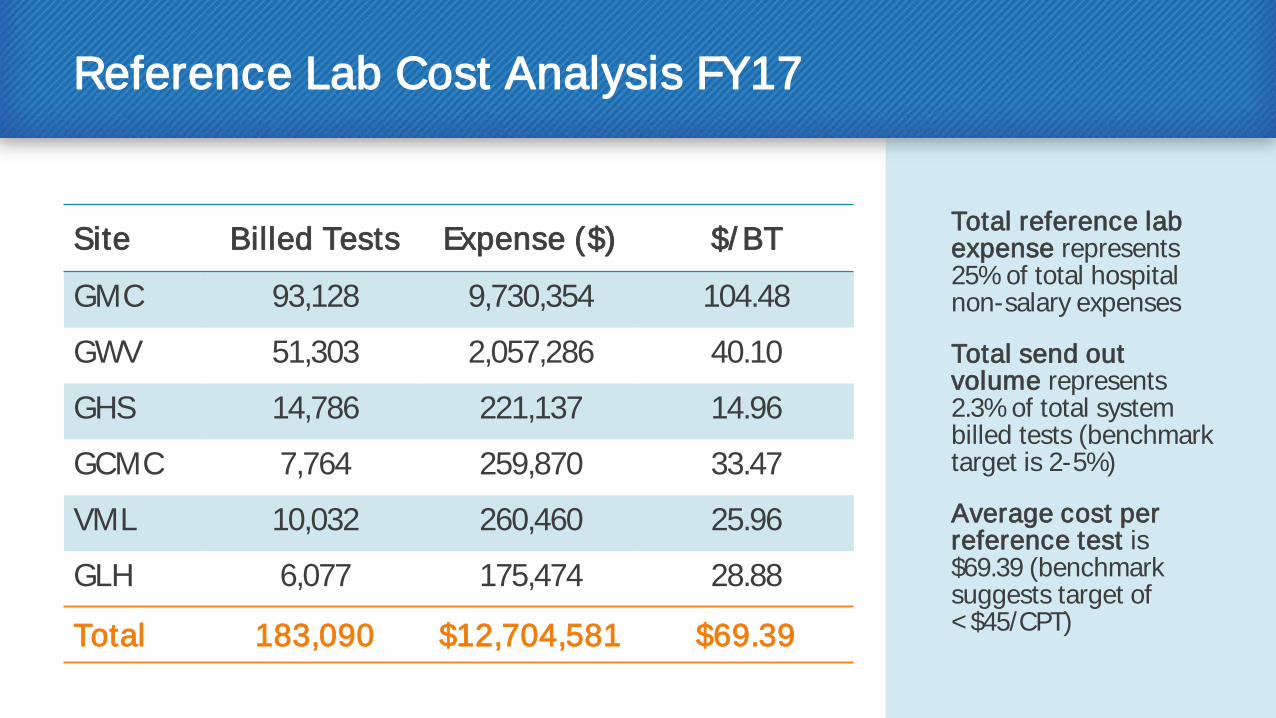
Reference Lab Cost Analysis FY17
Site Billed Tests Expense ($) $/ BT
GMC 93,128 9,730,354 104.48
GWV 51,303 2,057,286 40.10
GHS 14,786 221,137 14.96
GCMC 7,764 259,870 33.47
VML 10,032 260,460 25.96
GLH 6,077 175,474 28.88
Total 183,090 $12,704,581 $69.39
Total reference lab expense represents 25% of total hospital non-salary expenses
Total send out volume represents 2.3% of total system billed tests (benchmark target is 2-5%)
Average cost per reference test is $69.39 (benchmark suggests target of < $45/CPT)
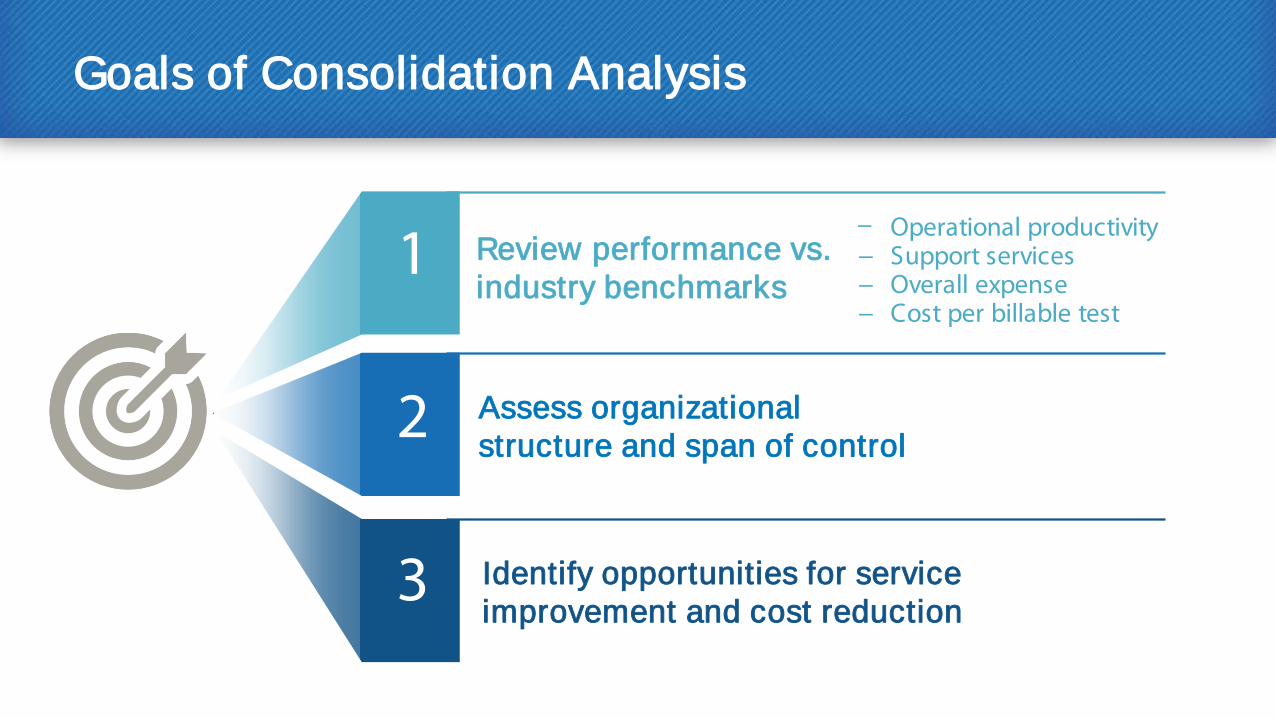
Goals of Consolidation Analysis
− Operational productivity − Support services − Overall expense − Cost per billable test
1
2
3 Identify opportunities for service improvement and cost reduction
Assess organizational structure and span of control
Review performance vs. industry benchmarks
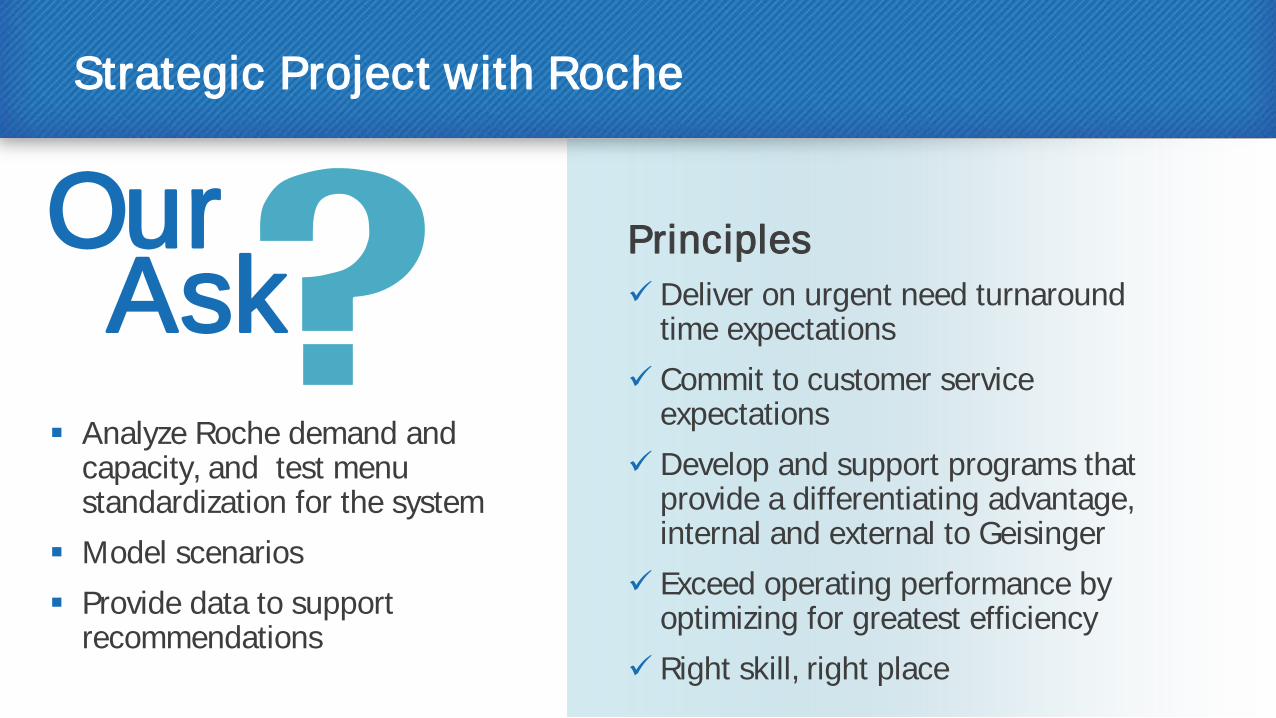
Strategic Project with Roche
Analyze Roche demand and capacity, and test menu standardization for the system
Model scenarios Provide data to support
recommendations
Principles Deliver on urgent need turnaround
time expectations Commit to customer service
expectations Develop and support programs that
provide a differentiating advantage, internal and external to Geisinger
Exceed operating performance by optimizing for greatest efficiency
Right skill, right place
Our Ask
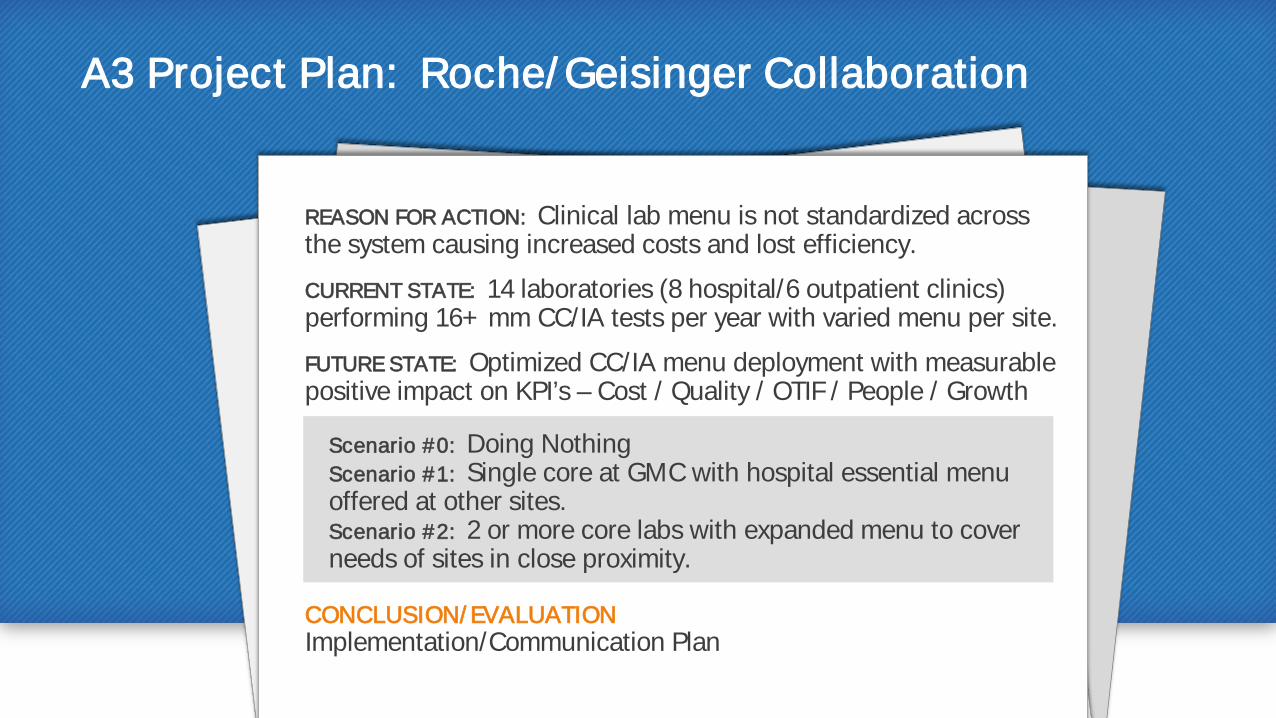
A3 Project Plan: Roche/ Geisinger Collaboration
REASON FOR ACTION: Clinical lab menu is not standardized across the system causing increased costs and lost efficiency.
CURRENT STATE: 14 laboratories (8 hospital/6 outpatient clinics) performing 16+ mm CC/IA tests per year with varied menu per site.
FUTURE STATE: Optimized CC/IA menu deployment with measurable positive impact on KPI’s – Cost / Quality / OTIF / People / Growth
Scenario #0: Doing Nothing Scenario #1: Single core at GMC with hospital essential menu offered at other sites. Scenario #2: 2 or more core labs with expanded menu to cover needs of sites in close proximity.
CONCLUSION/ EVALUATION Implementation/Communication Plan
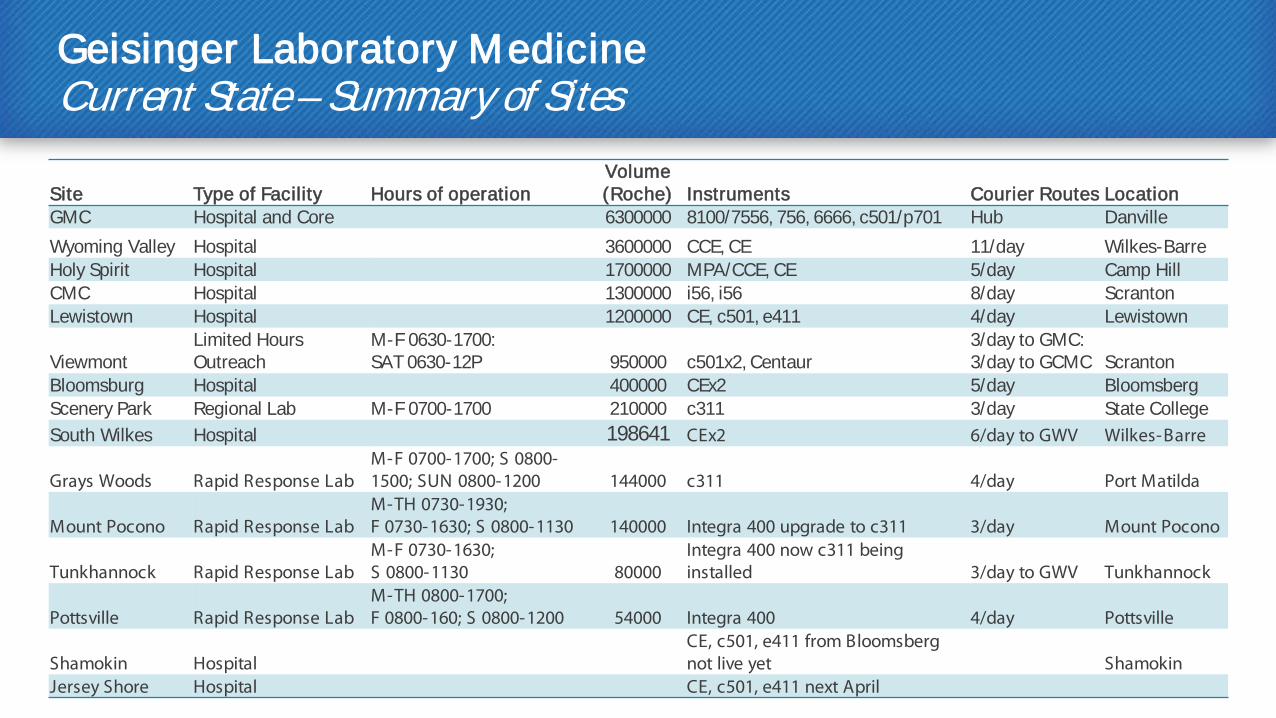
Geisinger Laboratory Medicine Current State – Summary of Sites
Site Type of Facility Hours of operation Volume (Roche) Instruments Courier Routes Location
GMC Hospital and Core 6300000 8100/7556, 756, 6666, c501/p701 Hub Danville Wyoming Valley Hospital 3600000 CCE, CE 11/day Wilkes-Barre Holy Spirit Hospital 1700000 MPA/CCE, CE 5/day Camp Hill CMC Hospital 1300000 i56, i56 8/day Scranton Lewistown Hospital 1200000 CE, c501, e411 4/day Lewistown
Viewmont Limited Hours Outreach
M-F 0630-1700: SAT 0630-12P 950000 c501x2, Centaur
3/day to GMC: 3/day to GCMC Scranton
Bloomsburg Hospital 400000 CEx2 5/day Bloomsberg Scenery Park Regional Lab M-F 0700-1700 210000 c311 3/day State College South Wilkes Hospital 198641 CEx2 6/day to GWV Wilkes-Barre
Grays Woods Rapid Response Lab M-F 0700-1700; S 0800-1500; SUN 0800-1200 144000 c311 4/day Port Matilda
Mount Pocono Rapid Response Lab M-TH 0730-1930; F 0730-1630; S 0800-1130 140000 Integra 400 upgrade to c311 3/day Mount Pocono
Tunkhannock Rapid Response Lab M-F 0730-1630; S 0800-1130 80000
Integra 400 now c311 being installed 3/day to GWV Tunkhannock
Pottsville Rapid Response Lab M-TH 0800-1700; F 0800-160; S 0800-1200 54000 Integra 400 4/day Pottsville
Shamokin Hospital CE, c501, e411 from Bloomsberg not live yet Shamokin
Jersey Shore Hospital CE, c501, e411 next April

0
500
1000
1500
2000
2500
3000
3500
4000
Num
ber o
f Tes
tsDemand vs Capacity Integrated 8000 Lines
GMC Core Lab Clinical Chemistry/ Immunoassay (CC/ IA) Capacity
100% Capacity – 3,710 tests/ hour
Current Peak Demand – 1,600 tests/ hour
Demand vs Capacity Integrated 8000 Lines N
umbe
r of T
ests
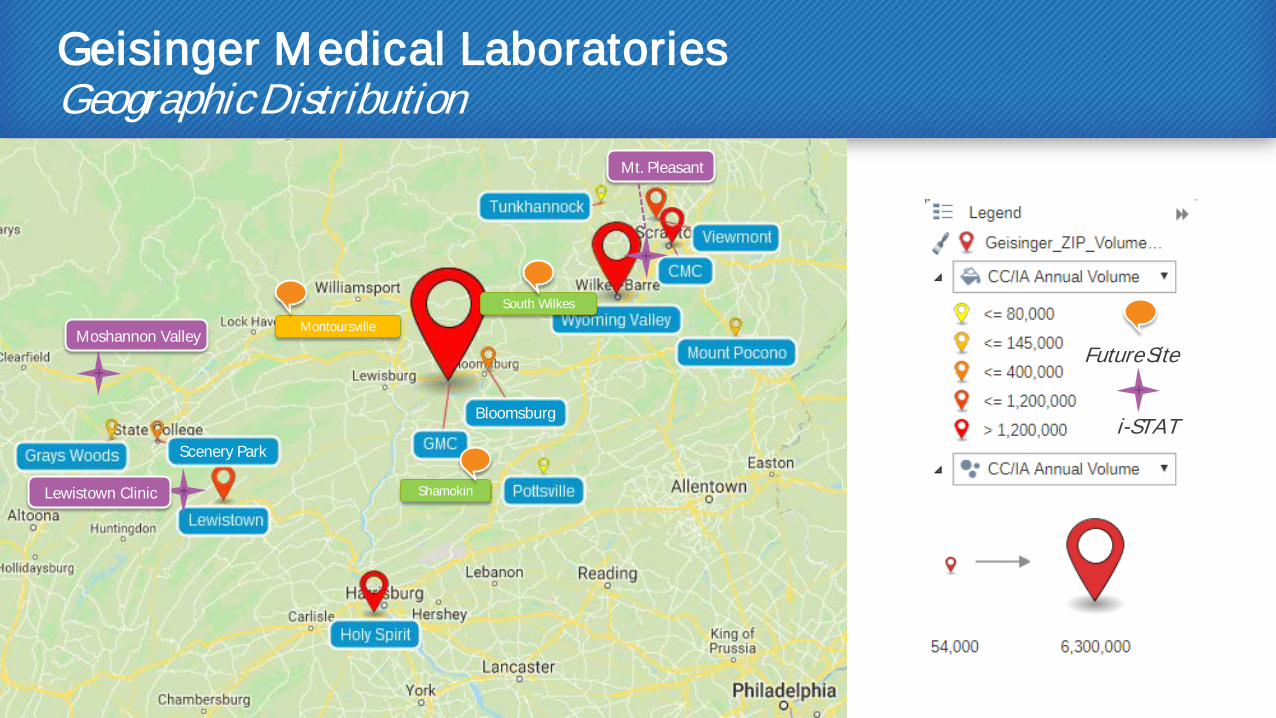
Geisinger Medical Laboratories Geographic Distribution
Future Site
i-STAT
Shamokin
South Wilkes
Montoursville Moshannon Valley
Scenery Park
Bloomsburg
Lewistown Clinic
Mt. Pleasant
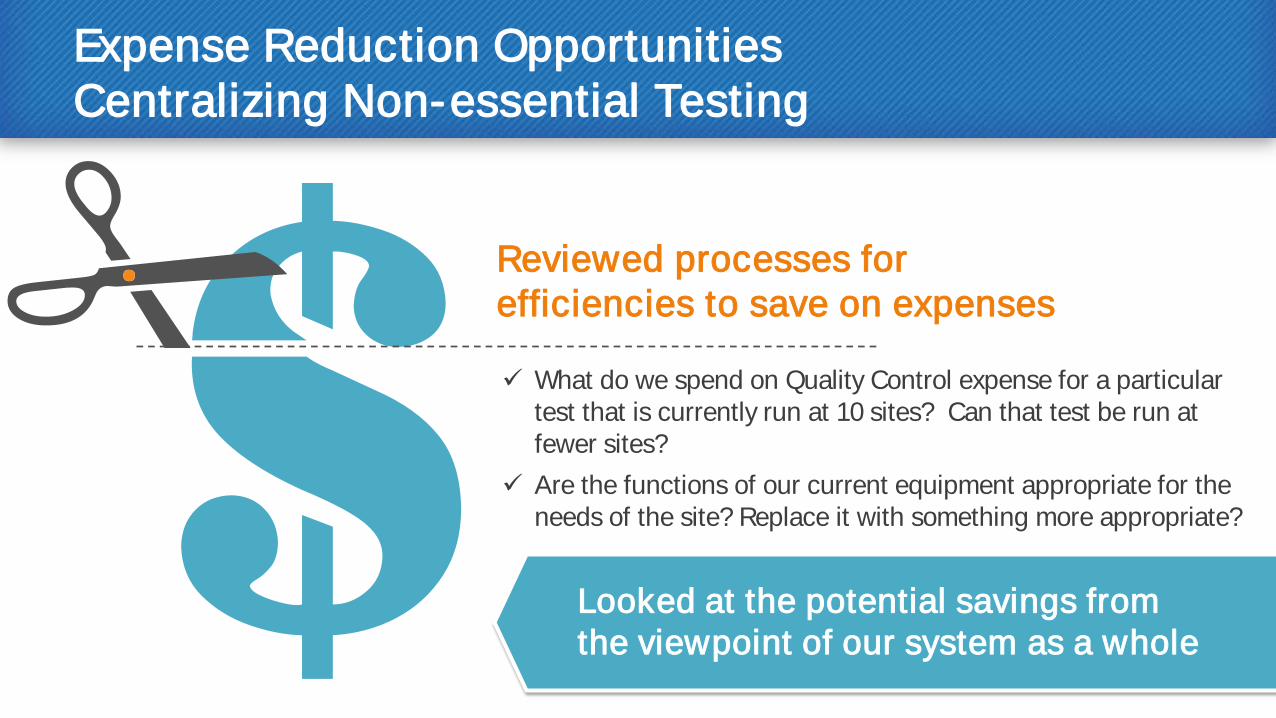
Expense Reduction Opportunities Centralizing Non-essential Testing
What do we spend on Quality Control expense for a particular test that is currently run at 10 sites? Can that test be run at fewer sites?
Are the functions of our current equipment appropriate for the needs of the site? Replace it with something more appropriate?
Looked at the potential savings from
the viewpoint of our system as a whole
Reviewed processes for efficiencies to save on expenses
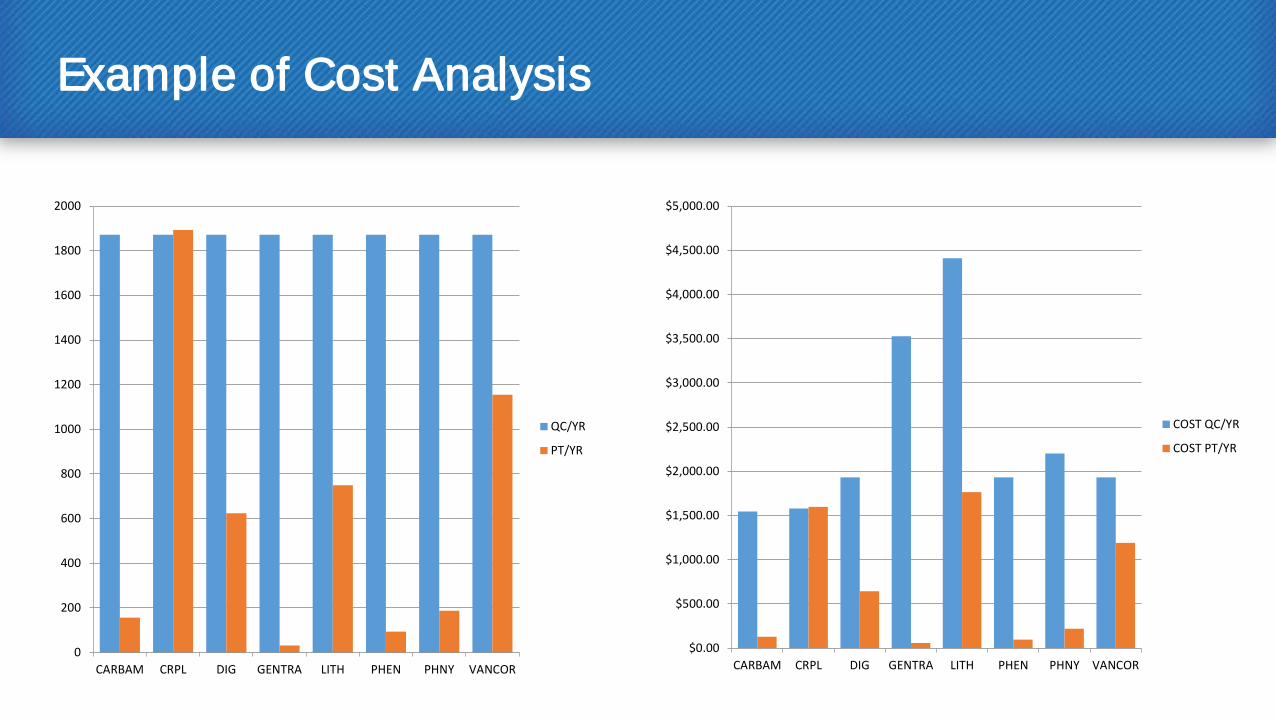
Example of Cost Analysis
0
200
400
600
800
1000
1200
1400
1600
1800
2000
CARBAM CRPL DIG GENTRA LITH PHEN PHNY VANCOR
QC/YR
PT/YR
$0.00
$500.00
$1,000.00
$1,500.00
$2,000.00
$2,500.00
$3,000.00
$3,500.00
$4,000.00
$4,500.00
$5,000.00
CARBAM CRPL DIG GENTRA LITH PHEN PHNY VANCOR
COST QC/YR
COST PT/YR
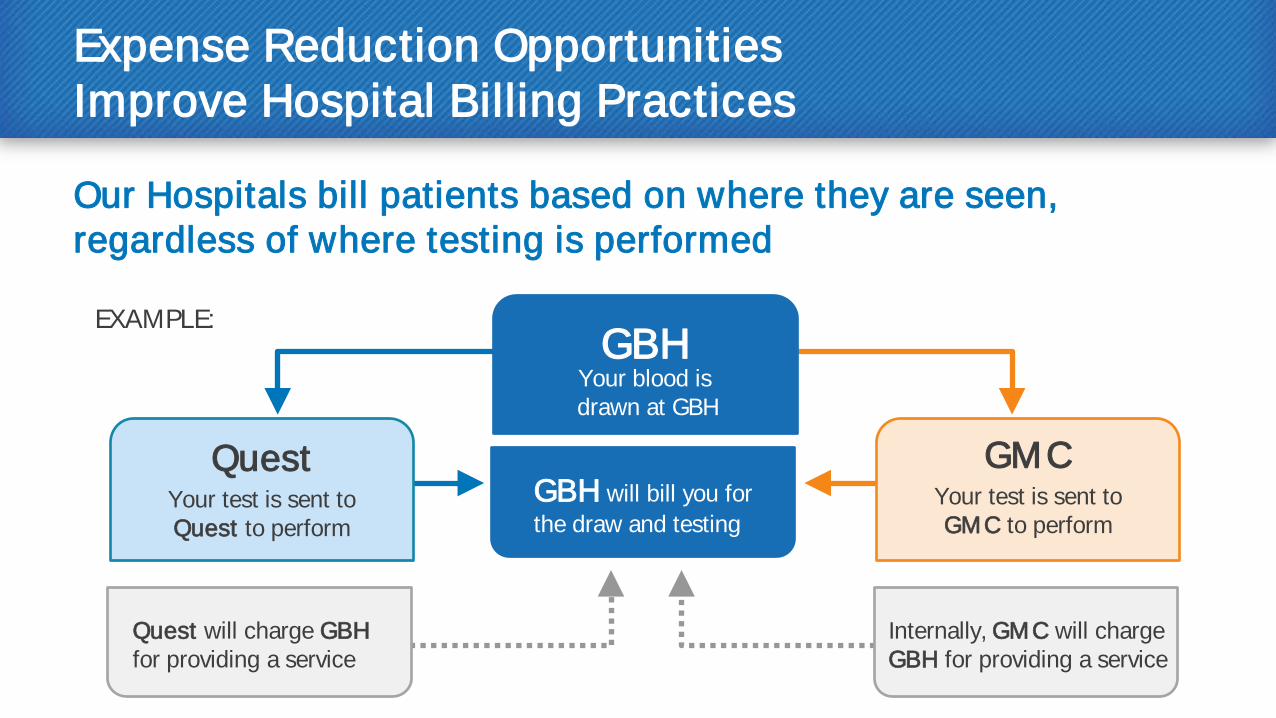
Expense Reduction Opportunities Improve Hospital Billing Practices
Our Hospitals bill patients based on where they are seen, regardless of where testing is performed EXAMPLE:
Your test is sent to Quest to perform
Your test is sent to GMC to perform
GBH will bill you for the draw and testing
Quest will charge GBH for providing a service
Internally, GMC will charge GBH for providing a service
Quest GMC
GBH Your blood is drawn at GBH
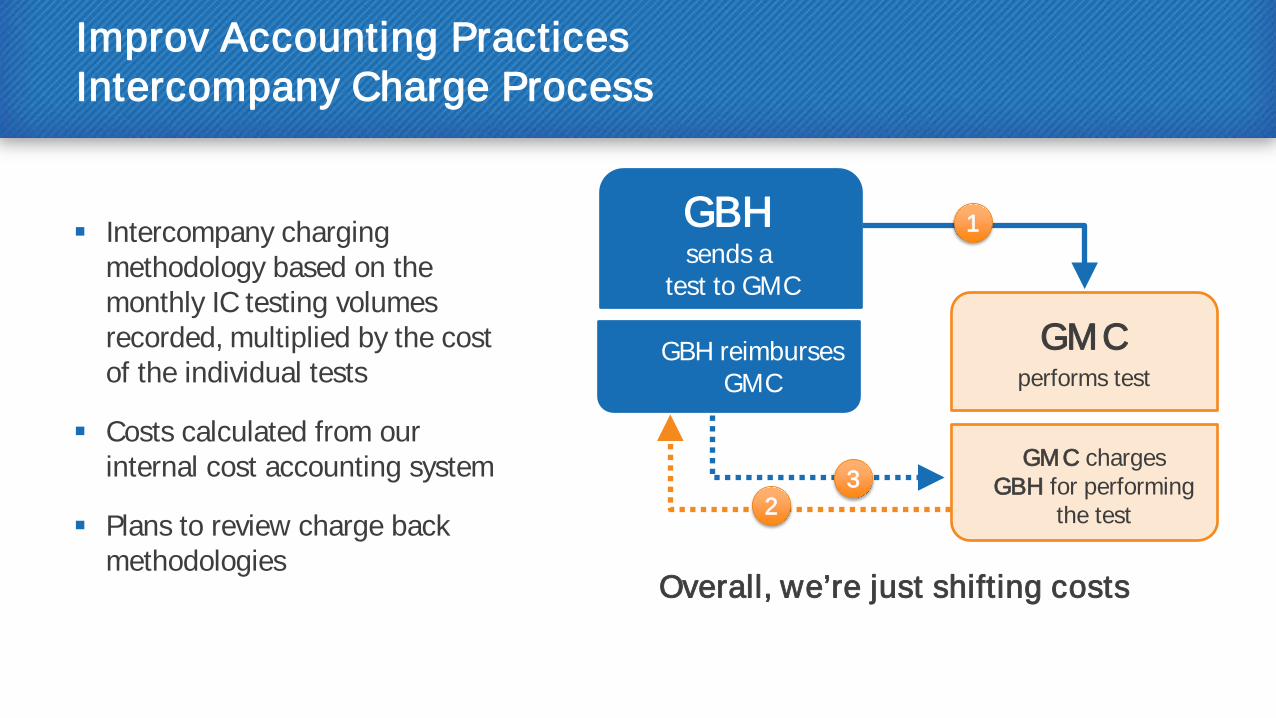
Improv Accounting Practices Intercompany Charge Process
Intercompany charging methodology based on the monthly IC testing volumes recorded, multiplied by the cost of the individual tests
Costs calculated from our internal cost accounting system
Plans to review charge back methodologies
Overall, we’re just shifting costs
performs test GBH reimburses
GMC
GMC charges GBH for performing
the test
GMC
GBH sends a
test to GMC
3
1
2
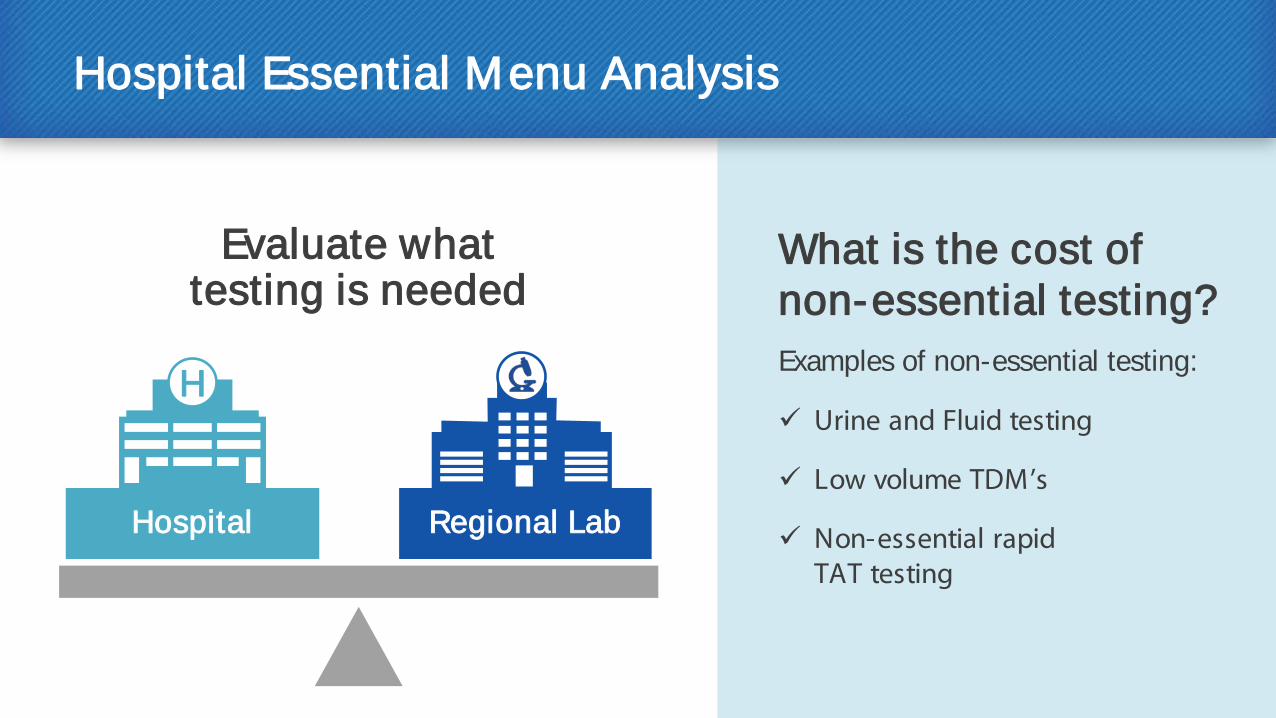
Hospital Essential Menu Analysis
Evaluate what testing is needed
Examples of non-essential testing:
Urine and Fluid testing
Low volume TDM’s
Non-essential rapid TAT testing
Regional Lab Hospital
What is the cost of non-essential testing?
H
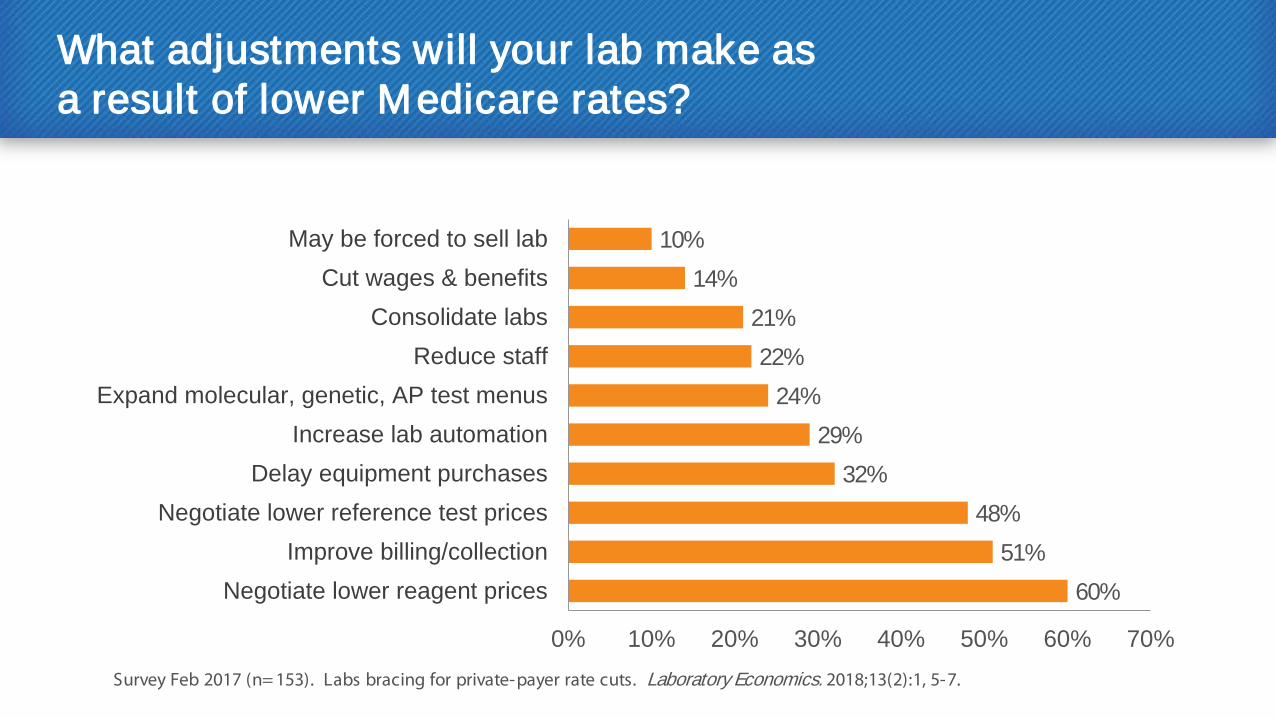
What adjustments will your lab make as a result of lower Medicare rates?
60% 51%
48% 32%
29% 24%
22% 21%
14% 10%
0% 10% 20% 30% 40% 50% 60% 70%
Negotiate lower reagent pricesImprove billing/collection
Negotiate lower reference test pricesDelay equipment purchases
Increase lab automationExpand molecular, genetic, AP test menus
Reduce staffConsolidate labs
Cut wages & benefitsMay be forced to sell lab
Survey Feb 2017 (n= 153). Labs bracing for private-payer rate cuts. Laboratory Economics. 2018;13(2):1, 5-7.
Acknowledgements for Providing Data
Roche Diagnostics Tracy Steffen
Jason Jackson
Ray O’Donnell
Applied Management Systems Paul Camara Sharon Brommer


