33
Preparing the Systems Proposal CIS458
| Date post: | 14-Dec-2015 |
| Category: |
Documents |
| Upload: | wilson-alfrey |
| View: | 216 times |
| Download: | 0 times |

Preparing the Systems Proposal
CIS458
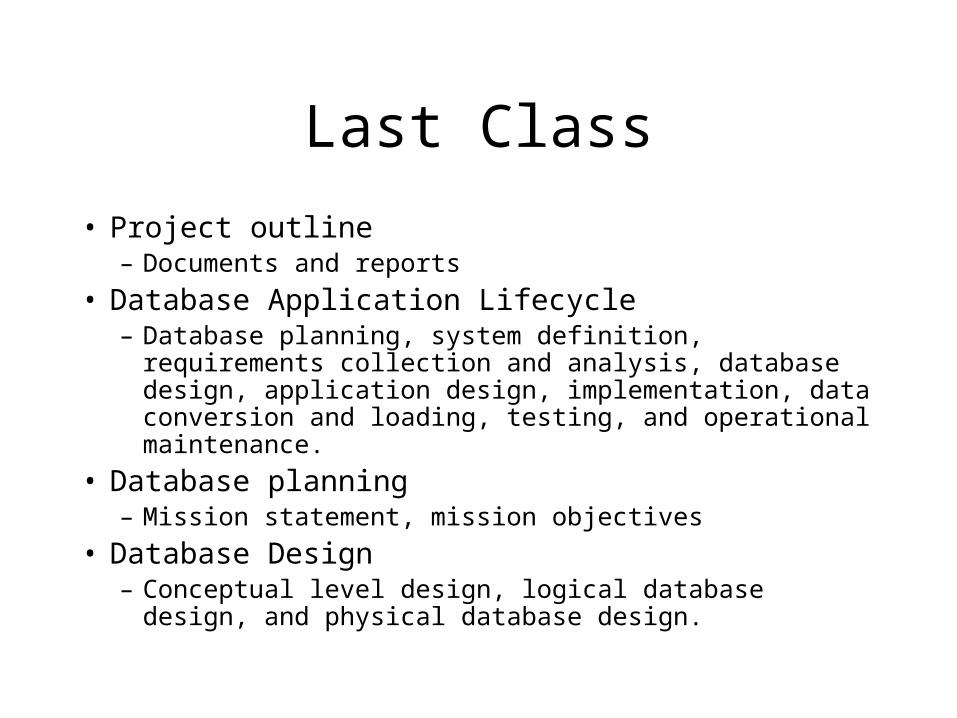
Last Class
• Project outline– Documents and reports
• Database Application Lifecycle– Database planning, system definition, requirements collection
and analysis, database design, application design, implementation, data conversion and loading, testing, and operational maintenance.
• Database planning – Mission statement, mission objectives
• Database Design– Conceptual level design, logical database design, and physical
database design.

Today
• Identifying and Forecasting Costs and Benefits
• Analysis– Feasibility analysis– How to prepare the charts (break even, payback)
• Tips for the report #1.– Recommendation

Database Application Lifecycle
• Database planning
• System definition
• Requirements collection and analysis
• Database design (conceptual, logical and
physical)
• DBMS selection (optional)
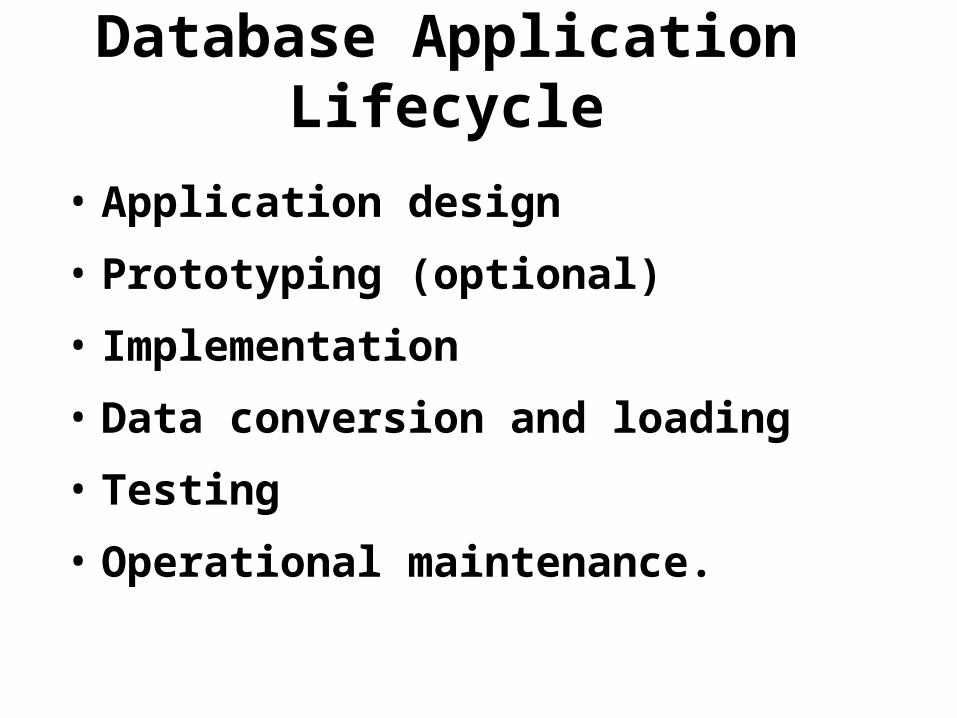
Database Application Lifecycle
• Application design
• Prototyping (optional)
• Implementation
• Data conversion and loading
• Testing
• Operational maintenance.

Database SystemCustomer
DB Developer
Fact Finding
Design
Implementation

Fact Finding
• Interview– Interview structure
• Questionnaire
• Observation
• Research
• Data format, procedures, etc.
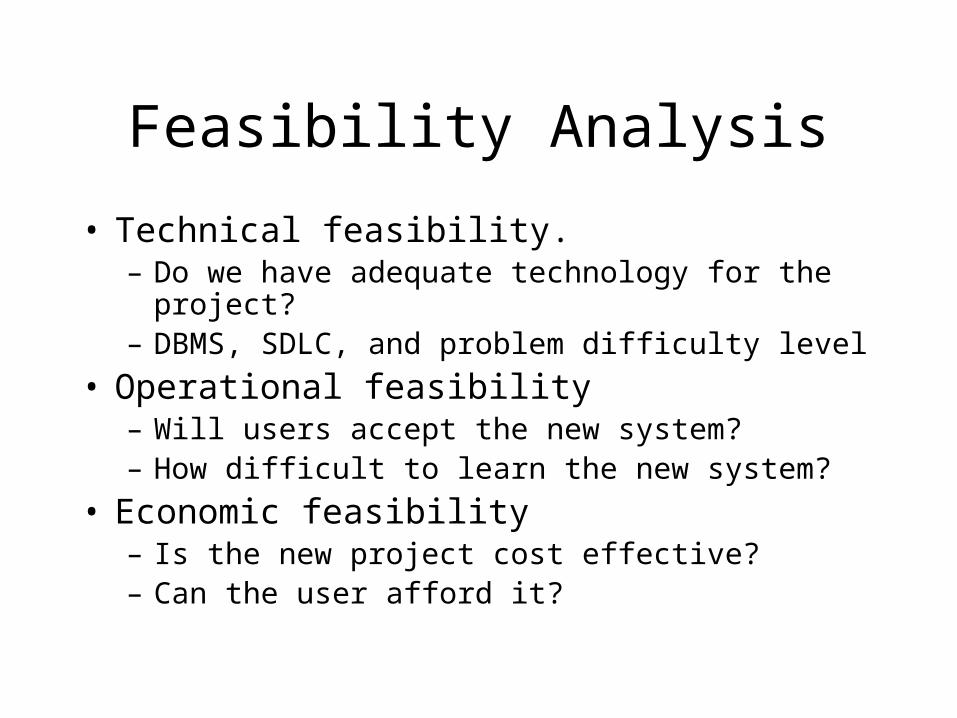
Feasibility Analysis
• Technical feasibility.– Do we have adequate technology for the project?– DBMS, SDLC, and problem difficulty level
• Operational feasibility– Will users accept the new system?– How difficult to learn the new system?
• Economic feasibility– Is the new project cost effective?– Can the user afford it?

Business forecast
Estimation of costs and benefits

Identifying and Forecasting Costs and Benefits
• Costs and benefits– Interrelated and interdependent
• Forecasting costs and benefits– Predict certain key variables
• What-if analysis (credible, meaningful, valuable)
– Forecasting models: require historic data• Estimates from the sales force• Surveys to estimate customer demand• Scenarios or historical analogies

Forecasting with Historical Data
• Conditional forecast– There is an association between variables
• Correlation, Regression, Leading indicators
• Econometrics, Input output models
• Unconditional forecast– There is no need to identify any causal
relationship• Graphical judgment, moving averages, time series
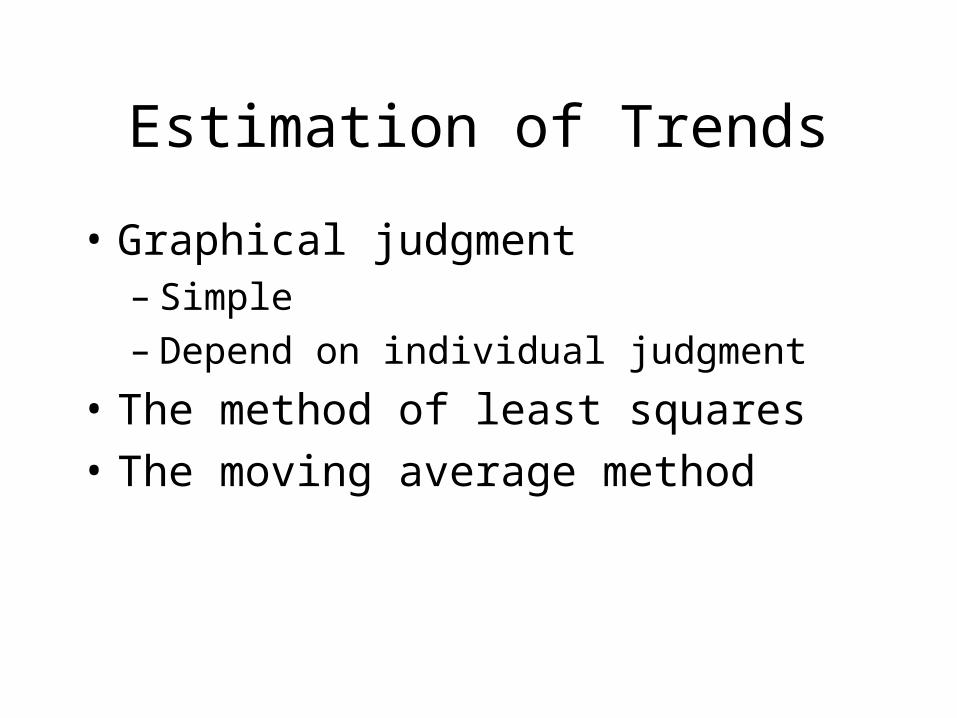
Estimation of Trends
• Graphical judgment– Simple– Depend on individual judgment
• The method of least squares
• The moving average method

Graphical Judgment

The Method of Least Square
• Find the best fitting trend line– Minimizing the sum of the deviations from a line
• Data points– (X1, Y1), (X2, Y2), … (Xn, Yn)
• Line– Y = m * X + b
– (Y – Y’) = (((X – X’)(Y – Y’))/((X – X’)2) *(X –X’)


Moving Averages
• Seasonal, cyclical, or random patterns may be smoothed, leaving the trend patterns.
• The data at the very beginning and end are lost.
• Affected by extreme values

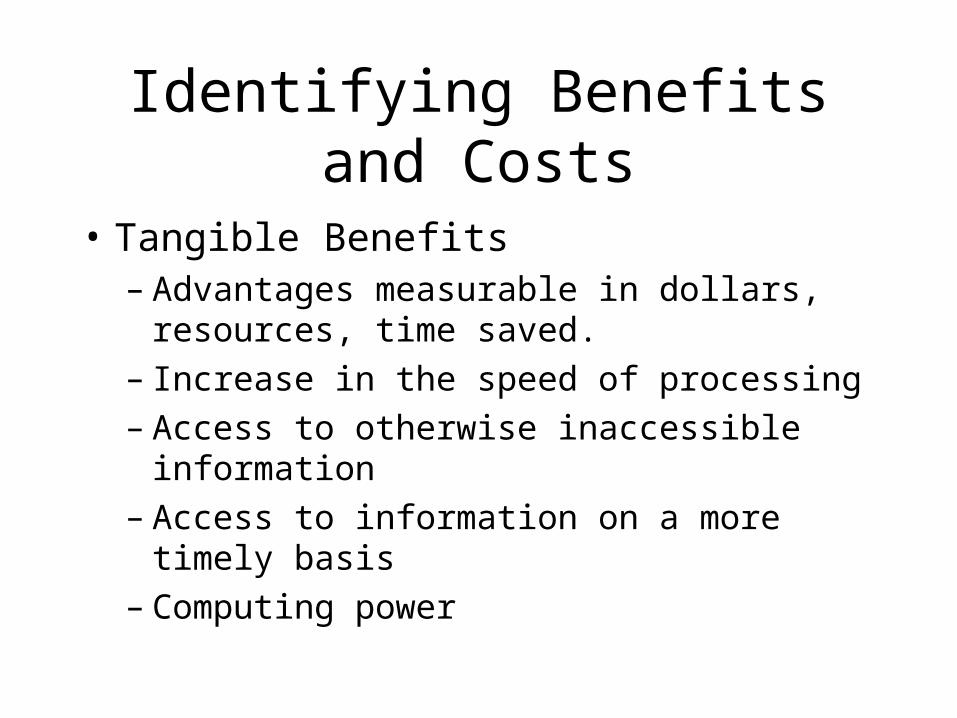
Identifying Benefits and Costs
• Tangible Benefits– Advantages measurable in dollars, resources,
time saved.– Increase in the speed of processing– Access to otherwise inaccessible information– Access to information on a more timely basis– Computing power

Identifying Benefits and Costs
• Intangible Benefits– Difficult to measure but are important
nonetheless.– Improve decision making process– Enhance accuracy– Become more comparative in the market– Customer service– Good business image

Identifying Benefits and Costs
• Tangible Costs– Cost of equipment
– Cost of resources
– The cost of systems analyst’s time (other employee's time and salary)
• Intangible costs– Losing a competitive edge
– Losing the reputation for being first
– Ineffective decision making
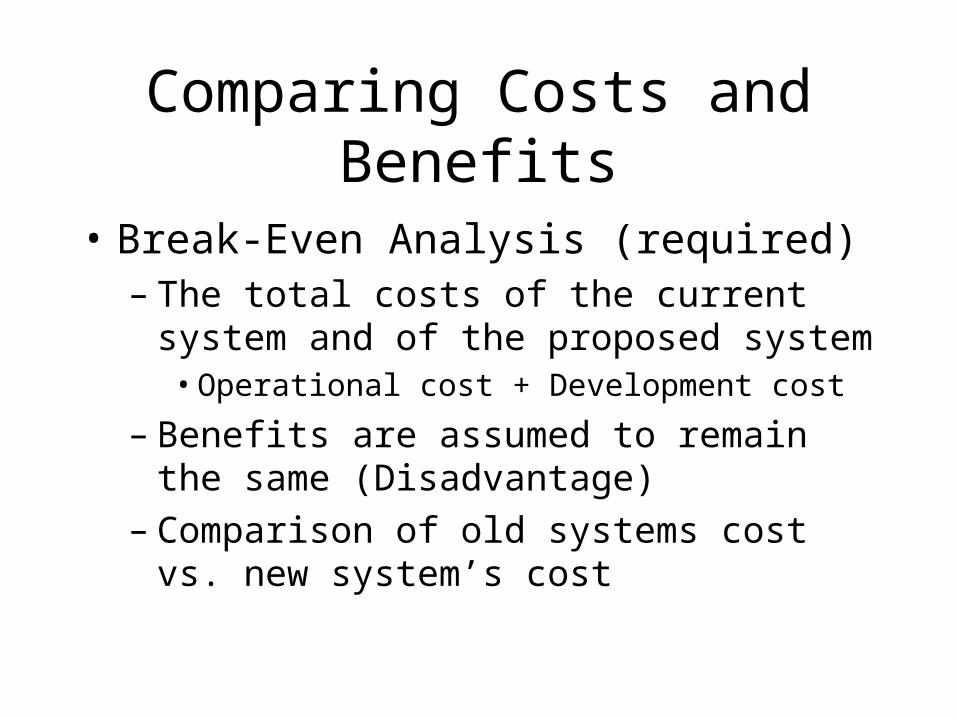
Comparing Costs and Benefits
• Break-Even Analysis (required)– The total costs of the current system and of the
proposed system• Operational cost + Development cost
– Benefits are assumed to remain the same (Disadvantage)
– Comparison of old systems cost vs. new system’s cost


Payback-Time Analysis (Required)
• A simple way to assess whether a business should invest in a proposed information system.
• The number of years of operation that the information system needs to pay back the cost of investing in it.
• Method: increasing revenues or increasing savings• Short-term approach• It does not consider the importance of how
repayments are timed• Total return


Return on Investment (ROI)
% rate that measure profitability by comparing net benefits (the return) received from a project to the total costs (the investment) of the project.
RROI = (total benefits – total costs)/ total costs

Present Value Analysis
• Consideration of Time value of money
• Interest rate vs. discount rate

Cash-flow Analysis
• This analysis examines the direction, size and pattern of cash flow.


Present Value

Guidelines for Analysis
• Use break-even analysis if the project needs to be justified in terms of cost, not benefits.
• Use payback when the improved tangible benefits form a convincing argument for the proposed system.
• Use cash-flow analysis when the project is expensive relative tot eh size of the company.
• Use present value when the payback period is long or when the cost of borrowing money is high

Logic for the Project Report Recommendation
• Benefits must exceed costs.– How much is enough?
• Payback time should be less than 3 years (based on your project size)
• Use the projection method– Yearly total sales– Increase rate– Historic data
• Your conclusion must be backed by your technical, operational, and economic analysis.
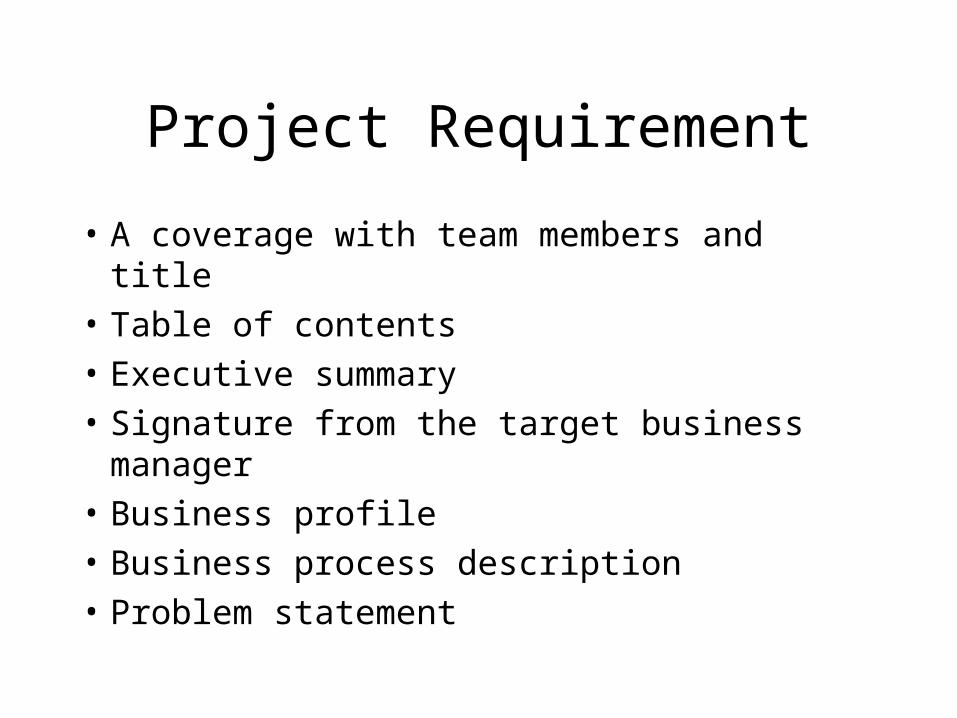
Project Requirement
• A coverage with team members and title
• Table of contents
• Executive summary
• Signature from the target business manager
• Business profile
• Business process description
• Problem statement

Project Requirement
• Analysis (cost/benefit)– Technical, operational, and economical analysis– Break-even and payback-time diagrams are required
• Recommendation• Project organization
– Team members– Group leader
• Project plan– Gantt Chart (required)– Task List


