Current state-of-the-art face recognition systems degrade significantly in performance due to variations in pose, illumination, and blurring.
Problem:
IMAGECAPTURE
PREPROCESSINGRESTORATION/ENHANCEMENT
FACERECOGNITION
SYSTEM
Solution:
POSE CORRECTION due to mismatch in facial position, facial expression and scaleILLUMINATION CORRECTION due to mismatch in lighting conditions in both indoor and outdoor environmentsDEBLURRING due to mismatch in camera focus, camera lenses, camera resolution and motion blur
Face Recognition
• No a priori information with regards to pose orientation, camera parameters, etc
• No laser scanned images for 3D reconstruction
• No manual detection of feature points• Preprocessing & Stand-Alone Recognition
Highlights of the approach
Principle
• Find a function which maps a given test (probe) image into the correct train (gallery) image
• Approach
where M is the number of training images
• Select that is maximally bijective
)( testopttrain YfX
Mi ,...,2,1
if
)( testii YfX
Recognition Principle
• A function ’f ‘ is found which maps points in the test (probe) to equivalent points in the train (gallery)
)(XfY where
X = Test image (domain)
Y = Train image (co-domain)
= Bijective function mapping X YfOne to One and Onto
(bijection)
X Y
domain (X) f range(X)
Test Train
Inverse Estimation
)(YgX
g
where
Y = Train image (domain)
X = Test image (co-domain)
= Bijective function mapping Y X
X Y
domain (Y) g range(Y)
• A function ’g ‘ is found which maps points in the train (gallery) to equivalent points in the test (probe)
Test Train
Measure of Bijectivity
X Yf
Partition X
][
)(....)()()(....)()( 2121
X
XfXfXfXfXfXfM nn
g
where n is the total number of distinct blocks in X
Blue,Green,Cyan
)(....)()( 21 pXfXfXf Red
)(....)()( 21 pXfXfXf
Measure of Bijectivity
YX g
Partition Y
][
)(....)()()(....)()( 2121
Y
YfYfYfYfYfYfM pp
g
where p is the total number of distinct blocks in Y
Exhaustive SearchExhaustive Search with ConstraintsFast Search
Face recognition performance
PIE Subset- Exhaustive SearchBlock Size-8x8; Search-72x72
One-to-None Mapping One-to-One Mapping
Stand Alone Recognition Performance
91.18 % 95.59 %
Table 4.4 PIE Database-Stand Alone Recognition
PCA-based Approach recognition accuracy: 5.88 %
0 0.1 0.2 0.3 0.4 0.5 0.6 0.7 0.8 0.9 10
0.1
0.2
0.3
0.4
0.5
0.6
0.7
0.8
0.9
1
False Accepts
Fal
se R
ejec
ts
PIE Subset, Exhaustive Search Block Size-8x8, Search Region-72x72
One-to-None MappingOne-to-One MappingPCA Approach
Face recognition performance
Training Test Preprocessed
Preprocessing for Illumination Correction
• Algorithm based on image adaptive least squares illumination correction
Training image A Testing image B Adaptive segmentation
Image A illuminated as B Image B illuminated as A Least squares estimate of illumination
Preprocessing for Illumination Correction
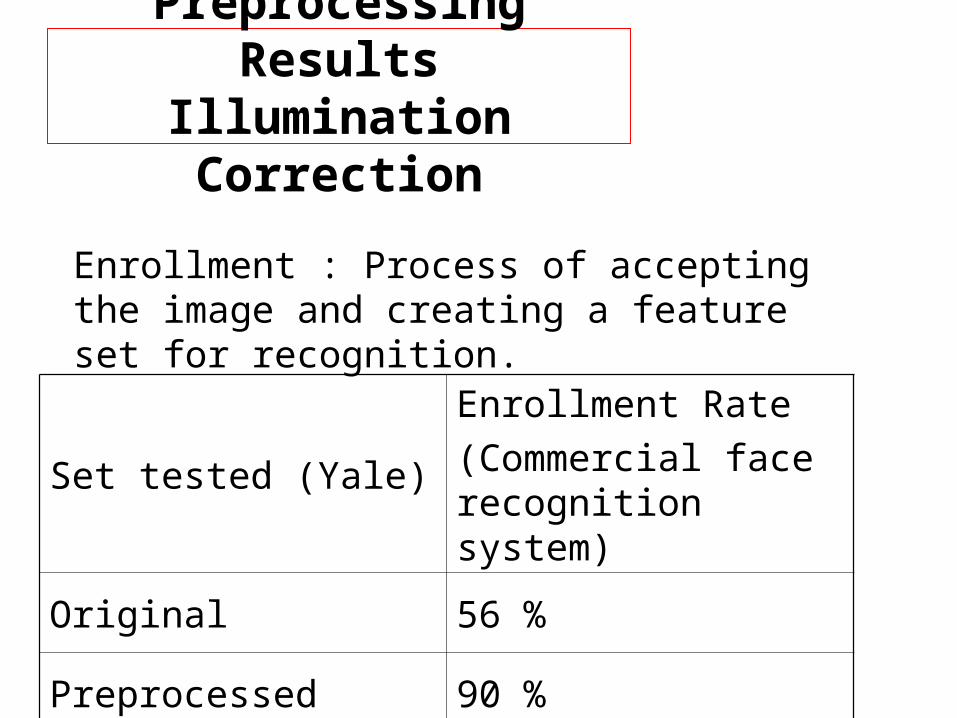
Set tested (Yale)Enrollment Rate
(Commercial face recognition system)
Original 56 %
Preprocessed 90 %
Enrollment : Process of accepting the image and creating a feature set for recognition.
Preprocessing ResultsIllumination Correction
Comparison with Existing Methods
Test subset3D Morphable Model
Our algorithm
PIE frontal 99.8 % 99.6 %
•3D morphable models : •Good results (FRVT 2002). •Very complex, computationally expensive, •manual labeling of features
1. T. Vetter and V. Blanz, “Face Recognition Based on Fitting a 3D Morphable Model,” IEEE Transactions on Pattern Analysis and Machine Intelligence, vol. 25, no. 9, pp. 1063--1075, Sept. 2003.
Preprocessing Example
train test
Vector Field Representation of f
Preprocessed Test Image
Train Test (Poor Resolution) Reconstruted Train (Poor Resolution Test)
Test (Good Resolution) Reconstruted Train (Good Resolution Test)