28
| Date post: | 28-Mar-2016 |
| Category: |
Documents |
| Upload: | international-preschool-curriculum |
| View: | 215 times |
| Download: | 0 times |

Legal PageConfidentiality Agreement
The undersigned reader acknowledges that the information provided by _______________ in this business plan is confidential; therefore, reader agrees not to disclose it without the express written permission of _______________.
It is acknowledged by reader that information to be furnished in this business plan is in all respects confidential in nature, other than information which is in the public domain through other means and that any disclosure or use of same by reader, may cause serious harm or damage to _______________.
Upon request, this document is to be immediately returned to _______________.
___________________ Signature
___________________Name (typed or printed)
___________________Date
This is a business plan. It does not imply an offering of securities.

Table of Contents
1.0 Executive Summary............................................................................................1Chart: Highlights.................................................................................................1
1.1 Objectives........................................................................................................11.2 Mission.............................................................................................................21.3 Keys to Success...............................................................................................2
2.0 Company Summary.............................................................................................22.1 Company Ownership........................................................................................22.2 Start-up Summary............................................................................................2
Table: Start-up....................................................................................................3Chart: Start-up....................................................................................................3
3.0 Products and Services...........................................................................................4.0 Market Analysis Summary....................................................................................
4.1 Market Segmentation.........................................................................................Table: Market Analysis..........................................................................................
4.2 Target Market Segment Strategy.......................................................................5.0 Web Plan Summary...............................................................................................
5.1 Website Marketing Strategy...............................................................................5.2 Development Requirements..............................................................................
6.0 Strategy and Implementation Summary...............................................................6.1 SWOT Analysis...................................................................................................
6.1.1 Strengths.....................................................................................................6.1.2 Weaknesses.................................................................................................6.1.3 Opportunities...............................................................................................6.1.4 Threats.........................................................................................................
6.2 Competitive Edge...............................................................................................6.3 Marketing Strategy............................................................................................6.4 Sales Strategy....................................................................................................
6.4.1 Sales Forecast..............................................................................................Table: Sales Forecast.......................................................................................4Chart: Sales Monthly........................................................................................5Chart: Sales by Year........................................................................................5
6.5 Milestones........................................................................................................5Table: Milestones................................................................................................6Chart: Milestones................................................................................................6
8.0 Management Summary.......................................................................................6Page 1

Table of Contents
8.1 Personnel Plan....................................................................................................Table: Personnel...................................................................................................
8.0 Financial Plan........................................................................................................8.1 Start-up Funding................................................................................................
Table: Start-up Funding........................................................................................8.2 Important Assumptions......................................................................................8.3 Break-even Analysis...........................................................................................
Table: Break-even Analysis...................................................................................Chart: Break-even Analysis...................................................................................
8.4 Projected Profit and Loss....................................................................................Table: Profit and Loss..........................................................................................8Chart: Profit Monthly...........................................................................................9Chart: Profit Yearly..............................................................................................9Chart: Gross Margin Monthly............................................................................10Chart: Gross Margin Yearly...............................................................................10
8.5 Projected Cash Flow.......................................................................................11Table: Cash Flow...............................................................................................11Chart: Cash.......................................................................................................12
8.6 Projected Balance Sheet................................................................................12Table: Balance Sheet........................................................................................12
8.7 Business Ratios..............................................................................................13Table: Ratios.....................................................................................................13
8.8 Long-term Plan...............................................................................................14Table: Sales Forecast................................................................................................1Table: Personnel........................................................................................................2Table: Profit and Loss................................................................................................3Table: Cash Flow.......................................................................................................4Table: Balance Sheet.................................................................................................6
Page 2

IPC SAMPLE BUSINESS PLAN © 2011
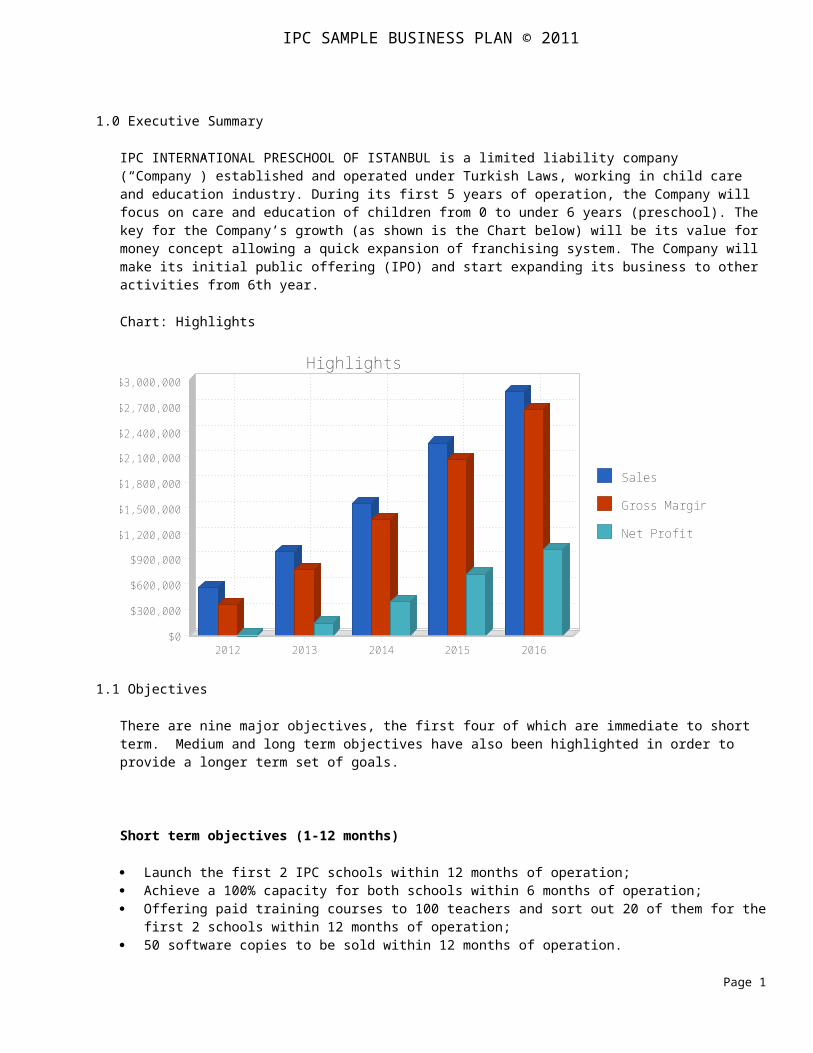
1.0 Executive Summary
IPC INTERNATIONAL PRESCHOOL OF ISTANBUL is a limited liability company (“Company”) established and operated under Turkish Laws, working in child care and education industry. During its first 5 years of operation, the Company will focus on care and education of children from 0 to under 6 years (preschool). The key for the Company’s growth (as shown is the Chart below) will be its value for money concept allowing a quick expansion of franchising system. The Company will make its initial public offering (IPO) and start expanding its business to other activities from 6th year.
Chart: Highlights
Sales
Gross Margin
Net Profit
$0
$300,000
$600,000
$900,000
$1,200,000
$1,500,000
$1,800,000
$2,100,000
$2,400,000
$2,700,000
$3,000,000
2012 2013 2014 2015 2016
Highlights
1.1 Objectives
There are nine major objectives, the first four of which are immediate to short term. Medium and long term objectives have also been highlighted in order to provide a longer term set of goals.
Short term objectives (1-12 months)
Launch the first 2 IPC schools within 12 months of operation; Achieve a 100% capacity for both schools within 6 months of operation; Offering paid training courses to 100 teachers and sort out 20 of them for the first 2 schools
within 12 months of operation; 50 software copies to be sold within 12 months of operation.
Page 1
IPC SAMPLE BUSINESS PLAN © 2011
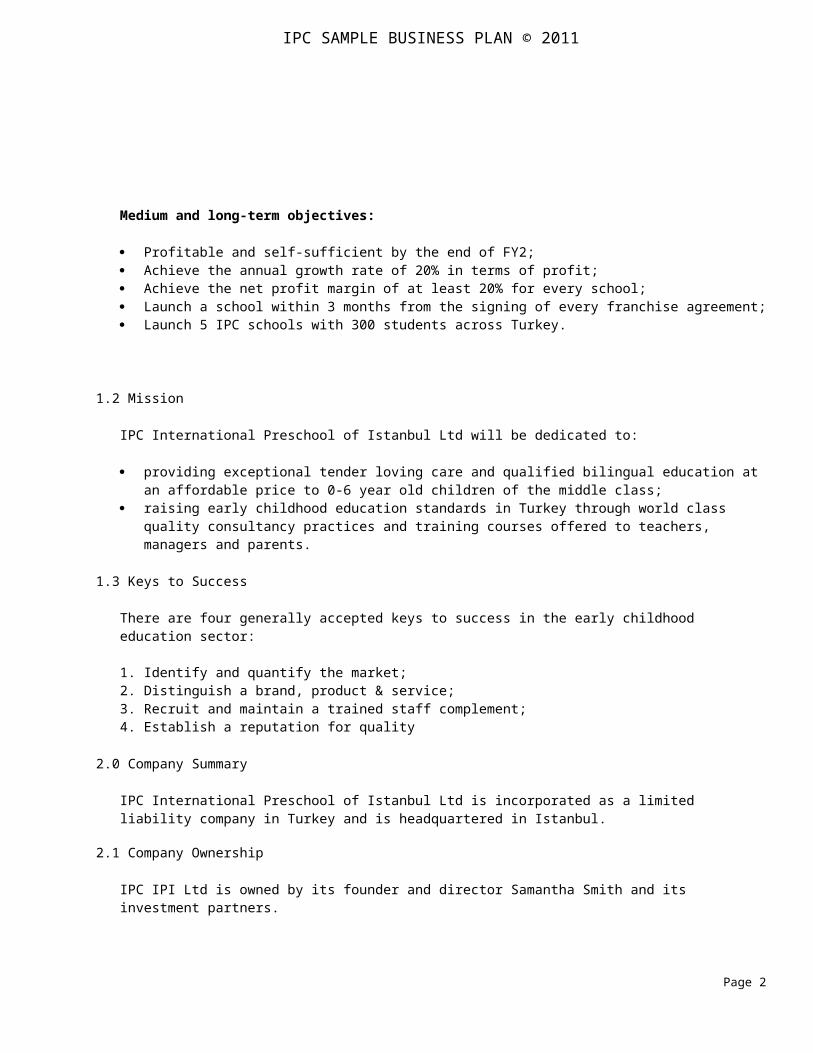
Medium and long-term objectives:
Profitable and self-sufficient by the end of FY2; Achieve the annual growth rate of 20% in terms of profit; Achieve the net profit margin of at least 20% for every school; Launch a school within 3 months from the signing of every franchise agreement; Launch 5 IPC schools with 300 students across Turkey.
1.2 Mission
IPC International Preschool of Istanbul Ltd will be dedicated to:
providing exceptional tender loving care and qualified bilingual education at an affordable price to 0-6 year old children of the middle class;
raising early childhood education standards in Turkey through world class quality consultancy practices and training courses offered to teachers, managers and parents.
1.3 Keys to Success
There are four generally accepted keys to success in the early childhood education sector: 1. Identify and quantify the market;2. Distinguish a brand, product & service;3. Recruit and maintain a trained staff complement;4. Establish a reputation for quality
2.0 Company Summary
IPC International Preschool of Istanbul Ltd is incorporated as a limited liability company in Turkey and is headquartered in Istanbul.
2.1 Company Ownership
IPC IPI Ltd is owned by its founder and director Samantha Smith and its investment partners.
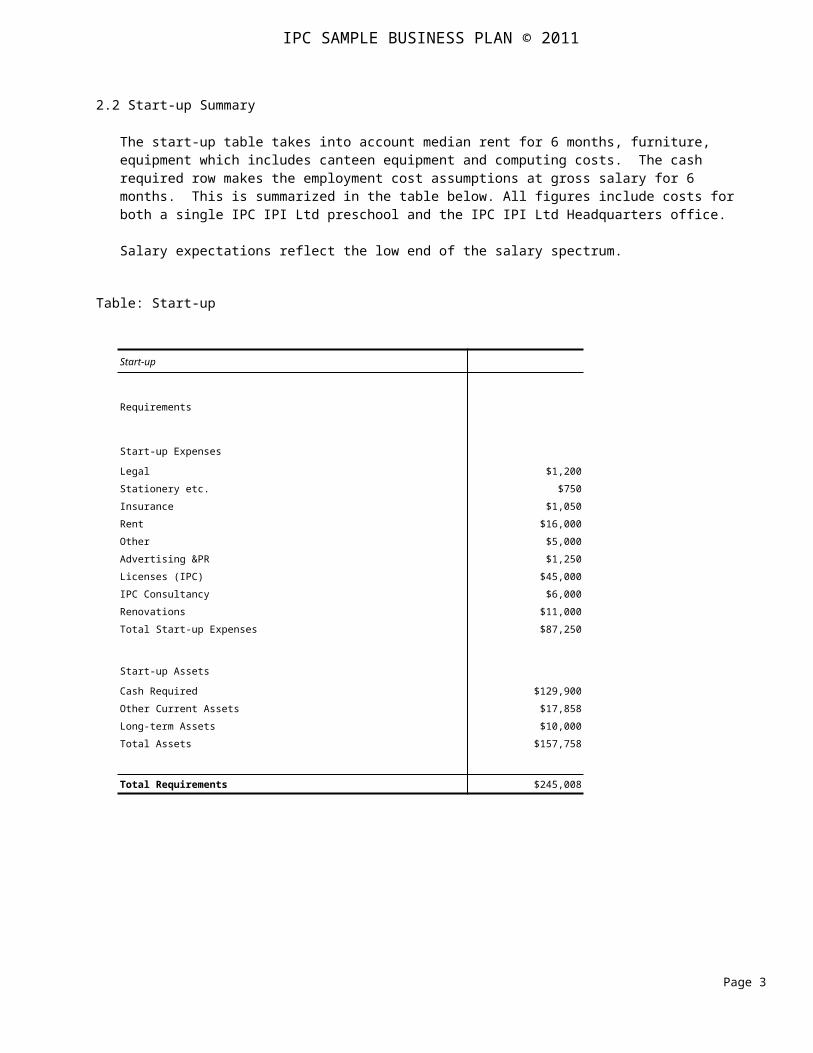
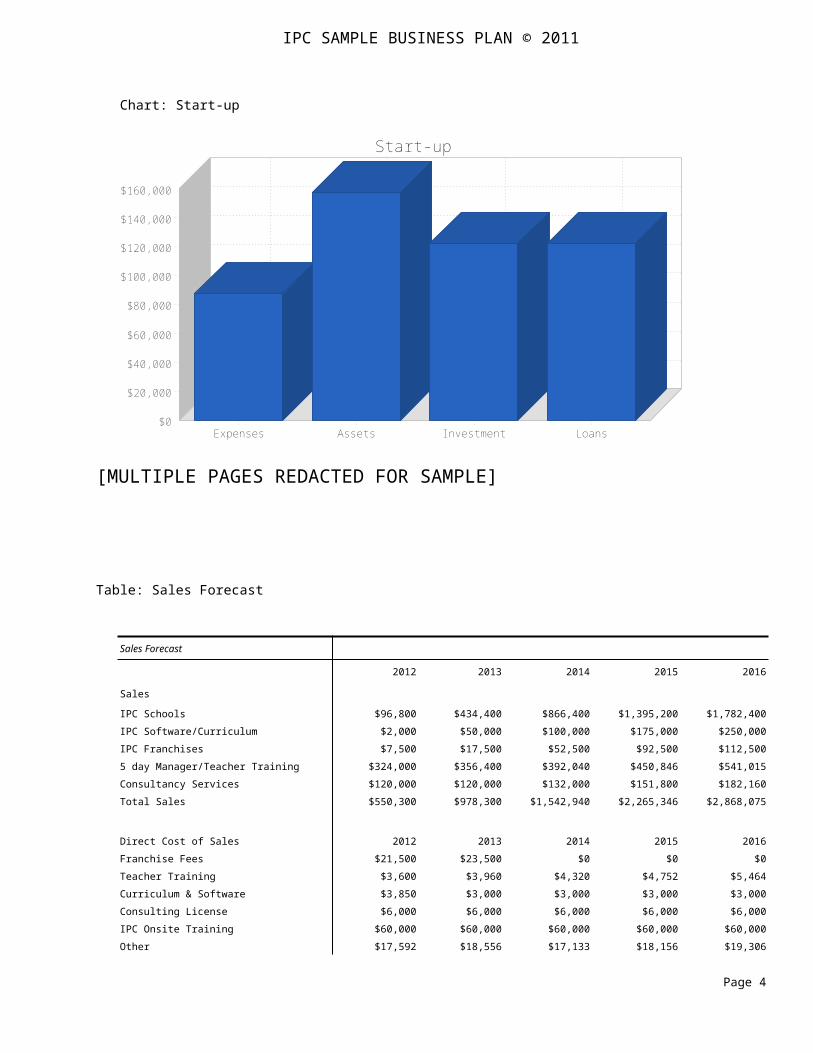
2.2 Start-up Summary
The start-up table takes into account median rent for 6 months, furniture, equipment which includes canteen equipment and computing costs. The cash required row makes the employment cost assumptions at gross salary for 6 months. This is summarized in the table below. All figures include costs for both a single IPC IPI Ltd preschool and the IPC IPI Ltd Headquarters office.
Salary expectations reflect the low end of the salary spectrum.
Table: Start-up
Page 2
IPC SAMPLE BUSINESS PLAN © 2011
Start-up
Requirements
Start-up Expenses
Legal $1,200 Stationery etc. $750 Insurance $1,050 Rent $16,000 Other $5,000 Advertising &PR $1,250 Licenses (IPC) $45,000 IPC Consultancy $6,000 Renovations $11,000 Total Start-up Expenses $87,250
Start-up Assets
Cash Required $129,900 Other Current Assets $17,858 Long-term Assets $10,000 Total Assets $157,758
Total Requirements $245,008
Chart: Start-up
$0
$20,000
$40,000
$60,000
$80,000
$100,000
$120,000
$140,000
$160,000
Expenses Assets Investment Loans
Start-up
Page 3
IPC SAMPLE BUSINESS PLAN © 2011
[MULTIPLE PAGES REDACTED FOR SAMPLE]
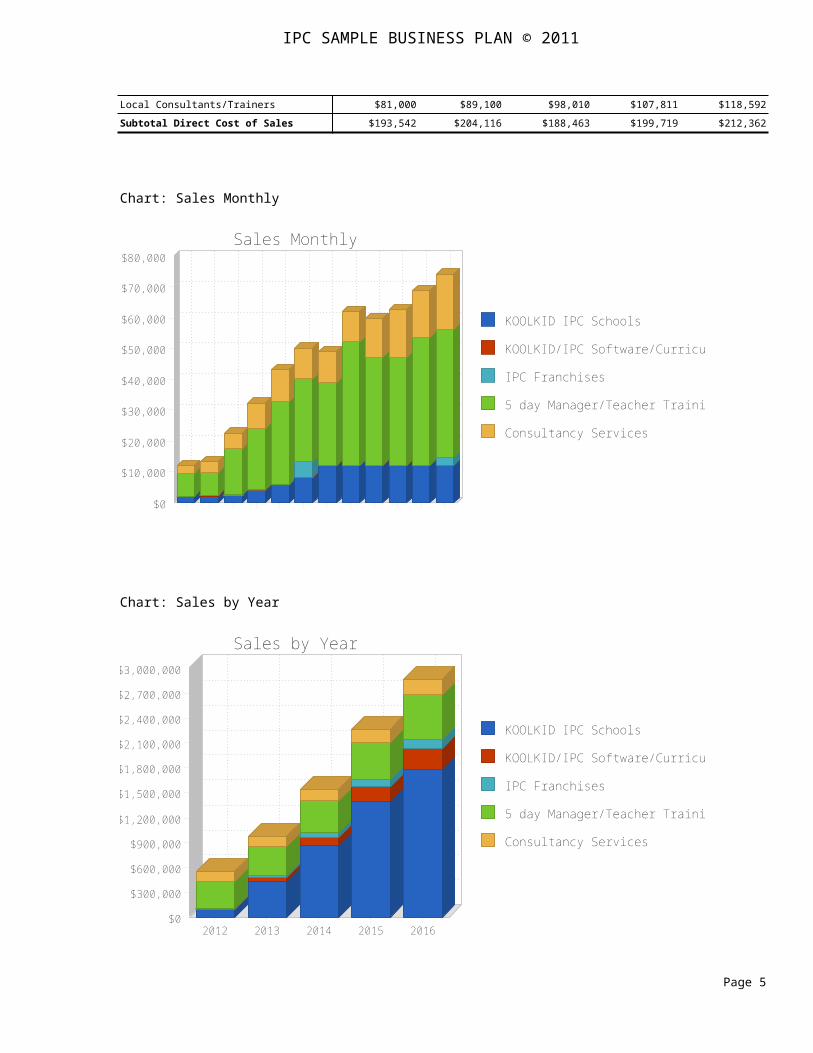
Table: Sales Forecast
Sales Forecast
2012 2013 2014 2015 2016
Sales
IPC Schools $96,800 $434,400 $866,400 $1,395,200 $1,782,400 IPC Software/Curriculum $2,000 $50,000 $100,000 $175,000 $250,000 IPC Franchises $7,500 $17,500 $52,500 $92,500 $112,500 5 day Manager/Teacher Training $324,000 $356,400 $392,040 $450,846 $541,015 Consultancy Services $120,000 $120,000 $132,000 $151,800 $182,160 Total Sales $550,300 $978,300 $1,542,940 $2,265,346 $2,868,075
Direct Cost of Sales 2012 2013 2014 2015 2016Franchise Fees $21,500 $23,500 $0 $0 $0 Teacher Training $3,600 $3,960 $4,320 $4,752 $5,464 Curriculum & Software $3,850 $3,000 $3,000 $3,000 $3,000 Consulting License $6,000 $6,000 $6,000 $6,000 $6,000 IPC Onsite Training $60,000 $60,000 $60,000 $60,000 $60,000 Other $17,592 $18,556 $17,133 $18,156 $19,306 Local Consultants/Trainers $81,000 $89,100 $98,010 $107,811 $118,592
Subtotal Direct Cost of Sales $193,542 $204,116 $188,463 $199,719 $212,362
Chart: Sales Monthly
KOOLKID IPC Schools
KOOLKID/IPC Software/Curriculum
IPC Franchises
5 day Manager/Teacher Training
Consultancy Services
$0
$10,000
$20,000
$30,000
$40,000
$50,000
$60,000
$70,000
$80,000
Jan
Feb
Mar
Apr
May
Jun
Jul
Aug
Sep
Oct
Nov
Dec
Sales Monthly
Page 4
IPC SAMPLE BUSINESS PLAN © 2011
Chart: Sales by Year
KOOLKID IPC Schools
KOOLKID/IPC Software/Curriculum
IPC Franchises
5 day Manager/Teacher Training
Consultancy Services
$0
$300,000
$600,000
$900,000
$1,200,000
$1,500,000
$1,800,000
$2,100,000
$2,400,000
$2,700,000
$3,000,000
2012 2013 2014 2015 2016
Sales by Year
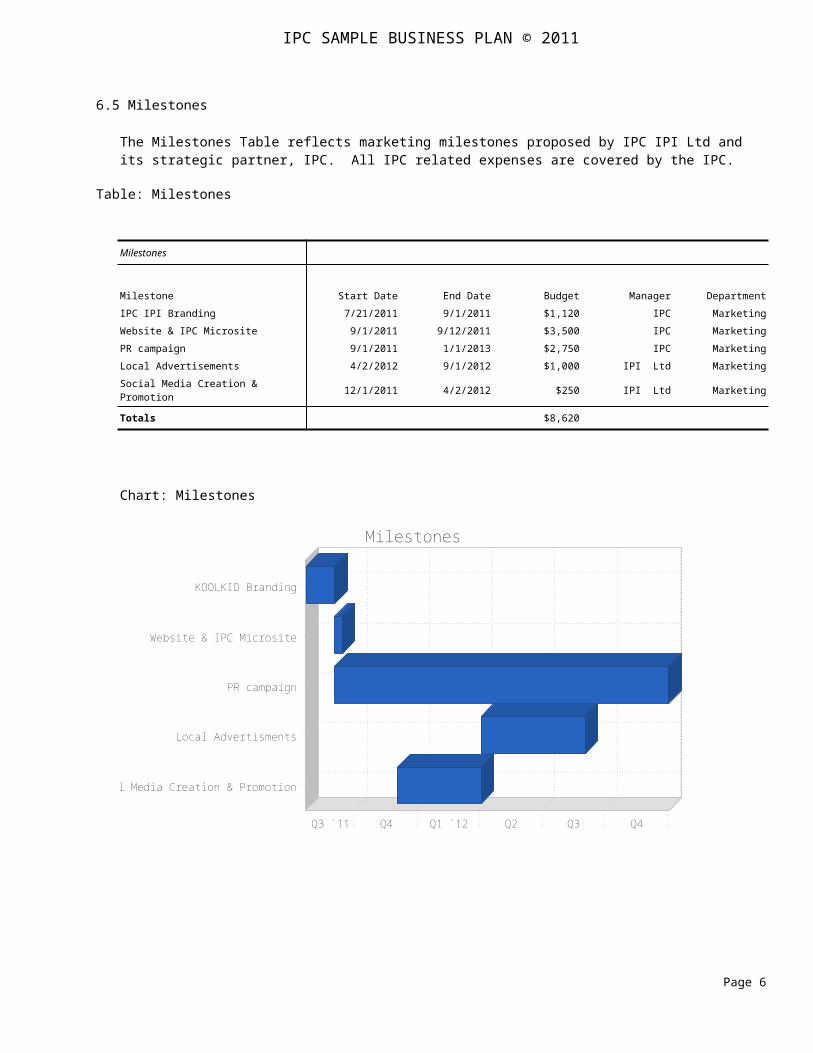
6.5 Milestones
The Milestones Table reflects marketing milestones proposed by IPC IPI Ltd and its strategic partner, IPC. All IPC related expenses are covered by the IPC.
Table: Milestones
Milestones
Milestone Start Date End Date Budget Manager DepartmentIPC IPI Branding 7/21/2011 9/1/2011 $1,120 IPC MarketingWebsite & IPC Microsite 9/1/2011 9/12/2011 $3,500 IPC MarketingPR campaign 9/1/2011 1/1/2013 $2,750 IPC MarketingLocal Advertisements 4/2/2012 9/1/2012 $1,000 IPI Ltd MarketingSocial Media Creation & Promotion 12/1/2011 4/2/2012 $250 IPI Ltd Marketing
Totals $8,620
Page 5
IPC SAMPLE BUSINESS PLAN © 2011
Chart: Milestones
Q3 `11 Q4 Q1 `12 Q2 Q3 Q4
Social Media Creation & Promotion
Local Advertisments
PR campaign
Website & IPC Microsite
KOOLKID Branding
Milestones
7.0 Operational Plan
The following section will review the operational requirements in order to establish the two major IPC IPI projects. This section will look at the physical requirements, layout options and equipment for the IPC IPI preschool and the IPI/IPC office.
7.1 IPC IPI Preschools
7.11 Location and Facility Type
IPC IPI will identify locations that demographically represent the business intentions of IPC IPI Ltd’s objectives. Therefore, IPC IPI will focus on densely populated residential neighborhoods of Istanbul to establish the first preschool. KOOLKID will identify a space of at least 2,500 sq. ft of indoor space and about 3,000 sq.ft of playground space.
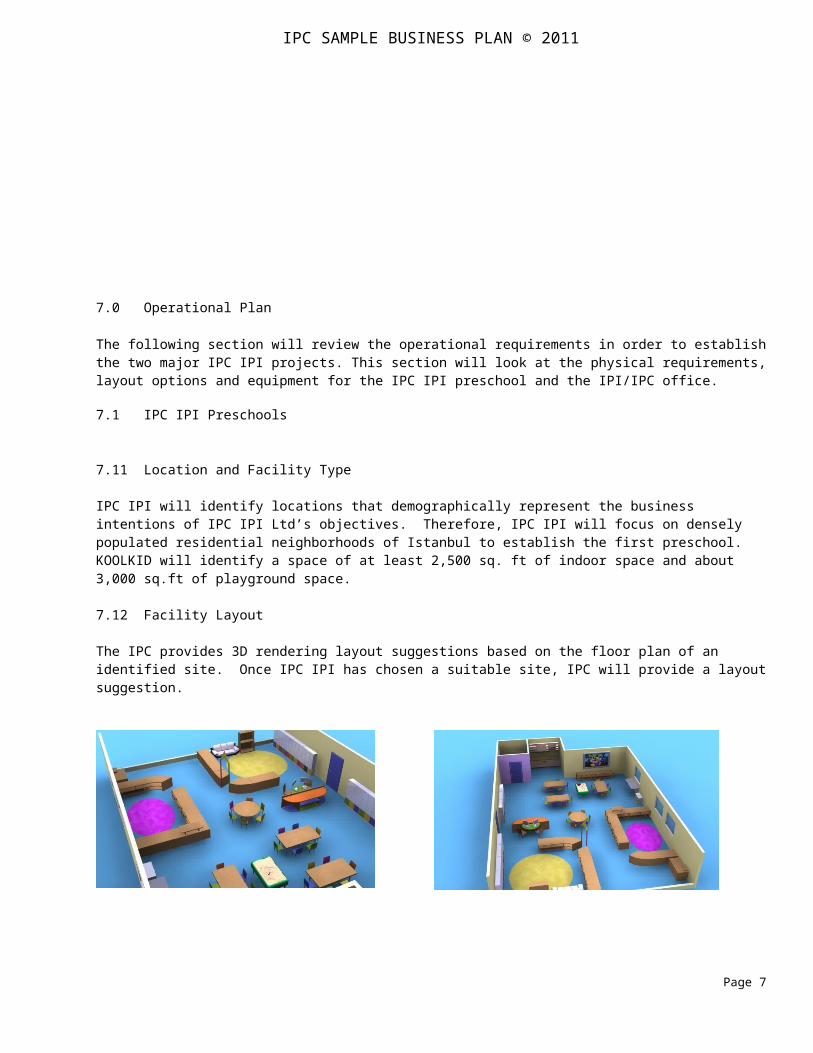
7.12 Facility Layout
The IPC provides 3D rendering layout suggestions based on the floor plan of an identified site. Once IPC IPI has chosen a suitable site, IPC will provide a layout suggestion.
Page 6
IPC SAMPLE BUSINESS PLAN © 2011
[MULTIPLE PAGES REDACTED FOR SAMPLE]
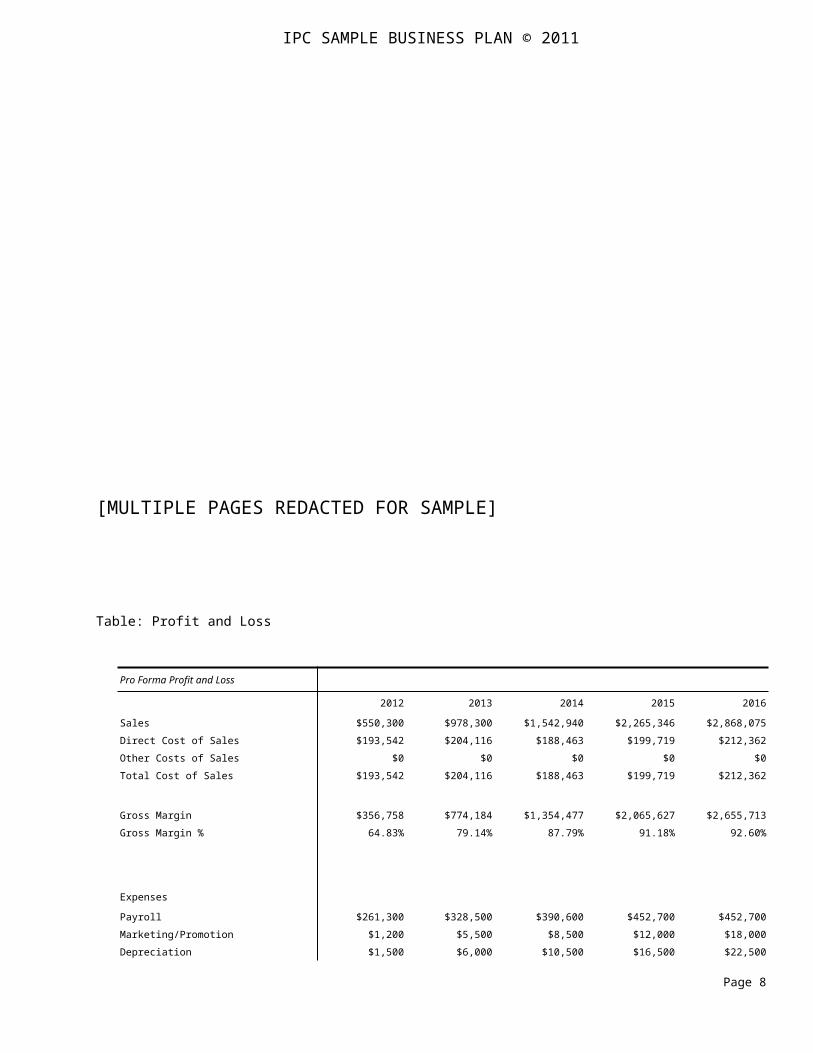
Table: Profit and Loss
Pro Forma Profit and Loss
2012 2013 2014 2015 2016
Sales $550,300 $978,300 $1,542,940 $2,265,346 $2,868,075 Direct Cost of Sales $193,542 $204,116 $188,463 $199,719 $212,362 Other Costs of Sales $0 $0 $0 $0 $0 Total Cost of Sales $193,542 $204,116 $188,463 $199,719 $212,362
Gross Margin $356,758 $774,184 $1,354,477 $2,065,627 $2,655,713 Gross Margin % 64.83% 79.14% 87.79% 91.18% 92.60%
Expenses
Payroll $261,300 $328,500 $390,600 $452,700 $452,700 Marketing/Promotion $1,200 $5,500 $8,500 $12,000 $18,000 Depreciation $1,500 $6,000 $10,500 $16,500 $22,500 Rent $48,000 $138,000 $228,000 $348,000 $468,000
Page 7
IPC SAMPLE BUSINESS PLAN © 2011
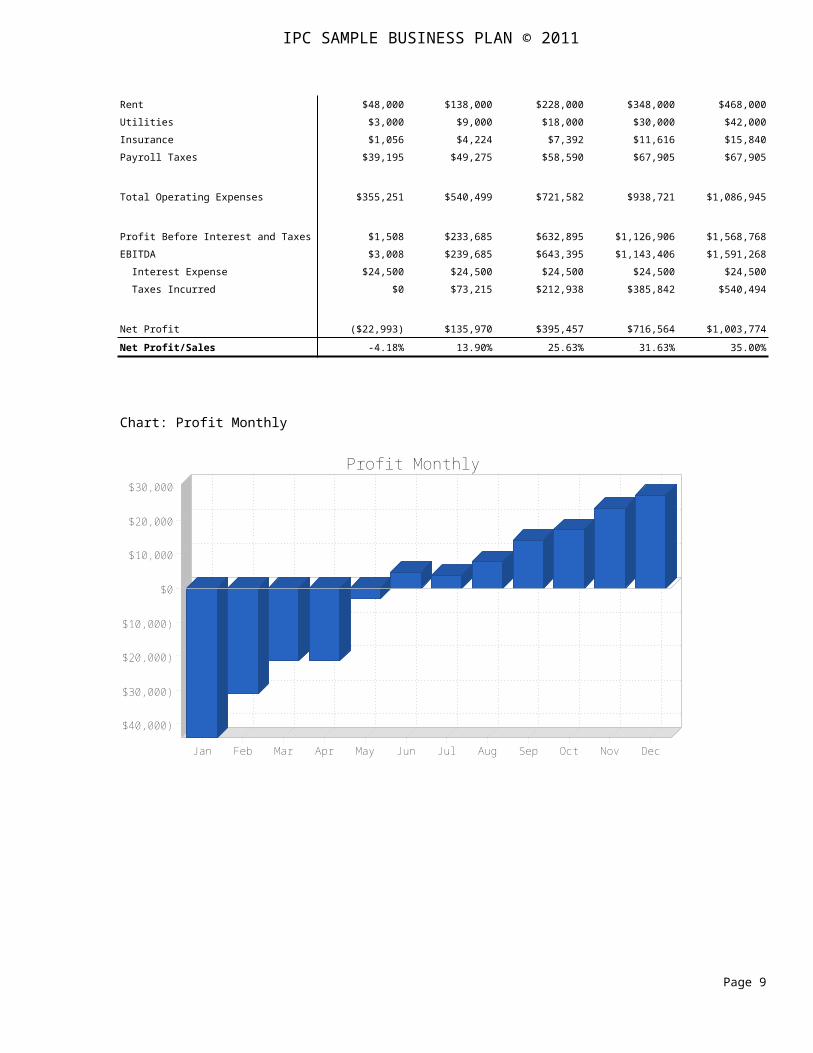
Utilities $3,000 $9,000 $18,000 $30,000 $42,000 Insurance $1,056 $4,224 $7,392 $11,616 $15,840 Payroll Taxes $39,195 $49,275 $58,590 $67,905 $67,905
Total Operating Expenses $355,251 $540,499 $721,582 $938,721 $1,086,945
Profit Before Interest and Taxes $1,508 $233,685 $632,895 $1,126,906 $1,568,768 EBITDA $3,008 $239,685 $643,395 $1,143,406 $1,591,268 Interest Expense $24,500 $24,500 $24,500 $24,500 $24,500 Taxes Incurred $0 $73,215 $212,938 $385,842 $540,494
Net Profit ($22,993) $135,970 $395,457 $716,564 $1,003,774
Net Profit/Sales -4.18% 13.90% 25.63% 31.63% 35.00%
Chart: Profit Monthly
$0
$10,000
$20,000
$30,000
($10,000)
($20,000)
($30,000)
($40,000)
Jan Feb Mar Apr May Jun Jul Aug Sep Oct Nov Dec
Profit Monthly
Page 8
IPC SAMPLE BUSINESS PLAN © 2011
Chart: Profit Yearly
$0
$200,000
$400,000
$600,000
$800,000
$1,000,000
2012 2013 2014 2015 2016
Profit Yearly
Chart: Gross Margin Monthly
$0
$10,000
$20,000
$30,000
$40,000
$50,000
$60,000
($10,000)
Jan Feb Mar Apr May Jun Jul Aug Sep Oct Nov Dec
Gross Margin Monthly
Page 9
IPC SAMPLE BUSINESS PLAN © 2011
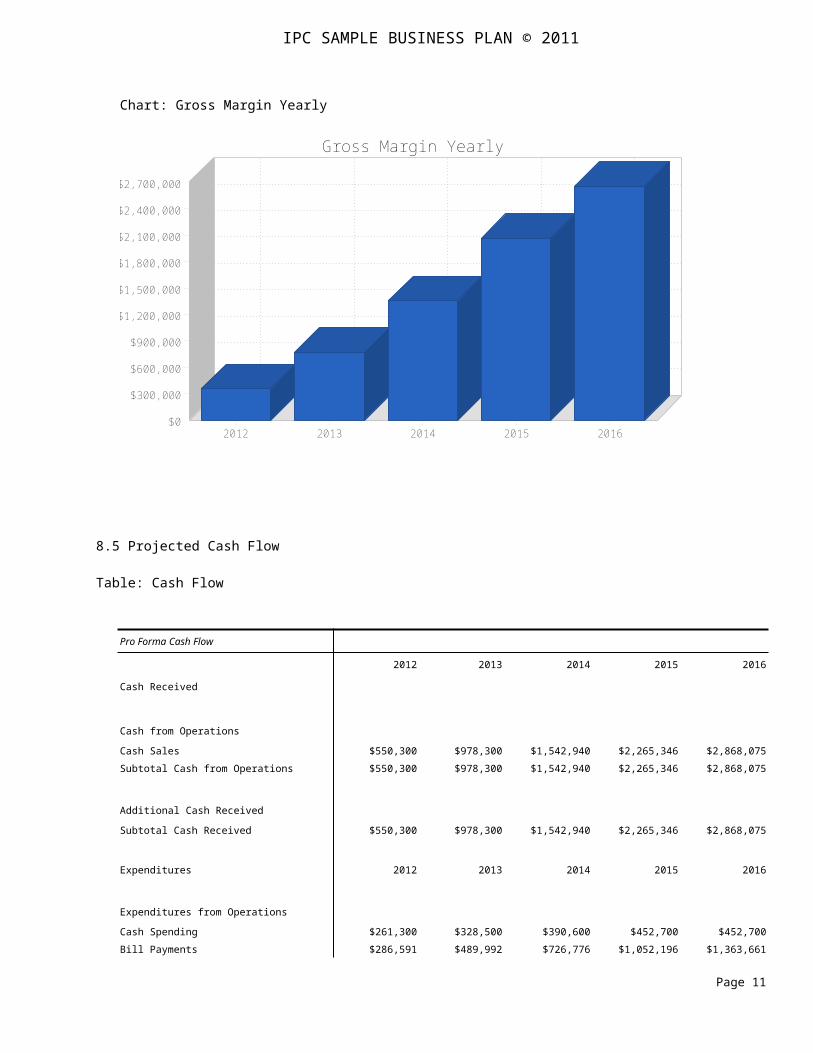
Chart: Gross Margin Yearly
$0
$300,000
$600,000
$900,000
$1,200,000
$1,500,000
$1,800,000
$2,100,000
$2,400,000
$2,700,000
2012 2013 2014 2015 2016
Gross Margin Yearly
8.5 Projected Cash Flow
Table: Cash Flow
Pro Forma Cash Flow
2012 2013 2014 2015 2016
Cash Received
Cash from Operations
Cash Sales $550,300 $978,300 $1,542,940 $2,265,346 $2,868,075 Subtotal Cash from Operations $550,300 $978,300 $1,542,940 $2,265,346 $2,868,075
Additional Cash Received
Subtotal Cash Received $550,300 $978,300 $1,542,940 $2,265,346 $2,868,075
Expenditures 2012 2013 2014 2015 2016
Expenditures from Operations
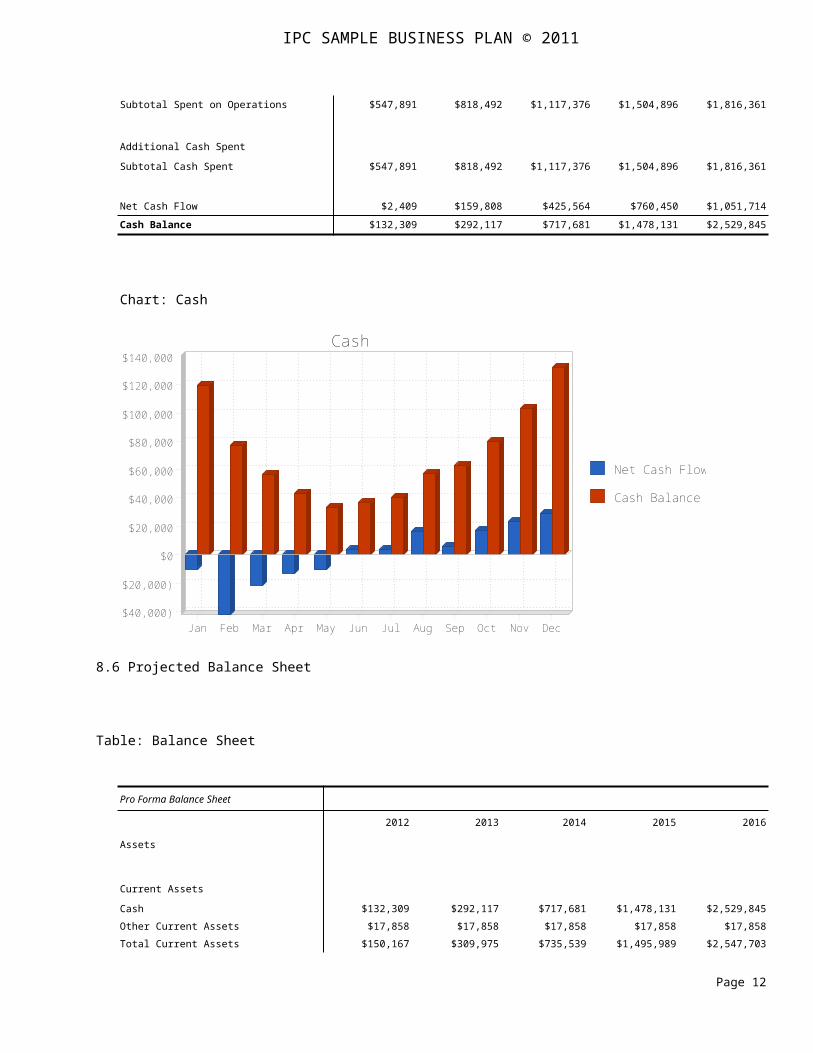
Cash Spending $261,300 $328,500 $390,600 $452,700 $452,700 Bill Payments $286,591 $489,992 $726,776 $1,052,196 $1,363,661 Subtotal Spent on Operations $547,891 $818,492 $1,117,376 $1,504,896 $1,816,361
Additional Cash Spent
Subtotal Cash Spent $547,891 $818,492 $1,117,376 $1,504,896 $1,816,361
Page 10

IPC SAMPLE BUSINESS PLAN © 2011
Net Cash Flow $2,409 $159,808 $425,564 $760,450 $1,051,714
Cash Balance $132,309 $292,117 $717,681 $1,478,131 $2,529,845
Chart: Cash
Net Cash Flow
Cash Balance
$0
$20,000
$40,000
$60,000
$80,000
$100,000
$120,000
$140,000
($20,000)
($40,000)Jan Feb Mar Apr May Jun Jul Aug Sep Oct Nov Dec
Cash
8.6 Projected Balance Sheet
Table: Balance Sheet
Pro Forma Balance Sheet
2012 2013 2014 2015 2016
Assets
Current Assets
Cash $132,309 $292,117 $717,681 $1,478,131 $2,529,845 Other Current Assets $17,858 $17,858 $17,858 $17,858 $17,858 Total Current Assets $150,167 $309,975 $735,539 $1,495,989 $2,547,703
Long-term Assets
Long-term Assets $10,000 $10,000 $10,000 $10,000 $10,000 Accumulated Depreciation $1,500 $7,500 $18,000 $34,500 $57,000 Total Long-term Assets $8,500 $2,500 ($8,000) ($24,500) ($47,000)Total Assets $158,667 $312,475 $727,539 $1,471,489 $2,500,703
Page 11
IPC SAMPLE BUSINESS PLAN © 2011
Liabilities and Capital 2012 2013 2014 2015 2016
Current Liabilities
Accounts Payable $23,901 $41,739 $61,347 $88,733 $114,173 Current Borrowing $122,500 $122,500 $122,500 $122,500 $122,500 Other Current Liabilities $0 $0 $0 $0 $0 Subtotal Current Liabilities $146,401 $164,239 $183,847 $211,233 $236,673
Long-term Liabilities $0 $0 $0 $0 $0 Total Liabilities $146,401 $164,239 $183,847 $211,233 $236,673
Paid-in Capital $122,508 $122,508 $122,508 $122,508 $122,508 Retained Earnings ($87,250) ($110,243) $25,728 $421,184 $1,137,748 Earnings ($22,993) $135,970 $395,457 $716,564 $1,003,774 Total Capital $12,265 $148,236 $543,693 $1,260,256 $2,264,031 Total Liabilities and Capital $158,667 $312,475 $727,539 $1,471,489 $2,500,703
Net Worth $12,265 $148,236 $543,693 $1,260,256 $2,264,031
8.7 Business Ratios
Table: Ratios
Ratio Analysis
2012 2013 2014 2015 2016
Sales Growth n.a. 77.78% 57.72% 46.82% 26.61%
Percent of Total Assets
Other Current Assets 11.26% 5.72% 2.45% 1.21% 0.71%
Total Current Assets 94.64% 99.20% 101.10% 101.66% 101.88%
Long-term Assets 5.36% 0.80% -1.10% -1.66% -1.88%
Total Assets 100.00% 100.00% 100.00% 100.00% 100.00%
Current Liabilities 92.27% 52.56% 25.27% 14.36% 9.46%
Long-term Liabilities 0.00% 0.00% 0.00% 0.00% 0.00%
Total Liabilities 92.27% 52.56% 25.27% 14.36% 9.46%
Net Worth 7.73% 47.44% 74.73% 85.64% 90.54%
Percent of Sales
Sales 100.00% 100.00% 100.00% 100.00% 100.00%
Gross Margin 64.83% 79.14% 87.79% 91.18% 92.60%
Selling, General & Administrative Expenses 69.01% 65.24% 62.16% 59.55% 57.60%
Page 12
IPC SAMPLE BUSINESS PLAN © 2011
Advertising Expenses 0.22% 0.56% 0.55% 0.53% 0.63%
Profit Before Interest and Taxes 0.27% 23.89% 41.02% 49.75% 54.70%
Main Ratios
Current 1.03 1.89 4.00 7.08 10.76
Quick 1.03 1.89 4.00 7.08 10.76
Total Debt to Total Assets 92.27% 52.56% 25.27% 14.36% 9.46%
Pre-tax Return on Net Worth -187.46% 141.12% 111.90% 87.47% 68.21%
Pre-tax Return on Assets -14.49% 66.94% 83.62% 74.92% 61.75%
Additional Ratios 2012 2013 2014 2015 2016
Net Profit Margin -4.18% 13.90% 25.63% 31.63% 35.00%
Return on Equity -187.46% 91.73% 72.74% 56.86% 44.34%
Activity Ratios
Accounts Payable Turnover 12.99 12.17 12.17 12.17 12.17
Payment Days 27 24 25 25 27
Total Asset Turnover 3.47 3.13 2.12 1.54 1.15
Debt Ratios
Debt to Net Worth 11.94 1.11 0.34 0.17 0.10
Current Liab. to Liab. 1.00 1.00 1.00 1.00 1.00
Liquidity Ratios
Net Working Capital $3,765 $145,736 $551,693 $1,284,756 $2,311,031
Interest Coverage 0.06 9.54 25.83 46.00 64.03
Additional Ratios
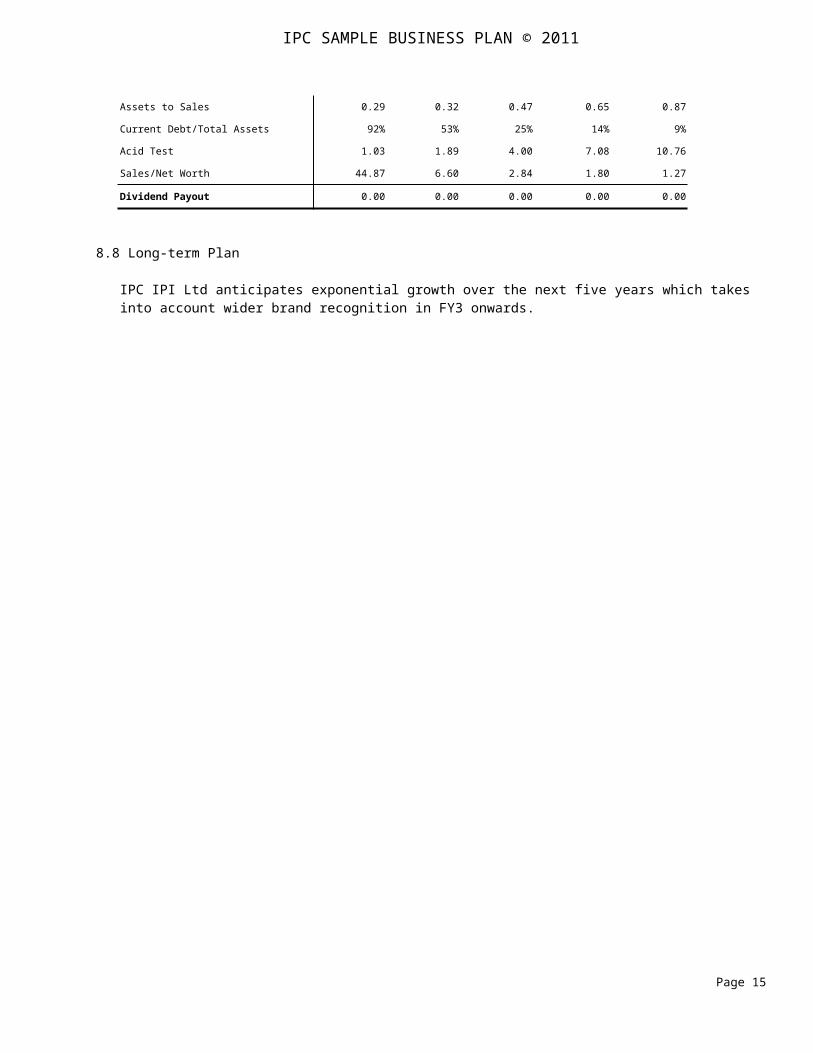
Assets to Sales 0.29 0.32 0.47 0.65 0.87
Current Debt/Total Assets 92% 53% 25% 14% 9%
Acid Test 1.03 1.89 4.00 7.08 10.76
Sales/Net Worth 44.87 6.60 2.84 1.80 1.27
Dividend Payout 0.00 0.00 0.00 0.00 0.00
8.8 Long-term Plan
IPC IPI Ltd anticipates exponential growth over the next five years which takes into account wider brand recognition in FY3 onwards.
Page 13

Appendix
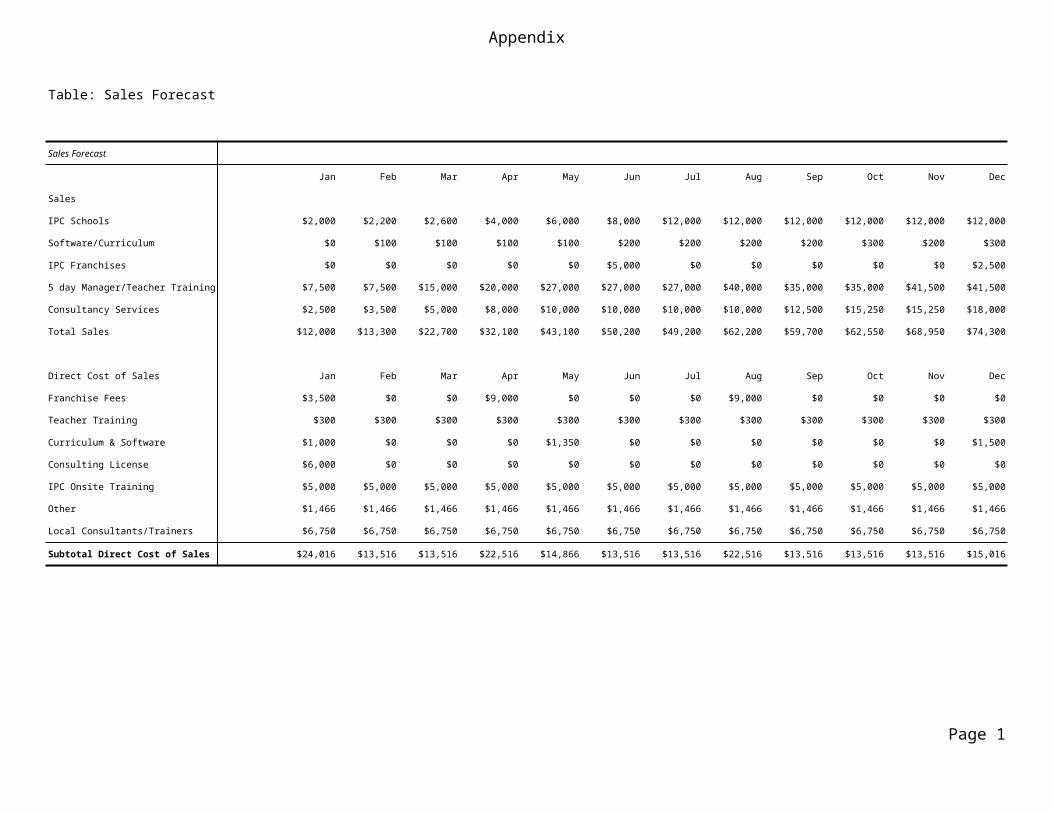
Table: Sales Forecast
Sales Forecast
Jan Feb Mar Apr May Jun Jul Aug Sep Oct Nov Dec
Sales
IPC Schools $2,000 $2,200 $2,600 $4,000 $6,000 $8,000 $12,000 $12,000 $12,000 $12,000 $12,000 $12,000
Software/Curriculum $0 $100 $100 $100 $100 $200 $200 $200 $200 $300 $200 $300
IPC Franchises $0 $0 $0 $0 $0 $5,000 $0 $0 $0 $0 $0 $2,500
5 day Manager/Teacher Training $7,500 $7,500 $15,000 $20,000 $27,000 $27,000 $27,000 $40,000 $35,000 $35,000 $41,500 $41,500
Consultancy Services $2,500 $3,500 $5,000 $8,000 $10,000 $10,000 $10,000 $10,000 $12,500 $15,250 $15,250 $18,000
Total Sales $12,000 $13,300 $22,700 $32,100 $43,100 $50,200 $49,200 $62,200 $59,700 $62,550 $68,950 $74,300
Direct Cost of Sales Jan Feb Mar Apr May Jun Jul Aug Sep Oct Nov Dec
Franchise Fees $3,500 $0 $0 $9,000 $0 $0 $0 $9,000 $0 $0 $0 $0
Teacher Training $300 $300 $300 $300 $300 $300 $300 $300 $300 $300 $300 $300
Curriculum & Software $1,000 $0 $0 $0 $1,350 $0 $0 $0 $0 $0 $0 $1,500
Consulting License $6,000 $0 $0 $0 $0 $0 $0 $0 $0 $0 $0 $0
IPC Onsite Training $5,000 $5,000 $5,000 $5,000 $5,000 $5,000 $5,000 $5,000 $5,000 $5,000 $5,000 $5,000
Other $1,466 $1,466 $1,466 $1,466 $1,466 $1,466 $1,466 $1,466 $1,466 $1,466 $1,466 $1,466
Local Consultants/Trainers $6,750 $6,750 $6,750 $6,750 $6,750 $6,750 $6,750 $6,750 $6,750 $6,750 $6,750 $6,750
Subtotal Direct Cost of Sales $24,016 $13,516 $13,516 $22,516 $14,866 $13,516 $13,516 $22,516 $13,516 $13,516 $13,516 $15,016
Page 1

Appendix
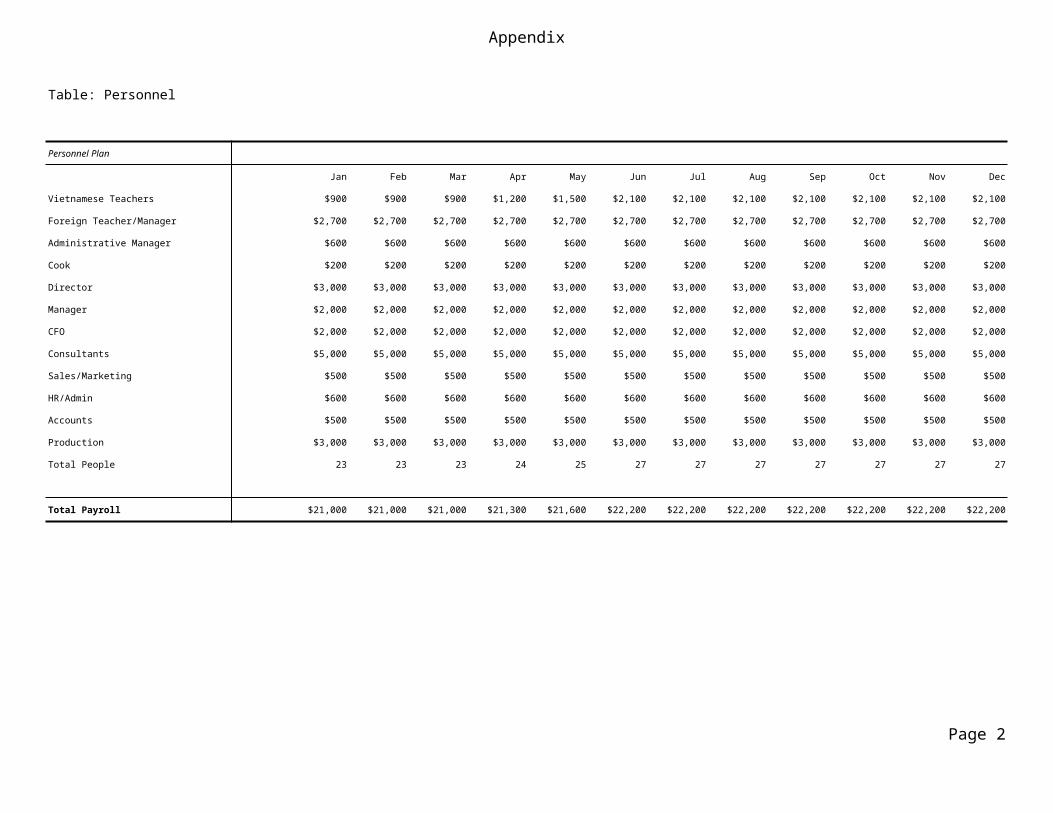
Table: Personnel
Personnel Plan
Jan Feb Mar Apr May Jun Jul Aug Sep Oct Nov Dec
Vietnamese Teachers $900 $900 $900 $1,200 $1,500 $2,100 $2,100 $2,100 $2,100 $2,100 $2,100 $2,100
Foreign Teacher/Manager $2,700 $2,700 $2,700 $2,700 $2,700 $2,700 $2,700 $2,700 $2,700 $2,700 $2,700 $2,700
Administrative Manager $600 $600 $600 $600 $600 $600 $600 $600 $600 $600 $600 $600
Cook $200 $200 $200 $200 $200 $200 $200 $200 $200 $200 $200 $200
Director $3,000 $3,000 $3,000 $3,000 $3,000 $3,000 $3,000 $3,000 $3,000 $3,000 $3,000 $3,000
Manager $2,000 $2,000 $2,000 $2,000 $2,000 $2,000 $2,000 $2,000 $2,000 $2,000 $2,000 $2,000
CFO $2,000 $2,000 $2,000 $2,000 $2,000 $2,000 $2,000 $2,000 $2,000 $2,000 $2,000 $2,000
Consultants $5,000 $5,000 $5,000 $5,000 $5,000 $5,000 $5,000 $5,000 $5,000 $5,000 $5,000 $5,000
Sales/Marketing $500 $500 $500 $500 $500 $500 $500 $500 $500 $500 $500 $500
HR/Admin $600 $600 $600 $600 $600 $600 $600 $600 $600 $600 $600 $600
Accounts $500 $500 $500 $500 $500 $500 $500 $500 $500 $500 $500 $500
Production $3,000 $3,000 $3,000 $3,000 $3,000 $3,000 $3,000 $3,000 $3,000 $3,000 $3,000 $3,000
Total People 23 23 23 24 25 27 27 27 27 27 27 27
Total Payroll $21,000 $21,000 $21,000 $21,300 $21,600 $22,200 $22,200 $22,200 $22,200 $22,200 $22,200 $22,200
Page 2
Appendix
Table: Profit and Loss
Pro Forma Profit and Loss
Jan Feb Mar Apr May Jun Jul Aug Sep Oct Nov Dec
Sales $12,000 $13,300 $22,700 $32,100 $43,100 $50,200 $49,200 $62,200 $59,700 $62,550 $68,950 $74,300
Direct Cost of Sales $24,016 $13,516 $13,516 $22,516 $14,866 $13,516 $13,516 $22,516 $13,516 $13,516 $13,516 $15,016
Other Costs of Sales $0 $0 $0 $0 $0 $0 $0 $0 $0 $0 $0 $0
Total Cost of Sales $24,016 $13,516 $13,516 $22,516 $14,866 $13,516 $13,516 $22,516 $13,516 $13,516 $13,516 $15,016
Gross Margin ($12,016) ($216) $9,184 $9,584 $28,234 $36,684 $35,684 $39,684 $46,184 $49,034 $55,434 $59,284
Gross Margin % -100.13% -1.62% 40.46% 29.86% 65.51% 73.08% 72.53% 63.80% 77.36% 78.39% 80.40% 79.79%
Expenses
Payroll $21,000 $21,000 $21,000 $21,300 $21,600 $22,200 $22,200 $22,200 $22,200 $22,200 $22,200 $22,200
Marketing/Promotion $1,200 $0 $0 $0 $0 $0 $0 $0 $0 $0 $0 $0
Depreciation $125 $125 $125 $125 $125 $125 $125 $125 $125 $125 $125 $125
Rent $4,000 $4,000 $4,000 $4,000 $4,000 $4,000 $4,000 $4,000 $4,000 $4,000 $4,000 $4,000
Utilities $250 $250 $250 $250 $250 $250 $250 $250 $250 $250 $250 $250
Insurance 15% $88 $88 $88 $88 $88 $88 $88 $88 $88 $88 $88 $88 Payroll Taxes 15% $3,150 $3,150 $3,150 $3,195 $3,240 $3,330 $3,330 $3,330 $3,330 $3,330 $3,330 $3,330
Total Operating Expenses $29,813 $28,613 $28,613 $28,958 $29,303 $29,993 $29,993 $29,993 $29,993 $29,993 $29,993 $29,993
Profit Before Interest and Taxes ($41,829) ($28,829) ($19,429) ($19,374) ($1,069) $6,691 $5,691 $9,691 $16,191 $19,041 $25,441 $29,291
EBITDA ($41,704) ($28,704) ($19,304) ($19,249) ($944) $6,816 $5,816 $9,816 $16,316 $19,166 $25,566 $29,416
Interest Expense $2,042 $2,042 $2,042 $2,042 $2,042 $2,042 $2,042 $2,042 $2,042 $2,042 $2,042 $2,042
Taxes Incurred $0 $0 $0 $0 $0 $0 $0 $0 $0 $0 $0 $0
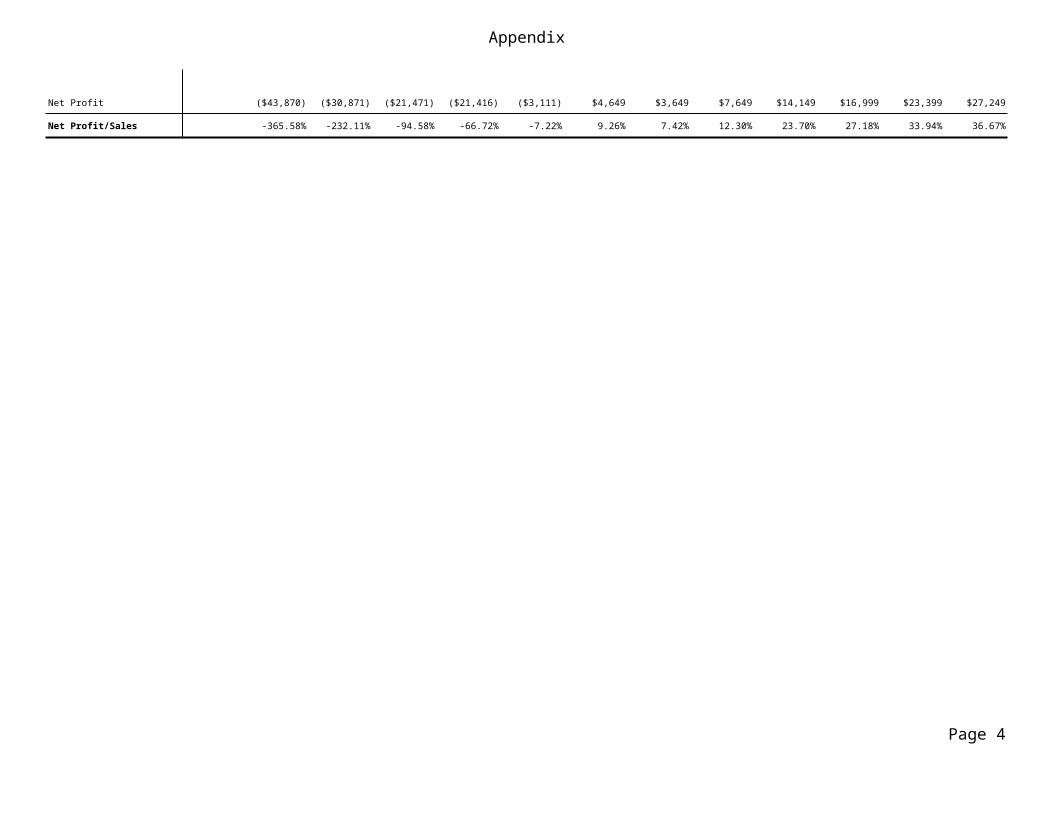
Net Profit ($43,870) ($30,871) ($21,471) ($21,416) ($3,111) $4,649 $3,649 $7,649 $14,149 $16,999 $23,399 $27,249
Net Profit/Sales -365.58% -232.11% -94.58% -66.72% -7.22% 9.26% 7.42% 12.30% 23.70% 27.18% 33.94% 36.67%
Page 3
Appendix
Page 4
Appendix
Table: Cash Flow
Pro Forma Cash Flow
Jan Feb Mar Apr May Jun Jul Aug Sep Oct Nov Dec
Cash Received
Cash from Operations
Cash Sales $12,000 $13,300 $22,700 $32,100 $43,100 $50,200 $49,200 $62,200 $59,700 $62,550 $68,950 $74,300
Subtotal Cash from Operations $12,000 $13,300 $22,700 $32,100 $43,100 $50,200 $49,200 $62,200 $59,700 $62,550 $68,950 $74,300
Additional Cash Received
Sales Tax, VAT, HST/GST Received 0.00% $0 $0 $0 $0 $0 $0 $0 $0 $0 $0 $0 $0
New Current Borrowing $0 $0 $0 $0 $0 $0 $0 $0 $0 $0 $0 $0
New Other Liabilities (interest-free) $0 $0 $0 $0 $0 $0 $0 $0 $0 $0 $0 $0
New Long-term Liabilities $0 $0 $0 $0 $0 $0 $0 $0 $0 $0 $0 $0
Sales of Other Current Assets $0 $0 $0 $0 $0 $0 $0 $0 $0 $0 $0 $0
Sales of Long-term Assets $0 $0 $0 $0 $0 $0 $0 $0 $0 $0 $0 $0
New Investment Received $0 $0 $0 $0 $0 $0 $0 $0 $0 $0 $0 $0
Subtotal Cash Received $12,000 $13,300 $22,700 $32,100 $43,100 $50,200 $49,200 $62,200 $59,700 $62,550 $68,950 $74,300
Expenditures Jan Feb Mar Apr May Jun Jul Aug Sep Oct Nov Dec
Expenditures from Operations
Cash Spending $21,000 $21,000 $21,000 $21,300 $21,600 $22,200 $22,200 $22,200 $22,200 $22,200 $22,200 $22,200
Bill Payments $1,158 $34,355 $23,046 $23,347 $31,837 $24,444 $23,226 $23,526 $31,926 $23,226 $23,226 $23,276
Subtotal Spent on Operations $22,158 $55,355 $44,046 $44,647 $53,437 $46,644 $45,426 $45,726 $54,126 $45,426 $45,426 $45,476
Additional Cash Spent
Sales Tax, VAT, HST/GST Paid Out $0 $0 $0 $0 $0 $0 $0 $0 $0 $0 $0 $0
Principal Repayment of Current Borrowing $0 $0 $0 $0 $0 $0 $0 $0 $0 $0 $0 $0
Other Liabilities Principal Repayment $0 $0 $0 $0 $0 $0 $0 $0 $0 $0 $0 $0
Long-term Liabilities Principal Repayment $0 $0 $0 $0 $0 $0 $0 $0 $0 $0 $0 $0
Page 5

Appendix
Purchase Other Current Assets $0 $0 $0 $0 $0 $0 $0 $0 $0 $0 $0 $0
Purchase Long-term Assets $0 $0 $0 $0 $0 $0 $0 $0 $0 $0 $0 $0
Dividends $0 $0 $0 $0 $0 $0 $0 $0 $0 $0 $0 $0
Subtotal Cash Spent $22,158 $55,355 $44,046 $44,647 $53,437 $46,644 $45,426 $45,726 $54,126 $45,426 $45,426 $45,476
Net Cash Flow ($10,158) ($42,055) ($21,346) ($12,547) ($10,337) $3,556 $3,774 $16,474 $5,574 $17,124 $23,524 $28,824
Cash Balance $119,742 $77,687 $56,341 $43,794 $33,457 $37,013 $40,787 $57,262 $62,836 $79,960 $103,485 $132,309
Page 6
Appendix
Table: Balance Sheet
Pro Forma Balance Sheet
Jan Feb Mar Apr May Jun Jul Aug Sep Oct Nov Dec
Assets Starting Balances
Current Assets
Cash $129,900 $119,742 $77,687 $56,341 $43,794 $33,457 $37,013 $40,787 $57,262 $62,836 $79,960 $103,485 $132,309 Other Current Assets $17,858 $17,858 $17,858 $17,858 $17,858 $17,858 $17,858 $17,858 $17,858 $17,858 $17,858 $17,858 $17,858 Total Current Assets $147,758 $137,600 $95,545 $74,199 $61,652 $51,315 $54,871 $58,645 $75,120 $80,694 $97,818 $121,343 $150,167
Long-term Assets
Long-term Assets $10,000 $10,000 $10,000 $10,000 $10,000 $10,000 $10,000 $10,000 $10,000 $10,000 $10,000 $10,000 $10,000 Accumulated Depreciation $0 $125 $250 $375 $500 $625 $750 $875 $1,000 $1,125 $1,250 $1,375 $1,500 Total Long-term Assets $10,000 $9,875 $9,750 $9,625 $9,500 $9,375 $9,250 $9,125 $9,000 $8,875 $8,750 $8,625 $8,500 Total Assets $157,758 $147,475 $105,295 $83,824 $71,152 $60,690 $64,121 $67,770 $84,120 $89,569 $106,568 $129,968 $158,667
Liabilities and Capital Jan Feb Mar Apr May Jun Jul Aug Sep Oct Nov Dec
Current Liabilities
Accounts Payable $0 $33,587 $22,277 $22,277 $31,021 $23,669 $22,451 $22,451 $31,151 $22,451 $22,451 $22,451 $23,901 Current Borrowing $122,500 $122,500 $122,500 $122,500 $122,500 $122,500 $122,500 $122,500 $122,500 $122,500 $122,500 $122,500 $122,500 Other Current Liabilities $0 $0 $0 $0 $0 $0 $0 $0 $0 $0 $0 $0 $0 Subtotal Current Liabilities $122,500 $156,087 $144,777 $144,777 $153,521 $146,169 $144,951 $144,951 $153,651 $144,951 $144,951 $144,951 $146,401
Long-term Liabilities $0 $0 $0 $0 $0 $0 $0 $0 $0 $0 $0 $0 $0 Total Liabilities $122,500 $156,087 $144,777 $144,777 $153,521 $146,169 $144,951 $144,951 $153,651 $144,951 $144,951 $144,951 $146,401
Paid-in Capital $122,508 $122,508 $122,508 $122,508 $122,508 $122,508 $122,508 $122,508 $122,508 $122,508 $122,508 $122,508 $122,508 Retained Earnings ($87,250) ($87,250) ($87,250) ($87,250) ($87,250) ($87,250) ($87,250) ($87,250) ($87,250) ($87,250) ($87,250) ($87,250) ($87,250)Earnings $0 ($43,870) ($74,741) ($96,212) ($117,627) ($120,738) ($116,089) ($112,439) ($104,790) ($90,641) ($73,641) ($50,242) ($22,993)Total Capital $35,258 ($8,612) ($39,483) ($60,954) ($82,369) ($85,480) ($80,831) ($77,181) ($69,532) ($55,383) ($38,383) ($14,984) $12,265 Total Liabilities and Capital $157,758 $147,475 $105,295 $83,824 $71,152 $60,690 $64,121 $67,770 $84,120 $89,569 $106,568 $129,968 $158,667
Net Worth $35,258 ($8,612) ($39,483) ($60,954) ($82,369) ($85,480) ($80,831) ($77,181) ($69,532) ($55,383) ($38,383) ($14,984) $12,265
Page 7


