Copyright 2018 CompPharma, LLCAll rights reserved, distribution or dissemination without express written permission prohibited Any use of this document without permission for marketing or other purposes is prohibited 2
Prescription Drug Management in Workers’ Compensation The Fifteenth Annual Survey Report (2017 data)
Copyright 2018 CompPharma, LLCAll rights reserved, distribution or dissemination without express written permission prohibited Any use of this document without permission for marketing or other purposes is prohibited 1
IntroductionOver the last eight years, workers’ compensation prescription drug costs have decreased by approximately $1.1 billion. In large part this has been driven by a dramatic decline in opioid usage and cost, particularly for new claimants.
Prescription drugs have long been a critical issue in workers’ compensation. Accounting for one of every seven medical dollars, pharmacy’s impact on patient recovery, disability duration, return to work, and claim settlement outweighs the benefit’s dollar expense. Each year pharmacy is the subject of much research on the part of such august organizations as the California Workers’ Compensation Institute (CWCI), National Council on Compensation Insurance (NCCI), the Workers’ Compensation Research Institute (WCRI), and others. The purpose of this survey is to add depth to our understanding of the issue, supplementing statistical and systemic research by adding the perspectives and data of state funds, insurers, third-party administrators, and self-insured employers.
This is the 15th year the survey has been conducted. For the first six years Health Strategy Associates, LLC, my consulting firm, was responsible for the survey. I’m also the president of CompPharma, LLC, a workers’ compensation pharmacy advocacy and education firm, and the responsibility for the survey was transferred to CompPharma in 2009.
As workers’ compensation pharmacy management has evolved over the years, so has this survey. While it remains focused on cost trends and drivers, market needs, PBM capabilities, and program results along with opinions, perceptions, and attitudes about pharmacy management in workers’ compensation, we have added and deleted questions over time. Special attention is paid to emerging issues, management approaches, problems and solutions, along with the evaluation of those solutions.
We wish to express our thanks to the workers’ compensation professionals who carefully and thoughtfully responded to the survey. Their willing participation is deeply appreciated. All responses are confidential, and care has been taken to “sanitize” responses to protect the anonymity of the respondents.
Interviews were conducted in the spring of 2018, with data on pharmacy spend and other metrics derived from respondents’ 2017 results.
Copyright 2018 CompPharma, LLCAll rights reserved, distribution or dissemination without express written permission prohibited Any use of this document without permission for marketing or other purposes is prohibited 2
Editorial note — Readers should not confuse “price” with “cost.” In this report, “cost” is defined as total drug expenses for a payer. Price is a contributor to cost, as is utilization, or the number and type of drugs dispensed. Think of cost as Cost = Price x Utilization.
Summary of ResultsThe structural decline in drug costs we’ve been seeing for the last seven years continued in 2017, as workers’ compensation pharmacy costs decreased 9.8% across all 29 payers surveyed.
This was driven in large part by significant reductions in opioid spend, which was in turn, the result of continued focus on improving clinical management programs, expanding utilization review and prior authorization, more involvement of clinicians in claims management, and more structured drug alerts and alert management processes.
All but four of the 29 state funds, insurers, TPAs, and self-insured employers surveyed spent less on drugs in 2017 than during the previous year, with seven respondents reporting declines greater than 15%.
Survey results over the last eight years indicate drug costs dropped in six of those eight years; spend today is 31.5% lower than it was eight years ago. Payers experiencing decreases in drug costs identified decreased usage of opioids and compounds, a variety of changes and improvements to clinical management programs, and lower claim volumes as key drivers of lower spending.
Compounds, unscrupulous prescribers and dispensers gaming the system, drug price inflation, and implementing state formularies were named as the emerging issues of most concern to payers. There was no consensus about the single “biggest problem” in workers’ compensation pharmacy management.
The continued consolidation in the PBM industry was again a topic of this year’s survey, with responses all across the board. Respondents’ views ranged from “very enthused” about the potential for lower costs and more capabilities, to concerns about fewer competitors fighting for business, a possible reduction in PBM flexibility due to consolidation of merged operations, and loss of key staff after mergers.
Copyright 2018 CompPharma, LLCAll rights reserved, distribution or dissemination without express written permission prohibited Any use of this document without permission for marketing or other purposes is prohibited 3
External FactorsPharmacy management in workers’ compensation does not occur in a vacuum. Outside factors profoundly affect pharmacy in workers’ compensation including:
• The Affordable Care Act’s expansion of insurance coverage and more recent efforts by the Trump Administration to claw back expansion of coverage;
• Societal issues, such as the explosive growth in opioid abuse and misuse and the introduction of new brand drugs and patent expiration;
• Generic price inflation;• The public’s outcry about drug prices and political reaction to that outcry;• Practice-pattern evolution, and• Pharmaceutical marketing practices .
Drivers specific to workers’ compensation, such as fee schedule changes, implementation of state-regulated formularies, claim frequency, physician dispensing and novel drugs, and unintended consequences of new regulations or legislation all affect utilization, costs and patient safety. However, respondents report that better programs — properly implemented — deliver better outcomes for patients, and thus lower loss costs.
BackgroundTotal workers’ comp pharmacy spend in 2017 was between $3.2 and $3.9 billion, with a “best guess” estimate of $3.7 billion. I recognize that figure is significantly lower than other estimates, however extensive analysis supports that total. After much research and study, it is clear it is not possible to precisely calculate workers’ compensation drug spend.
RespondentsRespondents were decision makers, clinical personnel, and operations staff in state funds, carriers, self-insured employers, and third-party administrators (TPAs) with drug expenses ranging from $1.1 million to $202 million. The 29 respondents’ 2017 drug costs totaled $891 million or about 22-to-27% of total workers’ compensation drug spend.
Copyright 2018 CompPharma, LLCAll rights reserved, distribution or dissemination without express written permission prohibited Any use of this document without permission for marketing or other purposes is prohibited 4
FindingsNotes:• We continue to use both quantitative and qualitative measures in the survey with the
questionnaire structured in such a way as to “triangulate” on specific issues and confirm opinions and perspectives, thereby providing readers with confidence in the survey’s findings;
• The quantitative questions use a 1-5 rating scale, with 1 on the low end (e.g., worse or less important) and 5 at the high end (best or most important);
• Not all respondents answered all questions and some respondents provided multiple answers to other questions, thus response rates/numbers will not always correlate with the total number of payers.
Inflation/trend in drug costsTotal drug costs dropped by 9.84% year over year, and costs are down 31.5% over the last eight years. In contrast, according to IQVIA’s April 2018 “Medicine Use and Spending in the US,”1 total national spend on medicines across all payer types declined by 2.1% last year. Clearly, the work done by regulators, PBMs and payers to attack what was once the fastest-growing component of workers’ compensation medical expenses has paid off.
After a 15-year downward trend (with occasional hiccups) one could reasonably expect some leveling off if not an actual increase in costs. That has yet to occur; why and how long this will last is a matter of keen interest to all stakeholders.
While last year a majority of respondents cited reduced claim counts as the primary reason for decreased costs, only a handful of respondents attributed decreases to lower claim inventory in 2017. Several noted aggressive efforts to close older claims as a factor. Since pharmacy accounts for an increasing percentage of spend as claims age, closing older claims has a disproportionate effect on pharmacy spend. Other reasons cited included:
• Dramatic reductions in compounds;• Changes in prescribing patterns driven by physician awareness of opioid risks;• State formularies and related utilization review process changes;• Relatively few new drugs on the market that are used for work comp conditions;• Significant customer loss.
In total a dozen respondents credited clinical programs as a key reason costs declined, and eight specifically named opioid reductions as a significant driver of cost reduction.
Copyright 2018 CompPharma, LLCAll rights reserved, distribution or dissemination without express written permission prohibited Any use of this document without permission for marketing or other purposes is prohibited 5
Notably, PBMs have been very successful at reducing the use of opioids and as a consequence, their own revenues. In particular, clinical programs have dramatically reduced the use of opioids and other very expensive drugs, many of which are used for months if not years.
Drug Cost Inflation Trend
Over the 15 years the survey has been conducted, the pharmacy cost inflation rate has decreased by 27.6 points. More significantly, over the last eight years, workers’ compensation drug spend has dropped by 31.5%, or approximately $1.1 billion.
The workers’ compensation pharmacy benefit management (PBM) industry came into its own about 16 years ago. While PBMs such as PMSI had long been active in the space, many — if not most payers — did not utilize PBMs until drug costs exploded. Those payers that did work with PBMs often did so on a file-by-file basis. With the dramatic increases in drug costs in the early part of the last decade, payers hurried to contract with PBMs and integrate them into their service offerings.
Originally delivering value through lower prices, most PBMs implemented basic drug management programs — tightening their drug formularies, promoting generic drugs, preventing early refills, and strengthening prior authorization processes — over the years. These clinical management programs continued to become more sophisticated and more
20.0%
15.0%
10.0%
5.0%
0%
-5.0%
-15.0%
-10.0%
2002 2004 2006 2008 2010 2012 2014 2016
Change in payer Y/Y spend
Linear (Change in payer Y/Y spend)
Copyright 2018 CompPharma, LLCAll rights reserved, distribution or dissemination without express written permission prohibited Any use of this document without permission for marketing or other purposes is prohibited 6
effective over time. Along with better script capture programs and more effective payer-PBM working relationships, clinical management programs led to decreases in utilization.
The size of the “problem”In response to the question “Where does prescription drug management rank compared to other medical cost areas at your organization?,” drug costs were rated as a 4.1, significantly more important; 3 being “drug costs are equally as important as other medical cost issues.”
Respondents (3.6) believe that in a year, drug issues will be somewhat more concerning than they are today. This is slightly below the average over the last five years. The takeaway is that while respondents are concerned about opioids, prices, compounds, and other specific issues. In general, they see pharmacy as fairly well controlled today.
Regulatory impactThis year we asked respondents to identify regulatory changes that would be most helpful in addressing pharmacy issues.
The top response was a combination of formularies and tight utilization review. However, there’s a good bit of nuance about this, as many respondents did NOT want to abandon their internal formularies in favor of a one-size-fits-all blanket formulary. These payers noted patients are all different, their needs evolve throughout the course of treatment and recovery, and therefore their pharmacy needs would change as well. While they were in favor of managed formularies for initial fills, they want flexibility to adapt to the patient’s condition and needs without putting undue burden on the prescriber and pharmacy to comply with prior authorization requirements.
The next most popular response was support for allowing employers to direct patients to network pharmacies. This exists (via regulation, legislation, case law, or other means) in NY, ND, OH, WA, CA, and LA today. Respondents viewed this as a simple, yet very effective solution to issues related to physician dispensing, compounding, and “independent” mail-order pharmacies. Notably, a handful of respondents want access to Prescription Drug Monitoring Programs, or PDMPs.
The Biggest Problem(s)The survey’s final question asks respondents to identify the single biggest problem in workers’ compensation pharmacy. Similar to 2017’s report, the answers were diverse indeed, with no single category capturing more than seven mentions. Leading issues were:
Copyright 2018 CompPharma, LLCAll rights reserved, distribution or dissemination without express written permission prohibited Any use of this document without permission for marketing or other purposes is prohibited 7
• Prescriber behavior;• Pricing and pricing transparency;• Opioids;• Systemic complexity and impact on managing pharmacy;• Regulatory compliance and related issues.
In addition, some respondents are quite concerned about consolidation and fear they will suffer collateral damage as the mega-PBMs standardize their products and services, requiring their customers to fit within the PBM’s operational box. This is a critical issue in what is a very mature, consolidating industry. The role of PBMs, the market’s perception of PBMs’ role and value, and how that will evolve over the near term should be top-of-mind for PBMs and payers. If ignored, PBMs will lose the ability to remain the or “a” leader in pharmacy management in workers’ comp.
OPIOIDSWhile we have focused on opioids for six years, this year’s survey dug much deeper into the issue, looking for insights from payers that have successfully reduced initial and chronic opioid usage. We will begin with a statistical review then dive into the details.
This year all respondents save three reported their total opioid spend. Opioids accounted for 24.2% of total drug spend, about 2.4 points lower than 2017’s figure and almost 4 points below 2016’s.
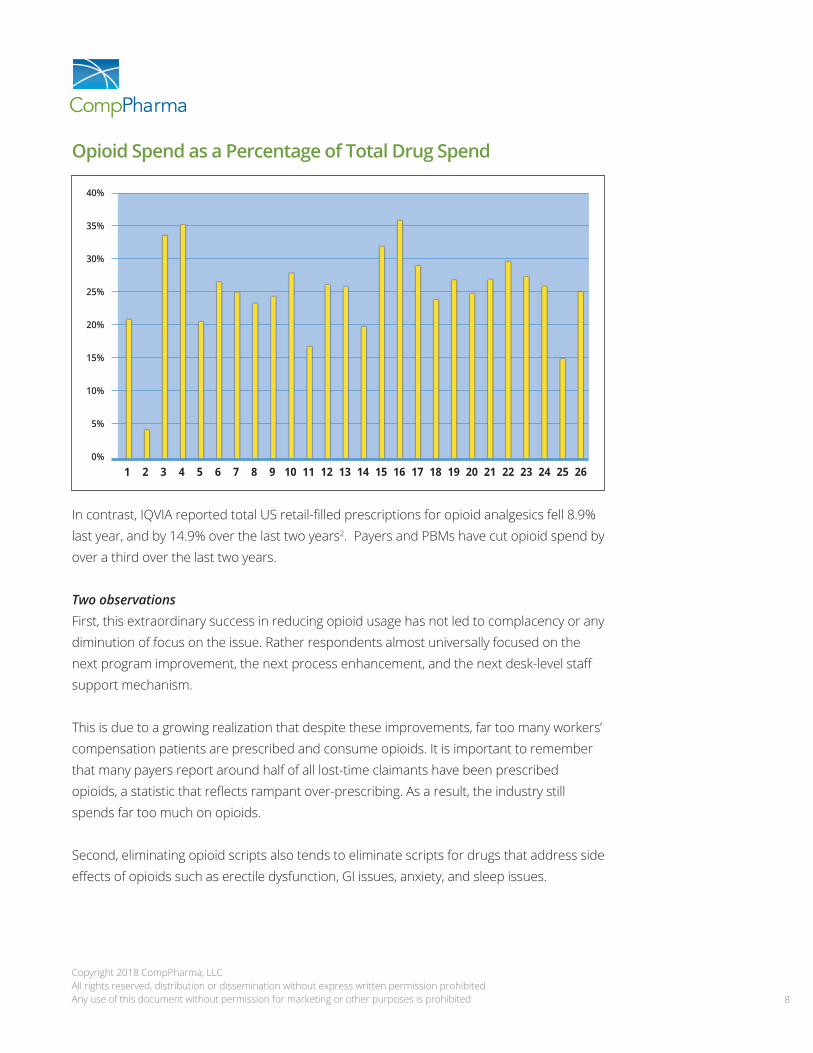
Opioid spend among respondents dropped precipitously last year; all respondents reported lower spend year over year, and only three had decreases less than 10%. Averaging all respondents’ results, opioid spend decreased 18.2%, almost five points greater than 2017’s 13.3%. The industry cut one out of every six dollars spent on opioids, a truly remarkable result. While it is important to note that total drug spending also decreased significantly, in most instances opioid spend dropped more than did overall spend (see graph below).
Copyright 2018 CompPharma, LLCAll rights reserved, distribution or dissemination without express written permission prohibited Any use of this document without permission for marketing or other purposes is prohibited 8
Opioid Spend as a Percentage of Total Drug Spend
In contrast, IQVIA reported total US retail-filled prescriptions for opioid analgesics fell 8.9% last year, and by 14.9% over the last two years2. Payers and PBMs have cut opioid spend by over a third over the last two years.
Two observations First, this extraordinary success in reducing opioid usage has not led to complacency or any diminution of focus on the issue. Rather respondents almost universally focused on the next program improvement, the next process enhancement, and the next desk-level staff support mechanism.
This is due to a growing realization that despite these improvements, far too many workers’ compensation patients are prescribed and consume opioids. It is important to remember that many payers report around half of all lost-time claimants have been prescribed opioids, a statistic that reflects rampant over-prescribing. As a result, the industry still spends far too much on opioids.
Second, eliminating opioid scripts also tends to eliminate scripts for drugs that address side effects of opioids such as erectile dysfunction, GI issues, anxiety, and sleep issues.
Copyright 2018 CompPharma, LLCAll rights reserved, distribution or dissemination without express written permission prohibited Any use of this document without permission for marketing or other purposes is prohibited 9
High among respondents’ concerns was the risk of addiction or dependency for claimants taking opioids; respondents said they were “very concerned” (4.6, essentially identical to prior years’ ratings). The consistently high level of concern is a strong indicator of the industry’s awareness of the impact of addiction.
Most respondents have a full range of programs in place today, but there is some opportunity, specifically for more payers to utilize pharmacists to review specific claims. Payers are finding this type of review is more cost-effective than a physician review; it is commonly provided by PBMs at no or little additional cost.
OPIOID MANAGEMENT — WHAT WORKS?There are two general strategies for addressing opioids 1) ensuring the initial script is medically necessary, not duplicative, and consistent with patient safety and 2) the much knottier issue of long-term opioid usage. While opioids do appear to help a few patients with chronic pain issues, research clearly indicates there are far less dangerous options that work for most patients. Thus, prescribers and payers alike have been working to reduce the number of patients prescribed opioids for long periods of time, and the dosage for those patients who remain on opioids.
Some payers are having success helping long-time opioid patients reduce or end opioid usage, however the raw numbers don’t tell the whole story. Four (4) respondents reported “very little” progress, 13 “some” progress, 7 “significant” progress, and 2 “very significant” progress. Digging into the individual responses, we find that the payers reporting significant or very significant progress are almost all single-state entities or self-insured employers.
New and emerging issuesNew issues related to opioids were the most frequently-mentioned issue. There was a lot of nuance in responses, reflecting respondents’ growing depth of knowledge about opioid-related issues such as:
• The importance of Prescription Drug Monitoring Programs and the need for access by PBMs to PDMP information;
• Challenges implementing new regulatory guidelines, chronic pain treatment guidelines, and formularies;
• Rapid adoption of legislation by states on opioid prescription limits and prescribing requirements and the role of the PBM/payer in monitoring/enforcing compliance;
• California prescribers’ lack of compliance with new documentation requirements around weaning, etc.
Copyright 2018 CompPharma, LLCAll rights reserved, distribution or dissemination without express written permission prohibited Any use of this document without permission for marketing or other purposes is prohibited 10
Clearly, respondents — tasked with both managing opioids and remaining compliant with all applicable laws and regulations — are feeling challenged, if not overwhelmed, by the onslaught of new legislation dealing with opioid prescribing, monitoring, reporting, and where necessary, intervention. On top of this, there are more formularies being put in place, different utilization review (UR) requirements and processes in each state, and workers’ compensation-specific chronic pain and related guidelines that require compliance from payers and prescribers alike.
While the tools can be helpful, the sense is formularies are helpful for initial scripts, but place a significant burden on payers seeking to modify prescribing behavior for long-term claimants.
Last year, respondents’ second most common concern involved the regulatory environment, with respondents expressing concerns over formularies and the implementation and “enforcement” thereof. Clearly the level of concern has increased.
GenericsAccording to the latest NCCI’s AIS 2015 Impact of Rx Fee Schedules3 authored by Natasha Moore, generic drugs accounted for 78% of all transactions in 2013 but only 44% of costs. This is a key metric, as the higher the generic penetration, the lower the cost. Recall that NCCI does not include data from every state, but does capture almost all data from the states in which it collects data.
For our purposes, “generic fill” is that percentage of ALL scripts that are filled with generics. As often is the case, different payers use somewhat different definitions and formulas, and therefore these numbers may not be entirely consistent. With that caveat, the generic fill rate across all respondents reached 87% in 2016, an all-time high for this survey. In 2017, fill rates were fractionally lower at 86.6%, an insignificant change.
Retail network penetration Network penetration increased to 87.6% last year, close to 2015’s all-time high of 89.0%. Since 2008, penetration has increased 13 points. The increase is likely attributable to a different mix of respondents this year and an increase in bills from third-party billers, physician dispensers, and independent mail order pharmacies such as Injured Workers Pharmacy (IWP).
Copyright 2018 CompPharma, LLCAll rights reserved, distribution or dissemination without express written permission prohibited Any use of this document without permission for marketing or other purposes is prohibited 11
When one considers that the average first-fill rate is likely below 40% and first fills account for an estimated one-third of all scripts, most payers’ actual network penetration may well be less than 87.6%. Readers would be well served to ensure they are using an “apples to apples” basis when comparing PBM penetration rates. (CompPharmaPedia’s suggested definition is “the percentage of all billed prescriptions [electronic and paper claims] which were filled without third-party billing (TPB) involvement at participating pharmacies.”)4
Mail orderMail order penetration has been up and down over the last seven years, but it has never been significant. This year’s 5.4% was among the highest we have recorded. It is puzzling indeed why some payers continue to ignore the many benefits associated with mail order.
Drug testingThis was the seventh year we asked respondents if they were using a urine drug testing (UDT) program. Six years ago, half of all respondents utilized a “formal” UDT program to monitor claimant compliance; today two-thirds of respondents do.
That finding is also appreciably higher than last year’s when half of respondents implemented a formal UDT program. Most payers do support UDT, however some do not have directly contracted vendors in place and/or leave that decision to the prescribing physician. This represents an opportunity, as the literature is replete with evidence that there is far too little drug testing of a majority of opioid-prescribed patients, and far too much testing of a relatively small subset. The latter is likely due to the profits generated by drug testing for physicians that own or have a financial stake in a lab.
Compound medicationsThere has been a 49% reduction in compound usage among respondents with data for 2016 and 2017. Of the respondents who provided figures for 2016 and 2017, only one saw an increase in total compounds reimbursed.
This confirms our preliminary conclusion in last year’s report that 2015’s significant increase was a short-term problem as regulators and payers took quick and decisive action to address the issue. As last year’s report also showed a significant year-over-year decline, it appears that what was viewed as an alarming problem is no longer a cause for concern.
Further evidence of the change comes from 2016’s survey, when compounds figured prominently in responses to the survey’s final question, “What is the single biggest problem
Copyright 2018 CompPharma, LLCAll rights reserved, distribution or dissemination without express written permission prohibited Any use of this document without permission for marketing or other purposes is prohibited 12
in workers’ comp pharmacy today?” This year, no respondents thought compounds merited that level of concern.
How about those PBMs?A metric that provides some perspective on payers’ views of the PBM industry is respondents’ “impression of these firms as vendor-partners to help you control your workers’ compensation prescription drug program.” Respondents rated six PBMs, with CorVel receiving a 2.1 (probably would not consider), while the other PBMs identified above were all rated as “would consider” or higher.
While there may be some concern about the future, respondents are quite pleased with their incumbent PBMs today. Asked to rate their current PBMs’ customer service, the average response was 4.3, equaling last year’s rating, indicating payers are somewhere between “very satisfied” and “extremely satisfied.” This is the highest customer service rating we’ve seen in 15 years.
ConclusionsSimilar to the long-term trend in reduced workers’ compensation claim frequency, the annual decrease in workers’ comp drug spend may now be structural.
The workers’ comp industry’s focus on and investment in managing pharmacy is entrenched, generally effective, and continuing to improve. As payers, prescribers and PBMs increase their efforts to help long-term opioid patients reduce and eliminate opioid usage, we will see a continued reduction in overall drug consumption and spend. This will be driven by lower opioid usage and elimination of drugs treating side effects of opioids.
While declining claim frequency is certainly a significant influence, clinical management programs, integration of PBM and payer systems and data flows, streamlined operations and script capture efforts, prescriber intervention and specific targeting of patients at high risk have significantly reduced drug spend and opioid usage.
PBMs and payers have made remarkable progress reducing the use of unnecessary, expensive, often dangerous, and highly problematic medications. Opioid spend is down, compound usage is being controlled, and employers’ and taxpayers’ costs are declining.
Copyright 2018 CompPharma, LLCAll rights reserved, distribution or dissemination without express written permission prohibited Any use of this document without permission for marketing or other purposes is prohibited 13
Notably, this is being driven in large part by PBMs, the very same entities that are losing revenues by delivering these programs. While far from perfect and needing significant changes in terms of utilization review processes, clinical guideline enforcement, and direction of care, patient care is improving, and the damage done by overprescribing of opioids is being addressed.
That said, payers are far from complacent. The continued and seemingly intractable problem of long-term use of opioids, the jumble of state regulations and rules dealing with workers’ compensation pharmacy, and the very real challenges facing adjusters due to high claims loads and training and IT deficits make it easy to understand why respondents continue to lose more sleep over pharmacy than other medical cost issues.
CompPharma is a consortium of workers’ compensation pharmacy benefit managers (PBMs) that identifies industry wide
problems and develops and delivers solutions. CompPharma’s member PBMs are:
Coventry Workers’ Comp Services/First Script
myMatrixx, an Express Scripts Company
Mitchell Pharmacy Solutions
End Notes1 https://www.iqvia.com/institute/reports/medicine-use-and-spending-in-the-us-review-of-2017-outlook-to-2022