25
CENTER FOR HEALTH INFORMATION AND ANALYSIS AUGUST 2018 PRESCRIPTION DRUG USE & SPENDING

CENTER FOR HEALTH INFORMATION AND ANALYSIS
AUGUST 2018
PRESCRIPTIONDRUG USE& SPENDING

1 Prescription Drug Use & Spending | August 2018 center for health information and analysisCHIA
Introduction 2
Therapeutic Classes Overview 4
Pharmacy Expenditures by Therapeutic Class 4Top 10 Therapeutic Classes, by Allowed Amount PMPM 5Top 10 Therapeutic Classes, by Allowed Amount: Percentage of Total Prescriptions 6Top 10 Therapeutic Classes, by Allowed Amount, per Prescription 7Top 10 Therapeutic Classes, by Allowed Amount: Payer Paid and Patient Out-of-Pocket PMPMs 8
Details on Top 10 Therapeutic Classes 9
Antivirials 10Antiarthritics 11CNS (Central Nervous System) Drugs 12Psychotherapeutic Drugs 13Antihyperglycemics 14Hormones 15Unclassified Drug Products 16Antiasthmatics 17Cardiovascular 18Gastrointestinal 19
Top 20 Drug Data Top Drugs Ranked by Number of Prescriptions 20
Top Drugs Ranked by Total Allowed Amount 21Top Drugs Ranked by Allowed Amount per Prescription 22
Glossary of Terms 23
Table of Contents

2 Prescription Drug Use & Spending | August 2018 center for health information and analysisCHIA
In the 2017 Annual Report on the Performance of the
Massachusetts Health Care System, the Center for Health
Information and Analysis (CHIA) identified pharmacy spending
as a major component of total health care expenditures
in Massachusetts, representing over 18% of commercial
spending in 2015 and 2016.¹ To further understand this
important sector of the health care system, this report looks
at drivers of pharmacy spending and presents information on
high volume and high cost drugs, as well as the associated
illnesses they are used to treat.
This initial report on prescription drug use and spending
concentrates on the top 10 therapeutic classes2 of drugs, as
ranked by total expenditures3 incurred during state fiscal year
(SFY) 2015.4 These therapeutic classes accounted for 71.3%
of pharmacy expenditures during that time period. In addition
to presenting average costs by therapeutic class, this report
contains detailed pages for each of these 10 therapeutic
classes, showing average costs for the top five most frequently
prescribed drugs within each class. The report concludes with
listings of the top drugs ranked by number of prescriptions,
total expenditures, and expenditures per prescription.
CHIA’s future reporting on pharmacy spending by therapeutic class
will also incorporate analyses of changes over time to help identify
shifting patterns of prescription drug utilization and costs.
This report utilized a subset of pharmacy claims data sourced
from CHIA’s All Payer Claims Database (APCD). This data subset
provides useful insight into spending at the individual drug and
Prescription Drug Use & Spending: Introduction and Overview
¹ See Total Medical Expenses (TME) Databook for CHIA’s 2017 Annual Report - TME by Service Category (commercial payers) 2 CHIA utilized First Databank’s generic therapeutic classification, which groups drugs into 45 different categories based on their pharmacological, chemical, and/or therapeutic characteristics
3 Expenditures represent the total allowed amount for a health insurance claim, which is a payer’s contracted maximum amount that it will allow to be paid for a claim See the glossary for more information
4 SFY 2015 is July 1, 2014 through June 30, 2015

3 Prescription Drug Use & Spending | August 2018 center for health information and analysisCHIA
therapeutic class levels, but it does not represent aggregate
statewide pharmacy spending and should not be used for such
analysis. The analysis in this report uses the “allowed amount,”
which includes the amount paid by a health plan to pharmacies
plus patient out-of-pocket costs like copay, deductibles,
or coinsurance. This report does not reflect the impact of
prescription drug rebates for prescription drugs, which may
have a significant impact on health plan spending.
The data included pharmacy claims for Massachusetts residents
from fully-insured commercial lines of business for the following
eight payers: Blue Cross Blue Shield of Massachusetts, Boston
Medical Center HealthNet Plan, CeltiCare Health, Fallon Health,
Harvard Pilgrim Health Care, Neighborhood Health Plan, Tufts
Health Plan, and Tufts Health Public Plans (formerly Network
Health). This report does not include self-insured plan data,
Medicaid, or Medicare data.
For additional information on the methods and data sources
used in this report, see the accompanying technical appendix
and databook.
For questions on this report, contact Lauren Almquist, Manager
of Analytics, at [email protected].

CHIAcenter for health information and analysis4
TOTAL ALLOWED AMOUNT PMPM: $82.12
Prescription Drug Use & Spending | July 2018
Pharmacy Expenditures by Therapeutic Class, SFY 2015Based on Total Allowed Amount PMPM
During SFY 2015, the total allowed
amount per member per month (PMPM)
for all 45 therapeutic classes was $82 12
Expenditures for the top 10 therapeutic
classes accounted for 71 3% of total
pharmacy expenditures
These top 10 therapeutic classes include
drugs used in the treatment of a wide
range of diseases, including HIV, hepatitis
C, arthritis, multiple sclerosis, epilepsy,
behavioral health disorders, diabetes,
asthma/COPD, hypertension, and
gastroesophageal reflux.
The remainder of this report focuses
primarily on costs for drugs within the top
10 therapeutic classes Additional data is
available in the accompanying databook
Future versions of this report will analyze
trends in pharmacy costs both within and
across therapeutic classes
THERAPEUTIC CLASSES OVERVIEW
Top 1071.3%
Other28.7%
Therapeutic Class
Allowed Amount PMPM %
Antivirals $9 03 11 0%
Antiarthritics $7 84 9 5%
CNS Drugs $7 70 9 4%
Psychotherapeutic Drugs
$7 40 9 0%
Antihyperglycemics $5 48 6 7%
Hormones $4 69 5 7%
Unclassified Drug Products
$4 36 5 3%
Antiasthmatics $4 31 5 2%
Cardiovascular $4 15 5 0%
Gastrointestinal $3 61 4 4%
All Other Classes Combined
$23 56 28 7%
TOTAL $82.12 100.0%
Top 10 Therapeutic Classes
$58.56 71.3%
Source: MA APCDNotes: CNS Drugs are Central Nervous System agents such as sedatives and stimulants. Antihyperglycemics include drugs to treat diabetes. Unclassified Drug Products include some non-drug products and drugs not otherwise categorized into the Therapeutic Classes as defined by First Databank; this class includes a wide variety of drugs; among the most common are Viagra, Cialis, and Suboxone.This report does not reflect the impact of prescription drug rebates.
August 2018

CHIAcenter for health information and analysisPrescription Drug Use & Spending | August 20185
Antivirals
Antiarthritics
CNS Drugs
PsychotherapeuticDrugs
Antihyperglycemics
Hormones
UnclassifiedDrug Products
Antiasthmatics
Cardiovascular
Gastrointestinal
$0 $1.00 $2.00 $3.00 $4.00 $5.00 $6.00 $7.00 $8.00 $9.00 $10.00
Allowed Amount PMPM
$9.03
$7.84
$7.70
$7.40
$5.48
$4.69
$4.36
$4.31
$4.15
$3.61
Allowed Amount PMPM, SFY 2015Top 10 Therapeutic Classes Ranked by Total Allowed Amount PMPM
Spending for the top 10 therapeutic classes
totaled $58 56 PMPM in SFY 2015 Some
therapeutic classes, such as Antivirals,
represented a relatively low percentage of
total prescriptions but had a high average
cost per prescription Spending on Antivirals
was driven by high cost drugs like Harvoni
and Sovaldi, while Psychotherapeutic and
Cardiovascular drug spending was due to
higher prescription volume but lower average
costs per prescription
TOP 10 THERAPEUTIC CLASSES OVERVIEW
Source: MA APCDNotes: CNS Drugs are Central Nervous System agents such as sedatives and stimulants. Antihyperglycemics include drugs to treat diabetes. Unclassified Drug Products include some non-drug products and drugs not otherwise categorized into the Therapeutic Classes as defined by First Databank; this class includes a wide variety of drugs; among the most common are Viagra, Cialis, and Suboxone.This report does not reflect the impact of prescription drug rebates.
TOP 10 CLASSES PMPM: $58.56

CHIAcenter for health information and analysisPrescription Drug Use & Spending | August 20186
The top 10 therapeutic classes accounted
for 55 5% of total prescriptions in SFY 2015
Together, Psychotherapeutic (15 5%) and
Cardiovascular (15 6%) drugs accounted for
31 1% of total prescriptions
Percentage of Total Prescriptions, SFY 2015Top 10 Therapeutic Classes Ranked by Total Allowed Amount PMPM
TOP 10 THERAPEUTIC CLASSES OVERVIEW
Source: MA APCDNotes: CNS Drugs are Central Nervous System agents such as sedatives and stimulants. Antihyperglycemics include drugs to treat diabetes. Unclassified Drug Products include some non-drug products and drugs not otherwise categorized into the Therapeutic Classes as defined by First Databank; this class includes a wide variety of drugs; among the most common are Viagra, Cialis, and Suboxone.This report does not reflect the impact of prescription drug rebates.
Antivirals
Antiarthritics
CNS Drugs
PsychotherapeuticDrugs
Antihyperglycemics
Hormones
UnclassifiedDrug Products
Antiasthmatics
Cardiovascular
Gastrointestinal
0% 2% 4% 6% 8% 10% 12% 14% 16% 18%
1.3%
2.8%
3.5%
15.5%
3.1%
2.6%
2.7%
3.8%
15.6%
4.4%
Percentage of Total Prescriptions

CHIAcenter for health information and analysisPrescription Drug Use & Spending | August 20187
Antivirals
Antiarthritics
CNS Drugs
PsychotherapeuticDrugs
Antihyperglycemics
Hormones
UnclassifiedDrug Products
Antiasthmatics
Cardiovascular
Gastrointestinal
$0 $100 $200 $300 $400 $500 $600 $700 $800 $900
$809
$330
$261
$209
$213
$191
$32
$97
Total Allowed Amount Per Prescription
$137
$57
The overall average cost per prescription
was $98 39 in SFY 2015 The Cardiovascular
and Psychotherapeutic therapeutic classes
had the two lowest average costs per
prescription (under $60) The average cost
per prescription for Antivirals was $809, more
than eight times the overall average
TOP 10 THERAPEUTIC CLASSES OVERVIEW
Allowed Amount Per Prescription, SFY 2015 Top 10 Therapeutic Classes Ranked by Total Allowed Amount PMPM
Source: MA APCDNotes: CNS Drugs are Central Nervous System agents such as sedatives and stimulants. Antihyperglycemics include drugs to treat diabetes. Unclassified Drug Products include some non-drug products and drugs not otherwise categorized into the Therapeutic Classes as defined by First Databank; this class includes a wide variety of drugs; among the most common are Viagra, Cialis, and Suboxone.This report does not reflect the impact of prescription drug rebates.
Average Allowed Amount per Prescription in SFY 2015 (All Therapeutic Classes)$98.39

CHIAcenter for health information and analysisPrescription Drug Use & Spending | August 20188
$0 $1.00 $2.00 $3.00 $4.00 $5.00 $6.00 $7.00 $8.00 $9.00 $10.00
Total Allowed Amount PMPM
Antivirals
Antiarthritics
CNS Drugs
PsychotherapeuticDrugs
Antihyperglycemics
Hormones
UnclassifiedDrug Products
Antiasthmatics
Cardiovascular
Gastrointestinal
The allowed amount includes the amount
paid by a health plan plus patient out-of-
pocket costs like copays, deductibles, or
coinsurance
Overall, health plans paid 86 1% of the total
allowed amount for the drugs assessed in
this report, while patients paid the remaining
13 9%
Within the top 10 therapeutic classes,
Cardiovascular drugs had the highest
proportion of patient out-of-pocket PMPM
costs, and Psychotherapeutic drugs had the
highest actual PMPM out-of-pocket costs for
patients These therapeutic classes also had
the lowest average costs per prescriptions of
the 10 classes
TOP 10 THERAPEUTIC CLASSES OVERVIEW
Payer Paid and Patient Out-of-Pocket PMPMs, SFY 2015 Top 10 Therapeutic Classes Ranked by Allowed Amount PMPM
Source: MA APCDNotes: CNS Drugs are Central Nervous System agents such as sedatives and stimulants. Antihyperglycemics include drugs to treat diabetes. Unclassified Drug Products include some non-drug products and drugs not otherwise categorized into the Therapeutic Classes as defined by First Databank; this class includes a wide variety of drugs; among the most common are Viagra, Cialis, and Suboxone.This report does not reflect the impact of prescription drug rebates.
PATIENT OUT-OF-POCKET PMPM: $11.38PLAN PAID PMPM: $70.74Overall, SFY 2015

Prescription Drug Use & Spending | August 2018 center for health information and analysis9
This section contains additional detail and cost data for the
most prescribed drugs within each of the top 10 therapeutic
classes for SFY 2015. Each page shows the following drug-level
information within each class:
• The five most-prescribed drugs by proportion of the
class’s total number of prescriptions, allowed amount per
prescription, and allowed amount per day’s supply.
• The proportion of prescriptions that were generic or brand-
name drugs within the class.
In addition, the following key data points are noted for each
therapeutic class:
• Allowed amount PMPM
• Percentage of total prescriptions in this report’s dataset
• Average cost (allowed amount) per prescription
Please see the technical appendix for more information on data
fields and methodology.
Note that the percentage axes on the “Top Five Most-Prescribed
Drugs by Percentage of Prescriptions” may be scaled differently
depending on the percentage values for each class.
Details on Top 10 Therapeutic Classes
CHIA

Drug Name Percentage of Total Prescriptions within Therapeutic ClassAllowed Amount per Prescription
Allowed Amount per Day’s Supply
Valacyclovir $ 29.43 $ 1.59
Acyclovir $ 42.40 $ 1.99
Tamiflu $ 124.58 $ 22.43
Truvada $ 1,655.22 $ 40.71
Famiciclovir $ 51.46 $ 3.41
MA APCDNotes: Most Prescribed Drugs refers to the highest number of prescriptions within therapeutic class.This report does not reflect the impact of prescription drug rebates.
Prescription Drug Use & Spending | August 2018
Antivirals
Antivirals are used to inhibit the production of
viruses that cause certain diseases Illnesses
caused by viruses include influenza, hepatitis
C, herpes, and HIV
Within the top 10 therapeutic classes,
Antivirals was the most expensive therapeutic
class by average cost per prescription
and it accounted for the highest share of
expenditures of all classes (11 0% of total
allowed amount) The most frequently
prescribed drugs within this class
(Valacyclovir and Acyclovir) accounted for
over 64% of the class’s prescriptions, but
were relatively inexpensive Valacyclovir and
Acyclovir are used to treat herpes, shingles,
and chicken pox
The Antivirals class also includes the
brand-name hepatitis C drugs Harvoni and
Sovaldi, which cost $31,024 and $27,863
per prescription, respectively Although these
two drugs together made up only 1 3% of the
total number of prescriptions for the class,
they accounted for almost half of the total
$9 03 allowed amount PMPM
THERAPEUTIC CLASS
Top Five Most Prescribed Drugs, SFY 2015
Percentage of Prescriptions Generic vs. Brand Name ALLOWED AMOUNT PMPM: $9.03
PERCENT OF TOTAL PRESCRIPTIONS: 1.3% AVERAGE COST PER PRESCRIPTION: $809
CHIAcenter for health information and analysis10
0% 10% 20% 30% 40% 50%
0% 10% 20% 30% 40% 50%
Brand Name30%
Generic70%

CHIAcenter for health information and analysisPrescription Drug Use & Spending | August 201811
Drug Name Percentage of Total Prescriptions within Therapeutic ClassAllowed Amount per Prescription
Allowed Amount per Day’s Supply
Ibuprofen $ 6.00 $ 0.33
Allopurinol $ 7.92 $ 0.17
Naxproxen $ 5.90 $ 0.23
Meloxicam $ 6.48 $ 0.19
Diclofenac Sodium $ 17.53 $ 0.58
Source: MA APCDNotes: Most Prescribed Drugs refers to the highest number of prescriptions within therapeutic class.This report does not reflect the impact of prescription drug rebates.
Antiarthritics
Antiarthritic drugs treat conditions such as
rheumatoid arthritis, osteoarthritis, and/
or help block the inflammation and tissue
damage of such conditions Some commonly
prescribed drugs in this category also treat
gout, fevers, and mild and moderate pain
caused by inflammation.
Four of the five most frequently prescribed
Antiarthritic drugs, which accounted for
57 0% of the total prescriptions within the
class, were nonsteroidal anti-inflammatories,
or NSAIDs (Ibuprofen, Naproxen, Meloxicam,
and Diclofenac Sodium)
Humira and Humira pens, with average costs
of over $3,500 per prescription, made up
50 1% of the total allowed amount in this
therapeutic class but made up less than 5%
of the total number of prescriptions for the
class
THERAPEUTIC CLASS
Top Five Most Prescribed Drugs, SFY 2015
Percentage of Prescriptions Generic vs. Brand Name ALLOWED AMOUNT PMPM: $7.84
PERCENT OF TOTAL PRESCRIPTIONS: 2.8% AVERAGE COST PER PRESCRIPTION: $330
0% 10% 20% 30% 40%
0% 10% 20% 30% 40%
Brand Name13%
Generic87%

CHIAcenter for health information and analysisPrescription Drug Use & Spending | August 201812
Drug Name Percentage of Total Prescriptions within Therapeutic ClassAllowed Amount per Prescription
Allowed Amount per Day’s Supply
Clonazepam $ 4.36 $ 0.15
Gabapentin $ 19.11 $ 0.56
Lamotrigine $ 9.01 $ 0.25
Topiramate $ 14.51 $ 0.41
Levetiracetam $ 31.04 $ 0.88
Source: MA APCDNotes: Most Prescribed Drugs refers to the highest number of prescriptions within therapeutic class.This report does not reflect the impact of prescription drug rebates.
Central Nervous System (CNS) Drugs
CNS Drugs affect the central nervous system,
which consists of nerves in the brain and
spinal cord CNS drugs include anesthetics,
anticonvulsants, muscle relaxants, certain
pain relievers, and sedatives Illnesses treated
by CNS drugs include multiple sclerosis (MS)
and Parkinson’s Disease
The five most frequently prescribed drugs
within this class were relatively inexpensive
and are primarily used to treat seizures
Cost drivers in this category included drugs
to treat MS, such as Copaxone ($5,248
per prescription) and Tecfidera ($5,260 per
prescription) These two drugs accounted
for 2 2% of prescriptions for this therapeutic
class
THERAPEUTIC CLASS
Top Five Most Prescribed Drugs, SFY 2015
Percentage of Prescriptions Generic vs. Brand Name ALLOWED AMOUNT PMPM: $7.70
PERCENT OF TOTAL PRESCRIPTIONS: 3.5% AVERAGE COST PER PRESCRIPTION: $261
5% 10% 15% 20% 25% 30%0%
5% 10% 15% 20% 25% 30%0%
Brand Name11%
Generic89%

CHIAcenter for health information and analysisPrescription Drug Use & Spending | August 201813
2% 4% 6% 8% 10% 12%0%
Drug Name Percentage of Total Prescriptions within Therapeutic ClassAllowed Amount per Prescription
Allowed Amount per Day’s Supply
Citalopram HBR $ 4.83 $ 0.13
Sertraline HCL $ 6.29 $ 0.17
Lorazepam $ 3.62 $ 0.15
Fluoxetine HCL $ 14.24 $ 0.39
Bupropion XL $ 30.86 $ 0.84
Source: MA APCDNotes: Most Prescribed Drugs refers to the highest number of prescriptions within therapeutic class.This report does not reflect the impact of prescription drug rebates.
Psychotherapeutic Drugs
Psychotherapeutic drugs are used to
treat a wide range of conditions including
depression, anxiety, and psychosis Drugs
included in this class also treat hyperactivity
and attention deficit disorder.
Psychotherapeutic drugs had the second
lowest average cost per prescription ($57)
of the top 10 therapeutic classes Three of
the five most frequently prescribed drugs
within this class (Citalopram, Sertraline,
and Fluoxetine HCL) were selective
serotonin reuptake inhibitors (SSRIs), which
are primarily used to treat depression
and accounted for over 30% of the total
prescriptions in this class
This class had the lowest proportion of brand
name drugs (5 9%) of the top 10 classes
Abilify, a brand name drug with an average
cost of $970 per prescription, accounted for
19 6% of the total allowed amount for this
class, but only 1 2% of the prescriptions
THERAPEUTIC CLASS
Top Five Most Prescribed Drugs, SFY 2015
Percentage of Prescriptions Generic vs. Brand Name ALLOWED AMOUNT PMPM: $7.40
PERCENT OF TOTAL PRESCRIPTIONS: 15.5% AVERAGE COST PER PRESCRIPTION: $57
2% 4% 6% 8% 10% 12%0%
Brand Name6%
Generic94%

CHIAcenter for health information and analysisPrescription Drug Use & Spending | August 201814
Drug Name Percentage of Total Prescriptions within Therapeutic ClassAllowed Amount per Prescription
Allowed Amount per Day’s Supply
Metformin HCL $ 7.05 $ 0.16
Metformin HCL ER $ 75.00 $ 1.74
Lantus Solostar $ 516.58 $ 11.95
Humalog $ 616.55 $ 13.93
Lantus $ 514.79 $ 12.90
Source: MA APCDNotes: Most Prescribed Drugs refers to the highest number of prescriptions within therapeutic class.This report does not reflect the impact of prescription drug rebates.
Antihyperglycemics
Antihyperglycemic drugs include insulin
and other medicines to treat diabetes by
counteracting high levels of glucose in the
blood
Metformin (HCL and HCL Extended Release)
is a relatively low cost oral drug used to treat
type 2 diabetes that accounted for over 44%
of this class’s prescriptions Injectable drugs
Lantus and Humalog, also in this class, were
significantly more expensive but made up a
smaller proportion of prescriptions
THERAPEUTIC CLASS
Top Five Most Prescribed Drugs, SFY 2015
Percentage of Prescriptions Generic vs. Brand Name ALLOWED AMOUNT PMPM: $5.48
PERCENT OF TOTAL PRESCRIPTIONS: 3.1% AVERAGE COST PER PRESCRIPTION: $209
5% 10% 15% 20% 25% 30% 35%0%
5% 10% 15% 20% 25% 30% 35%0%
Brand Name36%
Generic64%

CHIAcenter for health information and analysisPrescription Drug Use & Spending | August 201815
5% 10% 15% 20% 25% 30% 35%0%
Drug Name Percentage of Total Prescriptions within Therapeutic ClassAllowed Amount per Prescription
Allowed Amount per Day’s Supply
Prednisone $ 6.68 $ 0.44
Methylprednisolone $ 20.07 $ 2.76
Estradiol $ 38.61 $ 1.02
Vagifem $ 183.19 $ 4.42
Progesterone $ 64.11 $ 1.79
Source: MA APCDNotes: Most Prescribed Drugs refers to the highest number of prescriptions within therapeutic class.This report does not reflect the impact of prescription drug rebates.
Hormones
Hormones treat hormone-related conditions
or needs Conditions treated can include
menopausal symptoms, osteoporosis, fertility
issues, and growth delay or “wasting” caused
by some illnesses Contraceptives and
thyroid medications are not included in this
therapeutic class
Prednisone and Methylprednisolone, relatively
inexpensive generic drugs, accounted for
over 40% of total prescriptions in this class
They are steroids used to treat many different
autoimmune diseases and inflammatory
conditions, including allergic reactions,
asthma, and arthritis Other commonly
prescribed drugs in this class included
hormones that treat symptoms caused by
menopause or removal of ovaries (Estradiol
and Vagifem)
THERAPEUTIC CLASS
Top Five Most Prescribed Drugs, SFY 2015
Percentage of Prescriptions Generic vs. Brand Name ALLOWED AMOUNT PMPM: $4.69
PERCENT OF TOTAL PRESCRIPTIONS: 2.6% AVERAGE COST PER PRESCRIPTION: $213Brand Name
29%
Generic71%
5% 10% 15% 20% 25% 30% 35%0%

CHIAcenter for health information and analysisPrescription Drug Use & Spending | August 201816
5% 10% 15% 20%0%
Drug Name Percentage of Total Prescriptions within Therapeutic ClassAllowed Amount per Prescription
Allowed Amount per Day’s Supply
Viagra $ 136.70 $ 5.59
Tamsulosin HCL $ 24.51 $ 0.61
Cialis $ 147.71 $ 5.82
Chlorhexidine Gluconate $ 6.25 $ 0.34
Suboxone $ 235.79 $ 11.34
Source: MA APCDNotes: Most Prescribed Drugs refers to the highest number of prescriptions within therapeutic class.This report does not reflect the impact of prescription drug rebates.
Unclassified Drug Products
The Unclassified Drug Products therapeutic
class includes drugs not otherwise
categorized into one of the 44 other
therapeutic classes ¹ It includes drugs that
treat a range of conditions, including erectile
dysfunction and prostate disorders; drug
or alcohol dependence (e g , Suboxone,
Vivitrol); osteoporosis; and urinary tract
disorders
Viagra, Tamsulosin HCL, and Cialis, drugs
that treat erectile dysfunction and prostate
disorders, accounted for over 40% of the
prescriptions in this therapeutic class
Suboxone represented 7 0% of this class’s
prescriptions and had an average cost of
$236 per prescription
THERAPEUTIC CLASS
Top Five Most Prescribed Drugs, SFY 2015
Percentage of Prescriptions Generic vs. Brand Name ALLOWED AMOUNT PMPM: $4.36
PERCENT OF TOTAL PRESCRIPTIONS: 2.7% AVERAGE COST PER PRESCRIPTION: $191Brand Name
42%
Generic53%
1 Based on First Databank’s Generic Therapeutic Class grouping
5% 10% 15% 20%0%
Non-drugProduct 5%

CHIAcenter for health information and analysisPrescription Drug Use & Spending | August 201817
10% 20% 30% 40%0%
Drug Name Percentage of Total Prescriptions within Therapeutic ClassAllowed Amount per Prescription
Allowed Amount per Day’s Supply
Proair HFA $ 53.70 $ 2.11
Montelukast Sodium $ 21.38 $ 0.54
Flovent HFA $ 206.90 $ 6.00
Adviar Diskus $ 349.60 $ 9.50
Symbicort $ 292.79 $ 7.69
Source: MA APCDNotes: Most Prescribed Drugs refers to the highest number of prescriptions within therapeutic class.This report does not reflect the impact of prescription drug rebates.
Antiasthmatics
Antiasthmatics treat asthma symptoms
and chronic obstructive pulmonary disease
(COPD)
This therapeutic class had the highest
proportion of brand name drugs of the top
10 classes The most prescribed drug in this
class (36 9% of Antiasthmatics) was Proair
HFA, a brand name albuterol inhaler In 2008,
the FDA banned generic albuterol inhalers
that contained chlorofluorocarbons (CFCs)
and they were replaced with inhalers that
used hydrofluoroalkanes (HFAs). HFA inhalers
are newer and still under patent, which
contributed to this class having a high share
of brand name drugs compared to other
therapeutic classes
THERAPEUTIC CLASS
Top Five Most Prescribed Drugs, SFY 2015
Percentage of Prescriptions Generic vs. Brand Name ALLOWED AMOUNT PMPM: $4.31
PERCENT OF TOTAL PRESCRIPTIONS: 3.8% AVERAGE COST PER PRESCRIPTION: $137Brand Name
77%
Generic23%
10% 20% 30% 40%0%

CHIAcenter for health information and analysisPrescription Drug Use & Spending | August 201818
5% 10% 15% 20% 25%0%
Cardiovascular
Cardiovascular drugs treat medical
conditions associated with blood vessels,
such as arrhythmias, blood clots, coronary
artery disease, high or low blood pressure,
high cholesterol, heart failure, or stroke
This class, which includes statins and beta
blockers, had the lowest average cost per
prescription among the top 10 classes in
this report Lisinopril, which treats high
blood pressure and heart failure, and
Simvastatin, a cholesterol-lowering drug,
were two of the top three prescribed drugs
across all therapeutic classes during SFY
2015 In addition, these two drugs were
relatively inexpensive ($5 00 and $7 54 per
prescription, respectively)
THERAPEUTIC CLASS
Drug Name Percentage of Total Prescriptions within Therapeutic ClassAllowed Amount per Prescription
Allowed Amount per Day’s Supply
Lisinopril $ 5.00 $ 0.11
Simvastatin $ 7.54 $ 0.16
Atorvastatin Calcium $ 20.43 $ 0.46
Atenolol $ 5.24 $ 0.11
Metoprolol Succinate $ 26.73 $ 0.67
Source: MA APCDNotes: Most Prescribed Drugs refers to the highest number of prescriptions within therapeutic class.This report does not reflect the impact of prescription drug rebates.
Top Five Most Prescribed Drugs, SFY 2015
Percentage of Prescriptions Generic vs. Brand Name ALLOWED AMOUNT PMPM: $4.15
PERCENT OF TOTAL PRESCRIPTIONS: 15.6% AVERAGE COST PER PRESCRIPTION: $32Brand Name
5%
Generic95%
5% 10% 15% 20% 25%0%

CHIAcenter for health information and analysisPrescription Drug Use & Spending | August 201819
10% 20% 30% 40% 50%0%
Gastrointestinal
Gastrointestinal drugs treat disorders of
the digestive system, such as conditions
caused by excess stomach acid (e g ,
gastroesophageal reflux disease, or
GERD), chronic irritable bowel syndrome,
constipation, and nausea
Nearly 40% of prescriptions in this class
were for Omeprazole, which is a relatively
inexpensive ($10 85 per prescription) generic
drug used to treat heartburn, stomach ulcers,
and GERD
THERAPEUTIC CLASS
Drug Name Percentage of Total Prescriptions within Therapeutic ClassAllowed Amount per Prescription
Allowed Amount per Day’s Supply
Omeprazole $ 10.85 $ 0.27
Pantoprazole Sodium $ 15.39 $ 0.39
Ranitidine HCL $ 14.35 $ 0.38
Ondansetron HCL $ 11.24 $ 1.44
Ondanestron ODT $ 7.86 $ 1.39
Source: MA APCDNotes: Most Prescribed Drugs refers to the highest number of prescriptions within therapeutic class.This report does not reflect the impact of prescription drug rebates.
Top Five Most Prescribed Drugs, SFY 2015
Percentage of Prescriptions Generic vs. Brand Name ALLOWED AMOUNT PMPM: $3.61
PERCENT OF TOTAL PRESCRIPTIONS: 4.4% AVERAGE COST PER PRESCRIPTION: $97Brand Name
19%
Generic81%
10% 20% 30% 40% 50%0%

20 Prescription Drug Use & Spending | August 2018 center for health information and analysisCHIA
Drug NameNumber of
PrescriptionsTotal Allowed
AmountAllowed Amount
PMPMAllowed Amount per Prescription
1 Lisinopril 438,464 $2,190,422 $0.13 $5.00
2 Levothyroxine Sodium 354,315 $4,058,963 $0.25 $11.46
3 Simvastatin 308,783 $2,329,055 $0.14 $7.54
4 Atorvastatin Calcium 290,710 $5,939,325 $0.36 $20.43
5 Citalopram HBR 232,593 $1,122,526 $0.07 $4.83
6 Omeprazole 231,460 $2,594,304 $0.16 $11.21
7 Sertraline HCL 228,033 $1,462,122 $0.09 $6.41
8 Hydrochlorothiazide 212,026 $932,123 $0.06 $4.40
9 Fluticasone Propionate 202,425 $2,539,870 $0.16 $12.55
10 Lorazepam 200,260 $725,063 $0.04 $3.62
11 Amoxicillin 189,140 $1,076,178 $0.07 $5.69
12 Proair HFA 188,547 $10,124,460 $0.62 $53.70
13 Fluoxetine HCL 182,239 $2,602,819 $0.16 $14.28
14 Amlodipine Besylate 178,970 $914,887 $0.06 $5.11
15 Azithromycin 153,980 $1,214,088 $0.07 $7.88
16 Atenolol 142,298 $748,492 $0.05 $5.26
17 Metformin HCL 138,174 $973,859 $0.06 $7.05
18 Ibuprofen 135,718 $816,573 $0.05 $6.02
19 Metoprolol Succinate 135,209 $3,613,573 $0.22 $26.73
20 Clonazepam 122,797 $535,551 $0.03 $4.36
Top Drugs Ranked by Number of Prescriptions, SFY 2015
Source: MA APCDNotes: Based on analysis of fully-insured commercial lines of business for the following eight payers: Blue Cross Blue Shield of Massachusetts, Boston Medical Center HealthNet Plan, CeltiCare Health, Fallon Health, Harvard Pilgrim Health Care, Neighborhood Health Plan, Tufts Health Plan, and Tufts Health Public Plans (formerly Network Health), for Massachusetts residents. This report does not reflect the impact of prescription drug rebates.
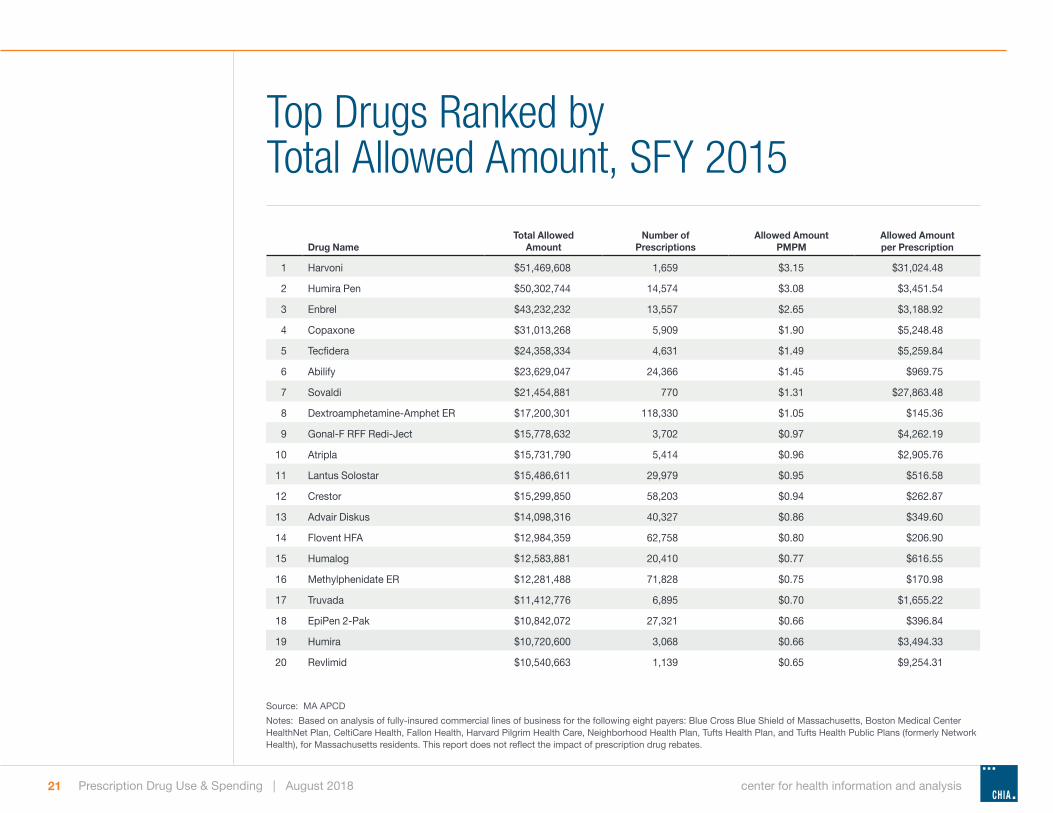
21 Prescription Drug Use & Spending | August 2018 center for health information and analysisCHIA
Drug NameTotal Allowed
AmountNumber of
PrescriptionsAllowed Amount
PMPMAllowed Amount per Prescription
1 Harvoni $51,469,608 1,659 $3.15 $31,024.48
2 Humira Pen $50,302,744 14,574 $3.08 $3,451.54
3 Enbrel $43,232,232 13,557 $2.65 $3,188.92
4 Copaxone $31,013,268 5,909 $1.90 $5,248.48
5 Tecfidera $24,358,334 4,631 $1.49 $5,259.84
6 Abilify $23,629,047 24,366 $1.45 $969.75
7 Sovaldi $21,454,881 770 $1.31 $27,863.48
8 Dextroamphetamine-Amphet ER $17,200,301 118,330 $1.05 $145.36
9 Gonal-F RFF Redi-Ject $15,778,632 3,702 $0.97 $4,262.19
10 Atripla $15,731,790 5,414 $0.96 $2,905.76
11 Lantus Solostar $15,486,611 29,979 $0.95 $516.58
12 Crestor $15,299,850 58,203 $0.94 $262.87
13 Advair Diskus $14,098,316 40,327 $0.86 $349.60
14 Flovent HFA $12,984,359 62,758 $0.80 $206.90
15 Humalog $12,583,881 20,410 $0.77 $616.55
16 Methylphenidate ER $12,281,488 71,828 $0.75 $170.98
17 Truvada $11,412,776 6,895 $0.70 $1,655.22
18 EpiPen 2-Pak $10,842,072 27,321 $0.66 $396.84
19 Humira $10,720,600 3,068 $0.66 $3,494.33
20 Revlimid $10,540,663 1,139 $0.65 $9,254.31
Top Drugs Ranked by Total Allowed Amount, SFY 2015
Source: MA APCDNotes: Based on analysis of fully-insured commercial lines of business for the following eight payers: Blue Cross Blue Shield of Massachusetts, Boston Medical Center HealthNet Plan, CeltiCare Health, Fallon Health, Harvard Pilgrim Health Care, Neighborhood Health Plan, Tufts Health Plan, and Tufts Health Public Plans (formerly Network Health), for Massachusetts residents. This report does not reflect the impact of prescription drug rebates.
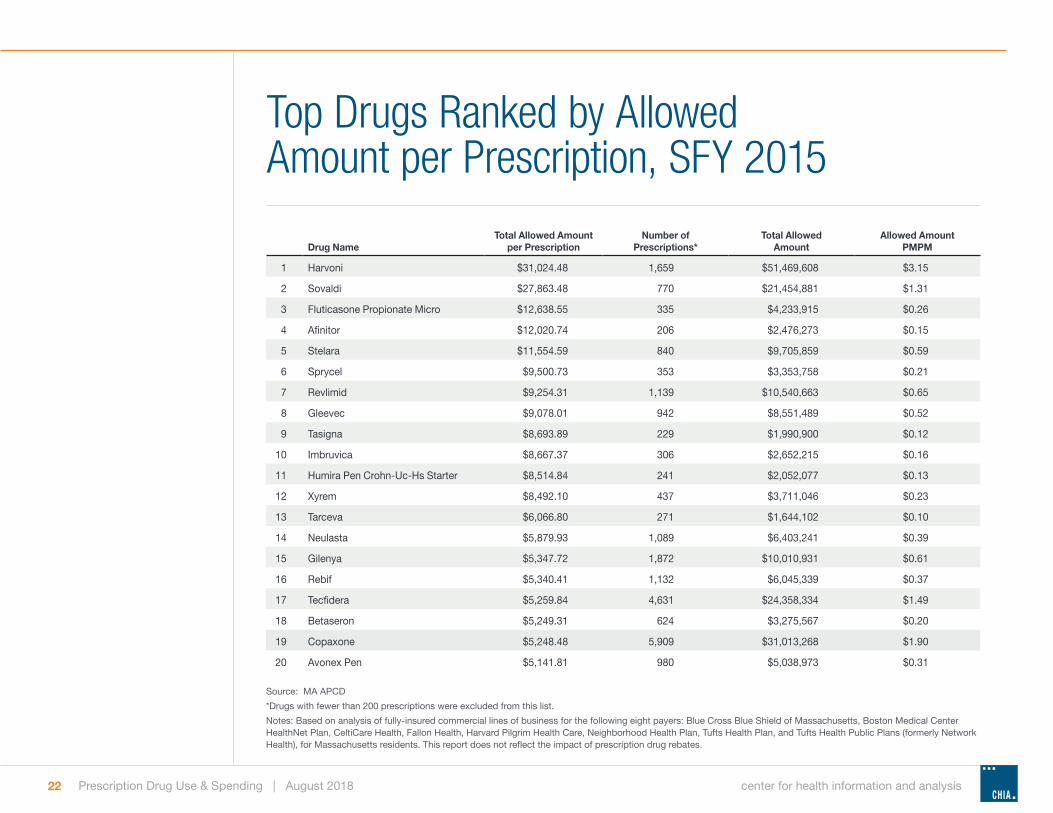
22 Prescription Drug Use & Spending | August 2018 center for health information and analysisCHIA
Drug NameTotal Allowed Amount
per PrescriptionNumber of
Prescriptions*Total Allowed
AmountAllowed Amount
PMPM
1 Harvoni $31,024.48 1,659 $51,469,608 $3.15
2 Sovaldi $27,863.48 770 $21,454,881 $1.31
3 Fluticasone Propionate Micro $12,638.55 335 $4,233,915 $0.26
4 Afinitor $12,020.74 206 $2,476,273 $0.15
5 Stelara $11,554.59 840 $9,705,859 $0.59
6 Sprycel $9,500.73 353 $3,353,758 $0.21
7 Revlimid $9,254.31 1,139 $10,540,663 $0.65
8 Gleevec $9,078.01 942 $8,551,489 $0.52
9 Tasigna $8,693.89 229 $1,990,900 $0.12
10 Imbruvica $8,667.37 306 $2,652,215 $0.16
11 Humira Pen Crohn-Uc-Hs Starter $8,514.84 241 $2,052,077 $0.13
12 Xyrem $8,492.10 437 $3,711,046 $0.23
13 Tarceva $6,066.80 271 $1,644,102 $0.10
14 Neulasta $5,879.93 1,089 $6,403,241 $0.39
15 Gilenya $5,347.72 1,872 $10,010,931 $0.61
16 Rebif $5,340.41 1,132 $6,045,339 $0.37
17 Tecfidera $5,259.84 4,631 $24,358,334 $1.49
18 Betaseron $5,249.31 624 $3,275,567 $0.20
19 Copaxone $5,248.48 5,909 $31,013,268 $1.90
20 Avonex Pen $5,141.81 980 $5,038,973 $0.31
Top Drugs Ranked by Allowed Amount per Prescription, SFY 2015
Source: MA APCD*Drugs with fewer than 200 prescriptions were excluded from this list.Notes: Based on analysis of fully-insured commercial lines of business for the following eight payers: Blue Cross Blue Shield of Massachusetts, Boston Medical Center HealthNet Plan, CeltiCare Health, Fallon Health, Harvard Pilgrim Health Care, Neighborhood Health Plan, Tufts Health Plan, and Tufts Health Public Plans (formerly Network Health), for Massachusetts residents. This report does not reflect the impact of prescription drug rebates.

23 Prescription Drug Use & Spending | August 2018 center for health information and analysisCHIA
Allowed Amount: A payer’s contracted maximum amount that it will
allow to be paid for a claim. It includes a portion that the insurer will pay
plus a portion designated as the insured’s out-of-pocket liability (copay,
coinsurance, and deductible).
Allowed Amount Per Day’s Supply: The maximum contracted
amount that an insurance company will allow as payment (payer paid
+ patient out-of-pocket) divided by the number of days’ supply that the
prescription is for.
Allowed Amount Per Member Per Month (PMPM): The maximum
contracted amount that an insurance company will allow as payment
(payer paid + patient out-of-pocket) for a prescription, divided by the
total number of member months for that insurance company.
Allowed Amount Per Prescription: The maximum contracted
amount that an insurance company will allow as payment divided by
the number of prescriptions.
Patient Out-of-Pocket: Amount the patient is expected to pay under
his or her health insurance contract, usually through a deductible,
copayment, or coinsurance.
Payer Paid: The amount an insurance plan paid for a claim.
Therapeutic Class: CHIA uses First Databank (FDB) as a grouper,
which categorizes drugs that are similar in pharmacologic, therapeutic,
and/or chemical characteristics into therapeutic classes. This report
used FDB’s Generic Therapeutic Class, which has 45 classes.
Glossary of Terms
Notes: Please see the technical appendix for more information
For more information, please contact:
CENTER FOR HEALTH INFORMATION AND ANALYSIS
501 Boylston Street www.chiamass.govBoston, MA 02116 @Mass_CHIA
(617) 701-8100
Publication Number 18-239-CHIA-01


