Page 1
Prescription Opioid Use and Opioid-Related Overdose Death —
TN, 2009–2010
Jane A.G. Baumblatt, MD
Centers for Disease Control and Prevention
Epidemic Intelligence Service OfficerTennessee Department of Health
Office of Surveillance, Epidemiology, and Laboratory ServicesScientific Education and Professional Development Program Office
Page 2
Background
Increase in prescription opioid use since 1990s
Opioids are powerful painkillers Action on central nervous system
analgesia Action on respiratory center decrease
respiration
Increase in prescription opioid-related drug overdose and death
Page 3
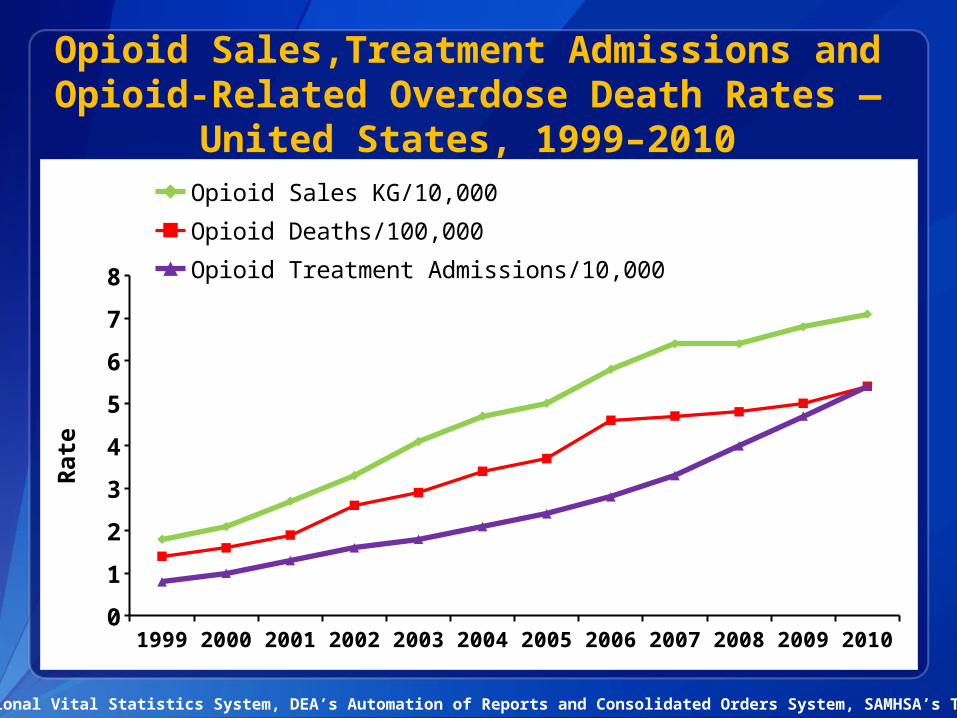
Opioid Sales,Treatment Admissions and Opioid-Related Overdose Death Rates —
United States, 1999–2010
National Vital Statistics System, DEA’s Automation of Reports and Consolidated Orders System, SAMHSA’s TEDS
1999 2000 2001 2002 2003 2004 2005 2006 2007 2008 2009 20100
1
2
3
4
5
6
7
8
Opioid Sales KG/10,000
Opioid Deaths/100,000
Opioid Treatment Admissions/10,000
Rate
Page 4
4
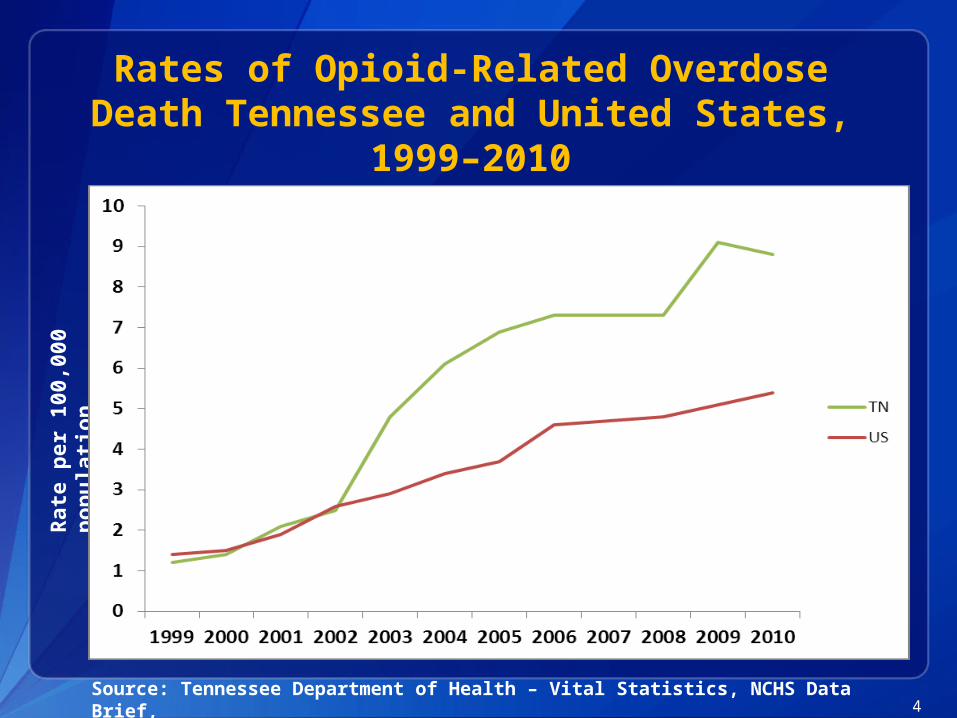
Rates of Opioid-Related Overdose Death Tennessee and United States,
1999–2010
Source: Tennessee Department of Health – Vital Statistics, NCHS Data Brief,
Rate
per
10
0,0
00
p
op
ula
tion
Page 5
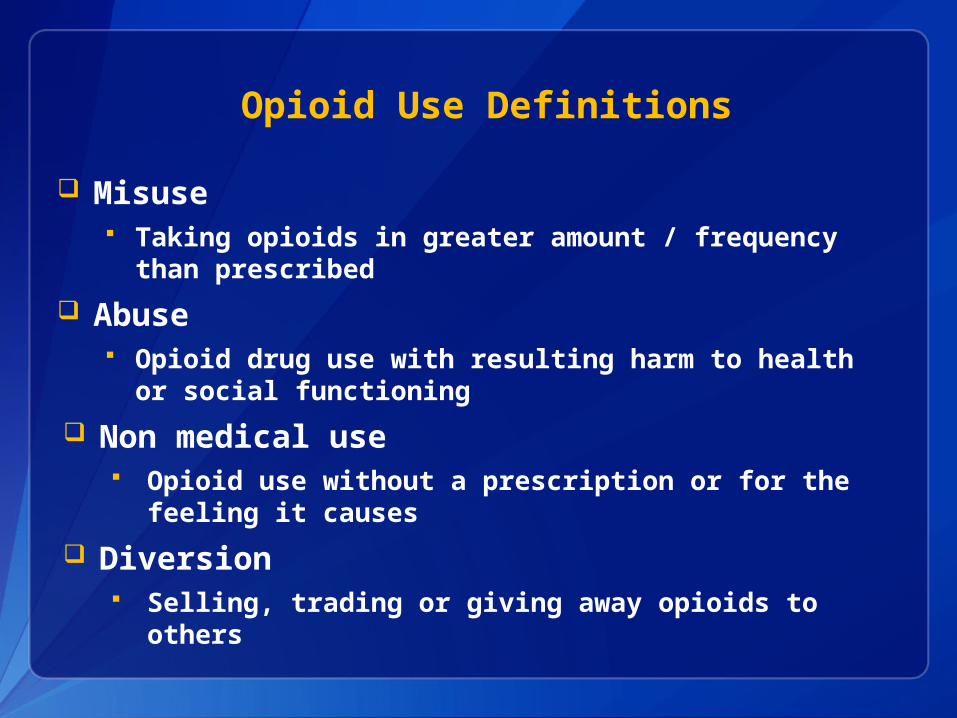
Opioid Use Definitions
Misuse Taking opioids in greater amount / frequency than
prescribed
Abuse Opioid drug use with resulting harm to health or
social functioning
Non medical use Opioid use without a prescription or for the
feeling it causes
Diversion Selling, trading or giving away opioids to others
Page 6
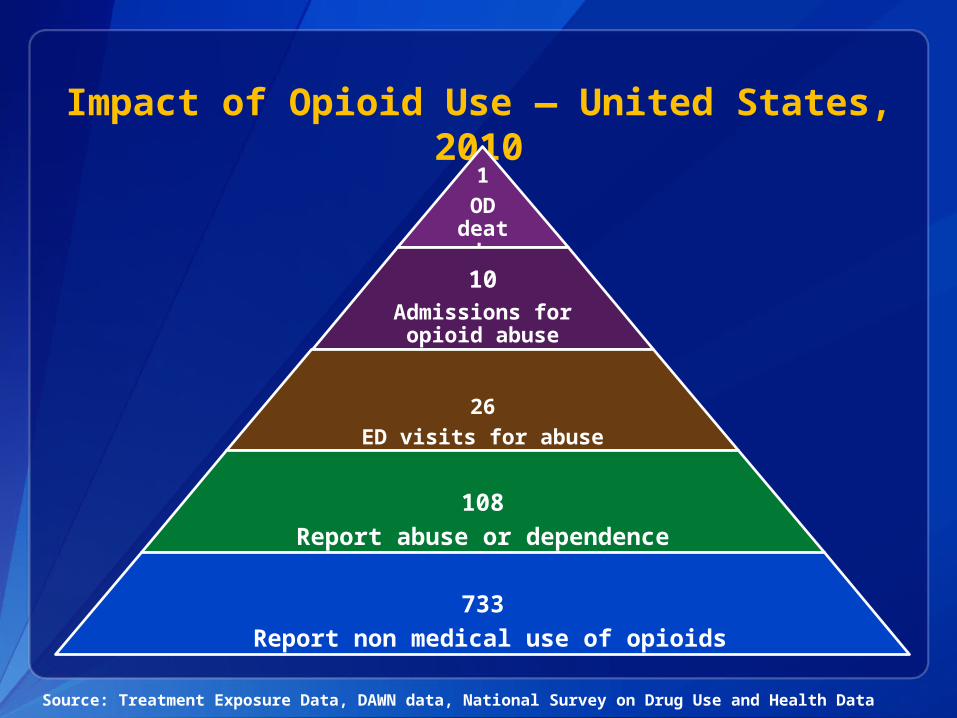
Impact of Opioid Use — United States, 2010
1OD death
10Admissions for opioid abuse
26ED visits for abuse
108Report abuse or dependence
733 Report non medical use of opioids
Source: Treatment Exposure Data, DAWN data, National Survey on Drug Use and Health Data
Page 7
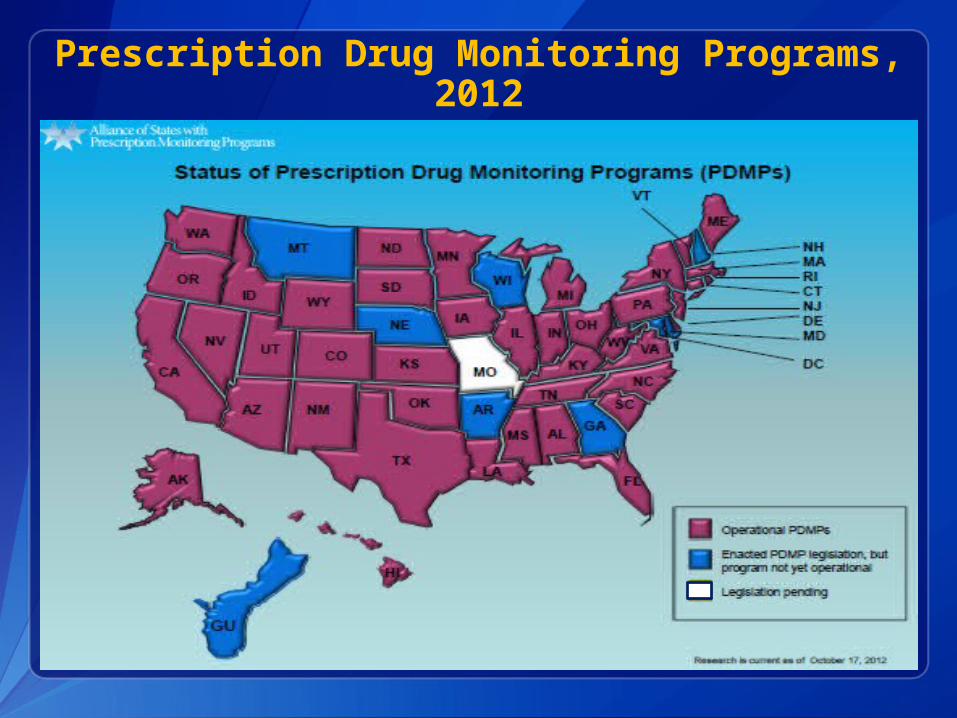
Prescription Drug Monitoring Programs, 2012
Page 8
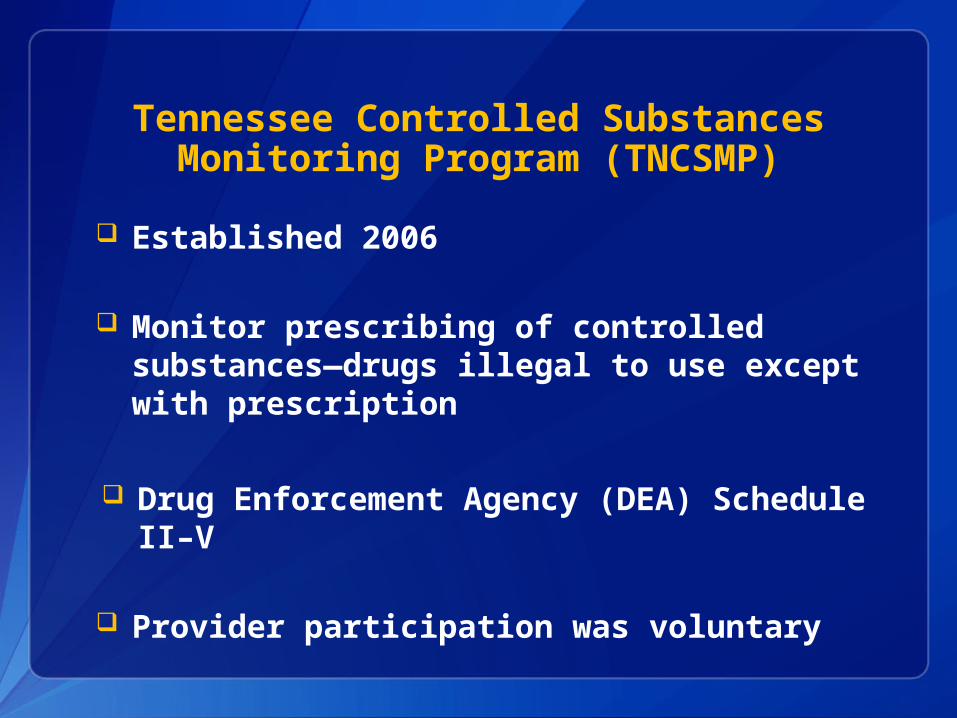
Tennessee Controlled Substances Monitoring Program (TNCSMP)
Established 2006
Monitor prescribing of controlled substances—drugs illegal to use except with prescription
Drug Enforcement Agency (DEA) Schedule II–V
Provider participation was voluntary
Page 9
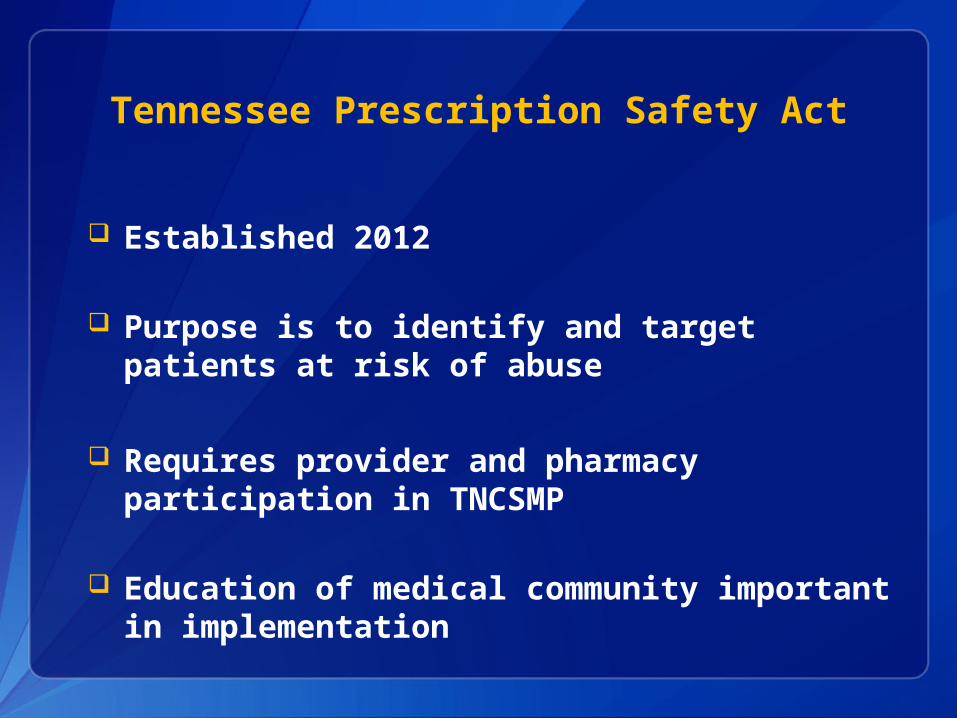
Tennessee Prescription Safety Act
Established 2012
Purpose is to identify and target patients at risk of abuse
Requires provider and pharmacy participation in TNCSMP
Education of medical community important in implementation
Page 10
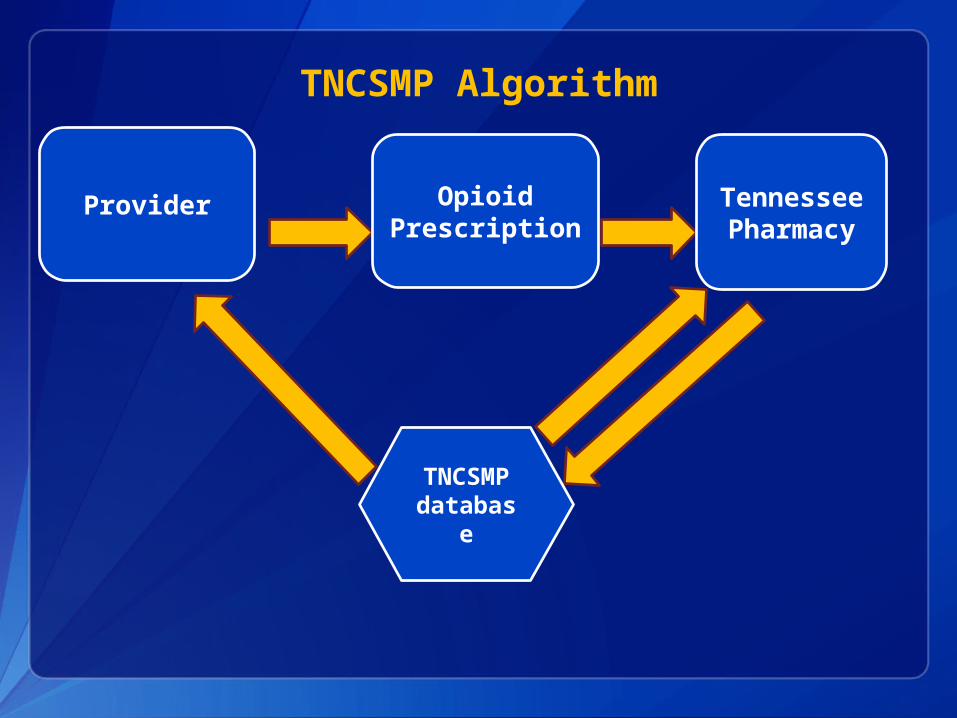
TNCSMP Algorithm
Provider OpioidPrescription
Tennessee
Pharmacy
TNCSMP
database
Page 12
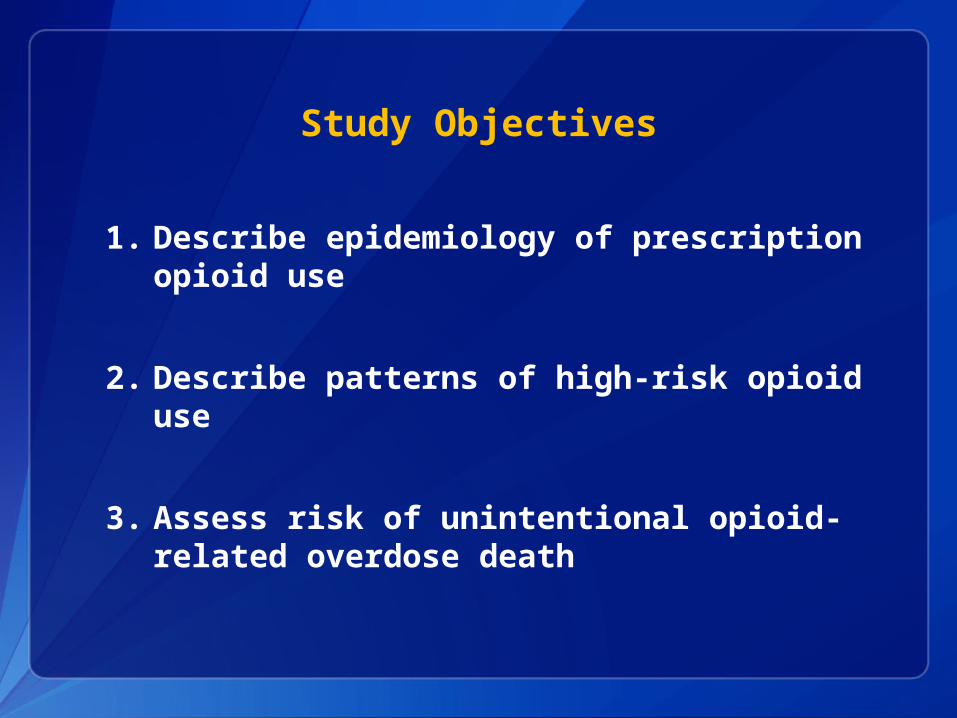
Study Objectives
1. Describe epidemiology of prescription opioid use
2. Describe patterns of high-risk opioid use
3. Assess risk of unintentional opioid-related overdose death
Page 13
Descriptive Analysis, 2007–2011
Tennessee Controlled Substances Monitoring Program data
Inclusion criteria Dispensed 2007–2011 Tennessee residents Tennessee providers
Page 14
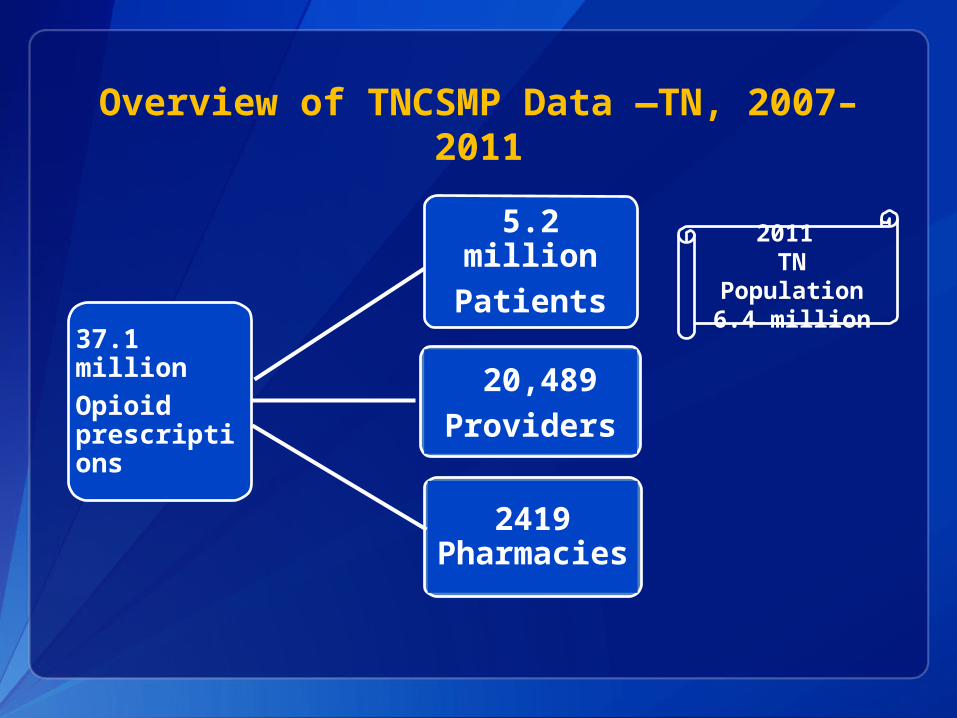
Overview of TNCSMP Data —TN, 2007–2011
37.1 million Opioid prescriptions
5.2 millionPatients
20,489Providers
2419 Pharmacies
2011 TN
Population 6.4 million
Page 15
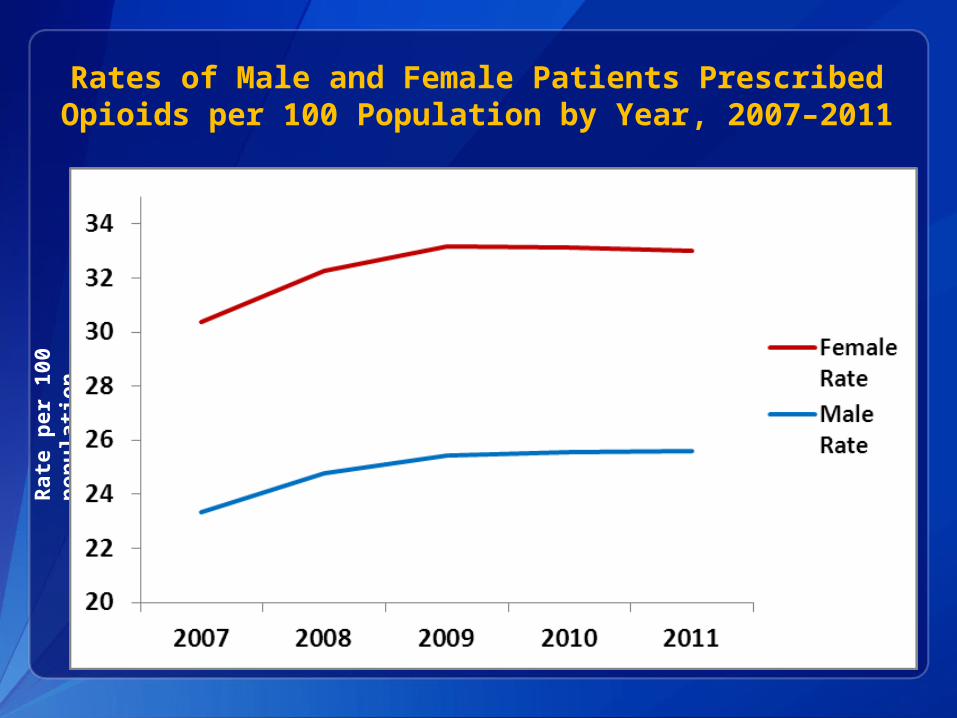
Rates of Male and Female Patients Prescribed Opioids per 100 Population by Year, 2007–2011
Rate
per
10
0
pop
ula
tion
Page 16
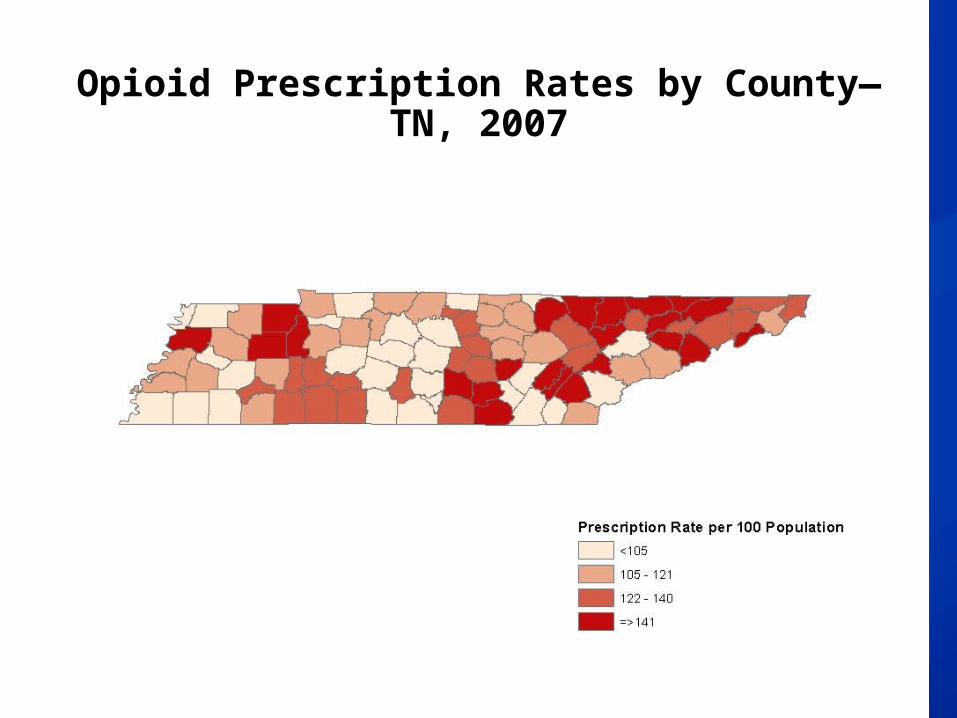
Opioid Prescription Rates by County—TN, 2007
Page 17
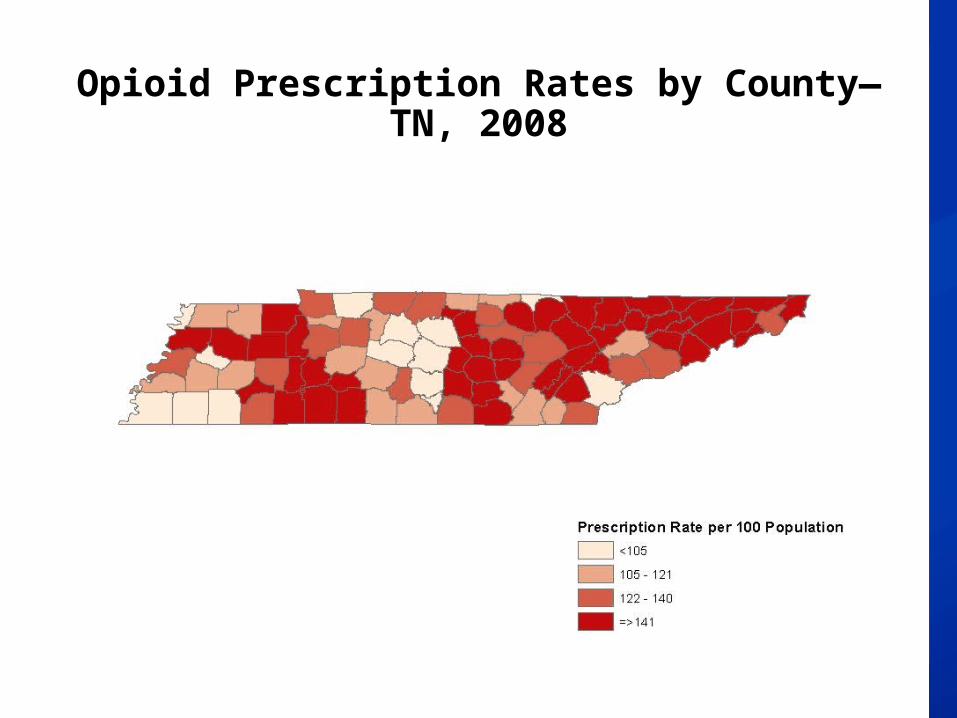
Opioid Prescription Rates by County—TN, 2008
Page 18
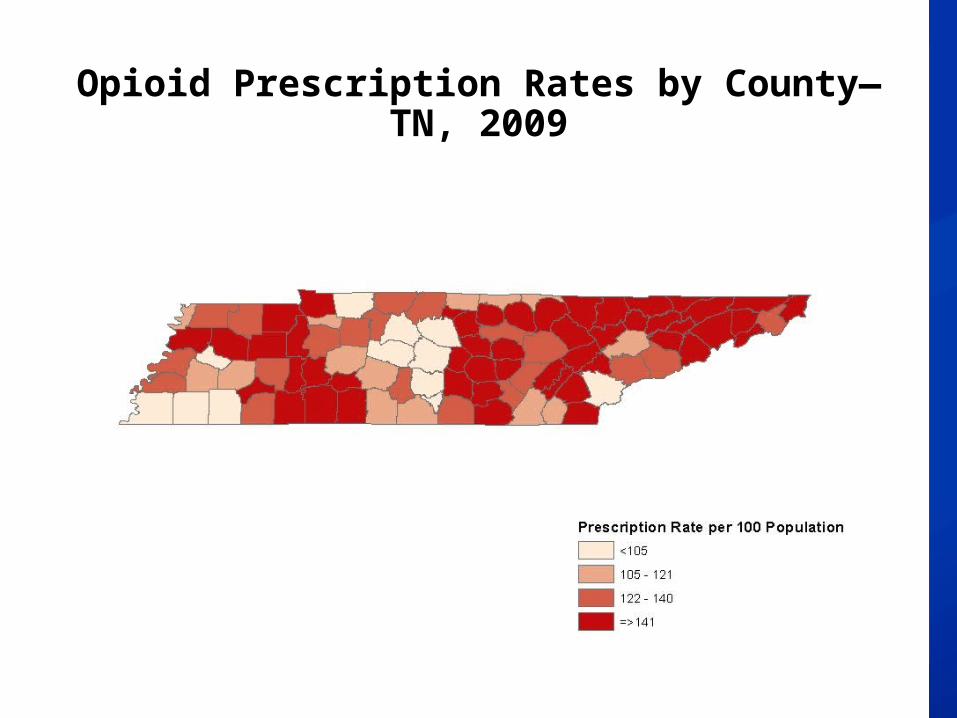
Opioid Prescription Rates by County—TN, 2009
Page 19
Opioid Prescription Rates by County—TN, 2010
Page 20
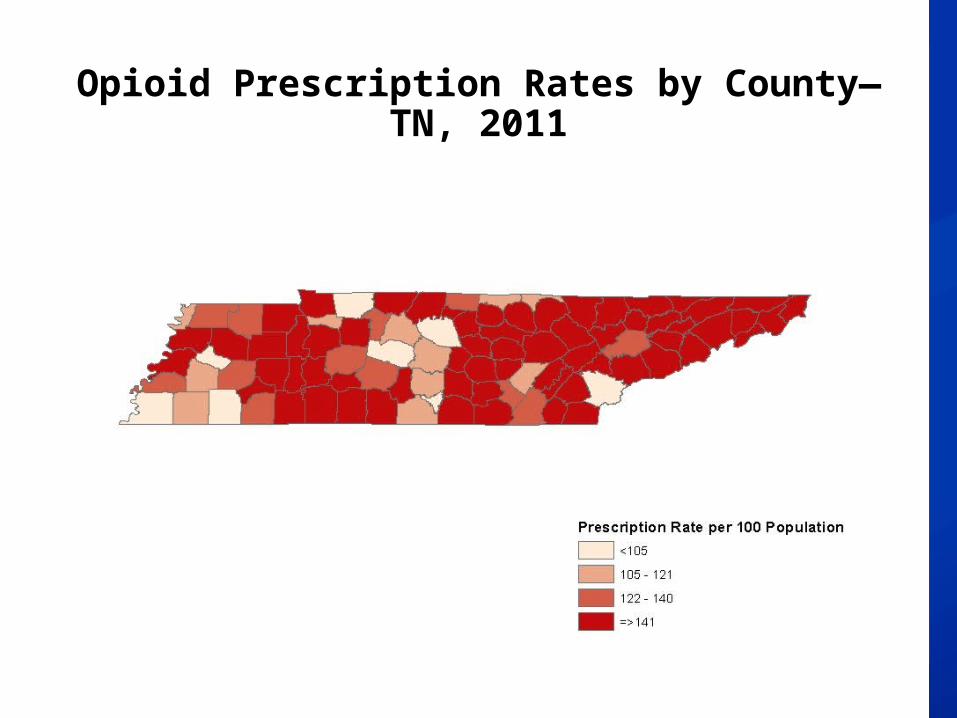
Opioid Prescription Rates by County—TN, 2011
Page 21
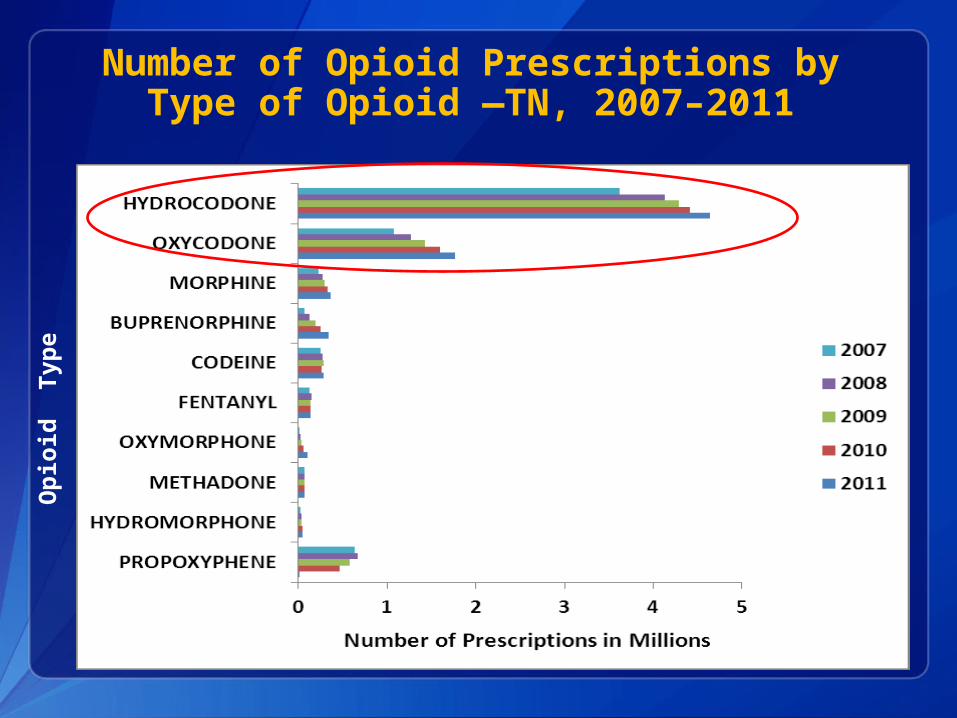
Number of Opioid Prescriptions by Type of Opioid —TN, 2007–2011
Op
ioid
Ty
pe
Page 22
Nu
mb
er
of
Pati
en
ts
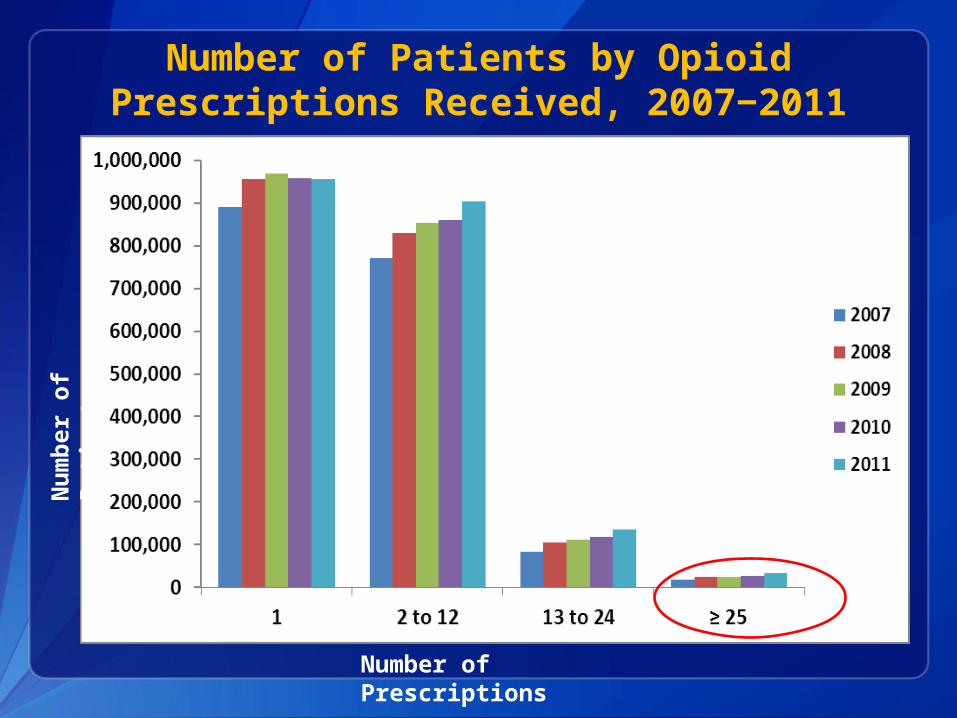
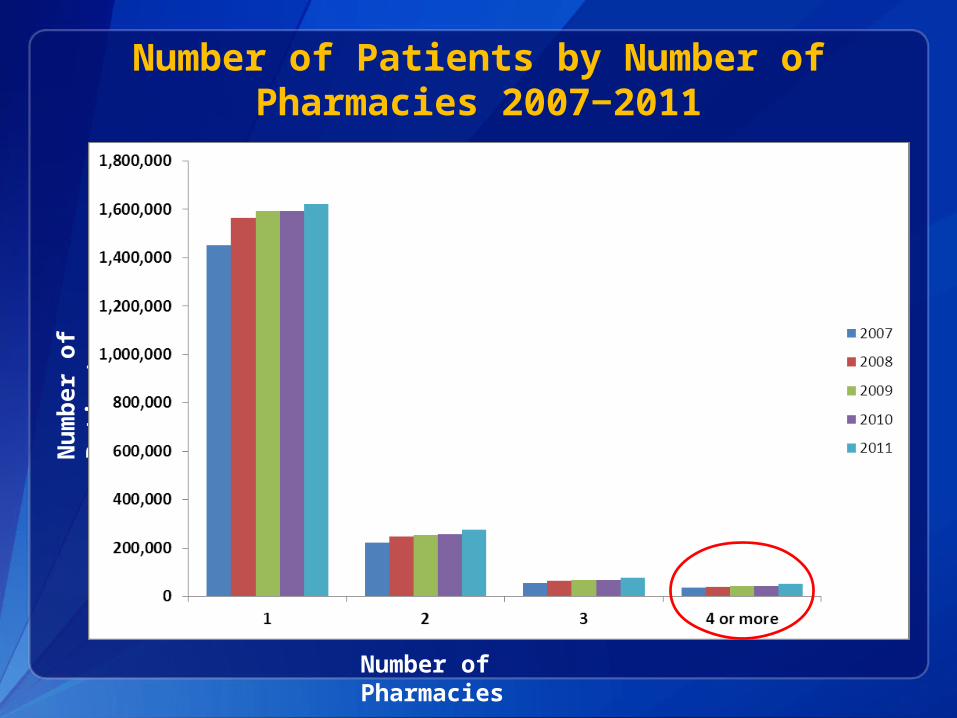
Number of Prescriptions
Number of Patients by Opioid Prescriptions Received, 2007‒2011
Page 23
Study Objectives
1. Describe epidemiology of prescription opioid use
2. Describe patterns of high-risk opioid use
3. Assess risk of unintentional opioid analgesic-related overdose death
Page 24
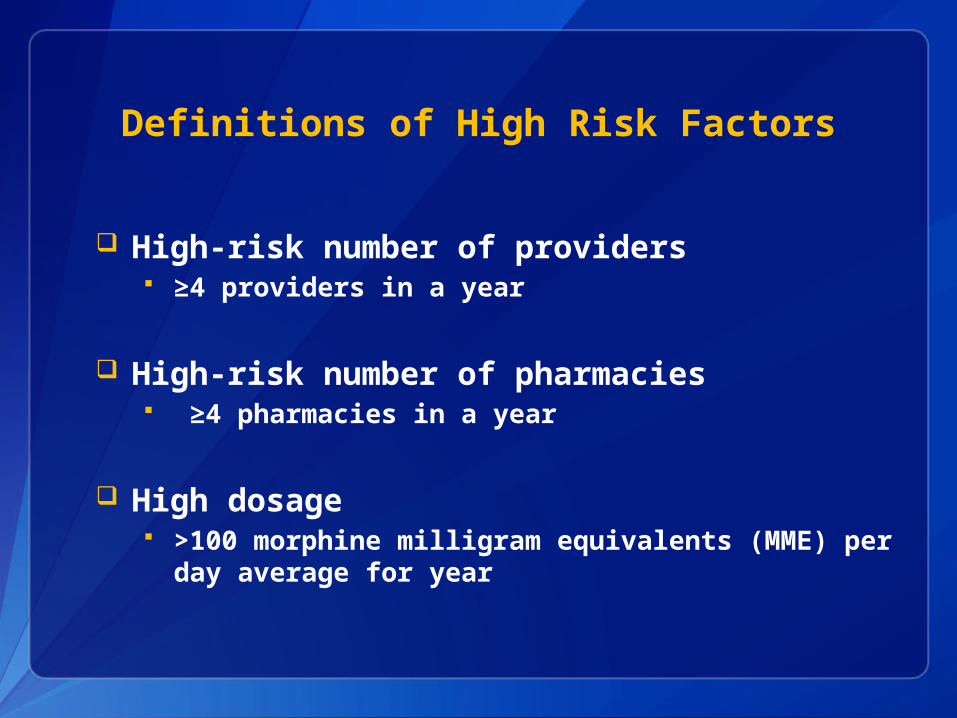
Definitions of High Risk Factors
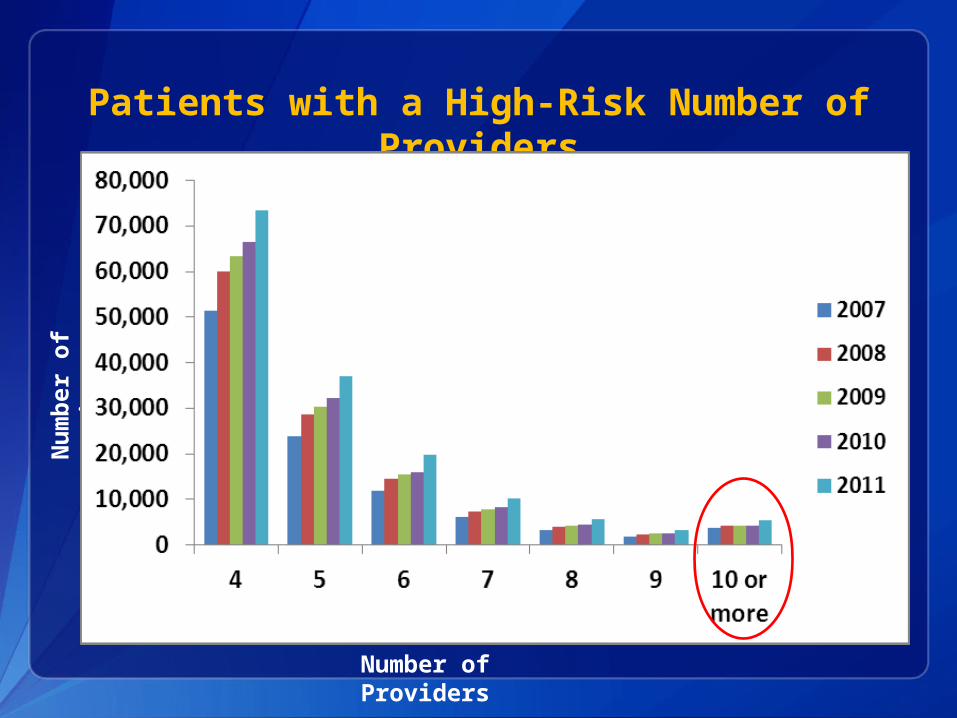
High-risk number of providers ≥4 providers in a year
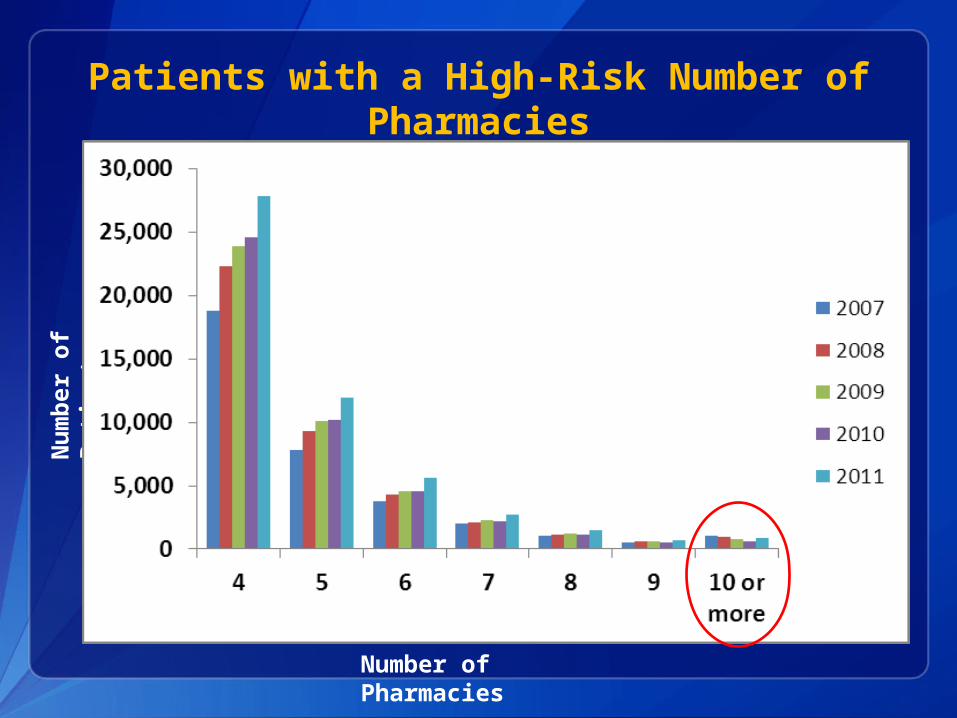
High-risk number of pharmacies ≥4 pharmacies in a year
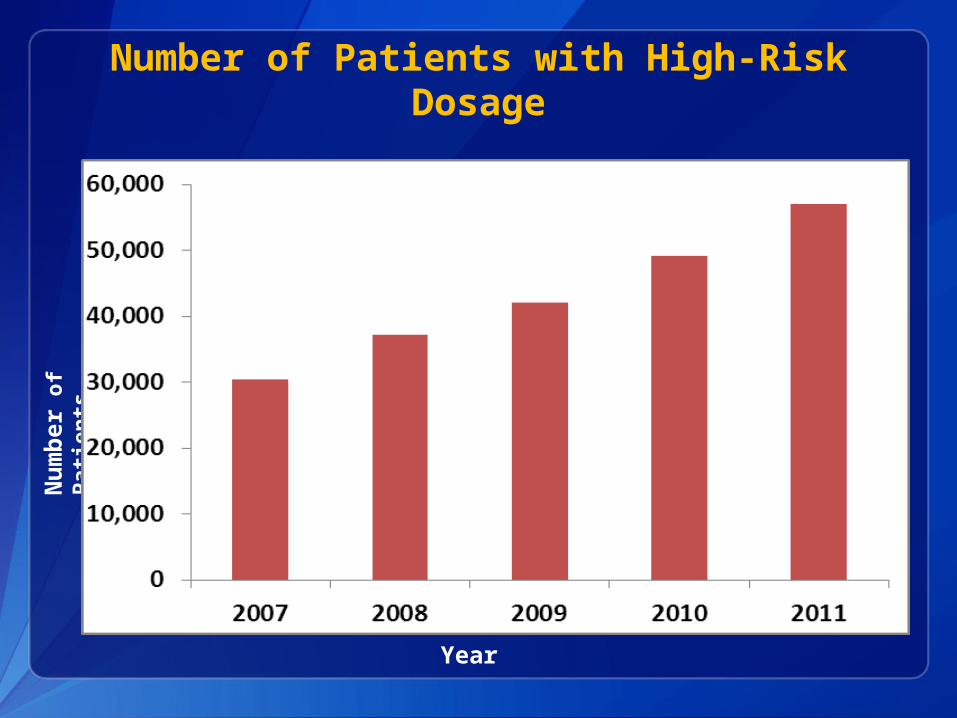
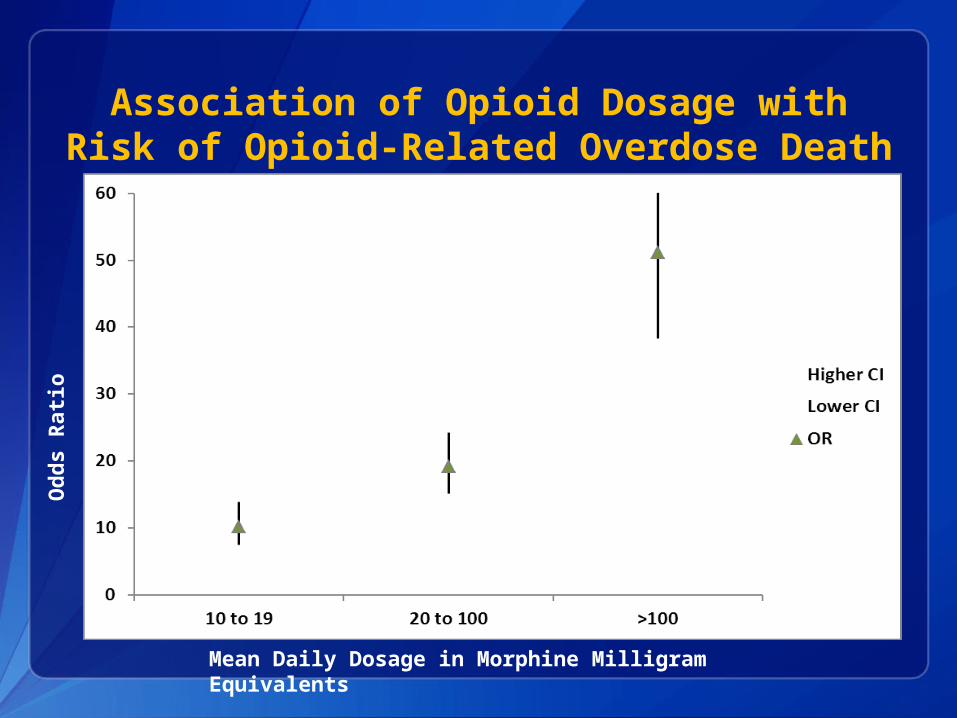
High dosage >100 morphine milligram equivalents (MME)
per day average for year
Page 25
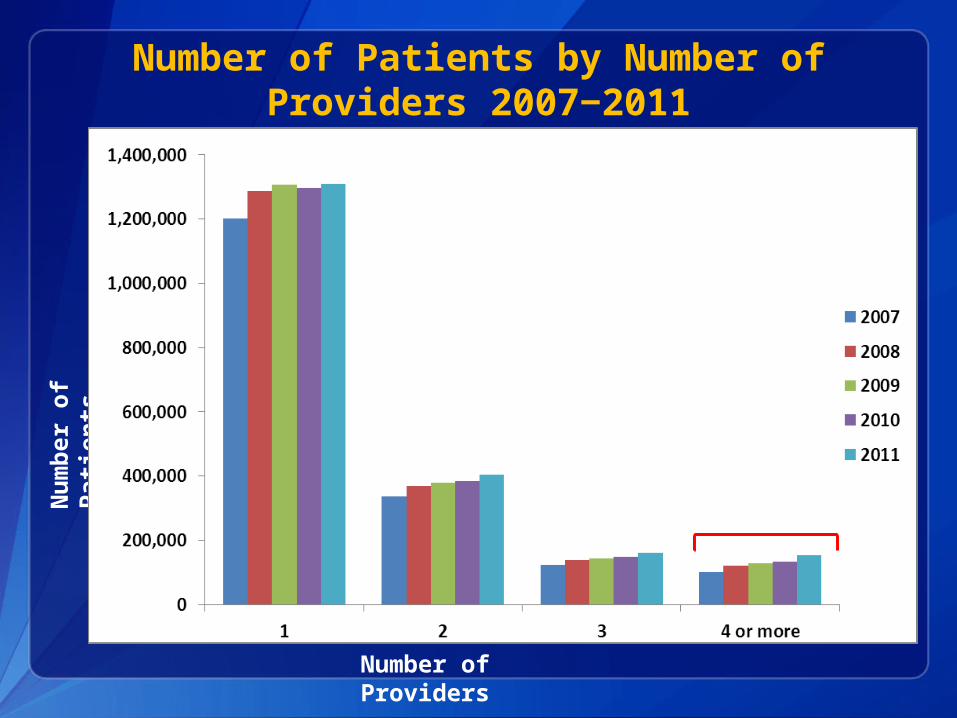
Number of Patients by Number of Providers 2007‒2011
Nu
mb
er
of
Pati
en
ts
Number of Providers
Page 26
Patients with a High-Risk Number of Providers
Nu
mb
er
of
Pati
en
ts
Number of Providers
Page 27
Number of Patients by Number of Pharmacies 2007‒2011
Nu
mb
er
of
Pati
en
ts
Number of Pharmacies
Page 28
Patients with a High-Risk Number of Pharmacies
Nu
mb
er
of
Pati
en
ts
Number of Pharmacies
Page 29
Number of Patients with High-Risk Dosage
Year
Nu
mb
er
of
Pati
en
ts
Page 30
Study Objectives
1. Describe epidemiology of prescription opioid use
2. Describe patterns of high-risk opioid use
3. Assess risk of unintentional opioid-related overdose death
Page 31
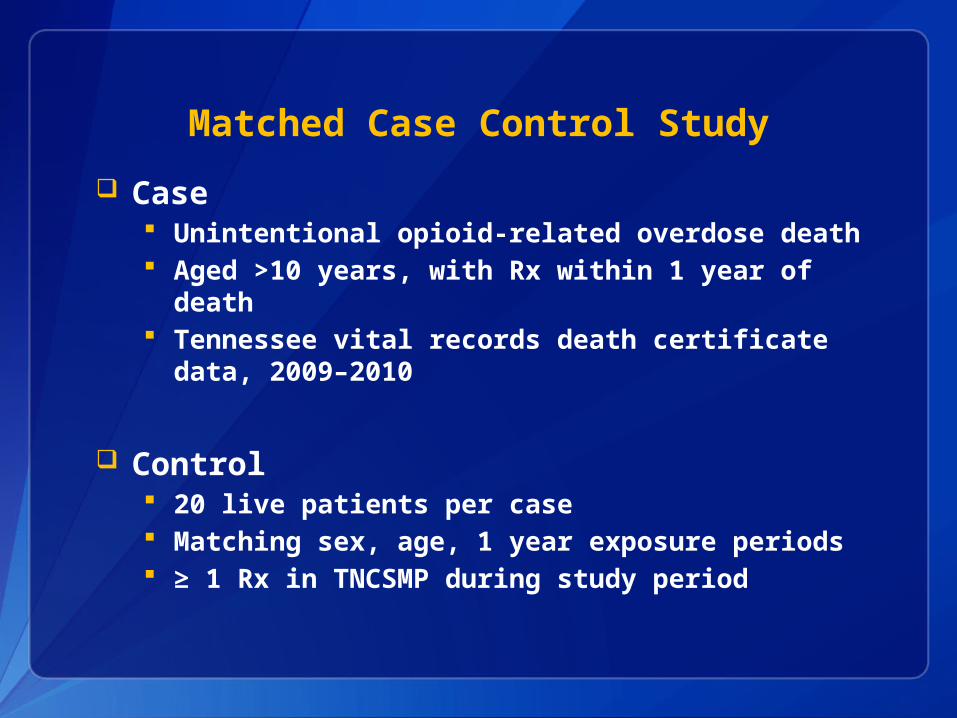
Matched Case Control Study
Case Unintentional opioid-related overdose death Aged >10 years, with Rx within 1 year of death Tennessee vital records death certificate data,
2009–2010
Control 20 live patients per case Matching sex, age, 1 year exposure periods ≥ 1 Rx in TNCSMP during study period
Page 32
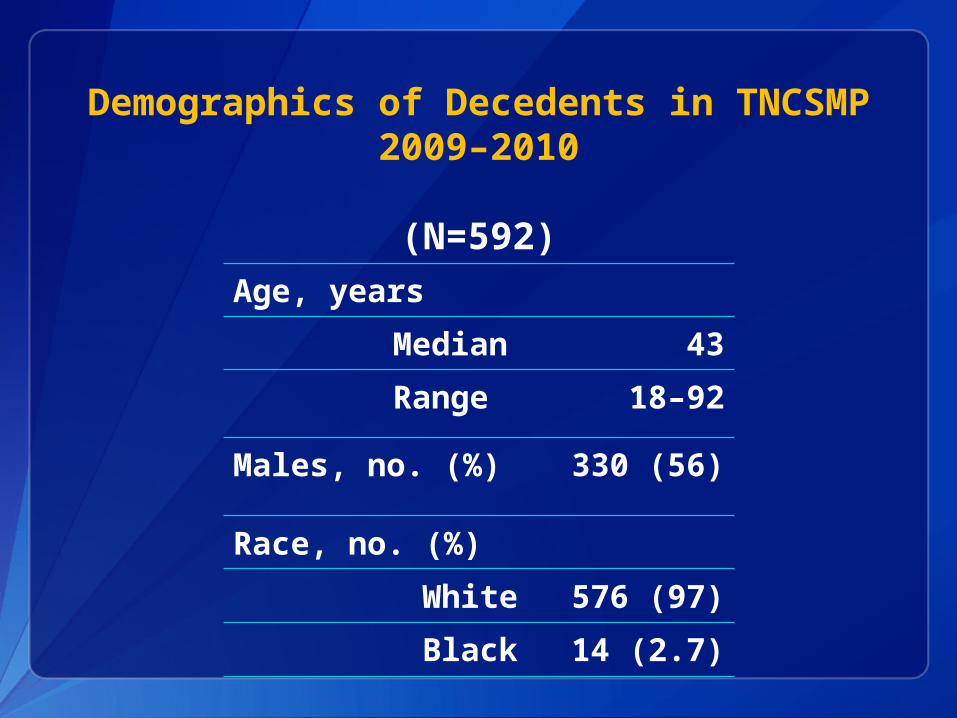
Demographics of Decedents in TNCSMP2009–2010
(N=592)Age, years
Median
43
Range 18–92
Males, no. (%) 330 (56)
Race, no. (%)
White
576 (97)
Black 14 (2.7)
Page 33
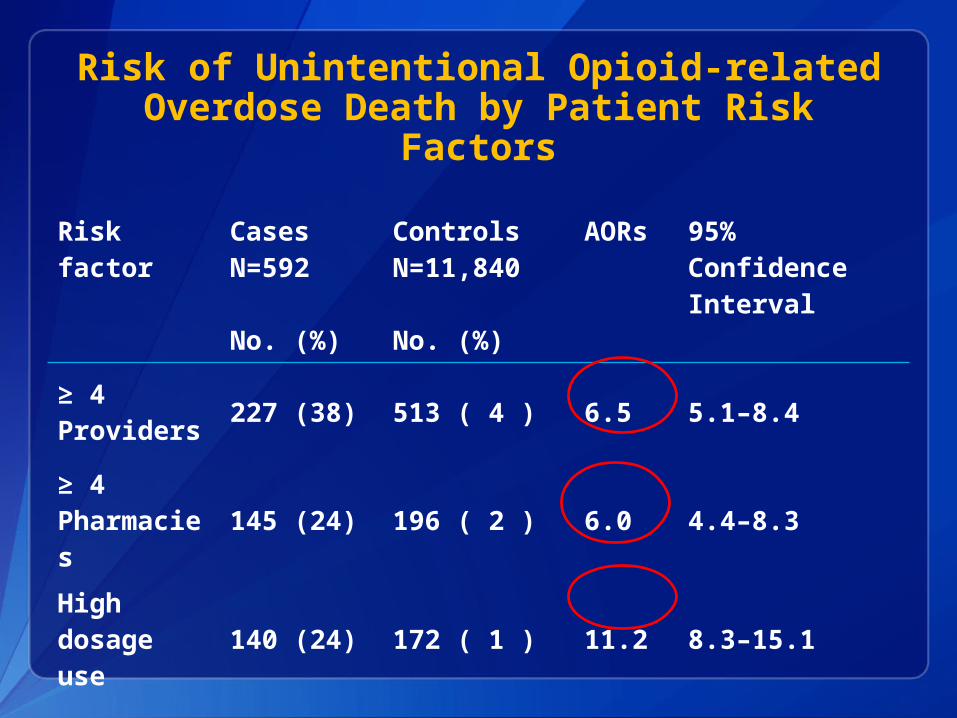
Risk of Unintentional Opioid-related Overdose Death by Patient Risk Factors
Risk factor
CasesN=592
No. (%)
Controls N=11,840
No. (%)
AORs 95% Confidence Interval
≥ 4 Providers 227 (38) 513 ( 4 ) 6.5 5.1–8.4
≥ 4Pharmacies
145 (24) 196 ( 2 ) 6.0 4.4–8.3
High dosage use
140 (24) 172 ( 1 ) 11.2 8.3–15.1
Page 34
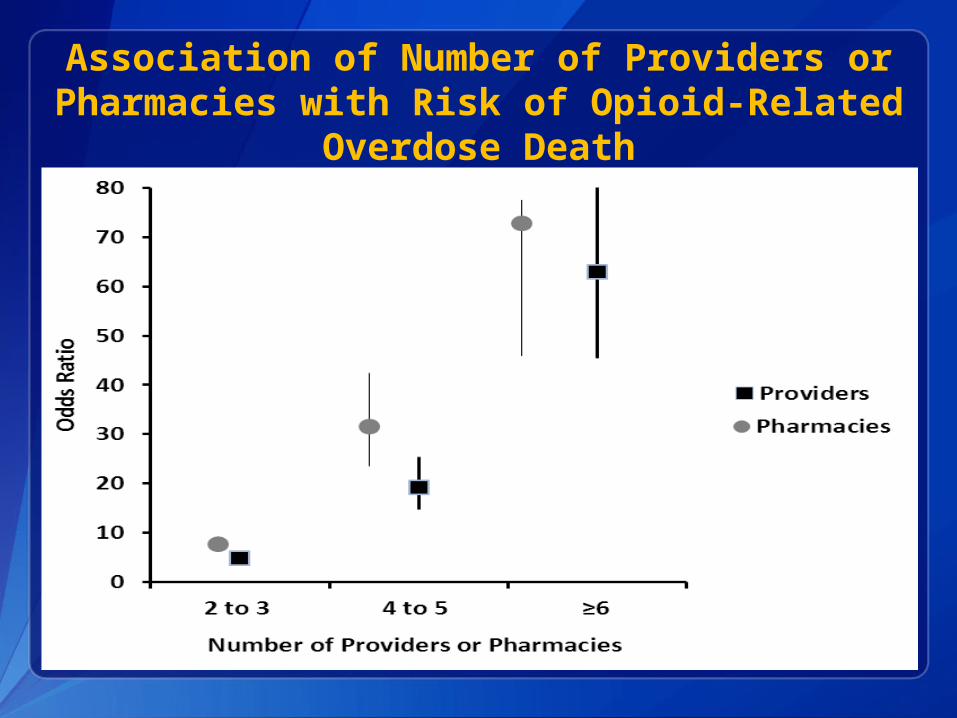
Association of Number of Providers or Pharmacies with Risk of Opioid-Related
Overdose Death
Page 35
Association of Opioid Dosage with Risk of Opioid-Related Overdose Death
Od
ds R
ati
o
Mean Daily Dosage in Morphine Milligram Equivalents
Page 36
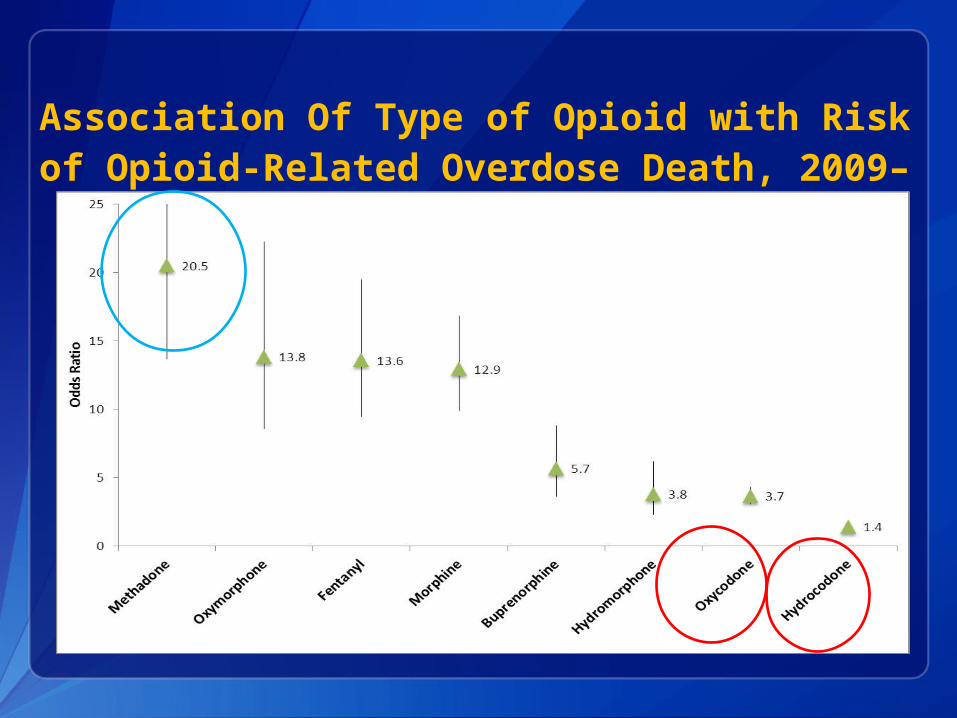
Association Of Type of Opioid with Risk of Opioid-Related Overdose Death, 2009–
2010
Page 37
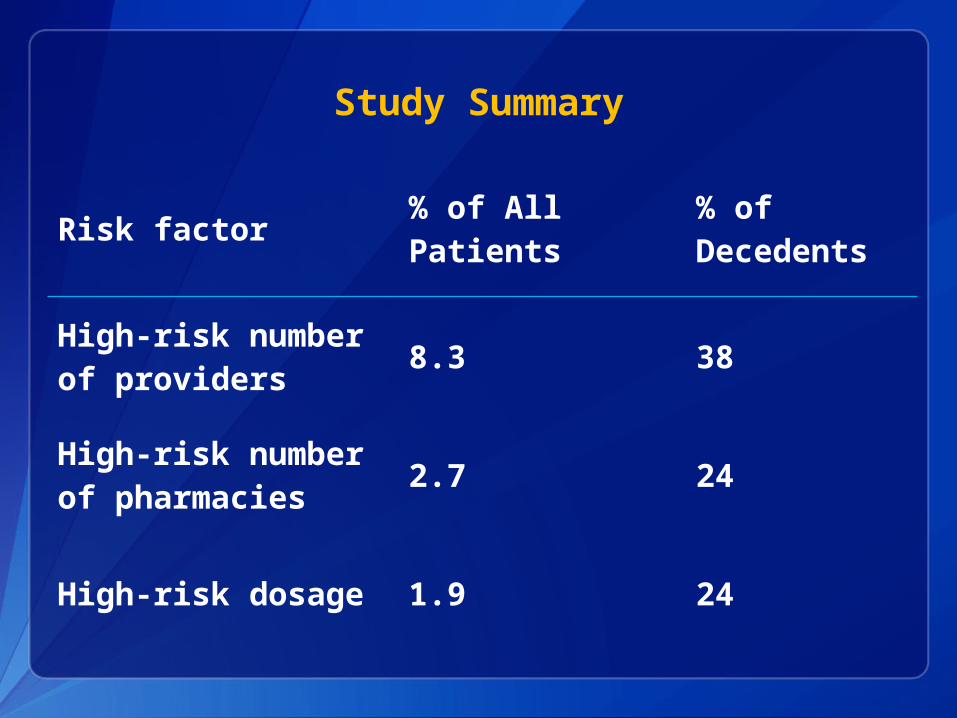
Study Summary
Risk factor% of All Patients
% of Decedents
High-risk number of providers
8.3 38
High-risk number of pharmacies
2.7 24
High-risk dosage 1.9 24
Page 38
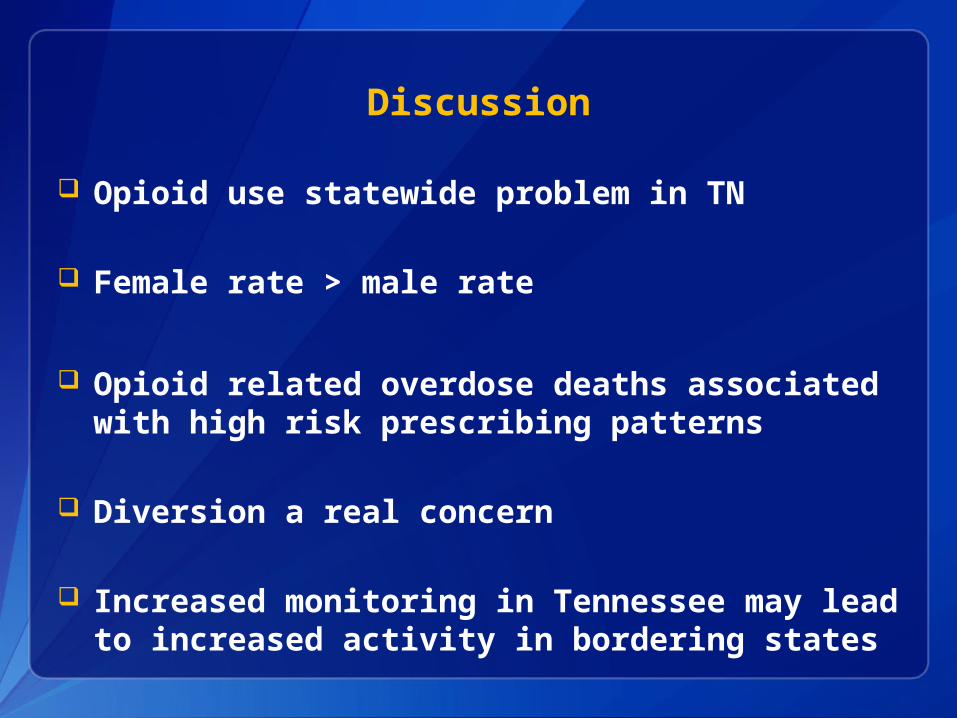
Discussion
Opioid use statewide problem in TN
Female rate > male rate
Opioid related overdose deaths associated with high risk prescribing patterns
Diversion a real concern
Increased monitoring in Tennessee may lead to increased activity in bordering states
Page 39
Limitations
Not all prescriptions are captured Active duty military and VA facilities Hospital and out of state dispensing
Matching on sex and age, unable to evaluate these variables
Dispensing patterns proxy for use, unable to evaluate forms of use
Page 40
Conclusions
Prescription opioid misuse major public health problem
High risk use increasing and associated with increased risk of death
TNCSMP invaluable tool in describing problem of prescription misuse
Page 41
Recommendations
Analyze TNCSMP data regularly Evaluate trends Monitor for aberrant activity
Monitor provider and pharmacy compliance with Safety Act of 2012
Educate key stakeholders about opioid misuse and abuse; providers, pharmacists, patients
Page 42
Tennessee Department of HealthCaleb Wiedeman, MPHJohn R. Dunn, DVM, PhDTim F. Jones, MD
Vanderbilt University School of Medicine William Schaffner, MD
Centers for Disease Control and Prevention Leonard J. Paulozzi, MD, MPHEdward C. Weiss, MD, MPH
The findings and conclusions in this report are those of the authors and do not
necessarily represent the official position of the Centers for Disease Control
and Prevention.Office of Surveillance, Epidemiology, and Laboratory ServicesScientific Education and Professional Development Program Office
Acknowledgments
Page 43
Office of Surveillance, Epidemiology, and Laboratory Services
Scientific Education and Professional Development Program Office
Thank You
Questions?
Page 44
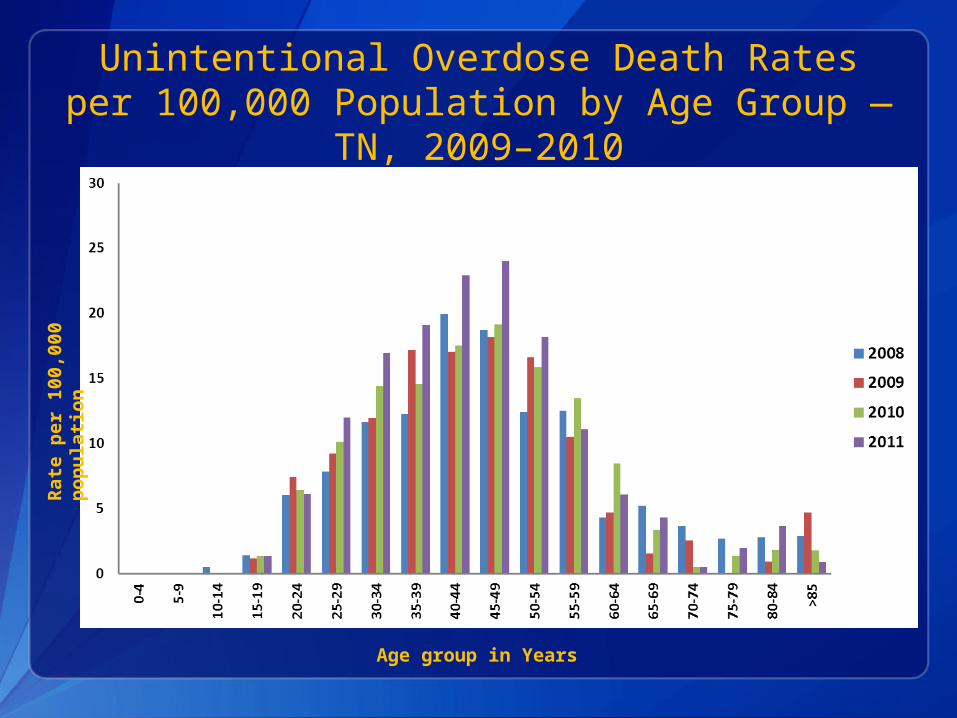
Unintentional Overdose Death Rates per 100,000 Population by Age Group — TN,
2009–2010
Rate
per
100,0
00
pop
ula
tion
Age group in Years
Page 45
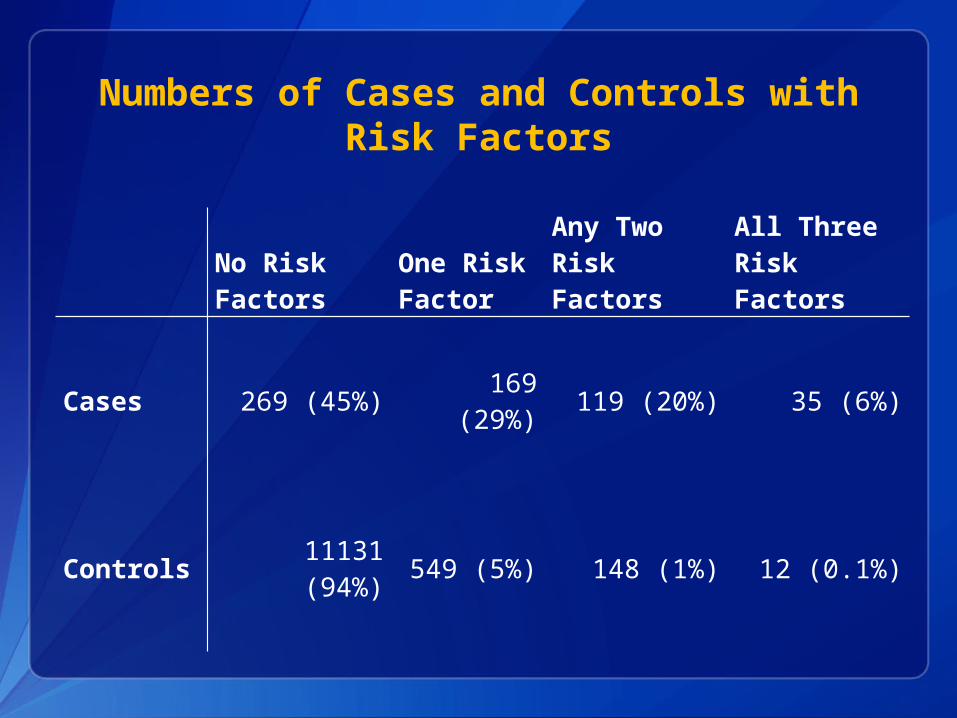
Numbers of Cases and Controls with Risk Factors
No Risk Factors
One Risk Factor
Any Two Risk Factors
All Three Risk Factors
Cases 269 (45%)169
(29%) 119 (20%) 35 (6%)
Controls11131 (94%) 549 (5%) 148 (1%) 12 (0.1%)
Page 46
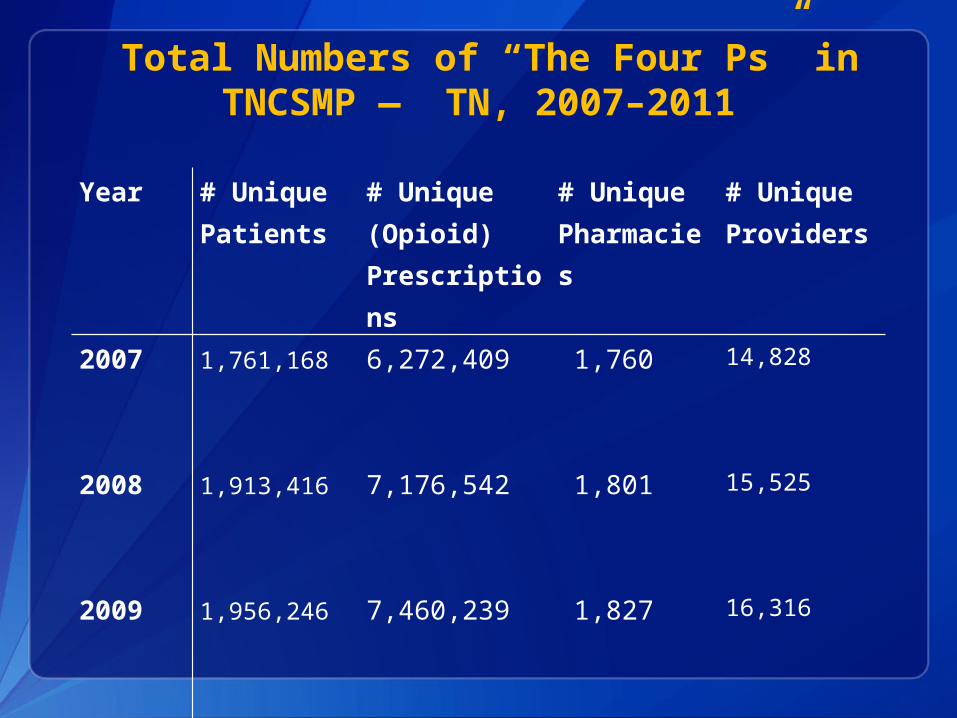
Year # UniquePatients
# Unique (Opioid) Prescriptions
# UniquePharmacies
# Unique Providers
2007
1,761,168
6,272,409 1,760 14,828
2008
1,913,416
7,176,542 1,801 15,525
2009
1,956,246
7,460,239 1,827 16,316
2010
1,959,923
7,739,698 1,885 17,054
2011
2,024,551
8,449,105 1,919 17,555
Total Numbers of “The Four Ps” in TNCSMP — TN, 2007–2011
Page 47
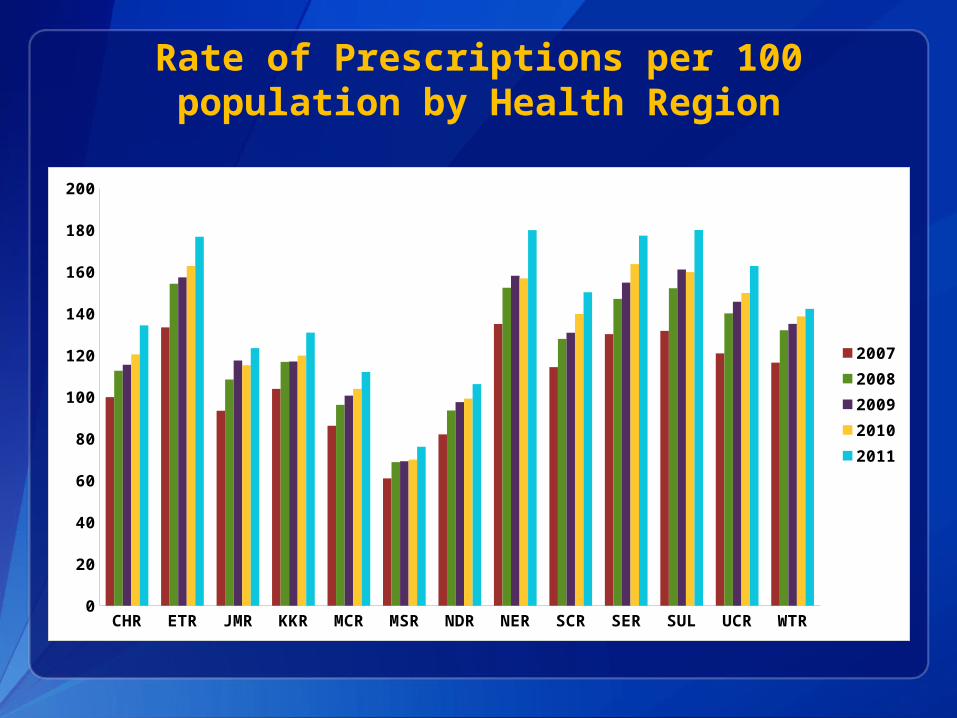
Rate of Prescriptions per 100 population by Health Region
CHR ETR JMR KKR MCR MSR NDR NER SCR SER SUL UCR WTR0
20
40
60
80
100
120
140
160
180
200
20072008200920102011
Page 48
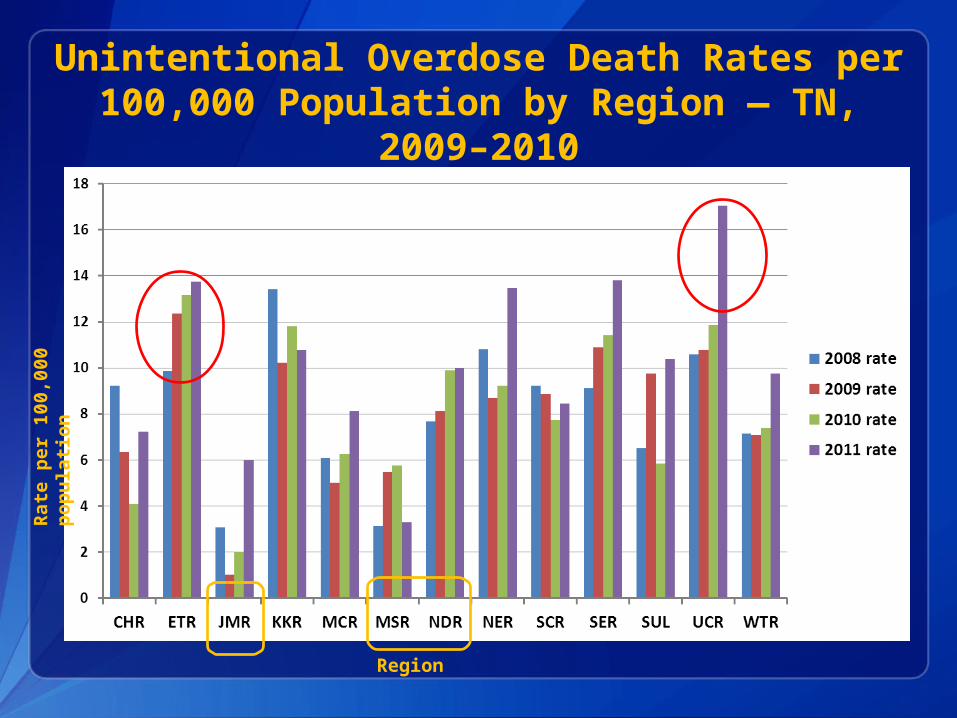
Unintentional Overdose Death Rates per 100,000 Population by Region — TN,
2009–2010
Region
Rate
per
100,0
00
pop
ula
tion