Presence and Distribution of Nitrate and Selected Pesticides in Surficial-Sand Aquifers and Selected Lakes, 1993-94, East Otter Tail County, Minnesota By Shannon E. Smith and James F. Ruhl________________ U.S. Geological Survey Open-File Report 95-116 Prepared in cooperation with the East Otter Tail County Soil and Water Conservation District and the Minnesota Department of Natural Resources Mounds View, Minnesota 1995
Transcript
Presence and Distribution of Nitrate and Selected Pesticides in Surficial-Sand Aquifers and Selected Lakes, 1993-94, East Otter Tail County, Minnesota
By Shannon E. Smith and James F. Ruhl________________
U.S. Geological Survey Open-File Report 95-116
Prepared in cooperation with theEast Otter Tail County Soil and Water Conservation District and the Minnesota Department of Natural Resources
Mounds View, Minnesota 1995
U.S. DEPARTMENT OF THE INTERIOR
BRUCE BABBITT, Secretary
U.S. GEOLOGICAL SURVEY
Gordon Eaton, Director
For additional information write to: Copies of this report can be purchased from:
U.S. Geological SurveyDistrict Chief Books and Open-File Reports Section U.S. Geological Survey Box 25425, Mail Stop 517 2280 Woodale Drive Federal Center Mounds View, MN 55112 Denver, CO 80225-0425
Objectives and purpose.................................................................................................................................... 2Description of study area.................................................................................................................................. 2Approach and methods..................................................................................................................................... 2Well-location system........................................................................................................................................ 2Acknowledgments............................................................................................................................................ 3
Figure 1. Map showing location of wells and lake sites where water-quality data werecollected, east Otter Tail County, Minnesota.......................................................................... 5
3. Location of wells sampled and analyzed for nitrate nitrogen, 1993-94, east OtterTail County, Minnesota..................................................................................................... 7
4. Location of wells sampled and analyzed for triazine herbicide compounds byimmunoassay, 1993-94, east Otter Tail County, Minnesota............................................. 8
Tables
Table 1. Water-quality data for wells sampled in 1993-94, east Otter Tail County, Minnesota........... 9
2. Nitrate-nitrogen concentration in water from 14 wells for 1979-81 (Myette, 1982)and 1993-94, east Otter Tail County, Minnesota.................................................................... 3
3. Concentrations of selected pesticides for wells sampled in 1994, east Otter TailCounty, Minnesota.................................................................................................................. 12
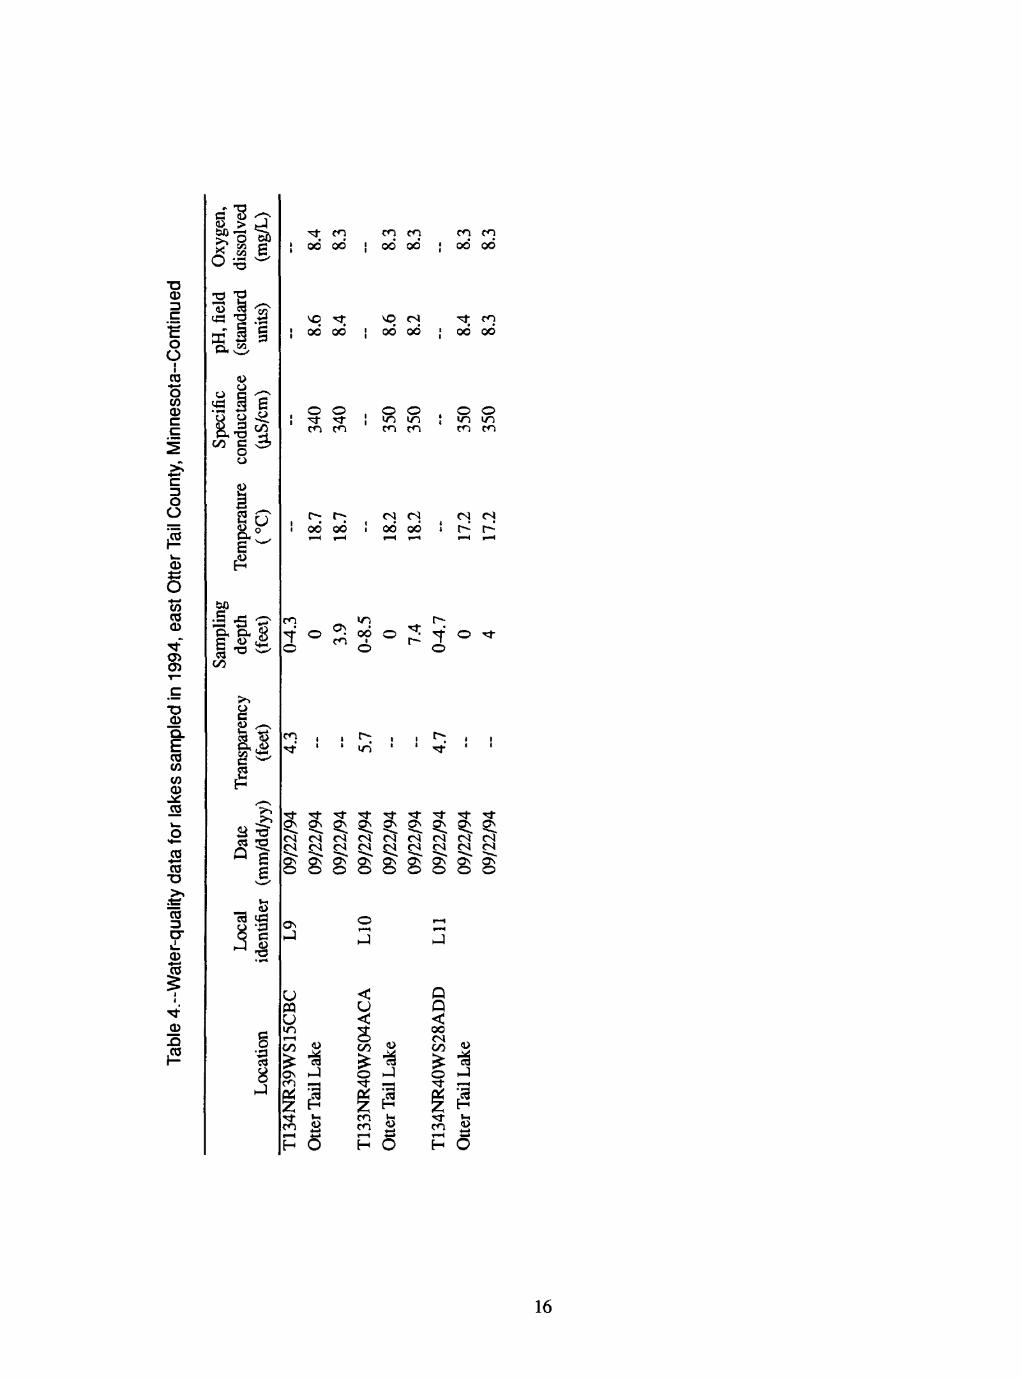
4. Water-quality data for lakes sampled in 1994, east Otter Tail County, Minnesota................. 15
Multiply
foot (ft)
mile (mi)
degree Fahrenheit (°F)
Conversion FactorsBy.
0.3048
1.609
5/9 x (°F - 32)
To Obtain
meter
kilometer
degree Celsius (°C)
Chemical concentrations are given in milligrams per liter (mg/L) or micrograms per liter (jJ-g/L). Milligrams per liter is a unit expressing the concentration of chemical constituents in solution as weight (milligrams) of solute per unit volume (liter) of water. One thousand micrograms per liter is equivalent to one milligram per liter.
111
Definition of TermsAlkalinity: The sum of carbonate species in water; commonly reported as an equivalent amount of calcium
carbonate; attributed mostly to dissolved forms of carbon dioxide if the pH of the water is less than 9.5.
Aquifer: Geologic or stratigraphic unit that contains sufficient saturated, permeable material to yield usable quantities of water to wells or springs.
Dissolved: The amount of a given constituent carried in solution that passes through a 0.45 micron membrane filter.
Ground water: Subsurface water that is in the saturated zone beneath the water table.
Hardness: The soap-consuming capacity of water; generally attributable to calcium and magnesium; commonly reported as an equivalent concentration of calcium carbonate. Water that ranges in hardness from 0 to 60 mg/L (as calcium carbonate) is soft, from 61 to 120 mg/L is moderately hard, from 121 to 180 mg/L is hard, and greater than 180 mg/L is very hard (Hem, 1985).
Metabolite: Decomposition product of a compound, such as a pesticide, after it begins to degrade in the environment.
Outwash: Sorted and stratified sand and gravel deposited by flowing meltwater from glacial ice.
Pesticides: A general term for agricultural chemicals used to kill crop pests; these chemicals include herbicides, insecticides, and fungicides. Only herbicides and insecticides were analyzed for in this study.
pH: A measure of the acidity (or alkalinity) of a solution; the negative logarithm of the concentration of hydrogen ions in solution. A pH of 7.0 indicates a neutral solution. pH values less than 7.0 indicate an acid solution and pH values greater than 7.0 indicate an alkaline solution.
Saturated zone: The part of a surficial or unconfined aquifer where ah1 of the pore space is filled with water. The water table is the upper limit of this zone. Water in the saturated zone is under pressure equal to or greater than atmospheric.
Specific conductance: The capacity of water to conduct an electrical current; generally proportional to the dissolved solids concentration in most dilute natural water.
Unconfined aquifer: A water-bearing formation that is not completely saturated with water; an aquifer that has a water table. Also referred to as a surficial or water-table aquifer.
Water table: The level in the saturated zone where the water pressure is atmospheric; in an unconfined aquifer this level is the same as the top of the saturated zone.
IV
Presence and Distribution of Nitrate and Selected Pesticides in
Surficial-Sand Aquifers and Selected Lakes, 1993-94,
East Otter Tail County, Minnesota
By S.E. Smith and J.F. Ruhl
AbstractThis report presents selected data collected during the first year (December 1993 to September 1994) of a three
year water-quality study of surficial-sand aquifers and selected lakes in east Otter Tail County, Minnesota. The objectives of the study are (1) to determine the presence and distribution of nitrate-nitrogen and selected pesticides in ground water from the surficial-sand aquifers; and (2) to characterize the water quality of selected lakes and the Otter Tail River.
Ground water was sampled from 73 wells. The concentration of nitrate nitrogen in ground water was above 10 mg/L (milligrams per liter) in 30 of the sampled wells (38 percent). The concentration of triazine herbicide compounds, as determined by immunoassay, was above the detection limit 0.10 |ig/L (micrograms per liter) in water from 17 of the sampled wells (24 percent). The nitrate-nitrogen concentration in water from 14 wells, compared to data collected during a previous study in 1979-81, increased in water from 4 wells and decreased in water from 4 wells.
Lake water was sampled from 11 sites on Little Pine, Big Pine, Rush, and Otter Tail Lakes. Nitrate-nitrogen concentrations were all below the detection limit (0.05 mg/L). The concentration of triazine herbicide compounds, as determined by immunoassay, was at or below the detection limit (0.10 |J.g/L) at all 11 sites. Dissolved oxygen concentrations at the sites ranged from 7.3 to 10.1 mg/L at the water surface, and from 5.3 to 9.7 mg/L at depth. Secchi disk transparency readings ranged from 4.0 to 7.4 feet. Total phosphorus concentrations were generally near or below the detection limit (0.01 mg/L) except at one site where the water had a total phosphorus concentration of 0.06 mg/L.
INTRODUCTION
The presence of nitrates and pesticides in ground and surface water is a source of concern in Minnesota. Nitrogen fertilizers and pesticides applied to agricultural land are potential sources of contamination to ground and surface water. Agriculture is a major land use in east Otter Tail County, Minnesota, which is underlain by unconfined surficial-sand aquifers and overlain by lakes. Lakes and rivers are vulnerable to contaminants transported in runoff or in ground-water discharge. Contaminants may leach into aquifers by water percolating from the land surface to the water table. The use of irrigation systems may increase the concentrations of contaminants in surface and ground water. An investigation of the presence and distribution of nitrates and pesticides in ground and surface water in east Otter Tail County is being conducted by the U.S.
Geological Survey in cooperation with the East Otter Tail County Soil and Water Conservation District and the Minnesota Department of Natural Resources (MDNR). This investigation will benefit local water resource managers and citizens by providing them information about ground- and surface-water quality in the county.
The maximum permissible level of nitrate and pesticides in a public water supply system is the maximum contaminant level (MCL) established by the U.S. Environmental Protection Agency (USEPA). The MCL for nitrate-nitrogen is 10 mg/L (U.S. Environmental Protection Agency, 1991). Most pesticides and pesticide metabolites do not have an established MCL. Pesticides that do have established MCLs include atrazine (3 |ig/L), alachlor (2 |ig/L), aldicarb (3 |ig/L), aldicarb sulfone (2 |ig/L), aldicarb
Objectives and PurposeThe objectives of the study are: (1) to determine the
presence and distribution of nitrate-nitrogen and selected pesticides in ground water from the surficial- sand aquifers; and (2) to characterize the water quality of selected lakes and the Otter Tail River. This report: (1) presents selected data collected during the first year of a three-year study, including ground-water quality data collected from 73 wells completed in the surficial- sand aquifers and surface-water quality data collected at 11 sites on Little Pine, Big Pine, Rush, and Otter Tail Lakes (fig. 1, in the back of this report) and (2) compares nitrate-nitrogen concentrations to results from a previous study conducted in this area during 1979-81.
Description of Study AreaEast Otter Tail County, in west-central Minnesota, is
typical of many areas in the glaciated Upper Midwest that are comprised of surficial-glacial outwash. Surficial-glacial outwash consists of sand and gravel, and generally are unconfined, or water-table aquifers, hereinafter referred to as surficial-sand aquifers.
Approach and MethodsGround-water samples were collected from 73
wells. Sampled wells include 21 monitoring wells installed by the U.S. Geological Survey, 5 monitoring wells installed by the MDNR, and 47 privately owned wells used mostly for domestic and livestock supplies. Well depths were obtained from three sources: (1) well logs recorded by the driller for the 26 monitoring wells; (2) a report published by Myette (1982) for 14 privately owned wells resampled in this study; and (3) the well owner's descriptions for the other 33 privately owned wells (many of these wells were hand-driven sand point wells that were assumed to have a depth of 30 feet or less).
Prior to collection of ground-water samples, the sampled wells were pumped for about 20 minutes while the water was monitored for temperature, specific conductance, pH, and dissolved oxygen. The quality of sampled water was assumed to be representative of the quality of ground water in the aquifer when these properties stabilized.
Lake-water samples were collected at 11 sites on Little Pine, Big Pine, Rush, and Otter Tail Lakes.
Samples were collected by depth integration from the lake surface to a depth equal to about 1.5 times the secchi disk transparency reading. Secchi disk transparency readings and vertical profiles of temperature, specific conductance, pH, and dissolved oxygen were measured at each lake site.
Measurements of water-quality characteristics including temperature, specific conductance, pH, dissolved oxygen, and transparency were made in the field with portable meters that were calibrated at the start of each sampling day. Water samples were analyzed for nutrients, chloride, and pesticides at the U.S. Geological Survey National Water-Quality Laboratory in Arvada, Colorado. Quality control replicate, blank, and spiked water samples for nutrients and pesticides were analyzed at the U.S. Geological Survey National Water-Quality Laboratory.
Water samples from the wells and lakes were analyzed to determine the concentrations of nitrogen and phosphorous nutrients, chloride, and triazine herbicide compounds. The combined concentration of nitrite nitrogen and nitrate nitrogen is considered to be equivalent to the concentration of nitrate nitrogen because the concentration of nitrite nitrogen generally was negligible.
Triazine concentrations were determined by immunoassay method (Millipore 1 , Marlborough, Massachusetts; Thurman and others, 1990) at the Minnesota District laboratory in Mounds View, Minnesota. A triazine concentration greater than or equal to 0.10 |ig/L indicates that a combination of one or more triazine herbicide compounds or metabolites are present in the water sample. Triazine herbicide compounds detected by this method include ametryn, atrazine, cyanazine, de-ethyl atrazine, prometon, prometryn, propazine, simazine, simetryn, terbuthylazine, terbutryn, and trietazine. The results are reported as jig/L as atrazine. Water from 11 wells was analyzed for commonly used herbicides and insecticides by gas chromatography/mass spectrometry (GC/MS).
Well-Location SystemThe system used to locate wells in this report is based
on the Federal system of land subdivision (township, range, and section) (fig. 2, in the back of this report). In this system, the first number of a location number
1 The use of brand names in this report is for identification purposes only and does not constitute an endorsement by the U.S. Geological Survey.
indicates the township; the second, the range; and the third, the section in which the well is located. Uppercase letters after the section number indicate location within the section. Letters A, B, C, and D are assigned in a counterclockwise direction, beginning in the northeast corner of each tract. The first letter denotes the 160-acre tract; the second, the 40-acre tract; and the third, the 10-acre tract. For example, the well location T136NR39W16ADC indicates a well in the SW 1/4 of the SE 1/4 of the ME 1/4 of section 16, township 136 north, range 39 west.
AcknowledgmentsWe are grateful to the many land owners in east Otter
Tail County who gave us permission to obtain samples of their well water, or who allowed us to install a monitoring well on their property.
Ground-Water QualityThe concentration of nitrate nitrogen ranged from
less than the detection limit (0.05 mg/L) to 50 mg/L (table 1, in the back of this report). Twenty-eight of the sampled wells (38 percent) had water with a nitrate- nitrogen concentration higher than the MCL of 10 mg/L (fig. 3, in the back of this report).
The wells were grouped into two total depth categories: deep wells with a depth greater than 40 feet below the land surface (15 wells) or shallow wells with a depth less than or equal to 40 feet (58 wells). Five of the deep wells (33 percent of the deep wells) had water with a nitrate-nitrogen concentration higher than 10 mg/L. Twenty-three of the shallow wells (40 percent of the shallow wells) had water with a nitrate-nitrogen concentration higher than 10 mg/L.
Fourteen wells sampled in 1993-94 also were sampled in 1979-81 as a part of an earlier study (Myette, 1982 and 1984) (table 2). The nitrate-nitrogen concentration in water from five of these wells was higher than 10 mg/L in 1993-94. Water from four wells had a nitrate-nitrogen concentration that increased between 1.4 and 8.9 times from the 1979-81 period to the 1993-94 period (wells 19, 37, 60, 72). The concentration in water from 4 wells decreased from the 1979-81 period to the 1993-94 period (wells 7,31,41, 54).
The estimated concentration of triazine herbicide compounds determined by immunoassay in water from 72 of the wells ranged from less than the detection limit (0.10 (ig/L) to 3.71 jig/L (table 1). Seventeen of these wells (24 percent) had a triazine concentration greater
Table 2.-- Nitrate-nitrogen concentration in waterfrom 14 wells for 1979-81 (Myette, 1982) and
1993-94, east Otter Tail County, Minnesota[mg/L, milligrams per liter; (2), number of samples
used for calculation of mean,where number of wells is greater than one;
<, less than]
Local identifier
67
193137
394144455457596072
Nitrogen, nitrite plus nitrate, dissolved
(mg/L as nitrogen) 1979-81
0.049.1
14.6 (5).49 (6)
5.612.0
.32(6)7.2(5)
.42 (15)
.72
.04
.04(6)2.1 (6)
10.2 (5)
Nitrogen, nitite plus nitrate, dissolved
(mg/L as nitrogen) 1993-94
0.14
3.028.0<.05
50.013.0<.057.1 (2)
.14<.05<.05<.05
15.5 (2)
14.0 (2)
than the detection limit (fig. 4, in the back of this report). Two of these wells were deep wells (13 percent of the deep wells) and 15 were shallow wells (26 percent of the shallow wells).
Water from 11 wells was analyzed by GC/MS for selected pesticides (table 3, in the back of this report). The concentrations of most of these compounds were below their respective detection limits. Atrazine, cyanazine, de-ethyl atrazine, and metribuzin were detected at or near the detection limit (0.02,0.01,0.01, and 0.01 (ig/L, respectively) in a total of six wells. Water from wells 1,3, and 23 had atrazine concentrations of 0.01 (ig/L and water from wells 9 and 28 had atrazine concentrations of 0.02 fig/L. Water from well 23 had a cyanazine concentration of 0.02 jig/L. Water from wells 3,9, and 28 had de-ethyl atrazine concentrations of 0.05,0.02, and 0.01 (ig/L, respectively. Water from well 5 had a metribuzin concentration of 0.05 (ig/L. These concentrations are below the MCLs for any herbicide.
Lake-Water QualityWater samples were collected at 11 sites on Little
Pine, Big Pine, Rush, and Otter Tail Lakes in September 1994 (fig. 1). The nitrate-nitrogen concentration was below the detection limit of 0.05 mg/L at each of the 11 sites (table 4, in the back of this report). The concentration of triazine herbicide compounds, as determined by immunoassay, was at or below the detection limit (0.10 |4.g/L) at all 11 sites. Site L10, near the outlet of Otter Tail Lake, had trace amounts of triazine herbicide compounds detected at 0.10 n.g/L.
Vertical profiles of specific conductance, pH, temperature, and dissolved oxygen were measured at 11 sites. Table 4 shows water-quality data at the water surface and at the deepest point for each site. The values for these properties changed very little with depth except for two sites (L3 and L7). The dissolved oxygen concentrations generally ranged from 7.1 to 10.1 mg/L throughout the water column. The dissolved oxygen concentration decreased with depth at site L3 on Big Pine Lake, where the concentration decreased from 9.2 mg/L at the surface to 5.3 mg/L at a depth of 10.7 feet, and at site L7 on Rush Lake, where the concentration decreased from 10.1 mg/L at the surface to 6.8 mg/L at a depth of 21.6 feet.
The measured and analyzed values for transparency and phosphorus are also listed in table 4. The secchi disk transparency readings were: 4.1 feet on Little Pine Lake, 4.0-5.4 feet on Big Pine Lake, 4.4-5.0 feet on Rush Lake, and 4.3-7.4 feet on Otter Tail Lake. The total phosphorus concentrations ranged from less than 0.01 to 0.02 mg/L at all sites except L7 on Rush Lake, where total phosphorus concentration was 0.06 mg/L.
Thurman, E.M., Meyer, Michael, Pomes, Michael, Perry, C.A., and Schwab, A.P., 1990, Enzyme- linked immunosorbent assay compared with pas chromatography/mass spectrometry for the determination of triazine herbicides in water: Analytical Chemistry, v. 62, no. 18, p. 2043-2048.
U.S. Environmental Protection Agency, 1991, Is your drinking water safe?: Washington D.C., U.S. Environmental Protection Agency Report 570/09- 91-005,24 p.
ReferencesHem, J.D., 1985, Study and interpretation of the
chemical characteristics of natural water: U.S. Geological Survey Water-Supply Paper 2254,263 p., 3 plates.
Myette, C.F., 1982, Baseline water-quality data for sand-plain aquifers in Hubbard, Morrison, Otter Tail, and Wadena Counties, Minnesota: U.S. Geological Survey Open-File Report 82-909,112 P-
Myette, C.F., 1984, Ground-water quality appraisal of sand-plain aquifers in Hubbard, Morrison, Otter Tail, and Wadena Counties, Minnesota: U.S. Geological Survey Water-Resources Investigations Report 84-4080,49 p.
95° 45' 95° 30' 95" 15'
46° 30'
46° 15' -
132
R40WBase from U.S. Geological Survey digital data 1:100,000, 1972, Alters Equal-Area Conic° ' °,, ,Projection, standard parallels 29° 30' and 45° 30', Central meridian 95° 30'
R 38 W R 36 WSCALE 1:400.000
0 5 10 15MILESI i, ' I I I i, I I i i i i i i i IIIIIIilrTiil1Tn0 5 10 15 KILOMETERS
.21
EXPLANATION
*' Wells (number indicates local identifer)
O Lake sites (letter and number indicate local identifer)
LOCATION MAP
Figure 1. Location of wells and lake sites where water-quality data were collected,east Otter Tail County, Minnesota.
T136NR39W16ADC
Figure 2. Well-location system.
95° 45' 95° 30' 95° 15'
46° 30" -
R40WBase from U.S. Geological Survey digital data 1:100,000,1972,Albers Equal-Area Conic Projection, standard parallels 29° 30' and 45° 30', Central meridian 95° 30"
LOCATION MAP
R38W R36W SCALE 1:400,000
0 5 10 15 MILESi i i i I j I i i i i i i i i iI I I I I I I I I I I it i I \0 5 10 15 KILOMETERS
EXPLANATION
Deep wells (depth greater than 40 feet)Shallow wells (depth less than or equal to 40 feet)Wells with nitrate-nitrogen concentrations
greater than 10 milligrams per liter
Figure 3. Location of wells sampled and analyzed for nitrate nitrogen, 1993-94, east Otter Tail County, Minnesota.
95° 45' 95° 30' 95° 15'
46° 30"
46" 15' -
R40WBase from U.S. Geological Survey digital data 1:100,000.1972, Albers Equal-Area Conic Projection, standard parallels 29° 30' and 45° 30', Central meridian 95° 30'
R38WSCALE 1X00,000
5 10
R36W
1SMILES i t i i i
10 IS KILOMETERS
EXPLANATIONDeep wells (depth greater than 40 feet)Shallow wells (depth less than or equal to 40 feet)Wells with detectable triazine herbicides
LOCATION MAP
Figure 4. Location of wells sampled and analyzed for triazine herbicide compounds by immunoassay, 1993-94, east Oner Tail County, Minnesota.