International Journal of Environmental Research and Public Health Article Present and Future of Dengue Fever in Nepal: Mapping Climatic Suitability by Ecological Niche Model Bipin Kumar Acharya 1,2 ID , Chunxiang Cao 1, *, Min Xu 1 , Laxman Khanal 2,3,4 ID , Shahid Naeem 1,2 ID and Shreejana Pandit 5 1 State Key Laboratory of Remote Sensing Science, Institute of Remote Sensing and Digital Earth, Chinese Academy of Sciences, Beijing 100094, China; [email protected] (B.K.A.); [email protected] (M.X.); [email protected] (S.N.) 2 University of Chinese Academy of Sciences, Beijing 100049, China; [email protected]3 Kunming Institute of Zoology, Chinese Academy of Sciences, Kunming 650223, China 4 Central Department of Zoology, Institute of Science and Technology, Tribhuvan University, Kathmandu 44613, Nepal 5 Kanti Children’s Hospital Maharajgunj, Kathmandu 44616, Nepal; [email protected]* Correspondence: [email protected]; Tel.: +86-10-6480-6228 Received: 15 November 2017; Accepted: 17 January 2018; Published: 23 January 2018 Abstract: Both the number of cases of dengue fever and the areas of outbreaks within Nepal have increased significantly in recent years. Further expansion and range shift is expected in the future due to global climate change and other associated factors. However, due to limited spatially-explicit research in Nepal, there is poor understanding about the present spatial distribution patterns of dengue risk areas and the potential range shift due to future climate change. In this context, it is crucial to assess and map dengue fever risk areas in Nepal. Here, we used reported dengue cases and a set of bioclimatic variables on the MaxEnt ecological niche modeling approach to model the climatic niche and map present and future (2050s and 2070s) climatically suitable areas under different representative concentration pathways (RCP2.6, RCP6.0 and RCP8.5). Simulation-based estimates suggest that climatically suitable areas for dengue fever are presently distributed throughout the lowland Tarai from east to west and in river valleys at lower elevations. Under the different climate change scenarios, these areas will be slightly shifted towards higher elevation with varied magnitude and spatial patterns. Population exposed to climatically suitable areas of dengue fever in Nepal is anticipated to further increase in both 2050s and 2070s on all the assumed emission scenarios. These findings could be instrumental to plan and execute the strategic interventions for controlling dengue fever in Nepal. Keywords: dengue mapping; climate change; Nepal; MaxEnt 1. Introduction Dengue fever is a mosquito-borne viral disease transmitted by the female Aedes mosquito, especially the Aedes aegypti. In recent years, dengue has been a serious public health concern of tropical and subtropical countries across the world. It has been estimated that around 390 million infections occur annually and about 3.9 billion people are under the direct risk of the disease [1]. The burden of disease has increased 30-fold over the past 50 years [2] and the number of dengue-endemic countries increased from 9–125 in the last 40 years [3]. Further geographic expansion of the disease is expected in the future due to climate change, urbanization, and migration [4]. Dengue is a climate-sensitive disease. Temperature and precipitation are the most important climate factors in the occurrence and transmission of dengue fever [5]. These climate factors affect Int. J. Environ. Res. Public Health 2018, 15, 187; doi:10.3390/ijerph15020187 www.mdpi.com/journal/ijerph
Transcript
International Journal of
Environmental Research
and Public Health
Article
Present and Future of Dengue Fever in Nepal:Mapping Climatic Suitability by EcologicalNiche Model
Bipin Kumar Acharya 1,2 ID , Chunxiang Cao 1,*, Min Xu 1, Laxman Khanal 2,3,4 ID ,Shahid Naeem 1,2 ID and Shreejana Pandit 5
1 State Key Laboratory of Remote Sensing Science, Institute of Remote Sensing and DigitalEarth, Chinese Academy of Sciences, Beijing 100094, China; [email protected] (B.K.A.);[email protected] (M.X.); [email protected] (S.N.)
2 University of Chinese Academy of Sciences, Beijing 100049, China; [email protected] Kunming Institute of Zoology, Chinese Academy of Sciences, Kunming 650223, China4 Central Department of Zoology, Institute of Science and Technology, Tribhuvan University,
Received: 15 November 2017; Accepted: 17 January 2018; Published: 23 January 2018
Abstract: Both the number of cases of dengue fever and the areas of outbreaks within Nepal haveincreased significantly in recent years. Further expansion and range shift is expected in the futuredue to global climate change and other associated factors. However, due to limited spatially-explicitresearch in Nepal, there is poor understanding about the present spatial distribution patterns ofdengue risk areas and the potential range shift due to future climate change. In this context, it iscrucial to assess and map dengue fever risk areas in Nepal. Here, we used reported dengue casesand a set of bioclimatic variables on the MaxEnt ecological niche modeling approach to model theclimatic niche and map present and future (2050s and 2070s) climatically suitable areas under differentrepresentative concentration pathways (RCP2.6, RCP6.0 and RCP8.5). Simulation-based estimatessuggest that climatically suitable areas for dengue fever are presently distributed throughout thelowland Tarai from east to west and in river valleys at lower elevations. Under the different climatechange scenarios, these areas will be slightly shifted towards higher elevation with varied magnitudeand spatial patterns. Population exposed to climatically suitable areas of dengue fever in Nepalis anticipated to further increase in both 2050s and 2070s on all the assumed emission scenarios.These findings could be instrumental to plan and execute the strategic interventions for controllingdengue fever in Nepal.
Dengue fever is a mosquito-borne viral disease transmitted by the female Aedes mosquito,especially the Aedes aegypti. In recent years, dengue has been a serious public health concern of tropicaland subtropical countries across the world. It has been estimated that around 390 million infectionsoccur annually and about 3.9 billion people are under the direct risk of the disease [1]. The burden ofdisease has increased 30-fold over the past 50 years [2] and the number of dengue-endemic countriesincreased from 9–125 in the last 40 years [3]. Further geographic expansion of the disease is expectedin the future due to climate change, urbanization, and migration [4].
Dengue is a climate-sensitive disease. Temperature and precipitation are the most importantclimate factors in the occurrence and transmission of dengue fever [5]. These climate factors affect
Int. J. Environ. Res. Public Health 2018, 15, 187; doi:10.3390/ijerph15020187 www.mdpi.com/journal/ijerph
Int. J. Environ. Res. Public Health 2018, 15, 187 2 of 15
mosquito population (survival and development), virus propagation (replication) and vector-hostinteraction (biting rate) [6]. Increased temperature alters vectorial capacity by reducing the durationof mosquito development rate, vector competence and extrinsic incubation period [7–9]. The righttemperature and level of precipitation are important to provide the necessary environment for thedevelopment of the mosquito vector, but thermal extremes and heavy rainfall are negatively associatedwith the disease [10]. Therefore, global geographic distribution of the dengue has been determinedby latitude as a proxy to temperature, whereas, on a local scale, its distribution has been limited byaltitude as a proxy for thermal variation [11].
The climate change issue remained one of the controversial focus points in the last few decades.Recently, scientists have largely agreed on attributing global warming to an increasing concentrationof greenhouse gases in the atmosphere. According to the recent International Panel on Climate Change(IPCC) report, the average global temperature has increased by 0.85 ◦C from 1880–2012 and is likely toincrease further by a minimum of 0.3–1.7 ◦C (representative concentration pathway (RCP) 2.6) and amaximum of 2.6 to 4.8 ◦C (RCP8.5) by the end of the century relative to the 1986–2005 temperature [12].Due to the close link with climate factors, many experts hypothesize that the dengue incidence willincrease in the future by expanding geographic range [13–17]. Increases in the global temperature cancause latitudinal and altitudinal shifts in the ecological niche of vector-borne infectious diseases [14].Improvement in our understanding of how the changing climate may contribute to the geographicexpansion of mosquitoes and the disease into new areas is very crucial to support the public healthauthorities for effective surveillance and control strategies.
Several efforts have been made earlier to map distribution of the dengue fever in global [1],regional [18], national, and subnational scales [19]. Geographic Information System (GIS) and RemoteSensing (RS) technology and more recently, the ecological niche based species distribution modeling(SDM) approach have made remarkable breakthroughs in this field, especially in the availabilityof geospatial data, computational capacity and the strength of visualization. SDM offers severaladvantages over the traditional mapping techniques (data driven descriptive choropleth mapping andanalytical spatial interpolation methods) [20]. Unlike the traditional mapping technique, SDM canproduce a more accurate and robust map even with an incomplete and noisy dataset [19,20]. This is themost important advantage of the SDM in disease mapping as collection of disease data is difficult dueto underreporting, misdiagnosis and ethical issues of personal identity. SDM establish relationshipsbetween known locations of disease with potential environmental covariates then predict distributionin a space and time. Using these methods, several previous studies [1,19,21] were able to widen ourunderstanding not only on the present distribution of dengue fever but also on possible impact ofclimate change in the future [21]. Such studies successfully identified the risk factors associated withthem. MaxEnt, Boosted Regression Tree (BRT), Random Forest are some of the widely used machinelearning SDM algorithms. Among others, MaxEnt, which requires presence-only data (instead ofpresence/absence) is widely used among the mapping methods due to robust predictive performancecompared to other contemporary methods [22].
Dengue fever cases have been reported every year from southern lowland Tarai in Nepal sinceits emergence in 2004. In 2010 and 2013, Nepal experienced two large outbreaks with 917 confirmedcases and five deaths, and 642 confirmed cases respectively [23]. These statistics are believed to beunderreported and the prevalence of dengue is considered much higher [24]. Lowland Tarai especiallyChitwan and Jhapa district were severely affected districts in those outbreaks. Recently the diseasehas been reported from higher elevated mid hills. Nepal is one of the vulnerable countries from theglobal climate change perspectives. The region has warmed up by 1.5 ◦C in the last 25 years with muchhigher rates compared to the global average and is expected to be warmer and wetter in the future dueto climate change [25]. In this context dengue is likely to be shifted toward higher elevation [26] inresponse to such climate change. The recent study documented the presence of A. aegypti up to 2000m above sea level (asl) [27] and all the serotypes of dengue virus circulate among host, vector andenvironment in the country [28,29]. The dengue problem can be anticipated to get much worse in the
Int. J. Environ. Res. Public Health 2018, 15, 187 3 of 15
future. However, climate-based spatial risk assessment is lacking in Nepal, both for the present andfor the future. To support the surveillance and dengue control strategies, it is imperative to have sucha mapping assessment. To overcome this lack, we mapped present and future climatically suitableareas of dengue fever in Nepal based on reported dengue cases collected from different sources and aset of bioclimatic variables using the ecological niche model. Based on the model, we estimated theproportion of people/area at risk of the disease.
2. Materials and Methods
2.1. Study Area
Nepal is approximately located between a latitude of 26◦ to 30◦ North and a longditude of 80◦
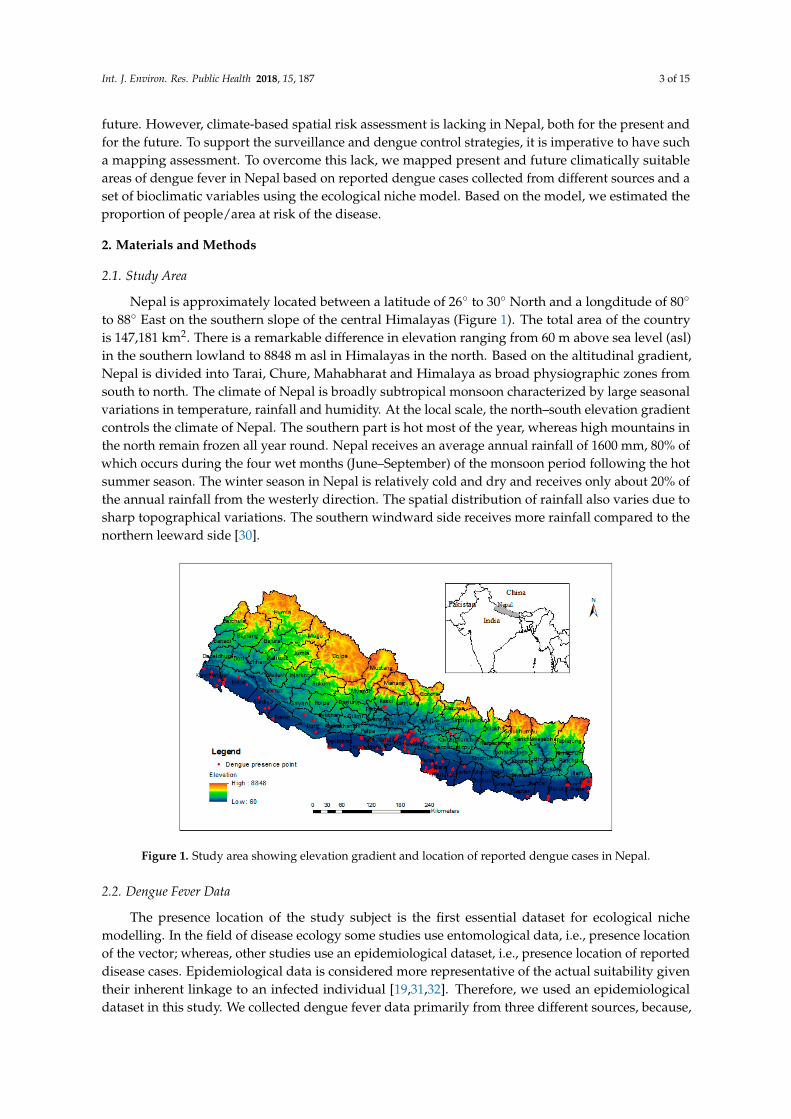
to 88◦ East on the southern slope of the central Himalayas (Figure 1). The total area of the countryis 147,181 km2. There is a remarkable difference in elevation ranging from 60 m above sea level (asl)in the southern lowland to 8848 m asl in Himalayas in the north. Based on the altitudinal gradient,Nepal is divided into Tarai, Chure, Mahabharat and Himalaya as broad physiographic zones fromsouth to north. The climate of Nepal is broadly subtropical monsoon characterized by large seasonalvariations in temperature, rainfall and humidity. At the local scale, the north–south elevation gradientcontrols the climate of Nepal. The southern part is hot most of the year, whereas high mountains inthe north remain frozen all year round. Nepal receives an average annual rainfall of 1600 mm, 80% ofwhich occurs during the four wet months (June–September) of the monsoon period following the hotsummer season. The winter season in Nepal is relatively cold and dry and receives only about 20% ofthe annual rainfall from the westerly direction. The spatial distribution of rainfall also varies due tosharp topographical variations. The southern windward side receives more rainfall compared to thenorthern leeward side [30].
Figure 1. Study area showing elevation gradient and location of reported dengue cases in Nepal.
2.2. Dengue Fever Data
The presence location of the study subject is the first essential dataset for ecological nichemodelling. In the field of disease ecology some studies use entomological data, i.e., presence locationof the vector; whereas, other studies use an epidemiological dataset, i.e., presence location of reporteddisease cases. Epidemiological data is considered more representative of the actual suitability giventheir inherent linkage to an infected individual [19,31,32]. Therefore, we used an epidemiologicaldataset in this study. We collected dengue fever data primarily from three different sources, because,
Int. J. Environ. Res. Public Health 2018, 15, 187 4 of 15
the complete coverage of dengue data was not available from a single source such as governmentrecords. The majority of them were retrieved from the line listing file; a patient address log book atEpidemiology and Disease Control Division (EDCD), Department of Health Services, Governmentof Nepal. Similarly, we also collected dengue presence locations from national newspaper portals.The third source of dengue data was the health map geoportal (http://www.healthmap.org/en/).All the sources of data were confirmed dengue cases reported to the authority based on laboratory tests.The dengue data from the first two sources were address level data without geolocation attached, so, wegeocoded them using Google API (Application Programming Interfaces) in R (Supplementary Note S1).Finally, 178 dengue presence geolocations were filtered based on one square kilometer grids andduplications were removed, retaining 124 dengue presence locations (Table S1) for the ecological nichemodelling (ENM).
2.3. Predictor Variables
We retrieved 19 bioclimatic variables (version 1.4) in a 30 arc second spatial resolution (Table 1)from the WorldClim global climate database (http://www.worldclim.org) [33] to represent the presentbioclimatic conditions. This dataset was generated by interpolation using a thin-plate smoothingspline of observed climate from worldwide weather stations for the period of 1950–2000, with latitude,longitude and elevation as independent variables [33]. These data are biologically meaningful variablesthat capture annual ranges, seasonality, and limiting factors useful for niche modeling (such as monthlyand quarterly temperature and precipitation extremes) [33]. Elevation was not explicitly used in modelconstruction because it has already been used as a covariate in the Worldclim data production [34].
Table 1. Predictor variables used in the construction of the niche models.
Abbreviation Description
Bio1 Annual Mean TemperatureBio2 Mean Diurnal Range (Mean of monthly (max temp–min temp))Bio3 Isothermally (P2/P7) (×100)Bio4 Temperature Seasonality (standard deviation × 100)Bio5 Max Temperature of Warmest MonthBio6 Min Temperature of Coldest MonthBio7 Temperature Annual Range (P5–P6)Bio8 Mean Temperature of Wettest QuarterBio9 Mean Temperature of Driest QuarterBio10 Mean Temperature of Warmest QuarterBio11 Mean Temperature of Coldest QuarterBio12 Annual PrecipitationBio13 Precipitation of Wettest MonthBio14 Precipitation of Driest MonthBio15 Precipitation Seasonality (Coefficient of Variation)Bio16 Precipitation of Wettest QuarterBio17 Precipitation of Driest QuarterBio18 Precipitation of Warmest QuarterBio19 Precipitation of Coldest Quarter
To estimate the impacts of plausible future climate conditions [12], we selected the CommunityClimate System Model (CCSM) representing three future greenhouse gases concentration trajectories,also known as representative concentration pathways (RCP2.6, RCP6.0 and RCP8.5), for two differenttime periods (2050s and 2070s) as adopted by the International Panel on Climate Change (IPCC)in its fifth Assessment Report (AR5). The selected RCPs represent four possible greenhouse gasemission scenarios ranging from low (RCP2.6) to high (RCP8.5) corresponding to increases in globalradiative forcing values in the year 2100 relative to preindustrial values (2.6, 4.5, 6.0 and 8.5 w/m2),respectively. Future climate projection data were also downloaded from the Worldclim geoportal(http://www.worldclim.org/).
Int. J. Environ. Res. Public Health 2018, 15, 187 5 of 15
2.4. Modeling and Validation
We used the Maximum entropy modeling (MaxEnt) [35] approach using the standalone MaxEntsoftware. MaxEnt is a machine learning program that uses presence-only data to predict distributionsbased on the principle of maximum entropy. The basic principle of the MaxEnt model is to estimatethe potential distribution of a species by determining the distribution of the maximum entropy(i.e., closest to uniform), with constraints imposed by the observed spatial distributions of the speciesand the environmental conditions [35].
We used 124 dengue presence locations and a set of bioclimatic raster layers as an input torun the model. As bioclimatic data in Worldclim are derived from a common set of temperatureand precipitation, the variables can exhibit multicollinearity [33]. The relative contribution of eachpredictive variable, which is normally interpreted using the variable contribution table and jackknifetest, is affected by high correlation among the predictor variables [19]. As a result, ecologically morecausal variables can be excluded from models if other correlated variables explained the variation inthe response variable better in statistical terms [36]. We therefore computed the Pearson correlationcoefficient to remove highly correlated variables using the correlation threshold value of >|0.7|(Table S2). Further, we assessed the statistical contribution of each of the variables by computingunivariate model and observing the area under the curve (AUC) of the receiver operating characteristic(ROC) statistics (Figure S1). We also considered the biological importance of the variables in thevariables selection approach. Overall, our variables selection approach is similar to Ren et al. [37] andTuanMu et al. [38]. Finally, we selected three variables: the mean temperature of the wettest quarter(bio8), the mean temperature of the coldest quarter (bio11) and the precipitation seasonality (bio15) torun the final model. For the national level study, three to four bioclimatic variables were found to bethe best in describing the ecological niche of dengue fever [19]. Finally, the three selected variableswere converted to ASCI (American Standard Code for Information Interchange) format and were usedas the predictor variables to develop the final MaxEnt model. To simulate the climatically suitableareas under possible future climatic conditions, the same variables (bio8, bio11, and bio15) were set asthe input in the projection layers directory.
To evaluate model performance, we divided data randomly into training (75%) and validationdatasets (25%). Then, we used the threshold independent AUC to estimate the performance of themodel. AUC measures the predictive performance of the model by comparing the model’s predictiveability to the random prediction. The AUC value ranges from 0 to 1 where 0.5 indicates randomprediction and higher values correspond to a better model [35]. In order to take account of uncertaintyintroduced by training and validation set splits, 30 models were produced by 30 replicate runs usingthe cross validation approach [37]. Maximum, minimum and standard deviation of the replication wereused to evaluate the possible biases generated due to the arbitrary data split. All the data were used tomake the final predictions. The nonlinear functional relationship between dengue fever and climatefactors was evaluated through inspection of the response curves. Response curves show how the y-axis(response as relative index of occurrence) relates to changes along the x-axis (a single predictor whenall others are held constant and corrected for). The relative importance of each environmental variablein the model was evaluated by the Jackknife test and variable contribution table. The logistic outputwas used in MaxEnt, which generates a continuous map with an estimated probability of presencebetween 0 and 1.
Finally, a climate suitability map was produced with values ranging from 0 (completely unsuitable)to 1 (the most favorable conditions) that were reclassified into unsuitable (<0.297), moderately suitable(0.297–0.45) and highly suitable (>0.45) based on 10th percentile presence threshold (0.297) [39] andthe minimum training presence area (0.45) over the 30 model iterations. We did this for both thepresent and future climate conditions under different emission scenarios and both the time periods.To evaluate the potential altitudinal shift of the climatic niche, we overlaid both the present and futureclimate suitability maps to the Shuttle Radar Topographic Mission (SRTM) digital elevation model(DEM) (http://www.cgiar-csi.org/data/srtm-90m-digital-elevation-database-v4-1) and extracted
Int. J. Environ. Res. Public Health 2018, 15, 187 6 of 15
elevation values of each of the climate suitable pixels. Then, we plotted these values and computedthe mean, maximum and minimum to understand altitudinal limit of the climatic niche of denguefever. By this, we assessed distribution of climatically suitable pixel of dengue fever along elevationgradient including upper and lower altitudinal limit. We used a grid-based population datasetavailable at one kilometer pixel resolution for the year 2010 collected on the worldpop geoportal(http://www.worldpop.org.uk/) to estimate the present exposed human population in the dengueclimatic niche. Future potential human population exposure to dengue fever for the 2050s and 2070swas estimated by linear interpolation based in the annual population growth rate of 2011 nationalcensus [40] of Nepal.
3. Results
The MaxEnt model developed in this study performed well with a mean training AUC of0.8815 ± 0.0419 and a mean test AUC of 0.8815 ± 0.057 of 30-fold cross validation indicating the robustprediction of distribution of dengue suitable areas by the selected variables (Figure 2). The relativecontributions of each environmental variable to the MaxEnt model are shown in Figure 3. The bio8accounted for 61.16% of the relative contribution to the model, followed by bio11 (29.26%) and bio15(9.56%). The MaxEnt model’s Jackknife test of variable importance showed that bio8 (mean temperatureof the wettest quarter) was the variable with the highest gain when used in isolation. It indicated a strongcontribution of bio8 to the model development that has the most useful information among the variables.Further, omission of bio8 decreased the gain of model. Such a result indicates that it holds the mostinformation for dengue distribution among the variables used for model development (Figure 2).
Figure 2. Average area under curve (AUC) for 30 replicates MaxEnt run. The red line is the averagevalue and the blue bar represents plus and minus one standard deviation.
Figure 3. Variable importance by Jackknife test. The blue, aqua and red bars represent the results ofthe model created with each individual, all remaining variables and all the variables respectively.
Int. J. Environ. Res. Public Health 2018, 15, 187 7 of 15
According to the response curve plots (Figure S2), bio8 in the range of 25–28 ◦C, bio11 between13.5–16.5 ◦C and bio15 between 105–135 ◦C were ideal to define moderately suitable areas for denguefever. Similarly, to be a highly suitable climatic niche, the critical range of these variables should be inthe range of 28–30 ◦C, 16.5–17.5 ◦C and 135–145 ◦C, respectively.
Figure 4 shows the spatial distribution of present day climatically suitable areas of dengue feverin Nepal. It is distributed throughout the southern lowland Tarai; from east to the west and also insome less elevated river valleys in the Hill and Mountain regions. The distribution of suitable areas iscontinuous from east to the west except in the mid-west around the Dang district (see Figure 4). Chure,which lies immediately north of lowland Tarai, behaves as the northern limit of dengue fever with theexceptions of low elevated river valleys in the hilly region. According to our model, about one-fourth(24.43%) area of the country is presently climatically suitable for dengue fever (9.33% moderatelysuitable, and 15.09% highly suitable). The moderately suitable areas were generally observed in thenorthern margin of highly suitable areas, however, they were intermixed in many parts of westernTarai. The climatically suitable area was observed to decrease with increasing elevation from south tothe north (Figure S3). The highest concentration of climatically suitable area pixels was observed inless than 300 m asl and the lowest in 800–900 m asl.
Figure 4. Spatial distribution of present day climatically suitable areas of dengue fever in Nepalobtained from MaxEnt modelling approach.
The estimated area of the predicted distribution is given in Figure 5 and that for the year of 2050and 2070 under the different emission scenarios is presented in Figure 6. The climatically suitablearea of dengue fever would increase in the 2050s and the 2070s under all the four RCPs, however themagnitude of the increase will vary based on time and emission scenario. The total climatically suitableareas would increase by larger amounts under the very high emission scenarios (RCP8.5) comparedto the medium stabilization (RCP6.0) and mitigation emission scenario (RCP2.6). The proportions ofmoderately suitable areas would increase, and highly suitable areas remain constant in 2050 under theRCP2.6. However, the proportion of highly suitable areas would increase, and moderately suitableareas remain constant in 2070. But, in the other two emission scenario, the proportion of highly suitableareas would increase while the proportion of moderately suitable areas remain almost constant.
Int. J. Environ. Res. Public Health 2018, 15, 187 8 of 15
Figure 5. The predicted distribution of areas in Nepal climatically suitable for dengue fever at presentand in the future. Green, yellow and red bars represent unsuitalbe, moderately suitable and highlysuitable area, respectively.
Spatial distribution of climatically suitable areas along the elevation gradient (Table 2) would bealtered under all the future climate change emission scenarios compared to the present distribution(Figure 6).
Table 2. Distribution of climate suitable areas along the elevation gradient.
Climate Trajectories Year Min (m asl) Mean (m asl) Max (m asl)
Int. J. Environ. Res. Public Health 2018, 15, 187 9 of 15
Figure 6. Spatial distribution of future climatically suitable areas of dengue fever in Nepal in 2050s and2070s under the various greenhouse gas emission scenarios.
Unlike the uniform rapid decline with increasing altitude in the present distribution,the climactically suitable areas would increasingly remain constant from 400–800 m asl in mostof the RCPs (Figure S4). The maximum shift was observed for the 2070s under the very highemission scenarios (RCP8.5) where the upper altitudinal limit of climate suitable areas would reach upto 1400 m asl compared to that of below 900 m asl under the present distribution. The mean altitude ofthe climate niche of dengue would be shifted up to 464 m asl in the worst climate change emissionscenarios compared to the 239 m asl of the present mean elevation.
Our results also showed that 70.7% (14.7% in moderately suitable areas and 56% in highly suitable)of the human population of Nepal is presently exposed to the dengue fever climate niche when gridded
Int. J. Environ. Res. Public Health 2018, 15, 187 10 of 15
population data was overlaid with the present MaxEnt model (Figure 7). The proportion of the exposedpopulation would further increase in the all the RCPs compared to the presently exposed populationwith little variation among the years and the emission scenario assumed. For example, about 80% ofthe population would live in climatically suitable areas in the 2050s under mitigation emission scenario(RCP2.6). It would go above 90% under the very high emission scenarios (RCP8.5).
Figure 7. Proportion of human population under the risk of dengue fever in the present and future.The yellow bar reprsents the human population exposed to a moderately suitable area, the red bar tothe highly suitable area and the magenta bar represents the total human poulation.
4. Discussion
In this study, we mapped present and future climatically suitable areas of dengue fever in Nepalusing the reported dengue cases and a set of bioclimatic variables based on MaxEnt ecological nichemodeling approach. Then, we estimated the present and future human population at risk of the diseasebased on the climate suitability model. In addition, we assessed the climatic niche shift of denguefever along the elevation gradients by overlaying our present and future climatically suitable areasmodel with SRTM DEM.
Results of our model showed that temperature, especially the mean temperature of the wettestquarter (bio8) followed by the mean temperature of the coldest quarter (bio11) are major constraintson the distribution of the climatic niche of dengue fever in Nepal. These two variables accounted foralmost 90% of the model. We observed nonlinear responses of climate variables which were consistentwith previous research [15]. According to the response curve of our model, the mean temperature ofthe wettest quarter should be 25–30 ◦C and the mean temperature of the coldest quarter should be14–18 ◦C to be climatically suitable areas. These temperature ranges reflect the thermal conditionsnecessary for the breeding and development of mosquito vectors during the breeding season andprotect their eggs and larvae during the winter season. These ranges are concurrent with severalprevious studies [41,42].
Results of this study showed that the present predicted climactically suitable areas effectivelycaptured the observed distribution of dengue fever in Nepal. Our model mapped all the 23 Taraidistricts of Nepal as climatically suitable area for the dengue fever. The hot and humid southernlowland is suitable not only for dengue fever but also for other mosquito-borne diseases such aschikungunya, malaria, and encephalitis [26,43]. Most of the dengue fever cases and large outbreaks sofar reported since its emergence were from these lowland Tarai [44]. A total of 917 laboratory confirmeddengue cases and five deaths were reported from lowland district Chitwan during the 2010 outbreakaccounting 71% of total cases reported from the entire country. Three lowland Tarai districts—Chitwan,
Int. J. Environ. Res. Public Health 2018, 15, 187 11 of 15
Jhapa, and Parsa—were badly affected by another large dengue outbreak in 2013 covering about 83%of total reported cases of the entire country. The moderately suitable area is generally distributed inthe northern margins of the highly suitable areas. These areas coincide with the region of sporadicreporting of dengue cases. However, our model is slightly conservative in the west, especially for theRupendehi, Kailali and Kanchanpur districts where the area mapped as moderately suitable was alsoexpected to be the same as the highly suitable areas because of the prevailing hot and humid climate.Additionally, our model did not predict Kathmandu valley as climatically suitable at present despitecontinuous reporting of dengue fever [23,45]. Dengue cases and the vector of the disease has beenreported at even higher altitudes (1800 m asl) [46,47] in recent years. This showed little mismatch onour model along the edge. The uncertainty analysis of the previous ecological niche model showedhigher incongruence generally along the edge [48] compared to the core areas. Such incongruentresults along the edge of the bioclimatic niche of dengue was also observed in Tanzania [49], like ourstudy. However, the dengue cases reported from Kathmandu valley could be imported cases fromlowland Tarai and neighboring districts such as Dhading and Nuwakot; that might be due to frequenttravel of people to the country capital where administrative and medical services are centralized.Nonetheless, our model validation suggests (high AUC) a high level of accuracy of the model.
Like several previous studies [1,14,18,49], our study also suggested a subtle shift in the presentclimatically suitable areas for both the 2050s and 2070s. According to our model, the upper limit of theclimate niche of dengue fever will reach up to 1400 m asl compared to the present-day limit of 900 masl. Kathmandu valley will be climatically suitable for dengue fever in both the 2050s and 2070s givingfurther threats to the highly-populated capital city. The magnitude of the change, however, will varyaccording to the emission scenarios assumed. For example, it will be at a minimum under the RCP2.6and at a maximum under the RCP8.5. The projected areas of range expansion are primarily expectedalong the edge and proximate to the present distribution [50]. The altitudinal shift of climaticallysuitable areas of dengue fever is generally consistent with other climate modeling which report speciesmovement to higher latitudes and elevations in response to warming [51]. Moderately suitable areaschanging to highly suitable areas indicates the possibility of large and frequent dengue outbreaksin these areas in the future. Circulating all four dengue virus serotypes among the vector, host,and environment also increases the risk of sequential infection with different dengue serotypes anddengue hemorrhagic fever [28,29]. Our estimates suggest that the population living at risk of denguefever is likely to increase significantly in the future, which is consistent with studies made earlier at aglobal scale [14]. In the worst emission scenarios (RCP8.5), the population at risk of dengue is expectedto be about 90% in 2070s which is fairly large compared to the worldwide predicted value of 52% in the2085. This indicates more resources will be needed to tackle dengue fever in the future, which could bea great challenge to the public health authority in Nepal.
Our study defined for the first time the present and future spatial limit of the climatic nicheof dengue fever in Nepal. Therefore, this study provides crucial baseline information necessary todesign surveillance and allocate scarce resources effectively. However, there were several limitationsassociated with this study which should be taken into consideration while interpreting our results.For instance, the availability of dengue case data in Nepal is limited. Therefore, we used newspaperportals and the dengue health map as alternative sources of dengue case data. Hence, the accuracy ofour model depends on the accuracy of reports. Further, our model only showed climatically suitableareas. Although a suitable climate is necessary for dengue transmission, several other non-climatesocioeconomic and proximate factors are needed for an epidemic to take place. The importance ofsuch non-climate factors increases with increasing the resolution of the study [52]. The results of themodelling strongly depend on the choice of input variables [53] and modelling approach adopted [34].Therefore, mapping results may not match when the model is calibrated based on other climaticvariables. Similarly, like other spatial models, our study cannot interpret the temporal risk windowfor particular areas, for example, whether the climatically suitable areas have a risk of dengue thewhole the year round or in just some of months of the year. Several studies have shown that the
Int. J. Environ. Res. Public Health 2018, 15, 187 12 of 15
temporal window of the risk would be widening due to climate change [18,54]. Depending of theclimate, some areas could be prone for short periods while other areas for a little longer. Future studiesshould focus on the temporal risk period along with the spatial risk. Similarly, we assumed continuouspopulation growth which, in reality, might not be true.
5. Conclusions
In this study, we mapped present and future areas climactically suitable for dengue fever in Nepalfor the first time based on the MaxEnt ecological niche modelling approach using the reported denguecases and a set of bioclimatic variables. Our results showed that about one quarter of the area ofNepal, mainly in the southern lowland Tarai, is currently suitable for dengue fever. This will expandnorthwards in the future in response to climate change. Our estimate suggests that 70% of the totalpopulation is currently at risk of dengue fever and that would further increase (by up to 90%) in thefuture due to climate change. The results along with the map produced in this study could guidehealth authorities to implement effective surveillance and control strategies of dengue fever in Nepal.
Supplementary Materials: The following are available online at http://www.mdpi.com/1660-4601/15/2/187/s1,Note S1. R code used for geocoding address level dengue occurrence point using Google API; Table S1: Denguepresence locations; Table S2: Correlation matrix of bioclimatic variables; Figure S1: Jackknife of regularizedtraining gain; Figure S2: Response curves for climate variables related to the distribution of dengue fever; FigureS3: Distribution of Present Climate suitable pixel along the elevation gradient; Figure S4: Distribution of FutureClimate suitable pixel in different concentration pathways along the elevation gradient.
Acknowledgments: The work in this paper was funded by the Special Fund for Forest Scientific Research inthe Public Welfare (No. 201504323). The Chinese Academy of Sciences (CAS) and The World Academy ofSciences (TWAS) are acknowledged for awarding the CAS-TWAS President’s fellowship to Bipin Kumar Acharya,Shaid Naeem and Laxman Khanal for their PhD research. We acknowledge the support of the Epidemiology andDisease Control Division (EDCD), Department of Health Services, Government of Nepal for providing us dengueoccurrence data for the Jhapa and Chitwan districts.
Author Contributions: Bipin Kumar Acharya led this research. He conceptualized the research; collected,processed and analyzed data, and drafted the manuscript. Shaid Naeem, Laxman Khanal and Shreejana Panditcontributed in data processing and manuscript improvement. Min Xu and Laxman Khanal helped in modellingand write-up. Chunxiang Cao supervised the research and contributed in manuscript improvement.
Conflicts of Interest: The authors declare no conflict of interest.
References
1. Bhatt, S.; Gething, P.W.; Brady, O.J.; Messina, J.P.; Farlow, A.W.; Moyes, C.L.; Drake, J.M.; Brownstein, J.S.;Hoen, A.G.; Sankoh, O.; et al. The global distribution and burden of dengue. Nature 2013, 496, 504–507.[CrossRef] [PubMed]
2. Messina, J.P.; Brady, O.J.; Scott, T.W.; Zou, C.; Pigott, D.M.; Duda, K.A.; Bhatt, S.; Katzelnick, L.; Howes, R.E.;Battle, K.E.; et al. Global spread of dengue virus types: Mapping the 70 year history. Trends Microbiol. 2014,22, 138–146. [CrossRef] [PubMed]
3. Wilder-Smith, A.; Murray, N.A.E.; Quam, M. Epidemiology of dengue: Past, present and future prospects.Clin. Epidemiol. 2013, 5, 299. [CrossRef] [PubMed]
8. Mills, J.N.; Gage, K.L.; Khan, A.S. Potential Influence of Climate Change on Vector-Borne and ZoonoticDiseases: A Review and Proposed Research Plan. Environ. Health Perspect. 2010, 118, 1507–1514. [CrossRef][PubMed]
Int. J. Environ. Res. Public Health 2018, 15, 187 13 of 15
9. Lambrechts, L.; Paaijmans, K.P.; Fansiri, T.; Carrington, L.B.; Kramer, L.D.; Thomas, M.B.; Scott, T.W.Impact of daily temperature fluctuations on dengue virus transmission by Aedes aegypti. Proc. Natl. Acad.Sci. USA 2011, 108, 7460–7465. [CrossRef] [PubMed]
10. Méndez-Lázaro, P.; Muller-Karger, F.; Otis, D.; McCarthy, M.; Peña-Orellana, M. Assessing Climate VariabilityEffects on Dengue Incidence in San Juan, Puerto Rico. Int. J. Environ. Res. Public Health 2014, 11, 9409–9428.[CrossRef] [PubMed]
11. Brady, O.J.; Johansson, M.A.; Guerra, C.A.; Bhatt, S.; Golding, N.; Pigott, D.M.; Delatte, H.; Grech, M.G.;Leisnham, P.T.; Maciel-de-Freitas, R.; et al. Modelling adult Aedes aegypti and Aedes albopictus survival atdifferent temperatures in laboratory and field settings. Parasit. Vectors 2013, 6, 351. [CrossRef] [PubMed]
12. Intergovernmental Panel on Climate Change (Ed.) Climate Change 2013—The Physical Science Basis: WorkingGroup I Contribution to the Fifth Assessment Report of the Intergovernmental Panel on Climate Change; CambridgeUniversity Press: Cambridge, UK, 2014; ISBN 978-1-107-41532-4.
13. Åström, C.; Rocklöv, J.; Hales, S.; Béguin, A.; Louis, V.; Sauerborn, R. Potential Distribution of Dengue Feverunder Scenarios of Climate Change and Economic Development. EcoHealth 2012, 9, 448–454. [CrossRef][PubMed]
14. Hales, S.; de Wet, N.; Maindonald, J.; Woodward, A. Potential effect of population and climate changes onglobal distribution of dengue fever: An empirical model. Lancet 2002, 360, 830–834. [CrossRef]
15. Colón-González, F.J.; Fezzi, C.; Lake, I.R.; Hunter, P.R. The Effects of Weather and Climate Change on Dengue.PLoS Negl. Trop. Dis. 2013, 7, e2503. [CrossRef] [PubMed]
16. Ying, Z.; Peng, B.; Hiller, J.E. Climate Change and the Transmission of Vector-Borne Diseases: A Review.Asia. Pac. J. Public Health 2008, 20, 64–76. [CrossRef] [PubMed]
17. Banu, S.; Hu, W.; Hurst, C.; Tong, S. Dengue transmission in the Asia-Pacific region: Impact of climate changeand socio-environmental factors: Dengue transmission in the Asia-Pacific region. Trop. Med. Int. Health 2011,16, 598–607. [CrossRef] [PubMed]
18. Liu-Helmersson, J.; Quam, M.; Wilder-Smith, A.; Stenlund, H.; Ebi, K.; Massad, E.; Rocklöv, J. ClimateChange and Aedes Vectors: 21st Century Projections for Dengue Transmission in Europe. EBioMedicine 2016,7, 267–277. [CrossRef] [PubMed]
19. Machado-Machado, E.A. Empirical mapping of suitability to dengue fever in Mexico using speciesdistribution modeling. Appl. Geogr. 2012, 33, 82–93. [CrossRef]
20. Escobar, L.E.; Craft, M.E. Advances and Limitations of Disease Biogeography Using Ecological NicheModeling. Front. Microbiol. 2016, 7. [CrossRef] [PubMed]
21. Cardoso-Leite, R.; Vilarinho, A.C.; Novaes, M.C.; Tonetto, A.F.; Vilardi, G.C.; Guillermo-Ferreira, R. Recentand future environmental suitability to dengue fever in Brazil using species distribution model. Trans. R.Soc. Trop. Med. Hyg. 2014, 108, 99–104. [CrossRef] [PubMed]
22. Padilla, O.; Rosas, P.; Moreno, W.; Toulkeridis, T. Modeling of the ecological niches of the Anopheles spp. inEcuador by the use of geo-informatic tools. Spat. Spat Temp. Epidemiol. 2017, 21, 1–11. [CrossRef] [PubMed]
23. Government of Nepal, Ministry of Health and Population, Department of Health Services. DOHS AnnualReport, 2013–2014. Annual Report, 2013–2014; Government of Nepal, Ministry of Health and Population,Department of Health Services: Kathmandu, Nepal, 2015.
24. Sharma, S.P. Dengue outbreak affects more than 7000 people in Nepal. BMJ 2010, 341, c5496. [CrossRef][PubMed]
25. Khadka, D.; Pathak, D. Climate change projection for the marsyangdi river basin, Nepal using statisticaldownscaling of GCM and its implications in geodisasters. Geoenviron. Disasters 2016, 3. [CrossRef]
26. Dhimal, M.; Ahrens, B.; Kuch, U. Climate Change and Spatiotemporal Distributions of Vector-Borne Diseasesin Nepal—A Systematic Synthesis of Literature. PLoS ONE 2015, 10, e0129869. [CrossRef] [PubMed]
27. Dhimal, M.; Bhusal, C. Impacts of Climate Change on Human Health and Adaptation Strategies for Nepal.J. Nepal Health Res. Council 2010, 7, 140–141. [CrossRef]
Int. J. Environ. Res. Public Health 2018, 15, 187 14 of 15
31. Eisen, L.; Lozano-Fuentes, S. Use of Mapping and Spatial and Space-Time Modeling Approaches inOperational Control of Aedes aegypti and Dengue. PLoS Negl. Trop. Dis. 2009, 3, e411. [CrossRef] [PubMed]
33. Hijmans, R.J.; Cameron, S.E.; Parra, J.L.; Jones, P.G.; Jarvis, A. Very high resolution interpolated climatesurfaces for global land areas. Int. J. Climatol. 2005, 25, 1965–1978. [CrossRef]
34. Holt, A.C.; Salkeld, D.J.; Fritz, C.L.; Tucker, J.R.; Gong, P. Spatial analysis of plague in California: Nichemodeling predictions of the current distribution and potential response to climate change. Int. J. Health Geogr.2009, 8, 38. [CrossRef] [PubMed]
35. Phillips, S.J.; Anderson, R.P.; Schapire, R.E. Maximum entropy modeling of species geographic distributions.Ecol. Model. 2006, 190, 231–259. [CrossRef]
36. Wei, J.; Zhang, H.; Zhao, W.; Zhao, Q. Niche shifts and the potential distribution of Phenacoccus solenopsis(Hemiptera: Pseudococcidae) under climate change. PLoS ONE 2017, 12, e0180913. [CrossRef] [PubMed]
38. Tuanmu, M.-N.; Viña, A.; Winkler, J.A.; Li, Y.; Xu, W.; Ouyang, Z.; Liu, J. Climate-change impacts onunderstorey bamboo species and giant pandas in China’s Qinling Mountains. Nat. Clim. Chang. 2012, 3,249–253. [CrossRef]
39. Slater, H.; Michael, E. Predicting the Current and Future Potential Distributions of Lymphatic Filariasisin Africa Using Maximum Entropy Ecological Niche Modelling. PLoS ONE 2012, 7, e32202. [CrossRef][PubMed]
40. Central Bureau of Statistics (CBS). National Population Census 2011; Household National Report. Availableonline: http://cbs.gov.np/sectoral_statistics/population/national_report (accessed on 19 September 2017).
41. Morin, C.W.; Comrie, A.C.; Ernst, K. Climate and Dengue Transmission: Evidence and Implications.Environ. Health Perspect. 2013, 121, 1264–1272. [CrossRef] [PubMed]
42. Gubler, D.J. Epidemic dengue/dengue hemorrhagic fever as a public health, social and economic problem inthe 21st century. Trends Microbiol. 2002, 10, 100–103. [CrossRef]
43. Pandey, K.; Pandey, B.D.; Chaurasiya, R.R.; Thakur, M.; Neupane, B.; Shah, Y.; Ngwe Tun, M.M.; Morita, K.Evidence of Chikungunya virus circulation in the Terai region of Nepal in 2014 and 2015. Trans. R. Soc. Trop.Med. Hyg. 2017, 111, 294–299. [CrossRef] [PubMed]
44. Department of Health Services (DOHs). Annual Health Report (2015/2016). Available online: http://dohs.gov.np/wp-content/uploads/2016/06/Annual_Report_FY_2071_72.pdf (accessed on 13 October 2017).
45. Adhikari, S.; Neupane, B.; Rijal, K.R.; Banjara, M.R.; Uphadhaya, B.P.; Ghimire, P. Burden estimation ofdengue at National Public Health Laboratory, Kathmandu. Asian Pac. J. Trop. Dis. 2015, 5, 289–292. [CrossRef]
46. Gupta, B.P.; Adhikari, A.; Rauniyar, R.; Kurmi, R.; Upadhya, B.P.; Jha, B.K.; Pandey, B.; Manandhar, K.D.Dengue virus infection in a French traveller to the hilly region of Nepal in 2015: A case report. J. Med.Case Rep. 2016, 10. [CrossRef] [PubMed]
47. Dhimal, M.; Ahrens, B.; Kuch, U. Species composition, seasonal occurrence, habitat preference and altitudinaldistribution of malaria and other disease vectors in eastern Nepal. Parasit. Vectors 2014, 7, 540. [CrossRef][PubMed]
48. Zhang, L.; Liu, S.; Sun, P.; Wang, T.; Wang, G.; Zhang, X.; Wang, L. Consensus Forecasting of SpeciesDistributions: The Effects of Niche Model Performance and Niche Properties. PLoS ONE 2015, 10, e0120056.[CrossRef] [PubMed]
49. Mweya, C.N.; Kimera, S.I.; Stanley, G.; Misinzo, G.; Mboera, L.E.G. Climate Change Influences PotentialDistribution of Infected Aedes aegypti Co-Occurrence with Dengue Epidemics Risk Areas in Tanzania.PLoS ONE 2016, 11, e0162649. [CrossRef] [PubMed]
50. Ebi, K.L.; Nealon, J. Dengue in a changing climate. Environ. Res. 2016, 151, 115–123. [CrossRef] [PubMed]51. González, C.; Wang, O.; Strutz, S.E.; González-Salazar, C.; Sánchez-Cordero, V.; Sarkar, S. Climate Change
and Risk of Leishmaniasis in North America: Predictions from Ecological Niche Models of Vector andReservoir Species. PLoS Negl. Trop. Dis. 2010, 4, e585. [CrossRef] [PubMed]
Int. J. Environ. Res. Public Health 2018, 15, 187 15 of 15
52. Arboleda, S.; Jaramillo-O, N.; Peterson, A.T. Mapping Environmental Dimensions of Dengue FeverTransmission Risk in the Aburrá Valley, Colombia. Int. J. Environ. Res. Public Health 2009, 6, 3040–3055.[CrossRef] [PubMed]
53. Rödder, D.; Schmidtlein, S.; Veith, M.; Lötters, S. Alien Invasive Slider Turtle in Unpredicted Habitat:A Matter of Niche Shift or of Predictors Studied? PLoS ONE 2009, 4, e7843. [CrossRef] [PubMed]
54. Campbell, L.P.; Luther, C.; Moo-Llanes, D.; Ramsey, J.M.; Danis-Lozano, R.; Peterson, A.T. Climate changeinfluences on global distributions of dengue and chikungunya virus vectors. Philos. Trans. R. Soc. B Biol. Sci.2015, 370, 20140135. [CrossRef] [PubMed]


![Dengue Fever/Severe Dengue Fever/Chikungunya Fever · Dengue fever and severe dengue (dengue hemorrhagic fever [DHF] and dengue shock syndrome [DSS]) are caused by any of four closely](https://static.documents.pub/doc/80x56/5e87bf3e7a86e85d3b149cd7/dengue-feversevere-dengue-feverchikungunya-dengue-fever-and-severe-dengue-dengue.jpg)


