Present Day Engines Pollutant Emissions: Proposed Model for Refinery Bases Impact
N. Hochart1, N. Jeuland1, X. Montagne1, S. Raux2,G. Belot3, B. Cahill3, R. Faucon4, A. Petit4 and S. Michon5
1 Institut français du pétrole, division Techniques d’applications énergétiques,1 et 4, avenue de Bois-Préau, 92852 Rueil-Malmaison Cedex - France
2 Institut français du pétrole, division Techniques d’applications énergétiques,Centre d'études et de développement industriel « René Navarre », BP 3, 69390 Vernaison - France
3 PSA Peugeot-Citroën, 18, rue des Fauvelles, 92256 La Garenne-Colombes Cedex - France4 Renault, 1, allée Cornuel, 91510 Lardy Cedex - France
Résumé— Émissions de polluants des moteurs actuels : modélisation de l’impact des bases deraffinage — L’amélioration de la qualité de l’air, tout particulièrement dans les zones urbaines, est undes principaux objectifs pour les années à venir. Dans ce contexte, les constructeurs d’automobiles, leséquipementiers et les raffineurs ne cessent d’explorer de nouvelles voies compatibles avec une sévéritétoujours accrue des contraintes environnementales. L’identification des pistes les plus prometteusesapparaît donc incontournable.
Un programme de recherche conduit par l’IFP, en partenariat avec le ministère de l’Industrieet lesconstructeurs français PSA-Peugeot-Citroën, Renaultet Renault Véhicules Industriels, a donc été bâti.Celui-ci repose sur une étude de 4 ans, regroupant différentes technologies représentatives des 20 annéesà venir. Ce projet se scinde en 3 volets complémentaires : moteurs diesels pour véhicules particuliers,moteurs diesel de poids lourds et moteurs à allumage commandé.
L’objectif de cette étude est de caractériser l’effet de la formulation des carburants sur les émissions depolluants, de CO2 et sur le réglage de moteurs de technologies différentes. L’originalité de ce travailréside dans le fait que les paramètres d’étude ne sont pas conventionnels dans la mesure où il s’agitdirectement des bases de raffinage. Ces dernières ont été sélectionnées comme étant susceptibles d’êtreparmi les plus représentatives du futur. Les résultats obtenus permettront aux raffineurs de disposer d’unoutil concret afin d’orienter les nouveaux schémas de raffinage.
Les technologies décrites ci-après sont, pour les moteurs à allumage commandé, un moteur à mélangepauvre Euro II (Honda VTEC équipant la Honda Civic) ainsi qu’un moteur RenaultEuro III 1,8 lfonctionnant à la stœchiométrie (qui équipe les Laguna), pour les moteurs diesel, un moteur à injectionindirecte 2,2 l Euro II, et, pour les moteurs de poids lourds, un moteur Euro II RVI de 10 l.
Pour la formulation des carburants, une approche originale est proposée : alors que les études classiquessont essentiellement basées sur les propriétés des carburants, on retient ici directement les bases deraffinage. Pour les gazoles, six bases ont été retenues afin de construire le plan d’expériences de
Oil & Gas Science and Technology – Rev. IFP, Vol. 58 (2003), No. 18
mélange : un gazole straight-run, une base d’hydrocraquage, un LCO, un gazole issu du procédéd’hydroconversion de résidus sous-vide, une coupe kérosène et un gazole Fischer-Tropsch. Concernantles essences, les sept bases retenues sont les suivantes : un isomérat (principalement constituéd’isoparaffines en C5/C6), un alkylat (isoparaffines en C7+), une coupe oléfinique issue du procédéd’oligomérisation, un FCC (oléfines en C7+ et composés aromatiques), un réformat léger (aromatiquesC7/C8), un réformat lourd (aromatiques en C9+) et un composés oxygéné (ETBE).
Pour chaque technologie, des essais ont été conduits sur banc moteur stationnaire avec des tests devariations de conditions de réglage moteur en dehors de la configuration cartographique. En parallèle, desessais avec des véhicules ont été menés sur le cycle normalisé MVEG-11s. Les émissions de polluantsréglementés ainsi que les émissions de polluants non réglementés ont été étudiées.
Abstract— Present Day Engines Pollutant Emissions: Proposed Model for Refinery Bases Impact—Air quality improvement, especially in urban areas, is one of the major concerns for the coming years.For this reason, car manufacturers, equipment manufacturers and refiners have explored developmentissues to comply with increasingly severe anti-pollution requirements. In such a context, the identificationof the most promising improvement options is essential.
A research program, carried out by IFP (Institut français du pétrole), and supported by the FrenchMinistry of Industry, PSA-Peugeot-Citroën, Renault and RVI (Renault Véhicules Industriels), has beenbuilt to study this point. It is based on a four years program with different steps focused on new enginetechnologies which will be available in the next 20 years in order to answer to more and more severepollutant and CO2 emissions regulations. This program is divided into three main parts: the first one forDiesel car engines, the second for Diesel truck engines and the third for spark ignition engines.
The aim of the work reported here is to characterize the effect of fuel formulation on pollutant emissionsand engine tuning for different engine technologies. The originality of this study is to use refinery basesas parameters and not conventional physical or chemical parameters. The tested fuels have been chosenin order to represent the major refinery bases expected to be produced in the near future. These results,expressed with linear correlations between fuel composition and pollutant emissions, will help to give anew orientation to refinery tool.
The engines presented in this publication are, for spark ignition engines an Euro II lean-burn engine(HondaVTEC which equips the HondaCivic) and an Euro III 1.8 l stoichiometric-running Renaultengine which equips the Laguna vehicles and, for diesel engines an Euro II RenaultLaguna 2.2 l indirectinjection diesel engine and an Euro II RVI truck engine.
For the fuel formulation, an original approach is proposed: while the classical studies are based on theproperties of the fuel, this one is built only on a refinery bases approach. For diesel fuels, six refinerybases (a straight-run diesel fuel, an hydro-cracked diesel fuel, a LCO, a diesel fuel obtained by hydro-conversion of vacuum distillation residue, a kerosene and a diesel fuel issued from a Fischer-Tropschprocess) have been selected to produce a fuel matrix which was determined according to an experimentalblend design. For gasoline fuels, seven bases have been chosen, which are representative of the batchthat will be used in the next years: a fuel from isomeration process (mainly constituted of C5/C6isoparafins), an alkylate (constituted of C7+ isoparafins), a fuel from olefins oligomerization process, afuel from catalytic cracking process (mainly composed of C7+ olefins and aromatic compounds), a lightreformate (C7/C8 aromatic compounds), an heavy reformate (C9+ aromatic compounds) and anoxygenated compound (ETBE).
For each engine, tests have been run on a steady state bench with variations of some tuning parameters.Vehicle tests with the same engines have also been carried out on the European MVEG cycle, whereregulated and unregulated pollutant emissions have been recorded.
N Hochart et al./ Present Day Engines Pollutant Emissions: Proposed Model for Refinery Bases Impact
LIST OF ABBREVIATIONS
EPEFE European Programs on Emissions, Fuels andEngines technologies.
MVEG Motor Vehicle Emission Group, Europeannormalized driving cycle
ECE European Community Economic: urban part of theMVEG cycle
EUDC Extra-Urban Driving Cycle: extra-urban part of theMVEG cycle
VTEC Variable Valve Timing and Lift Electronic ControlSystem
PFI Port Fuel InjectorBMEP Brake Mean Effective PressureTDC Top Dead CenterELR European Load ResponseESC European Steady-state CycleEGR Exhaust-Gases RecirculationBSFC Brake Specific Fuel Consumption.
Gas and Fuels Analysis Methodology
FID Flame Ionization DetectorHPLC High Performance Liquid ChromatographyUV Ultra-Violet SpectroscopyNDIR Non Dispersive Infrared DetectorSOF Soluble Organic FractionIOF Insoluble Organic FractionRON Research Octane NumberRVP Reid Vapor PressureHFRR High Friction Reciprocating Ring (measurement of
diesel fuel lubricity)OFP Ozone Forming PotentialPAH Polycyclic Aromatic HydrocarbonsTAP Toxic Air PollutantIBP Initial Boiling point, as defined in ASTM D86
methodFBP Final Boiling Point, as defined in ASTM D86
The environmental legislation has become for a number ofyears the most important factor affecting requirements ofautomotive fuels, due to additional limitations caused bychanges in vehicle technologies (after-treatment, etc.), butalso to the growing importance of direct fuel effect (theirweighting factor rising sharply as a result of a very lowemission levels mandated in ecological regulations).Moreover, in order to meet the future regulation not onlyon pollutant emissions but also on CO2 emissions, newtechnologies have appeared, such as more complex aftertreatment systems, or new combustion technologies such asdirect injection engine.
This mutation of the engine technology and the moreacute impact of fuel properties on exhaust emissions will leadto new diesel and gasoline fuel formulations. Some work hasbeen carried out in order to study the impact of fuel compo-sition on pollutant emissions (Auto/Oil Air Quality Improve-ment Research Program [1-3], EPEFE [4, 5], but even if a lotof theoretical data are available, the fuel formulationbecomes more and more complex year by year. In thiscontext, it is crucial to have an excellent knowledge of therelative impact of the different refinery bases available forthe blending of future fuels on modern engines operation andemissions.
The results presented here are coming from a large studydone at IFP with the support of the French Ministry ofIndustry, PSA, Renaultand Renault VI. This study aims toquantify the impact of refinery bases which we identified asthe major components in the gasoline and diesel fuel pool inthe next years for engines using technologies which will bewidespread in the future. Seven gasoline bases (alkylate,isomerate, FCC, a fuel from olefins dimerisation (dimate), alight reformate, an heavy reformate and ETBE) will be testedon four vehicles and engines (two PFI engines (one stoichio-metric and one lean burn) and two DI engines (onestoichiometric and one stratified running)). As far as dieseltechnology is concerned, six diesel bases (straight-run,hydro-cracked diesel fuels, LCO, hydro-converted vacuumdistillation residue, kerosene and Fischer-Tropsch base) willbe tested on four passenger car engines (one indirectinjection, and three high pressure direct injection) and threeheavy-duty (Euro II, Euro III and Euro III with EGR) dieselengines.
The results of the first step of the study are presented inthis paper, devoted to the two PFI engines and two dieselengines.
1 CONTEXT
In the early 90’s, in Europe, the wide investigation EPEFEprogram has been carried out to determine the role of
9
Oil & Gas Science and Technology – Rev. IFP, Vol. 58 (2003), No. 1
physical and chemical fuel parameters on pollutantemissions. It was an essential part of the European Auto/Oil 1Program which aimed at defining the 2000 step for emissionand fuel specification standards. For diesel fuels, EPEFEfocused on density, poly-aromatics, cetane number and back-end volatility (T95) [1], while it focused on sulfur content,aromatic compounds rate and distilled fraction at 100°C(“E100”) for gasoline.
The original work reported here has a radically differentview: instead of trying to determine the influent physicalparameters of the fuel with often very complex dedicated fuelmatrix, the chosen option was to try to directly determine theinfluence of fuel composition in terms of refinery bases. Thegoal of this study is to calculate linear correlations betweenpollutant emissions and fuel composition and thus give apragmatic tool for choosing fuel blending components whichensure the lowest vehicle emissions. The literature does notprovide much information about the use in engines of someof the bases selected here (LCO and hydro-convertedvacuum distillation residue for diesel fuels, isomerate forgasoline fuels for instance). Besides, many technical pointshave changed since EPEFE: new engine technologies arise,such as high pressure injection diesel systems, new after-treatment solutions, lean-burn spark-ignition engines, spark-ignition stratified direct-injection engines, etc., the operationof which will require new fuel specifications such as lowerfuel sulfur contents, and interest in fuel reformulationtechniques grows as emissions standards are reduced. Theprogram takes into account all of these points: new enginetechnologies are represented, reformulated Fischer-Tropschfuel is included in the diesel experimental fuel matrix,oxygenated compounds are included in the gasoline fuelmatrix, fuel sulfur contents are low, etc.
2 EXPERIMENTS
2.1 Gasoline Fuel Formulation
In order to study the impact of fuel composition with no inter-ference of other physical properties, the study was led using afuel matrix based on an experimental blending design. Thefirst step of the work was to build this matrix and especiallyto define the factors used (number and type of refinery basis),the variation ranges of each factor and the characteristics ofthe blends (number of blends, physical properties, etc.).
2.1.1 Factors Identification (Number and Nature)
In order to give information and orientation for future fuelformulation in terms of refinery composition, seven baseshave been chosen, which are representative of the batch thatwill be used in the next years:– a fuel from isomeration process (noted “ISOM”), mainly
constituted of C5/C6 isoparafins;
– an alkylate (noted “ALK”), constituted of C7+ isoparafins;– a fuel from olefins oligomerization process (noted
“DIM”);– a fuel from catalytic cracking process (noted “FCC”),
composed of C7+ olefins, but also from aromaticcompounds;
– a C7/C8 reformate (light reformate, noted “LR”);– a C9+ reformate (heavy reformate, noted “HR”);– an oxygenated coupound: ETBE.
2.1.2 Determination of Variation Range for Each Factor
Two objectives were considered while defining variationranges for each parameter:– to obtain the largest experimental range;– to ensure the correct operation of the engine.
The minimum number of blends in order to calculate all thefactors of the correlations is equal to the number of factors(7 in our case). In order to maximize the p-value for thesecalculation, eleven blends were produced: ten fuels for thelimits of the experimental field and a center fuel.
This center fuel is used for three main aims: – to extend the mathematical model obtained to the
complete experimental field described by the matrix (andnot only to the border of this experimental field);
– to calculate emissions measurement repeatability. Ac-tually, in order to obtain statistical and significant trends, itis essential to quantify this repeatability. A general iso-variance hypothesis has been chosen, assuming that therepeatability does not depend on the blend composition;
– to evaluate the eventual bias of the study during thetests with the same center fuel. That is why this fuel istested at the beginning, at the middle and at the end of theprogram.Moreover, this center fuel represents a typical fuel
composition for the next years.
10
N Hochart et al./ Present Day Engines Pollutant Emissions: Proposed Model for Refinery Bases Impact
2.1.4 Complementary Constraints
In order to stay close to present regulation and to ensure goodcold engine start and driveability, two more constraints havebeen imposed:– the total olefinic content (dimate and FCC) must stay
below a 20 % vol. limit, in order to be close to the Euro IIIregulation on olefinic content (18% vol.);
– the Reid vapor pressure must be above 35 kPa in order toavoid engine stalling at the beginning of the MVEG cycle.The main properties of the selected refinery bases are
detailed in Table 2.
TABLE 2
Refinery bases properties
ParametersDensity Octane number
RVP(refinery bases)
(at 15°C) (RON, measured (kPa)
(kg/m3) twice on a CFR engine)
Heavy reformate 877 110 1.3
Light reformate 829 103 6.6
Dimersol 682 96.2 68.5
FCC 755 88.5 14.8
Isomerate 649 82.5 50.8
Alkylate 701 95.2 101.4
ETBE 750 115 38.8
In this table, the low vapor pressure of the FCC andreformate bases are to be outlined: in order to ensure theRVP limitation each blend of the calculated experimentaldesign contains alkylate or isomerate (high volatility). Thisblend matrix is represented in Table 3.
Furthermore, due to the FCC high sulfur content(200 ppm), some variations of the blends effect on enginerunning and pollutant emissions could be linked to blendssulfur content variations and not to fuel composition,as outlined in the EPEFE program [6]. In order to avoidthis phenomenon, the sulfur content of all the blendshas been adjusted to a level close to 60 ppm by DMDS(dimethyldisulfide) addition.
The main physico-chemical properties of the 11 fuels arepresented in Table 4.
The Table 4 shows that large differences exist betweenthe blends properties: the RON values are between 94 and104, the density between 676 and 775. Nevertheless, thecorrelation matrix, presented on Table 5, shows that the only
11
TABLE 4
Main physico-chemical properties of the tested fuels
Correlation matrix between fuel composition and physical properties
HR LR Dim. FCC Alk. Iso. ETBE RON Dens. RVP IBP FBP H/C
HR
LR
Dim.
FCC
Alk.
Iso.
ETBE
RON
Dens.
RVP 0.87 –0.87
IBP
FBP 0.85 0.86 –0.75
H/C –0.97 0.8 –0.8
Oil & Gas Science and Technology – Rev. IFP, Vol. 58 (2003), No. 1
link between fuel composition and physical propertiescomes from the isomerate (its high volatility induces asignificant impact on RVP) and the heavy reformate (dueto its high density). In this table, only correlation ratiohigher than 0.7 are shown. It can be seen that only a fewparameters are correlated, due to logical facts such asdensity and H/C ratio.
This decorrelation between fuel composition and physicalproperties ensures that the effects measured on pollutantemissions are not due to physical properties of the blends butmainly to refinery bases effects.
The detailed chemical composition of these different fuelsis given in Table 6. Measurements were achieved by gaschromatography.
N Hochart et al./ Present Day Engines Pollutant Emissions: Proposed Model for Refinery Bases Impact
2.2 Diesel Fuel Formulation
For diesel fuels formulation, the same methodology than forgasoline fuels have been used.
2.2.1 Factors Identification (Number and Nature)
As for gasoline fuel matrix, the main objective was to selectthe refinery bases that could be the most interesting and themost suitable among those of the next twenty years in therefinery possibilities. In this context, the factors of the dieselfuel matrix (the parameters of the study) are different refinerybases. Six of them have been selected to build the exper-imental blending design:– a straight-run (noted SR): it is a direct distillation diesel
fuel;– a hydro-cracked product (noted HDC);– a light cycle oil (noted LCO);– a diesel fuel issued from hydro-conversion of vacuum
distillation residues (noted HCVDR);– a kerosene (noted kero.);– a diesel fuel coming from a Fischer-Tropsch process
(noted FT).
2.2.2 Determination of Variation Range for Each Factor
The range of variation of each basestock, chosen in order tobe the largest while maintaining the correct operation of theengine, is quoted in Table 7.
All the fuels of the experimental matrix are blended withat least 50% vol. of straight-run in order to obtain a “classic”distillation range for each diesel fuel. The other basescontent evolved between 0 and 50% vol., except for theLCO (0-30% vol.).
2.2.3 Complementary Constraints
Furthermore, in order to be representative of fuels of the overnext twenty-years and to anticipate as far as possible theEuro IV specifications, two other objectives were assignedto the blending, resulting in certain constraints on someparameters:
– the cetane number measured on a CFR engine had to behigher than 54.0 for the eleven diesel fuels;
– the sulfur content had to be lower than 100 ppm for theeleven diesel fuels (the 50 ppm limit for Euro IV had notbeen decided when this value was chosen. However, in factthe average sulfur content obtained was lower than50 ppm). This is the reason why four of the six bases havebeen hydro-desulfurised to pass the 100 ppm maximumrequirement (Table 8). The sulfur content ranged fromlower than 5 ppm to 85 ppm. However, no adjustment wasrequired since all the fuels contain at least 50% of the SRbase, thus ensuring a rather small variation of sulfurcontent.The main properties of the selected refinery bases are
detailed in Table 8.
TABLE 8
Refinery bases properties
Parameters DensityCetane number Sulfur
(refinery bases) (at 15°C)(measured on content
a CFR engine) (ppm)
Straight-run 0.844 49.5 65
Hydro-cracked product 0.817 62.6 < 5
LCO 0.885 23.3 85
Hydro-conversion of vacuum distillation residue 0.852 44.4 60
Kerosene 0.790 46.5 50
Fischer-Tropsch 0.761 82.8 < 5
It must be pointed out that, except for the hydrocrackedand the Fischer-Tropsch fuels, the base cetane numbersremained quite low in spite of a rather severe hydro-desulfurization.
In this context, the experimental design is represented inthe Table 9.
TABLE 9
Experimental design (% vol.)
SR HDC LCO HVDR Kero. FT
G1 0.5 0.5
G2 0.5 0.5
G3 0.5 0.204 0.296
G4 0.865 0.135
G5 0.5 0.316 0,184
G6 0.5 0.335 0.165
G7 0.5 0.474 0.026
G8 0.761 0.172 0.068
G9 0.5 0.186 0.231 0.083
G10 0.5 0.201 0.043 0.072 0.077 0.107
Center 0.552 0.205 0.026 0.043 0.046 0.128
13
Oil & Gas Science and Technology – Rev. IFP, Vol. 58 (2003), No. 114
TABLE 10
Main physico-chemical properties of the tested fuels
The previous mentioned constraint on the cetane numberled to the following variation ranges:– straight-run: 50-86.5% vol.;– hydro-cracked product: 0-50% vol.;– LCO: 0-20.4% vol.;– diesel fuel issued from hydro-conversion of vacuum
distillation residue: 0-31.6% vol.;– kerosene: 0-33.5% vol.;– diesel fuel coming from a Fischer-Tropsch process:
0-50% vol..These variation ranges are a little less extensive than the
theoretical ones.The main physico-chemical properties of the 11 fuels are
presented in Table 10.Furthermore, with the low sulfur contents obtained by
hydro-desulfurization, it appeared necessary to add 150 mg/lof a lubricity improver additive in every fuel (from Octel)to comply with the HFRR test specification of wear scardiameter under 460 µm.
The detailed chemical composition of these different fuelsis given in the Table 11. Measurements were achieved bymass spectrometry.
2.2.4 Additional Diesel Fuels Tested
To complete the diesel fuel matrix, three other fuels have alsobeen blended outside the main matrix:
– a fuel containing 80% vol. of the matrix “center” dieselfuel and 20% vol. of rapeseed methyl ester (RME);
– a fuel containing 80% vol. of the matrix “center” dieselfuel and 20% vol. of a naphthenic base;
– a diesel fuel issued from the Fischer-Tropsch processwithout any blending with another product or base.The main physico-chemical properties of these three
complementary diesel fuels are presented in Table 12.
2.3 Engines and Vehicles Characteristicsand Test Procedures
2.3.1 Spark-Ignition Engines
Vehicle Characteristics
Two engines and corresponding vehicles have been tested,whose main characteristics are described in the two followingsubsections.
The first tests were carried out on a Honda VTEC-Eengine, whose main characteristics are:– engine type: lean burn PFI gasoline engine, fitted on
Main physico-chemical properties of complementary tested fuels
CenterCentre 80% vol. Centre 80% vol.
Fischer-TropschRME 20% vol. naphthenes 20% vol.
Density (at 15°C) 0.8267 0.8373 0.8327 0.7608
Cetane number
measured on CFR engine53.9 56.6 50.8 > 73.7
Sulfur content (ppmwt) 36 40 39 < 5
Distillation curve:
IBP (°C) 182.7 184.8 190.1 203.7
T 5% (°C) 210.5 215.6 215.9 214.3
T 50% (°C) 25.74 274.0 254.6 232.6
T 95% (°C) 327.2 338.6 322.4 265.0
FBP (°C) 336.1 344.6 331.0 272.9
Viscosity (40°C, mm2/s) 2.447 2.748 2.483 1.770
LHV (kJ/kg) 43165 42 547 42 657 44 237
wt% C 86.0 84.3 86.6 84.6
wt% H 13.5 13.4 13.4 15.0
wt% O < 0.2 2.3 < 0.2 0.3
“H/C” ratio 1.870 1.894 1.844 2.113
Oil & Gas Science and Technology – Rev. IFP, Vol. 58 (2003), No. 1
– maximum power: 84kW at 6500 rpm;– maximum torque: 138 N·m at 5200 rpm.
Vehicle tests were carried out using a HondaCivic 1.5 lLsi, whose mileage was 12 000 km.
The second tested engine was a RenaultF4P. The char-acteristics of this engine are :– engine type: stoichiometric PFI gasoline engine, fitted on
passenger car;– 4 cylinders, 4-stroke;– displacement: 1783 cm3;– bore ×stroke = 82.7 × 83 mm;– compression ratio: 9.8/1;– maximum power: 88 kW at 6500 rpm;– maximum torque: 165 N·m at 3750 rpm.– depollution level: Euro III.
Vehicle tests were carried out using a RenaultLagunawhose mileage was 9000 km.
Test ProcedureOn an engine bench, all the tests were performed at steadystate engine conditions on different operating points: – Running conditions 1 (Pt1): 2000 rpm - BMEP = 3 bar,
standard tuning: R1 = 1, spark advance = 33°CA, w/oEGR.At each test point, engine running parameters variationshave been conducted. These variations are adapted fromthe engine map (Table 13).
were set to their map values and the BMEP was maintainedto its original set-up by variations of the throttle opening.
1 In the whole paper, R refers to the equivalence ratio i.e.1/λ.
Engine-out pollutant emissions (CO, HC, NOx), CO2 emis-sions, fuel consumption were recorded for each point.
For the vehicle, all the tests were performed over theMVEG-11s driving cycle (Euro III).
2.3.2 Passenger Car Compression-Ignition Engine
Engine CharacteristicsEngine tests were carried out on a turbocharged RenaultG8Tengine, equipped with EGR but without catalytic converter,whose main characteristics were: – engine type: indirect diesel engine, fitted on passenger car– 4 cylinders, 4-stroke; – displacement: 2188 cm3;– bore ×stroke = 87 × 92 mm;– compression ratio: 22/1;– maximum power: 82 kW at 4000 rpm;– maximum torque: 240 N·m at 2500 rpm.
Vehicle tests were carried out on a Laguna model 1997car (equipped with the G8T engine), with the followingcharacteristics: – vehicle inertia: 1590 kg;– mileage of the vehicle at the beginning of the tests:
approximately 9000 km;– equipped with an oxidation catalytic converter.
Test ProcedureOn an engine bench, all the tests were performed in steadystate engine conditions on different operating points:– a complete full-load curve, from 1500 to 4000 rpm with a
step of 500 rpm, in the standard tuning conditions of themapping;
with different levels of injection timings (–4, –2, +0, +2,
16
TABLE 13
Test procedure (for running conditions 1)
VTEC engine F4P engine
Equivalence ratio Equivalence ratio
variations (0.65 →1), variations (0.95 →1.05)
without EGR
EGR rate variation Spark timing variation
(0% →15%)* for each equivalence ratio
(–25°→ –40°)
Spark timing variation Injection timing variation
(–20°→ –40°)** (–100°→ 200°)*, ***
End of injection timing
variation** (–100°→ 200°)***
* at stoichiometric conditions** variation conducted for two conditions: stoichiometric running with EGR
(20%) and lean-burn running without EGR*** for injection timing variations, the angle is given compared with intake TDC.
TABLE 14
Test procedure (for running conditions 2)
VTEC engine F4P engine
Equivalence ratio Equivalence ratio
variations (0.65 →1) variations (0.95 →1.05)
without EGR
EGR rate variation Spark timing variation
(0% →15%)* for each equivalence ratio
(–25°→ –40°)
Spark timing variation* End of injection timing variation
(–20°→ –40°) (–100°→ 200°)*, **
End of injection timing
variation (–100°→ 200°)*, **
* at stoichiometric conditions** for injection timing variations, the angle is given compared to intake TDC.
N Hochart et al./ Present Day Engines Pollutant Emissions: Proposed Model for Refinery Bases Impact
+4 and +6 °CA from the standard tuning conditionsof the mapping) and of EGR rate (15, 30, 35, 40 and50%);
• running conditions 2 (Pt2): 3000 rpm - BMEP = 4.0 barin the mapping conditions, with different levels of startof injection (–4, –2, +0, +2 and +4°CA from thestandard tuning conditions of the mapping).
For the vehicle, all the tests were performed over theMVEG-11s driving cycle (Euro III).
2.3.3 Heavy Duty Engine Characteristics
Engine CharacteristicsThe heavy-duty engine used in this part of the study was a062045 manufactured by Renault Véhicules Industriels,certified to Euro II (1996) pollutant emission level. Adetailed description of the engine is provided in Table 15.
TABLE 15
HD engine description
Type MIDR 062045
Displacement 9.8 l
Number of cylinders 6
Compression ratio 17/1
Bore ×Stroke 120 ×145 (mm)
Max. power output 190 kW (at 2100 rpm)
Maximum torque 1040 N·m (at 1400 rpm)
Injection type Direct, inline pump
Other information Intercooled turbo-charging
No exhaust-gas recirculation
No after treatment device
Heavy Duty Engine Test ProceduresThe tests have been carried out using mainly two certificationtest cycles of the next step of the European regulation onexhaust-gases regulation called Euro III. These cycles areESC, for European steady-state cycle, that will replace theECE R49 13 modes on 1/1/2000, and ELR for European loadresponse, in use at the same date.
Both cycles use mainly three engine speeds (noted A, B,C), and are described as follows. A domain of engine speedsis defined for each engine type. The lower limit N1 is thespeed below the rated speed that gives half the maximumpower. The upper limit N2 is the speed above the rated speedthat leads to a 30% loss of power compared with themaximum power. This domain is divided into four equalparts, delimited successively by N1, A, B, C and N2.
ELR is a transient cycle, used to characterize dynamicresponse black smoke opacity (Fig. 1). During ELR, torque israised from 10 to 100% within less than two seconds, threetimes consecutively for each engine speed A, B and C asdescribed on Figure 2.
ESC is used to measure particulate, NOx, HC and COemissions throughout the mean measures of thirteen steady-state conditions. Idle is one of these conditions. The othersare defined by the engine speed (A, B and C) and the torque:25, 50, 75 and 100% of the maximum available torque at thecorresponding engine speed.
Last, full load conditions over the entire range of speedfrom 900 up to 2100 rpm and five of the most importantpoints of this cycle were also studied. The five points areA100, B50, B75, C25 and C100, each tested with fivedifferent injection timings. Beside the measurement ofregulated pollutants, smoke opacity, combustion noise,specific fuel consumption and carbon dioxide emissions werealso evaluated.
17
Figure 2
Determination of engine speeds for Euro III test cycles.
Figure 1
ELR test cycle.
Load
A
B
C
100%
10%
Cycle 1
Cycle 2
Cycle 3
Enginespeed
Power
Enginespeed
25%
75%
50%
50%
30%
N1 A B C N2
Oil & Gas Science and Technology – Rev. IFP, Vol. 58 (2003), No. 1
Differences in heating value and specific gravity of the 11blends do not lead to any significant variation in themaximum torque, so similar torque levels were used for allblends over the entire range of test conditions.
2.4 Gas Analysis Methods
For engine tests, raw exhaust gases were sampled through a180°C heated line equipped with a heated filter. Five analysistools were used:– a flame ionization detector (FID) for total hydrocarbon
emissions;– two nondispersive infrared detectors (NDIR) for CO and
CO2 emissions;– a chemiluminescence detector for NOx emissions;– a paramagnetic analyzer for oxygen.
For vehicle tests, car emissions and fuel consumptionwere measured on a chassis dynamometer using the modifiedMVEG cycle with the initial 40 s idle period removed. Thetest emissions used for exhaust dilution, sample collectionand sample analysis diluted gases conforms to thespecifications of directive 70/220/EEC and its amendments.Diluted gases were sampled in bags and analyzed with aHoriba Mexa 9000. Nonregulated pollutant emissions wereanalyzed using gas chromatography of samples taken inspecific bags (HC) or HPLC with UV detector of gasescollected on sample cartridges (oxygenated compounds).
2.5 Test Methodology and Principleof Results Exploitation
The main objective of the statistical analysis of this studyis to determine a model for each pollutant based onmathematical relationships of this form:
where Ais either:– the regulated pollutant emissions (CO, HC, NOx and
particles mass for diesel tests);– the unregulated pollutant emissions for vehicle tests
– the CO2 emissions and the fuel consumption on thedriving cycle, and the BSFC of the engine;
i = each refinery base of the program;Ci = concentration of the “i” refinery base in the fuel
(% vol.);αi = contribution of the “i” refinery base to emissions,
expressed in % (i= 100% within each model);N = total number of basestocks (6 for diesel blend matrix,
7 for gasoline blend matrix).
These models give mathematical linear regressions.Interactions between the different parameters of the matrixare not taken into account, since their effects are second-orderin an experimental blending design. For each model, thecorrelation factor R2 and the p-value of the model are given.Only the models characterized by a “100 × (1-p-value)”higher than 80% have been selected to define the impact ofthe fuel formulation. In the following pages, the results aregiven in terms of contribution of each base (expressed inpercentage) in the model for each pollutant, as shown in thefollowing example, for gasoline tests (Table 16).
TABLE 16
Correlation example: ozone formation potential (g/km)for the Laguna vehicle on the MVEG cycle
1-p-value 90 < < 95
R2 0.81
HR 23% (0.300)
LR 20% (0.261)
Dim. 20% (0.267)
FCC 0% (0)
Alk. 5% (0.060)
Isom. 22% (0.290)
ETBE 10% (0.132)
In this table, the values between brackets represent thecoefficient of each base in the linear correlation. Forexample, the ozone formation potential in this case can beexpressed as:
OFP (g/km) = 0.3 XHR + 0.29 Xisom+ 0.261 XLR + …
with Xi proportion of the base in the blend.The results are also expressed in terms of percentage
contribution of each base to the pollutant emissions. As theblends are composed with 7 refinery bases, the mean value ofthis contribution is around 14%. A base with a contributionhigher than this mean value is designed as a high contributor,which means that adding such a base to a blend will tend toraise the emissions of the pollutant.
It must be outlined that those correlations, calculatedaccording a blend design, are valid only inside the limitsdefined during the creation of the blend matrix.
3 RESULTS
3.1 Spark-Ignition Engines
3.1.1 First Engine: Lean-Burn PFI Engine
All the blends were tested on the map point and with theengine running parameters variations described above.
The study of the results lead to curves such as the onepresented in Figure 3. The HC emissions (g/kWh) obtained
A Ci ii
N
= ×=
∑α1
18
N Hochart et al./ Present Day Engines Pollutant Emissions: Proposed Model for Refinery Bases Impact
Figure 3
HC emissions measured on the engine bench for anequivalence ratio variation on Pt1.
for the three tests with center blend and for the test withblend 3 are presented.
The differences observed between the three center blendtests give an evaluation of the repeatability of the method. Asa general isovariance hypothesis has been chosen, the differ-ences between the three center tests represent the repeatabilityfor all the blends, including blend 3. As the HC emissionsobtained with blend 3 are out of the repeatability interval, itcan be concluded that there is a significant fuel effect.
Nevertheless, as the blends are formulated according to anexperimental design, no conclusion can be drawn from thecomparison of 2 blends: only statistical calculation can des-cribe the effect of each refinery base on pollutant emissions.
Carbon Monoxide EmissionsOn the vehicle (transient running), the influence of olefinicbases (FCC and dimate) on CO emissions (Table 17) is
0
2
4
6
8
10
12
HC
em
issi
ons
(g/k
Wh)
Equivalence ratio
0.60 0.65 0.70 0.75 0.80 0.85 0.90 0.95 1.00 1.05
Center (1)Center (2)Center (3)3
19
TABLE 17
CO emission model: influence of each base (contribution in g/km or g/kWh)
Oil & Gas Science and Technology – Rev. IFP, Vol. 58 (2003), No. 1
strong (around 20%), when the heavy reformate contributionis very low. On the engine, only the correlation calculated onthe second test point is significant, and the differencesbetween bases are less acute.
Unburned Hydrocarbons EmissionsUnlike for CO emissions, unburned hydrocarbons (Table 18)are mainly produced by aromatic products (reformate), andthe contribution of FCC and dimate are very low, especiallyin warm conditions (EUDC cycle and Pt2).
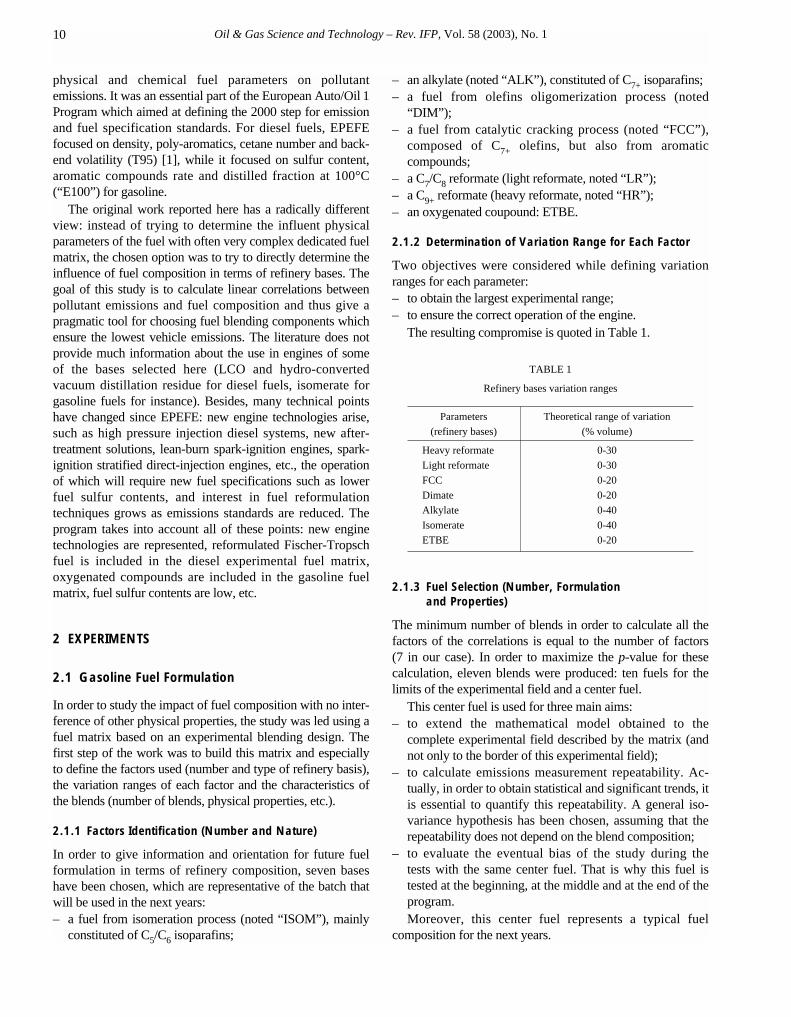
Nitrogen Oxides EmissionsThe correlations calculated for NOx emissions (Table 19)areclose to those calculated for HC emissions: the reformates
are the greatest contributors to NOx emissions while ETBEhas the lowest contribution for most running points.
Carbon Dioxide EmissionsThe contributions of the refinery bases on CO2 emissions(Table 20)are closely linked to H/C ratio and are similaron each phase of the MVEG cycle. ETBE has a highercontribution on CO2 emissions, due to its low heating value.
Unregulated Pollutant EmissionsFor each blend, a set of more than 150 molecules concen-tration has been measured on MVEG cycle, including theTAP (toxic air pollutant). The calculation results for TAP arepresented in Table 21.
20
TABLE 19
NOx emission model: influence of each base (contribution in g/km or g/kWh)
CO2 emission model: influence of each base (contribution in g/km)
Vehicle test
CO2 MVEG-11sEUDC phase ECE phase
emissions cycle
1-p-value 99 < < 99.9 99 < < 99.9 99 < < 99.9
R2 0.98 0.96 0.97
HR 16% (162.9) 16% (213.6) 16% (135.7)
LR 16% (160.9) 16% (211.8) 15% (130.5)
Dim. 14% (140.4) 14% (186.4) 13% (115.8)
FCC 14% (140.9) 14% (186.9) 13% (116.6)
Alk. 13% (136.1) 13% (175.1) 13% (112.5)
Isom. 13% (135.8) 13% (179.3) 13% (110.6)
ETBE 14% (144.8) 14% (180.0) 14% (117.9)
TABLE 21
TAP emission model: influence of each base(contribution in mg/km, vehicle results)
TAP Buta-1,3-
emissions dieneBenzene Formaldehyde Acetaldehyde
1-p-value 90 < < 95 95 < < 99 – 95 < < 99
R2 0.81 0.93 – 0.95
HR 24% (0.7) 38% (7.86) – 13% (1)
LR 6.8% (0.2) 34% (7.03) – 1% (0.1)
Dim. 24% (0.7) 4% (0.8) – 8% (0.6)
FCC 24% (0.7) 20% (4.07) – 9% (0.7)
Alk. 6.8% (0.2) 0% (0) – 3% (0.2)
Isom. 0.7% (0.02) 3.9% (0.8) – 4% (0.3)
ETBE 13.7% (0.4) 0% (0) – 62% (4.8)
N Hochart et al./ Present Day Engines Pollutant Emissions: Proposed Model for Refinery Bases Impact
TAP emissions are directly linked to fuel chemicalcomposition: for instance, more than 90% of benzeneemissions are due to high aromatic content bases (HR, LRand FCC), 50% of the buta-1,3-diene come from olefinicbasestocks and 62% of acetaldehyde emissions are due toETBE.
Effect of Engine Parameters Variationson Bases Contribution to Pollutant EmissionsThe correlation calculations have been led for all the enginerunning parameters. The main results of those calculation aresummarized in Table 22. Each arrow indicates the effect ofthe engine parameter modification on each base contribution.
TABLE 22
Summary of engine running parameters variationon basestocks contributions
↓ Equivalence ratio ↑ EGR ↓ Spark advance
HC CO NOx HC CO NOx HC CO NOx
HR ↓↓ ↑↑ ↑↑↑ ↓↓ ↑↑ ↑↑ ≈ ≠ n.s.
LR ↓↓ ↓↓ ↑ ↓↓ ≈ ↑ ≈ ≈ n.s.
Dim. ª ↑ ↓↓↓ ≈ ↓↓ ↓↓ ≈ ≈ n.s.
FCC ↑↑ ≈ ↓↓ ↑ ↓↓↓ ↓↓↓ ≈ ↑ n.s.
Alk. ↓ ≈ ↑↑ ↑ ↑↑↑ ↑↑↑ ≈ ↓ n.s.
Isom. ↓↓ ≈ ↑↑ ↑ ≈ ≈ ≈ ↓ n.s.
ETBE ↑↑↑ ≈ ↓ ↑↑ ≈ ≈ ↓ ↓↓ n.s.
n.s.: not significant.
Discussion on the Lean-Burn PFI EngineThe results obtained on the Honda VTEC engine can besummarized as followed.– For HC emissions, the heavy reformate and the light
reformate have the strongest contribution, with up to 40%for HR in stabilized conditions. All the other refinerybases have an intermediate or low contribution. The caseof olefinic bases (FCC and dimate) and of ETBE presentsome particularities: the contribution of dimate to HCemissions seems very sensitive to engine running condi-tions, with in particular a very low contribution in hightemperature conditions. This phenomenon is particularlyacute in transient conditions: the contribution of FCC toHC emissions is 16% on the ECE cycle and 0% in theEUDC cycle (as the blend matrix contains 7 fuels, the“mean value” for each fuel contribution is around 14%).
– On the contrary, ETBE has a low contribution to HCemissions on the ECE cycle but very high on the EUDCcycle (27%). The fact that this phenomenon is not presentin steady-state conditions allows us to say that ETBE issensitive to transient running. The same conclusion can bedrawn for paraffinic bases (alkylate and isomerate).
– For CO emissions, less information is available, due to thelow p-value of most of the correlations. Nevertheless, itcan be concluded from the tests that, unlike for HCemissions, aromatic bases induce low CO emissions intransient running conditions. The main contributor tocarbon monoxide emissions is the fuel from olefindimerization process (dimate), with a contribution up to26%. Some effect of engine running conditions can alsobe found on ETBE behavior: the comparison of the resultsobtained on ECE and MVEG cycle seems to show thatETBE is one of the main contributor to CO emissions onthe EUDC cycle (The results can be compared to thosefound on HC emissions were the contribution of ETBE onEUDC cycle is 27% while it is only 4% on MVEG cycle).
– For NOx emissions, the calculated correlations are close tothose found on HC emissions: strong influence of aromaticbases, little influence of ETBE and increase of dimate andETBE contribution in hot running points (EUDC cycle).The steady-state running point results are however quite dif-ferent from those calculated on HC emissions, in particularwith regard to the high contribution of dimate and FCC.
– For CO2 emissions, it has been shown the main parameteris the “H/C” ratio. Only ETBE, due to its high oxygencontent, presents a different contribution.All the tests carried out on this engine have shown the
influence of refinery bases choice on pollutant emissions fora lean-burn PFI engine. The main conclusions are following.
The strong link between NOx emissions and CO/HCemissions show that the main parameter to explain NOxemissions is not only the flame temperature of each base, butalso the quality of the combustion. Indeed, if we compareresults obtained for NOx and HC + CO emissions, the basesclassification according to their contribution is inverted,which induces that a low contribution of a refinery base toNOx emissions is mainly due to incomplete combustion.
Heavy reformate is the strongest contributor to unburnedhydrocarbons emissions, with a contribution up to 40% in hotrunning conditions (Pt2). Moreover, differences can beoutlined in the combustion of aromatic bases (reformates)and olefinic bases (dimate): when incomplete combustion ofdimate leads to CO emissions, the same phenomenon withreformates leads to HC emissions. Those two types ofrefinery bases lead to combustion difficulties. Moreover, thehigh contribution of dimate on NOx emissions seems toindicate that the combustion of olefinic bases is very fast(high combustion temperature peak) but incomplete. Thisphenomenon is particularly acute in transient running.
ETBE seems to have a relatively poor oxidation in lowtemperature conditions: a decrease of the equivalence ratio oran increase of the EGR rate induce an important growth of theETBE contribution to HC emissions. The important increaseof the impact of ETBE on HC emissions during the EUDCcycle shows that those oxidation difficulties are not linked tothermodynamic but kinetic considerations: unlike for olefinic
21
Oil & Gas Science and Technology – Rev. IFP, Vol. 58 (2003), No. 1
bases, the combustion of ETBE seems to be slow. The effectof a lowered spark advance on ETBE contribution to HC andCO emissions has to be linked to a drastic growth of exhausttemperature: as the combustion of this base is slow, decreas-ing the spark advance induces post-combustion of this base.
Unregulated pollutant emissions are closely linked to fuelcomposition, showing that the main source of hydrocarbonemissions is unburned fuel. On the other hand, some effectssuch as ETBE contribution on buta-1,3-diene indicate theexistence of other hydrocarbon emission sources, such aspartial burn or in situsynthesis.
3.1.2 Second Engine: Stoichiometric Lean Burn Engine
The same study as for the lean-burn engine has been carriedout on the RenaultF4P. The main results are summarized inTables 23 to 28.
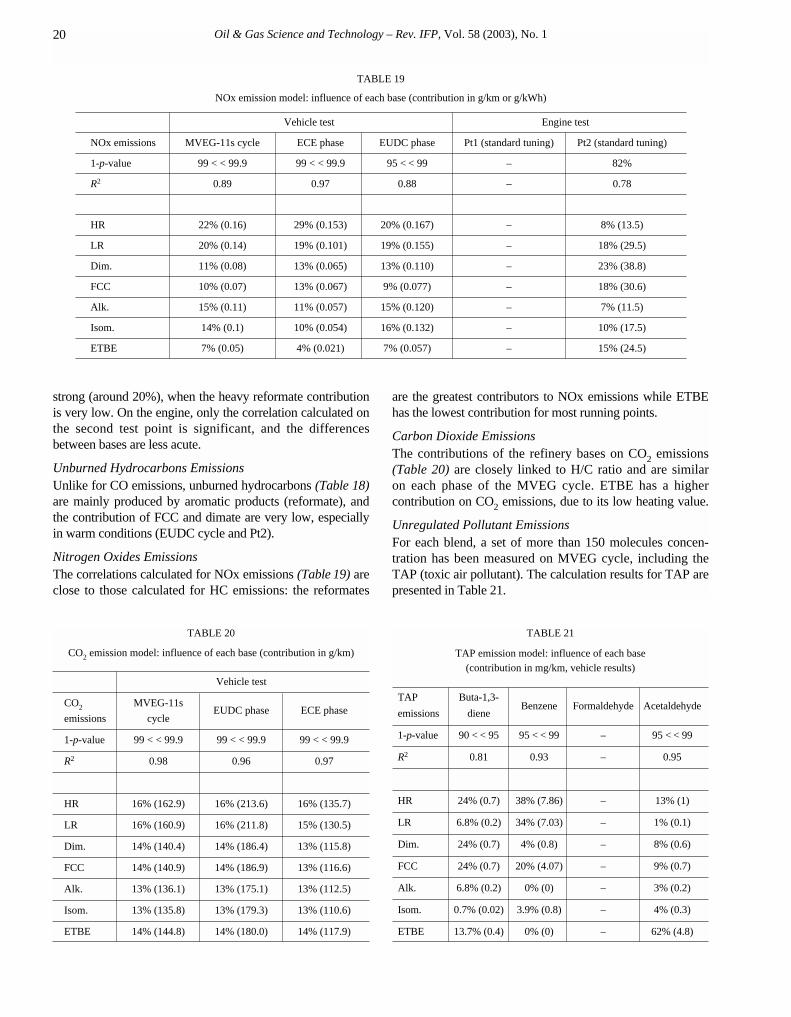
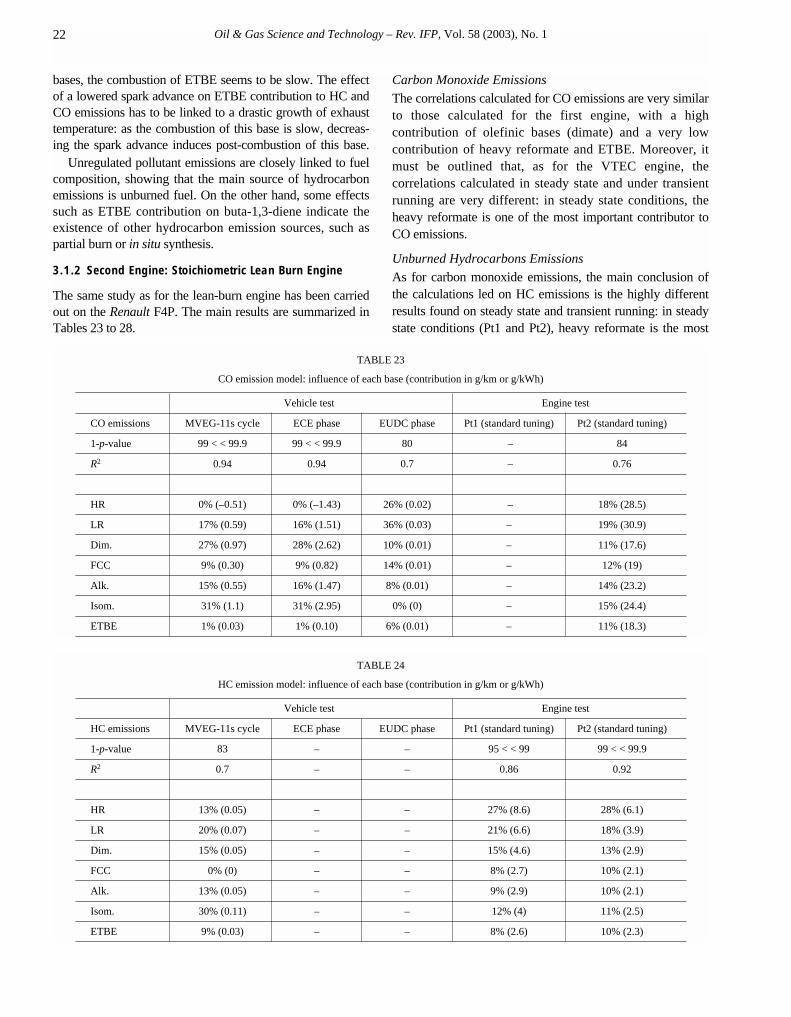
Carbon Monoxide Emissions
The correlations calculated for CO emissions are very similarto those calculated for the first engine, with a highcontribution of olefinic bases (dimate) and a very lowcontribution of heavy reformate and ETBE. Moreover, itmust be outlined that, as for the VTEC engine, thecorrelations calculated in steady state and under transientrunning are very different: in steady state conditions, theheavy reformate is one of the most important contributor toCO emissions.
Unburned Hydrocarbons Emissions
As for carbon monoxide emissions, the main conclusion ofthe calculations led on HC emissions is the highly differentresults found on steady state and transient running: in steadystate conditions (Pt1 and Pt2), heavy reformate is the most
22
TABLE 23
CO emission model: influence of each base (contribution in g/km or g/kWh)
N Hochart et al./ Present Day Engines Pollutant Emissions: Proposed Model for Refinery Bases Impact
important contributor to unburned hydrocarbons emissions,while it is one of the lowest in transient conditions. On thecontrary, we can outlined the high contribution of isomerateon vehicle tests.
Nevertheless, due to the low HC emission level, thesignification of most correlations on the MVEG cycle arelow.
Nitrogen Oxides EmissionsAs for HC emissions, transient running has a great effect onall the contributions to NOx emissions: ETBE is the greatestcontributor with 30% on the MVEG cycle, when itscontribution on the steady-state points stays around 10%.
Carbon Dioxide EmissionsThe correlations calculated on CO2 emissions confirm theresults found on the VTEC engine: the fuel composition (interms of refinery bases) doesn't have a great influence onCO2 emissions. However, even if all the contributions arevery close (between 13 and 16%), it can be observed onthose results that the crucial point for carbon dioxideemissions is the “H/C” value. As for the VTEC engine, theETBE has a different behavior: despite its low “H/C” value,its contribution to CO2 emissions is quite high because of itslow heating value. Indeed, on the MVEG cycle thecorrelation calculated on fuel consumption gives thefollowing results.
The contribution of ETBE to fuel consumption is thehighest of the 7 refinery bases. Its contribution to CO2
emissions is then a compromise between this high fuelconsumption (low heating value) and its low “H/C” ratio.
TABLE 26
CO2 emission model: influence of each base (contribution in g/km)
Vehicle test
CO emissionsMVEG-11s ECE EUDC
cycle phase phase
1-p-value 95 < < 99 95 < < 99 99 < < 99.9
R2 0.89 0.89 0.9
HR 16% (193.3) 16% (256.9) 16% (155.9)
LR 15% (185.6) 15% (243.5) 15% (150.8)
Dim. 14% (164.1) 14% (214.8) 14% (134.3)
FCC 14% (172.0) 14% (225.8) 14% (139.5)
Alk. 14% (164.3) 14% (215.5) 14% (133.8)
Isom. 13% (158.4) 13% (206.6) 13% (130.1)
ETBE 14% (168.6) 14% (224.2) 14% (136.8)
Unregulated Pollutant EmissionsThe correlations calculated on TAP for the Laguna on theMVEG cycle are presented in Table 27.
The results obtained for this engine are closed to thoseobtained with the VTEC engine. Nevertheless, the study ofthe correlations shows that the combustion of the dimate isincomplete: this phenomenon, outlined during the study of
23
TABLE 25
NOx emission model: influence of each base(contribution in g/km or g/kWh)
Oil & Gas Science and Technology – Rev. IFP, Vol. 58 (2003), No. 1
CO emissions is confirmed here with the high contribution ofdimate to the emissions of acetaldehyde.
TABLE 27
TAP emission model: influence of each base(contribution in mg/km, vehicle results)
TAP Buta-1,3-
emissions dieneBenzene Formaldehyde Acetaldehyde
1-p-value 95 < < 99 95 < < 99 – 99 < < 99.9
R2 0.88 0.89 – 0.93
HR 13% (0.19) 32% (3.24) – 9% (0.28)
LR 9% (0.13) 40% (4.13) – 2% (0.07)
Dim. 44% (0.67) 9% (0.91) – 20% (0.66)
FCC 19% (0.29) 3% (0.29) – 2% (0.05)
Alk. 6% (0.09) 0% (–0.54) – 2% (0.06)
Isom. 9% (0.13) 16% (1.65) – 9% (0.28)
ETBE 1% (0.01) 0% (–0.78) – 57% (1.86)
Effect of Engine Parameters Variationson Bases Contribution to Pollutant EmissionsAs for the lean-burn PFI engine (HondaVTEC), the mainresults of correlations calculation according to enginerunning parameters variations for the Renault F4P arepresented in Table 28.
TABLE 28
Impact of engine running conditions on the contributionof each refinery base on regulated pollutant emissions
↓ Equivalence ratio ↓ Spark advance
HC CO NOx HC CO NOx
HR ≈ ↓↓ ↓ ≈ ↓ ↑
LR ≈ ↓ ↓ ≈ ↓ ↑
Dim. ≈ ↓↓ ↑↑ ↓ ≈ ↑
FCC ↑ ↑↑ ↑ ↓ ↓ ↑
Alk. ↑ ↓ ≈ ≈ ↑ ↓
Isom. ≈ ↑↑ ↓ ≈ ↑ ↓
ETBE ↑ ↑ ↓ ↑ ↓ ↓
It has been observed that the RenaultF4P engine was lesssensitive to parametric variations (equivalence ratio, sparkadvance). Nevertheless, it must be pointed out that thevariation ranges were less wide than for the VTEC, due tothe map characteristics of this second engine (stoichiometricrunning, knock sensitivity).
Some effects are consistent with the results obtained forthe first engine, and especially the growth of the contributionof ETBE to HC emissions in less favorable conditions (leanburn, lower spark advance), due to oxidation difficulties ofthis base.
Discussions on the Stoichiometric PFI EngineAll the tests carried out on the Renault F4P engine indicate aless acute influence of refinery base on pollutant emissionsthan that which was measured on the VTEC engine. In fact, asthe F4P is designed to run under homogeneous stoichiometricconditions without EGR, the parametric variations were morerestricted: for instance, the minimum tested equivalence ratiowas 0.95, while it was 0.65 for the VTEC engine.
Nevertheless, significant fuel effects can be outlined, mostof the time quite similar to those which were observed on thelean-burn engine:– Aromatic and olefinic/parafinic bases have an opposite
effect on CO emissions: dimate and isomerate are themost important contributors to CO emissions in coldtransient emissions, while their influence on CO in steady-state running and on the EUDC cycle is low. On thecontrary, HR contribution is low under cold transientconditions (ECE) and high under steady-state conditions.The key parameter in order to explain the CO emissionsseems to be the density: in cold conditions, a high densityis linked with low CO emissions, while in hot runningconditions the higher the density is, the higher thecontribution to CO emissions is. Many hypotheses can beventured to explain this phenomenon, linked to the air/fuelmixture.
– The study of HC emissions, although more difficultbecause of the low significance of the correlations, showsdifferences between vehicle and engine tests. Densityseems to have an influence during transient running (highcontribution of isomerate, low contribution of HR), butless acute than for CO emissions.
– Correlations on NOx emissions are quite different thanthose calculated for the VTEC engine: the most importantcontributor is ETBE, with up to 30% on the EUDC cycle.This result is consistent with the Auto/Oil program results[2], who noticed an increase of NOx emissions (+5.5%)when using a gasoline with 17% ETBE. This result can beexplained by the fact that with the VTEC engine, lowequivalence ratio induced combustion difficulties forETBE and consequently high CO emissions. As far as theF4P is concerned, the contribution of ETBE to CO andHC emissions is always very low (6% for the CO on theEUDC cycle). The complete combustion of this refinerybase induces higher cycle temperatures and higher NOxemissions. It can be outlined that the equivalence ratiovariation done on the engine tend to confirm this fact: inlean-burn conditions, ETBE induces higher CO and HCemissions and lower NOx emissions.
24
N Hochart et al./ Present Day Engines Pollutant Emissions: Proposed Model for Refinery Bases Impact
3.1.3 Discussion/Comparison of the Two Engines
It has been shown that significant differences betweenrefinery bases can be outlined, not only with regard topollutant emissions, but also to combustion conditions. Themain results are the following:– The main precursor of unburned hydrocarbon is the heavy
reformate. The combustion difficulties of this base may bedue to its high aromatic content or its high density.
– The olefinic bases (fuel from FCC and fuel from olefindimerization process) are characterized by a very fast andviolent combustion, which impacts on pollutant emissionswith incomplete combustion (high CO emissions) and ahigh sensitivity to engine running conditions.
– On the contrary, ETBE seems to have a slow combustion,particularly under more difficult conditions (low sparkadvance, high EGR). This phenomenon is visible on HCemissions, with a drastic growth of ETBE contribution inthe EUDC cycle (high engine speed). Moreover, a post-combustion phenomenon in the exhaust line can beobserved when lowering the spark advance. The effect ofEGR is acute for the VTEC engine, while the effect ofspark advance is important for the F4P engine.Nevertheless, ETBE is a low contributor to NOx and COemissions.From this first test phase, it can be concluded that ETBE
can reduce CO, HC and NOx emissions for a PFI engine,provided the engine running conditions are favorable to agood oxidation of this base (little or no EGR, hot runningcondition, etc.).
The main results for both engines are summarized inTables 29, 30 and 31. In those tables, the contribution of eachbase to HC, CO and NOx emissions are compared for VTECand F4P engine (for each contribution, the results arepresented under the format VTEC/F4P).
Those tables show that most of the effects are common toboth engines: high contribution of HR to HC emissions insteady-state conditions and of dimate and isomerate in ECEcycle. Nevertheless, as outlined in a previous paragraph, themain differences observed between engines concern NOxemissions with a high contribution of ETBE in transientrunning (ECE and EUDC cycles) for the F4P engine. Indeed,the main differences between the two engines, only visible intransient running, seem to come from oxidation difficulties ofETBE in lean-burn conditions with EGR.
3.1.4 Conclusions on Spark-Ignition Engine Tests
This work has shown that significant refinery base effectscan be outlined on pollutant emissions. Most of those effectsare common to both PFI engines:– HR has a high contribution to HC emissions.– The nonregulated pollutant emissions are closely linked to
fuel chemical composition. Moreover, two other ways ofUHC production at the exhaust of the vehicle can beoutlined: partial oxidation and in situsynthesis.
– Both engines are very sensitive to transient running andshow quite different results between engine and vehicletests.
25
Oil & Gas Science and Technology – Rev. IFP, Vol. 58 (2003), No. 1
3.2 Compression-Ignition Engines
3.2.1 Passenger Car Diesel Engine and Vehicle Results
An example of the bench test results obtained with the dieselengine is given in Figure 4. It represents the smoke/NOxtrade-off measured at the bench. The operating conditions are“2000 rpm - BMEP = 2.0 bar” with different EGR rates(from 15% to 50%).
We observe that the G1 fuel gives a better smoke/NOxtrade-off than the centre diesel fuel at each EGR level. This isessentially due to the G1 formulation, including 50% vol. ofFischer-Tropsch product, while the centre diesel fuel containsonly about 12.8% vol. of this high potential emissionsreduction product.
Figure 4
Smoke/NOx trade-off measured on the engine bench.
15%
50%
EGRG1
2000 rpm - BMEP = 2.0 barsmoke/NOx trade-off according to EGR rate
3.6
3.2
2.8
2.4
2.0
1.6
1.2
0.8
0.4
0
Sm
oke
(FS
N)
1 2 3 4 5 6 70
NOx (g/kWh)
Centre
26
TABLE 32
CO emission model: influence of each base (contribution in g/km or g/kWh)
N Hochart et al./ Present Day Engines Pollutant Emissions: Proposed Model for Refinery Bases Impact
Carbon Monoxide EmissionsThe results are described in Table 32.
On the vehicle, the LCO is the strongest contributor(approximately 35% whatever the phase) to CO emissions,while the Fischer-Tropsch is the smallest (around 1%). Onthe engine, the Fischer-Tropsch is always the smallest(responsible for 5 to 10%) while the strongest is the kerosenefuel (25 to 30%).
Unburned Hydrocarbons EmissionsFor HC emissions (Table 33), LCO is the strongestcontributor, as for CO emissions, on vehicle and on enginetests. Fischer-Tropsch fuel is always the weakestcontributor. The kerosene fuel is also a potent contributor,but only in the bench experiment, as for CO emissions.
Nitrogen Oxides Emissions
Diesel fuel formulation impact on NOx emissions (Table 34)is weaker than on CO or HC emissions. Nevertheless, LCOappears to be the strongest contributor, with a relativeweight around 25%, while the other bases have similarcontributions.
Particulate and Smoke Emissions
The calculated models on particulate (Table 35)and smoke(Table 36)emissions are quite similar: LCO and HVDR fuelsare the strongest contributors (between 20 and 45%). Fischer-Tropsch fuel (and kerosene fuel in the case of particulate andsmoke emissions) are the smallest contributors (about 5to 10%).
27
TABLE 34
NOx emission model: influence of each base (contribution in g/km or g/kWh)
Vehicle test Engine test
NOx emissions ECE phase 2500 rpm full load 4000 rpm full load Pt2 (standard tuning)
1-p-value 88.1% 90.1% 91.3% 95% < < 99%
R2 0.65 0.67 0.69 0.76
SR 17% (0.82) 14% (2.71) 14% (3.73) 16% (6.15)
HDC 16% (0.81) 15% (2.83) 14% (3.86) 16% (5.93)
LCO 18% (0.88) 25% (4.69) 24% (6.46) 26% (9.79)
HVDR 18% (0.87) 14% (2.55) 13% (3.68) 18% (7.08)
KERO 17% (0.85) 17% (3.25) 19% (5.23) 12% (4.66)
FT 14% (0.68) 15% (2.93) 16% (4.40) 12% (4.70)
TABLE 35
Particulate emission model: influence of each base (contribution in g/km or g/kWh)
Oil & Gas Science and Technology – Rev. IFP, Vol. 58 (2003), No. 1
TABLE 36
Smoke emission model: influence of each base(contribution in FSN number, engine bench measurements only)
Engine test
Smoke emissions 2500 rpm full load Pt2 (standard tuning)
1-p-value 95% < < 99% 93.8%
R2 0.81 0.72
SR 18% (2.42) 10% (0.09)
HDC 13% (1.77) 17% (0.15)
LCO 28% (3.87) 25% (0.22)
HVDR 25% (3.51) 20% (0.18)
KERO 11% (1.57) 17% (0.15)
FT 5% (0.68) 11% (0.10)
Carbon Dioxide Emissions and Fuel Consumption
As for NOx emissions, the fuel formulation impact on CO2emissions (Table 37)and on fuel consumption (Table 38)isweak. On the engine bench, no models were statisticallysignificant. Nevertheless, on the vehicle, it seems thatthe kerosene fuel has a marginally stronger influence onCO2 emissions and on fuel consumption than the otherparameters.
TABLE 37
CO2 emission model: influence of each base(contribution in g/km)
Vehicle test
CO2 emissions MVEG-11s cycle ECE phase EUDC phase
1-p-value 95% < < 99% 99% < < 99.9% 82.6%
R2 0.83 0.91 0.60
SR 16% (176) 16% (236) 17% (141)
HDC 16% (177) 16% (237) 17% (142)
LCO 17% (178) 17% (245) 16% (138)
HVDR 17% (178) 17% (241) 17% (141)
KERO 18% (196) 19% (275) 17% (149)
FT 16% (170) 15% (226) 16% (137)
Unregulated Pollutant Emissions
The unregulated emissions measured on vehicle in this studyare now presented: there are toxic air pollutants such asbuta-1,3-diene, benzene, formaldehyde and acetaldehyde(Table 39), some PAH (Table 40)and OFP (Table 41).
TABLE 38
Fuel consumption model: influence of each base(contribution in l/100 km)
TAP emission model: influence of each base(contribution in mg/km, vehicle results)
TAP Buta-1,3-
emissions dieneBenzene Formaldehyde Acetaldehyde
1-p-value – 85.7% 84.5% 79.4%
R2 – 0.63 0.62 0.58
SR 22% (1.00) 16% (15.21) 16% (7.33)
HDC 17% (0.81) 16% (15.19) 17% (7.80)
LCO 18% (0.83) 32% (29.21) 29% (13.42)
HVDR 16% (0.72) 15% (13.66) 16% (7.52)
KERO 19% (0.88) 13% (11.83) 13% (6.20)
FT 8% (0.37) 8% (7.26) 9% (3.99)
TABLE 40
PAH emission model: influence of each base(contribution in µg/km, vehicle results)
TAP emissions: Benzo(a)
particulate PAH anthraceneChrysene Pyrene
1-p-value 95% < < 99% 79.6% 78.8%
R2 0.84 0.58 0.58
SR 15% (0.06) 15% (0.06) 14% (0.52)
HDC 34% (0.13) 12% (0.05) 29% (1.11)
LCO 24% (0.09) 45% (0.18) 15% (0.55)
HVDR 24% (0.09) 15% (0.06) 25% (0.94)
KERO 3% (0.01) 3% (0.01) 8% (0.29)
FT 0% (0.00) 10% (0.04) 9% (0.34)
28
N Hochart et al./ Present Day Engines Pollutant Emissions: Proposed Model for Refinery Bases Impact
TABLE 41
Total aldehydes emissions and OFP model: influence of each base(contribution in mg/km) (vehicle results)
Unregulated emissions Total aldehydes OFP
1-p-value 80.0% 81.5%
R2 0.58 0.60
SR 16% (30.13) 16% (0.33)
HDC 17% (31.13) 17% (0.35)
LCO 31% (58.08) 29% (0.59)
HVDR 14% (26.29) 15% (0.30)
KERO 13% (24.21) 14% (0.29)
FT 9% (16.00) 9% (0.18)
Considering these unregulated emissions measured onvehicle, the models are very similar one another. LCO is thestrongest contributor (about 30%) and Fischer-Tropsch fuelhas the smallest influence (about 10%).
The hydro-cracked product and the fuel issued fromvacuum distillation residue are also strong contributors to thePAH emissions while the kerosene fuel is characterized bylow factors.
For the buta-1,3-diene, the model was not significant. Theozone forming potential is calculated with the Carter’sfactors in the range C1-C13.
Those results, obtained on the bench engine and with thevehicle can be summarized as follows.
For CO, HC, aldehydes (formaldehyde, acetaldehyde),PAH emissions and for ozone formation potential, the resultsare almost the same. While the Fischer-Tropsch fuel is theweakest contributory base (from 5 to 10%, according to theengine operating conditions), LCO has the strongest impact(from 25 to 35%). The kerosene fuel is also a potentcontributor (from 25 to 30%), in steady-state engineconditions for CO and HC emissions.
LCO is also the most influential base on NOx emissionson steady-state engine conditions: this product ischaracterized by a factor of about 25%. The Fischer-Tropschhas the lowest factor in transient conditions of the vehicle inthe urban phase: 14%.
For particulate emissions, two different behaviors can beidentified:– kerosene and Fischer-Tropsch fuels are low contributors
(from 5 to 10%);– LCO is a strong contributor (from 25 to 45%).
For smoke emissions, there are also two differentbehaviors:– Fischer-Tropsch fuel is a low contributor (from 5 to
10%);
– LCO and the fuel obtained through hydroconversion ofvacuum distillation residue are high contributors (from 20to 30%).CO2 emissions show two types of results: while the
kerosene is the main contributor (18%), the Fischer-Tropschproduct is the weakest with 16%. The same result is foundconsidering fuel consumption: the kerosene fuel is the mostpotent product with 19%.
It must be pointed out that the range of CO2 emissionpercentages is naturally lower than the regulated pollutantemission range, and that a single percentage on CO2emissions reveals a notable impact from the fuel base.
In conclusion, each refinery base selected for thisexperimental design contributes to the emissions of theindirect injection diesel engines (IDI). Nevertheless, thesecontributions are very different from each other. They can beclassified in three main groups:1) Bases characterized by the strongest contributions:
• LCO fuel for CO, HC, NOx, particulate, smoke, SOF,IOF, PAH and aldehydes emissions, for ozone formingpotential and for BSFC;
• The diesel fuel produced by vacuum distillation residuehydroconversion, for CO, particulate, smoke and PAHemissions.
2) The kerosene fuel:• It increases CO, HC and CO2 emissions and fuel
consumption;• It is a low contributor to particulate, SOF, IOF and PAH
emissions.3) The Fischer-Tropsch product:
• It is characterized by the smallest contribution to CO,HC, particulate, smoke, SOF, IOF, PAH, aldehydes andbenzene emissions, and also to ozone forming potential.
The straight-run and the hydrocracked products arecharacterized by intermediate contributions.
All these results are available for the different steady-stateengine operating conditions (such as engine speed, enginetorque, injection timing and EGR rate) and in transientvehicle conditions on the MVEG-11s cycle.
The Table 42 synthesizes the main diesel fuel formulationeffects.
LCO and the vacuum distillation residue hydroconversionfuels are the strongest contributors. These two bases arecharacterized by: – the highest aromatic contents;– a very low “H/C” ratio;– a high density;– and a low cetane number (particularly for the LCO). That
is why the EPEFE program has found a very stronginfluence of these parameters on engine emissions. The kerosene is characterized by a medium cetane number
and by its high volatility. This result can also be expressed interms of high CO and HC emissions.
29
Oil & Gas Science and Technology – Rev. IFP, Vol. 58 (2003), No. 1
On the opposite, the low density and the low aromaticcontents induce low particulate, smoke and PAH emissions.
The specific composition of the Fischer-Tropsch fuel,with 95% of linear alkanes, leads to very peculiar properties:a very high “H/C” ratio, a very low density and a veryhigh cetane number. These characteristics, together withthe absence of aromatic compounds, give this refinerybase the weakest contribution to the pollutant emissionsconsidered.
Considering the hydrocracked fuel, contradictory effectsare observed. The low density, the high cetane number andthe low aromatic content could probably compensate thepossible effect of the naphthene content and lead tointermediate emission levels.
Besides, for the complementary diesel fuels, the mainresults are the following:
– RME, incorporated at a 20% vol. level in the centre dieselfuel, had no significant impact on engine emissions.
– The naphthenic product, added at a level of 20% vol. inthe centre diesel fuel, increases CO emissions from 25 to45%, HC emissions from 25 to 35% and particulateemissions by around 5%.
– The diesel fuel issued from the Fischer-Tropsch processwithout any blending with another product or base leads tothe lowest CO, HC, NOx, particulate, benzene, formal-dehyde, acetaldehyde, PAH (polycyclic aromatic hydro-carbons) emissions and to the lowest ozone formingpotential.
3.2.2 Heavy Duty Results
Each parameter studied was modeled. About 30% of themodels reach a significant level which complies with thecriteria. Results show that models are mostly independentfrom the engine running condition.
Black Smoke Opacity and Smoke Emissions
ELR tests reveal the characteristics of the combustion withreduced excess air. Two bases, LCO and hydro-convertedvacuum distillation residue, are major contributors to thiskind of emission, but at different engine speeds: the first oneat high speed, weighing 33%, the second one at low speed,weighing 27%.
Fischer-Tropsch is represented in the model by thesmallest coefficient, weighing only 2 to 8% of total emis-sions. Kerosene also is a minor contributor, with relativecoefficients about 11 or 13 %.
The results obtained in stabilized running conditions areglobally similar to those observed during transientconditions, despite a higher air/fuel ratio. Once more, thedependence on engine speed of the two major contributorsis verified.
Particulate Emissions
The model, obtained with ESC test, points out three bases.LCO appears to be a major contributor to particulateemissions, while Fischer-Tropsch synthetic gas-oil andkerosene base are represented by low coefficients.
The trends observed prove the role of the base chemicalcomposition. LCO and hydro-converted vacuum distillationresidue bases contain a high percentage of heavy aromaticspecies known to be involved in the classic schemesdescribing particulate formation. On the opposite, syntheticFischer-Tropsch fuel, containing exclusively saturatedmolecules, has a weak contribution to emissions [2-4].
Kerosene also appears to be a minor contributor toparticulate emission, as already mentioned by Akasaka et al.[3, 6].
30
TABLE 42
Main effects of diesel fuel formulation (contribution in %)
CO HC NOx Particulate Smoke Benzene Aldehydes Ozone
N Hochart et al./ Present Day Engines Pollutant Emissions: Proposed Model for Refinery Bases Impact
Nitrogen Oxides
An important result is that the Fischer-Tropsch fuelcontributes weakly to NOx emissions, while it alsocontributes to reduced smoke and particulate emission levels[2]. Constant relative factor from 12 to 14% is found in themodels. The specificities of this base are its low density, near0.760, resulting in a low fuel mass introduction rate into thecylinder, and a high cetane number, about 80, resulting in ashort self-ignition delay. Thus, the fuel mass concerned byself-ignition is reduced, as is the temperature peak levelreached during the premix phase [5].
Kerosene [3, 6], at heavy loads, and hydro-cracked base,at low loads, also do not lead to high emission coefficients.The first one is characterized by a low specific gravity, thesecond one by a high cetane number.
For opposite reasons, products with high density butlow cetane number (LCO and hydro-converted vacuumdistillation residue) lead to the highest contributions,weighing about 20%.
Combustion Noise and Maximum Heat Release
Models have been calculated using the acoustical output ofthe combustion noise, and are significant over the entirerange of conditions tested. Differences in weightingsbetween the bases are extremely important, from 3 to 50%.The results are in accordance with what could be expectedconsidering the cetane number of pure bases measured onCFR engine.
Thus, major contributors are LCO (25 to 50%) andkerosene (16 to 31%), while minor contributors are Fischer-Tropsch fuel (3 to 8%) and the hydro-cracked base (5 to11%).
Models obtained for the maximum heat release onlyconcern low loads, where the heat release peak value occursduring premix combustion (for loads higher than 50%,maximum heat release occurs during the diffusion phase ofthe combustion). So, at low loads, highest weightings arethose of LCO and kerosene, while the lowest are those ofFischer-Tropsch [5] and hydro-cracked bases. On thesepoints, correlation with combustion noise is excellent.
Brake Specific Fuel Consumptionand Carbon Dioxide Emissions
Since heating values of the few bases do not reveal anysignificant difference, the results given by the models areessentially governed by the physical properties of the bases,such as cetane number and specific gravity, which bothdetermine self-ignition delay and combustion duration.Models are strongly dependent on the engine load. TheTable 43 sums up the trends observed for the specific fuelconsumption.
Carbon dioxide trends only differ from previous results bytaking into account hydrogen to carbon ratio. H/C of Fischer-Tropsch and hydro-cracked base, which contain exclusively
or essentially saturated compounds, are about 2 while thoseof LCO and hydro-converted vacuum distillation residue,essentially composed of aromatic molecules, are about 1.Thus, trends concerning Fischer-Tropsch, hydro-cracked andhydro-converted vacuum distillation residue bases arestressed. Unlike these examples, kerosene which had thehighest weighting for BSFC at high load, is no longer themajor contributor to carbon dioxide emissions due to a ratherhigh hydrogen to carbon ratio.
TABLE 43
Bases weightings for BSFC
High load Low load
Strongest weight Kerosene Hydro-converted vacuum
distillation residue
Weakest weight Fischer-Tropsch hydrocracked
Unburned Hydrocarbons EmissionsThough unburned hydrocarbons content of exhaust gases israther low, about 80 ppm, trends could have been drawn fromthe tests. Over the entire range of test conditions, LCO and toa certain extent kerosene [6] are the major contributors tothese emissions. The characteristic temperatures of thedistillation curves are particularly low. The temperaturecorresponding to the initial point is about 90°C, and the onecorresponding to 5 percents distilled is about 150°C.
On the other hand, lowest weightings are those of baseswith rather high initial temperatures of distillation curve,such as hydro-cracked and hydro-converted vacuumdistillation residue bases, except in full load conditions,where Fischer-Tropsch surprisingly appears to contributestrongly to emissions.
For example, the model drawn from European steady-state cycle describes unburned hydrocarbons emissions asfollows:
Carbon Monoxide EmissionsLike unburned hydrocarbons emissions, carbon monoxideemissions are quite low, about 120 ppm. Results concerningLCO appear extremely dependent from the load conditions:weighting of LCO is the highest coefficient in partial loadrunning, but the weakest while running full load.
Whatever the engine running condition may be, hydro-converted vacuum distillation residue remains a rather strongcontributor to carbon monoxide emissions, as well askerosene to a certain extent.
SynthesisThe main results obtained on the heavy duty engine can besummarized as follows (Table 44).
31
Oil & Gas Science and Technology – Rev. IFP, Vol. 58 (2003), No. 1
TABLE 44
Main diesel fuel formulation effects (contribution in %)
CO HC NOxParticulate Smoke/ Combustion
mass Opacity noise
LCO +++ +++ +++ +++ +++ ++++
HVDR +++ ++ +++ ++ ++++ ++
KERO +++ +++ ++ + + +++
HDC ++ + ++ ++ ++ +
FT ++ ++ + + + +
3.2.3 Conclusions of Diesel Tests
The diesel tests show that the contributions are very differentfrom one base to another. The bases can easily be identifiedout as potentially high emissions precursors, or, on the otherhand, as emissions reducing elements. So, these bases can beclassified in four significantly different categories: 1) Products characterized by strong contributions, among
others to NOx, particulate and smoke emissions, in steadystate and in transient conditions: fuels from LCO andhydro-conversion of vacuum distillation residue. For thetrucks, LCO also leads to a high combustion noise and thehydro-converted vacuum distillation residue seems toincrease the specific fuel consumption.
2) Kerosene, as a high contributor to CO and HC emissions(and also to combustion noise and to specific fuelconsumption for the trucks), but low contributor toparticulate and smoke emissions.
3) Straight-run and hydro-cracked products, for theirintermediate contributions. Nevertheless, the hydro-cracked base is a minor contributor to HC, CO and CO2emissions from the heavy duty engine.
4) Fischer-Tropsch process fuel, which has a very low levelof emissions. The high density and high aromatic content refinery bases
(LCO and HVDR) lead to the highest NOx, particulate andsmoke emissions levels. On the other hand, the products oflow density and containing no aromatic compound (Fischer-Tropsch and kerosene) lead to the lowest particulateemissions levels. These results can probably be explained bya global physical effect (density) combined with a finechemical effect (composition in aromatic precursor).
The kerosene, which is the most volatile product, increasethe CO and HC emissions.
On the other hand, the Fischer-Tropsch fuel leads to adecrease in the auto-ignition delay because of its chemicalcomposition (95% of linear paraffinic compounds). This isthe origin of the improvements of the CO and HC emissions,and also of the smoke/NOx trade-off produced by this base.
Besides, the incorporation of 20% vol. of rapeseed methylester (RME) in the centre diesel fuel had no significantimpact on regulated engine emissions when the blending of20% vol. of a naphthenic product in the same center dieselfuel increased, in certain operating conditions on engine oron vehicle, the CO and HC emissions levels.
It may be concluded that the best diesel fuel to reducesignificantly present day indirect injection diesel enginesemissions and present day heavy-duty diesel trucks emissionsis the Fischer-Tropsch base. The very high potential of thisvery particular base suggests a detailed study to define theoptimization of engine with Fischer-Tropsch fuels. Thisoptimization could, for example, focus on lower compressionratios, reduction of the injection timing, different EGRrate, etc.
CONCLUSIONS
The main objective of this study was to determine the impactof fuel refinery bases on engine emissions. The study showsclearly that they have a significant influence on regulatedpollutant emissions, unregulated pollutant emissions and onfuel consumption of spark-ignition engines, of indirectinjection diesel engines and of heavy-duty diesel engines.These results are valid on engines and on vehicles. Theimpact of the selected refinery bases (issued from differentrefinery or synthesis processes) has been mathematicallymodeled for regulated and unregulated pollutant emissionsand for fuel consumption.
Further works are currently under way at IFP with the samefuels blends on new engine technologies (gasoline direct injec-tion and common rail, corresponding to Euro III and Euro IVemissions specifications). It will be interesting to compare theresults presented in this paper with those of these last tests.
REFERENCES
1 ACEA, EUROPIA (1995) EPEFE (European Program onEmissions, Fuels and Engine Technologies).
2 Clark, N., Gautam, M., Lyons, D., Atkinson, C., Xie, W.,Norton, P., Vertin, K., Goguen, S. and Eberhardt, J. (1999)On Road Use of Fischer-Tropsch Diesel Blends. SAE Paper1999-01-2251.
3 Uchida, M. and Akasaka, Y. (1999) A Comparison of Emis-sions from Clean Diesel Fuels, SAE Paper1999-01-1121.
4 Suppes, G.J, Lula, C.J., Burkhart, M.L. and Swearingen, J.D.(1999) Type Performance of Fischer-Tropsch Liquids (FTL)in Modified Off-Highway Diesel Engine Test Cycle. SAEPaper1999-01-1474.
5 Atkinson, C., Thompson, G., Traver, M. and Clark, N. (1999)In-Cylinder Combustion Pressure Characteristics of Fischer-Tropsch and Conventional Diesel Fuels in a Heavy Duty CIEngine. SAE Paper1999-01-1472.
6 Akasaka, Y., Suzuki, T. and Sakurai, Y. (1997) ExhaustEmissions of a DI Diesel Engine Fueled with Blends ofBiodiesel and Low Sulfur Diesel Fuel. SAE Paper972998.