Comparing Baseline Dairies And Those Comparing Baseline Dairies And Those Using Potential Mitigation Practices Using Potential Mitigation Practices Charles Krauter Charles Krauter Center for Irrigation Technology and Plant Science Department Center for Irrigation Technology and Plant Science Department California State University, Fresno California State University, Fresno 5370 N. Chestnut Ave. M/S OF18 5370 N. Chestnut Ave. M/S OF18 Fresno CA. 93720 Fresno CA. 93720 [email protected][email protected]Matt Beene and Dave Goorahoo Matt Beene and Dave Goorahoo Center for Irrigation Technology, California State University, F Center for Irrigation Technology, California State University, F resno resno Donald Blake Donald Blake Department of Chemistry, University of California at Irvine Department of Chemistry, University of California at Irvine William Salas and William Salas and Chengshang Chengshang Li, Li, University of New Hampshire University of New Hampshire
Transcript
Comparing Baseline Dairies And Those Comparing Baseline Dairies And Those Using Potential Mitigation PracticesUsing Potential Mitigation Practices
Charles KrauterCharles KrauterCenter for Irrigation Technology and Plant Science DepartmentCenter for Irrigation Technology and Plant Science DepartmentCalifornia State University, FresnoCalifornia State University, Fresno5370 N. Chestnut Ave. M/S OF185370 N. Chestnut Ave. M/S OF18Fresno CA. 93720Fresno CA. [email protected][email protected]
Matt Beene and Dave GoorahooMatt Beene and Dave GoorahooCenter for Irrigation Technology, California State University, FCenter for Irrigation Technology, California State University, Fresnoresno
Donald BlakeDonald BlakeDepartment of Chemistry, University of California at IrvineDepartment of Chemistry, University of California at Irvine
William Salas and William Salas and ChengshangChengshang Li,Li,University of New HampshireUniversity of New Hampshire
AbstractA study of ROG emissions related to dairy
operations was conducted at two Central California locations in 2003-04. Monitoring and modeling methods developed for that project will be applied to a more comprehensive study to be conducted in 2005-09. The development of that program and examples of some preliminary results will be presented here.
Summa canister, 6 liter sample for ROGanalysis using EPA TO-15
Meteorology station ( Air Temp,RT%, wind speed and direction
Canister regulator (2hr sample)
Initial Ammonia/ROG study 2003-05
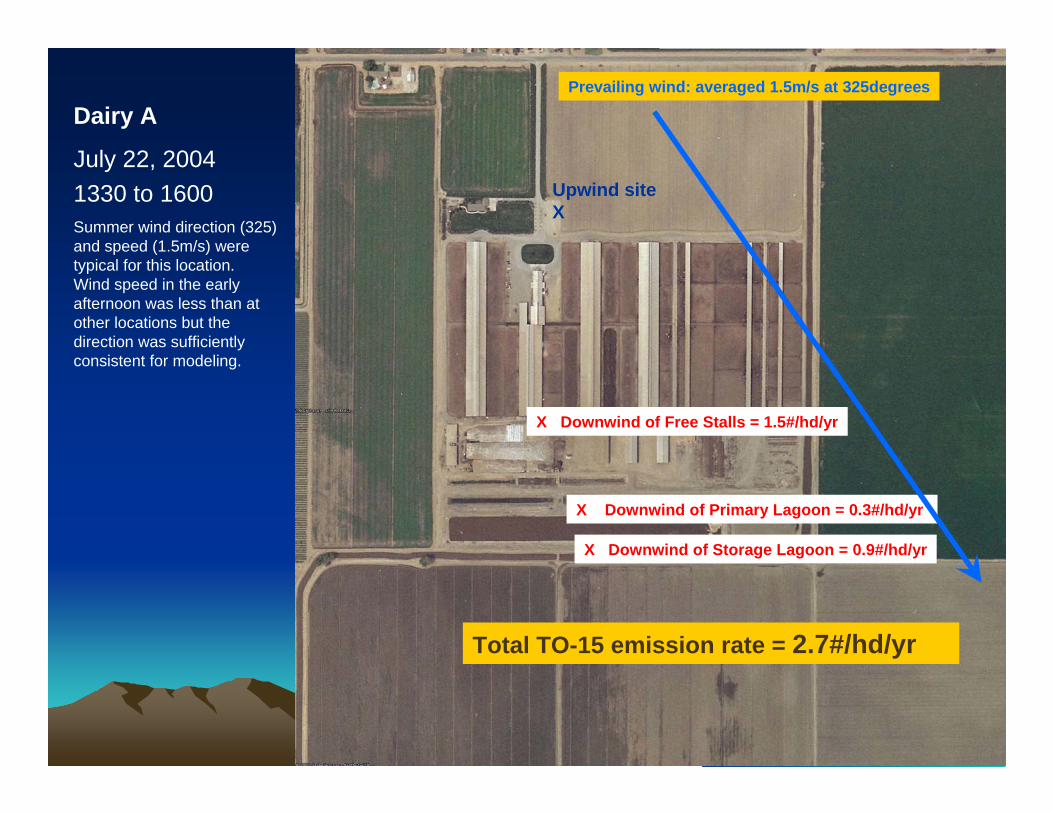
Dairy ASampling Locations:
Prevailing wind = 320 degrees
UpwindDownwind of the Free Stalls
Downwind of the Lagoon System
Dairy A
July 22, 20041330 to 1600Summer wind direction (325) and speed (1.5m/s) were typical for this location. Wind speed in the early afternoon was less than at other locations but the direction was sufficiently consistent for modeling.
Upwind siteX
X Downwind of Free Stalls = 1.5#/hd/yr
X Downwind of Primary Lagoon = 0.3#/hd/yr
X Downwind of Storage Lagoon = 0.9#/hd/yr
Prevailing wind: averaged 1.5m/s at 325degrees
Total TO-15 emission rate = 2.7#/hd/yr
CSUCSU--Fresno Dairy Air Quality Projects in the Central ValleyFresno Dairy Air Quality Projects in the Central Valley
• Currently, a second project funded by CARB and CSU-ARI will monitor emissions from six dairies in the valley to document practices that can reduce ROG emissions.
• Dairies sampled in the initial project (’03 to ’05) were the same as those monitored by Dr. Schmidt for his CARB project.
Dairies sampled for 03-05 project
Planned Projects:Planned Projects:• Phase 2 of CARB funded project will increase the number of
monitored dairies to six and analyze for additional compounds. Emphasis will be on comparing emissions from different manure handling systems and evaluation of seasonal and day/night differences in emissions (July’05 to June’07)
• Matching CSU Ag Research Initiative funding will add analytical capability for alcohols, N2O and other non-canister procedures as well as an additional year (September’05 to June’08)
• USDA and UNH funding to study Nitrogen/Carbon ratios at the same 6 dairies. (July’05 to June’08)
““TypicalTypical”” CA DairyCA Dairy
• Free stalls and exercise corrals.• Flush lane manure collection system.• Separation of solids and liquid.• Solids used variously.• Storage of liquid in lagoon system for flush
water and recycling of nutrients to cropland• Dairies A, B, C, and D
Sampling ethanol, methanol, NH3, N2O and ROG’s from flux chambers in exercise corrals at Dairy B
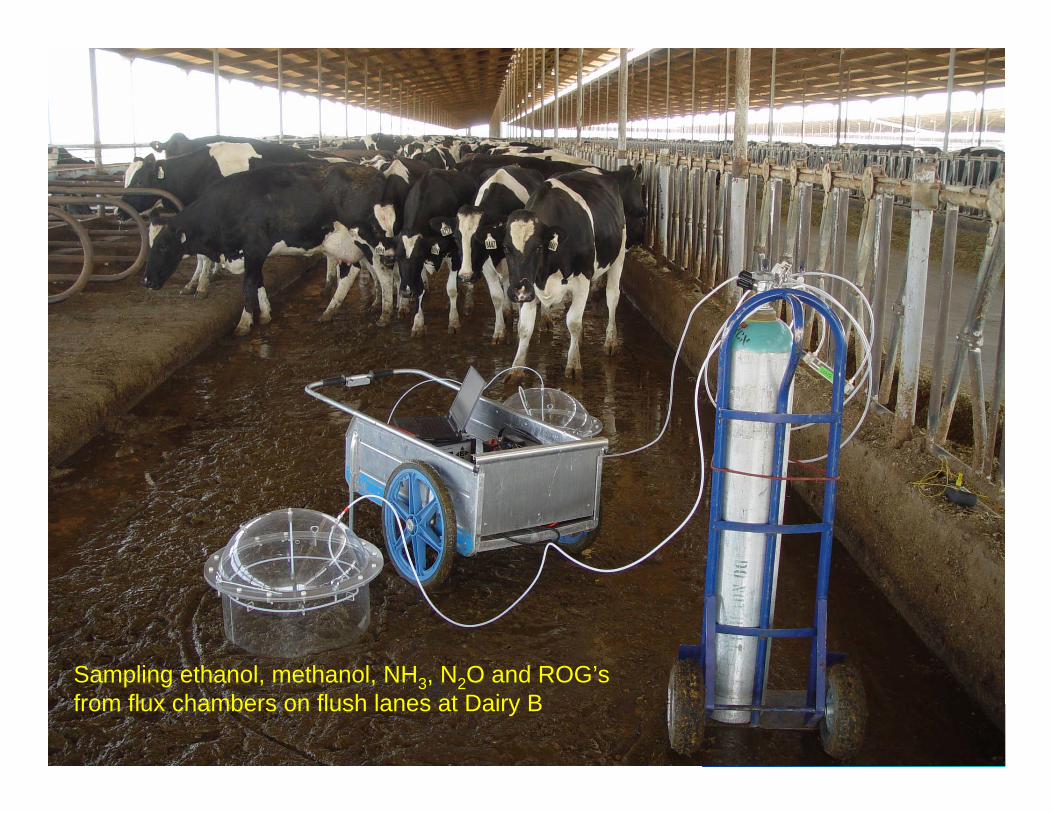
Sampling ethanol, methanol, NH3, N2O and ROG’sfrom flux chambers on flush lanes at Dairy B
Sampling ethanol, methanol, ammonia and ROG’s from Total Mixed Ration (TMR) using flux chambers at Dairy A
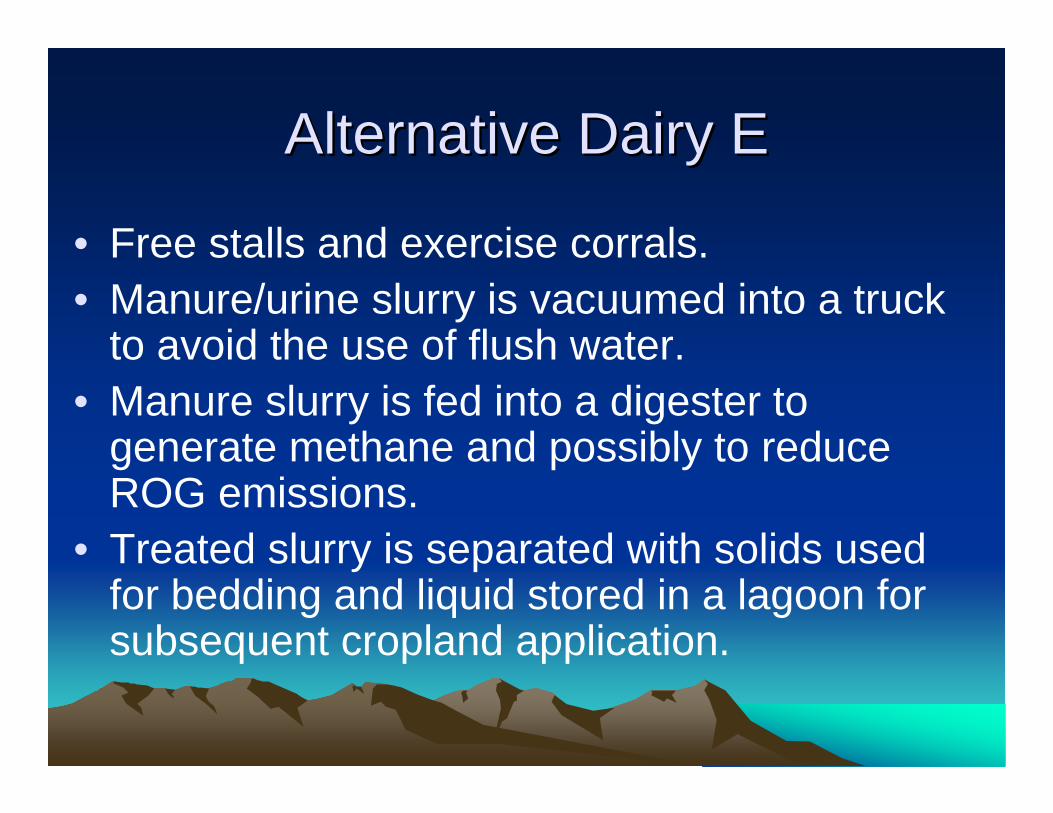
• Free stalls and exercise corrals• Manure/urine slurry scraped into a
collection pit.• Manure slurry pumped into a large tank-
trailer for injection below the soil surface of cropland.
Manure Slurry Pit (Dairy F)
Dairy F: Manure slurry collected by scraper and applied to cropland
Ethanol, methanol and ammonia from Total Mixed Ration for dry cows at Dairy F
Dairy F - July 24, 2006
0
15000
30000
45000
60000
75000
90000
TMR +1h TMR + 2h Silage Pile Face-Disturbed
source
ug/m
2 /min
.
Ethanol
Methanol
Feed Sampling ProceduresFeed Sampling Procedures• Flux chamber sampling within the first hour after TMR
is delivered.• Second sampling an hour after the first.• INNOVA monitoring for ethanol, methanol, NH3, N2O,
CO2 and water vapor.• Second NH3 sample with denuder• ROG sample for GCMS at UCI and CSUF• Temperature of air and surface • Flux chambers were used at Dairy A from initial TMR
delivery for six hours to monitor changes in emissions during for the time the TMR was available.
Dairy A - October 3, 2006Pair averaged
R2 = 0.721
R2 = 0.2963
0.0
20.0
40.0
60.0
80.0
100.0
120.0
140.0
160.0
180.0
2.1
2.4
2.8
3.1
3.5
3.8
4.2
4.6
4.9
5.3
5.6
hours post feeding
ppm
V
Ethanol
Methanol
Linear(Ethanol)Linear(Methanol)
Complete Monitoring ProgramComplete Monitoring Program• Each of the six dairies will be monitored three times/year
beginning fall-’05 through spring/summer-’08.• Ambient, upwind/downwind canister sampling for GCMS
analysis at UCI and CSUF.• Flux chamber sampling of TMR, silage, flush-lanes, open lots
and land applications. Real time monitoring with INNOVA (ethanol, methanol, NH3, N2O, CO2 and water vapor) plus canister samples taken for GCMS.
• Solids and liquid samples collected at various points through the manure handling process and analyzed for N and C compounds for the DNDC project.
• Feed and silage samples taken for analysis by a commercial dairy lab.