Analysis of Building Characteristics and Indoor Environmental Quality in California Classrooms Analysis of Building Characteristics and Indoor Environmental Quality in California Classrooms Robert P. Clickner, Ph.D Westat May 4, 2007
Transcript
Analysis of Building Characteristics and Indoor Environmental Quality in
California Classrooms
Analysis of Building Characteristics and Indoor Environmental Quality in
California ClassroomsRobert P. Clickner, Ph.D
Westat
May 4, 2007
OverviewOverview
Background PurposeStudy DesignResults– For both portable and
traditional classrooms, unless specified otherwise
PCS conducted jointly by ARB and DHSThese analyses sponsored by ARB and the California Energy Commission
Characterize distribution of energy & comfort-related characteristics of portable & traditional classrooms in a statewide, representative sample of K-12 public classrooms from the California Portable Classrooms Study (PCS).
Explore in detail the relationships among key building variables – eg, location, building age & ventilation system type & condition -- & indoor environmental quality (IEQ) measures in the PCS data set.
Overall Purpose of StudyOverall Purpose of Study
Specific ObjectivesSpecific ObjectivesMV Characterize associations between ventilation rates/indicators &
• Levels of indoor air pollutants (VOC’s, aldehydes, PM), CO2, noise, teacher satisfaction, temperature, humidity, pollen & spores.
NV Characterize associations between natural ventilation (use of open doors & windows) &
• Levels of indoor air pollutants, moisture, noise, teacher satisfaction, & other factors measured in the PCS.
LT Characterize associations between lighting levels/type & • teacher satisfaction & other factors.
SE Characterize the associations of pollutant levels with• School SES indicators, eg, ethnicity, urbanicity, student
participation in meals assistance and family aid programs, frequency of janitorial service, and proximity to nearby pollutant sources.
PCS Design: Phase IPCS Design: Phase I
Mail Survey (Apr – Jul 2001) 1,181 classrooms in 426 schoolsFacility questionnaire I– School level & classroom level; conditions,
operations, maintenance
Teacher questionnaire I– Classroom level; observations of moisture, air
quality, noise, lighting
Formaldehyde sampling– 911 classrooms in 320 schools
PCS Phase IIPCS Phase IIField Study (Oct ’01 – Feb ‘02)201 classrooms in 67 schools 2 portables & 1 traditional per schoolFacility questionnaire II – School & classroom– Pollutant sources, conditions, operations, maintenance
Teacher questionnaire II - Classroom– Pollutant sources; observe moisture, air quality, noise, lighting
Classroom form– Pollutant sources; observe moisture, air quality, noise, lighting
Consultation with facilities & HVAC mgrs forms– Background, historical data; general data, including pesticides
Environmental Measurements:Airborne
Environmental Measurements:Airborne
13 Aldehydes including formaldehyde9 VOC’s including benzene & chlorinated hydrocarbonsMold Spores and Pollen, 22 speciesCulturable Microorganisms – in specially selected schoolsPM10 and PM2.5
Analysis Approach - ModelsAnalysis Approach - ModelsModels for MV, NV, SE were of the following form:
Y = R + Z + R*Z + X + W + X*W
WhereY is the dependent IEQ variableR is the room type indicatorZ is the outdoor measure of the IEQ variable (when present)X is the vector of variables of interestW is a vector of variables that may affect the relationship between X and Y
Categorical variables X with > 2 levels were represented by indicator variables
Models – LightingModels – LightingFor LT, models of the following form were fit :
Y = R + X + W + X*WWhere
Y is the dependent lighting variableR is the room type indicatorX is the vector of variables of interestW is a vector of variables that may affect the relationship between X and Y
Categorical variables X with > 2 levels were represented by indicator variables
Mechanical Ventilation VariablesMechanical Ventilation VariablesOutdoor air flow per chair, when operatingOutdoor air flow per sq ft, when operatingIndoor-Outdoor CO2 average differenceSupply air flow per person (cfm/chair)Indoor – Outdoor Absolute Temperature DifferenceEase of access to AHU interior HVAC mode during the visitHVAC System ReplacementHVAC System RepairedHVAC inspection periodPrimary energy typeAir handling unit locationType of heating systemNoise level when HVAC on, center of roomNoise level when HVAC on, near registerTeacher ever turn off heater or AC due to noiseSupply air flow (cfm)
Natural Ventilation VariablesNatural Ventilation VariablesSides of the room which have windowsDid the students stay in the classroom or change each periodHow many windows were open today?How many doors open to the outside?Was any classroom door(s) left open today?Today’s weather: rain
Lighting VariablesLighting VariablesTotal skylight areaSides of the room which have windowsPresence of blinds or curtainsItems obstruct daylight through windowsReports of glare problems Weather, sunny or cloudy
Socioeconomic VariablesSocioeconomic VariablesPercent of Hispanic StudentsPercent of African American StudentsPercent of White StudentsPercent of English learner studentsPercent of full credentialed teachersAcademic Performance Index (API) ScoreAverage class size (school wide)Students per computer
General VariablesGeneral VariablesRegion – North or SouthSchool type – Elementary, Middle, HighAwareness/use of EPA IAQ ToolsGeneral instruction classroom – Yes or NoSchool location - urban, suburban, or ruralNumber of students in the schoolRoom size (# chairs)Classroom Age (Year Categories)Room type – traditional or portable
Variables for Specific Analyses - 1Variables for Specific Analyses - 1Temperature - outdoor temperature, thermostat setting
Humidity - outside temperature & humidity, lawn sprinklers; measures of effects of moisture -musty odors, mold on walls, water stains, algae, moss, plant growth
Noise, HVAC on – AHU vibration noise, location of AHU, exterior noises, presence of carpets or rugs
Noise, HVAC off – exterior noises, presence of carpets or rugs
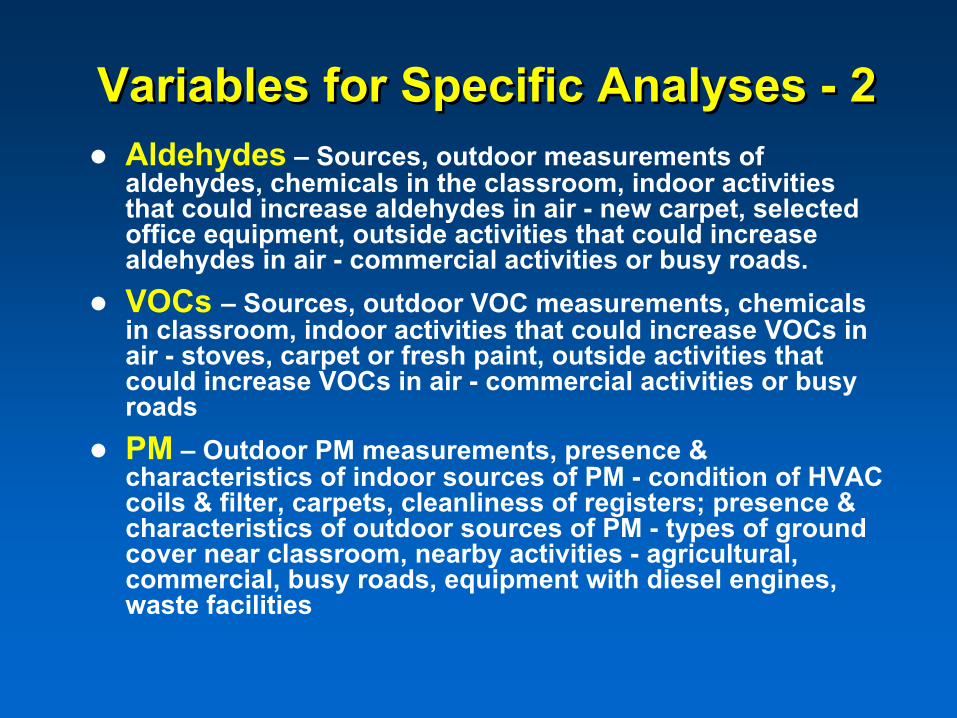
Variables for Specific Analyses - 2Variables for Specific Analyses - 2Aldehydes – Sources, outdoor measurements of aldehydes, chemicals in the classroom, indoor activities that could increase aldehydes in air - new carpet, selected office equipment, outside activities that could increase aldehydes in air - commercial activities or busy roads.VOCs – Sources, outdoor VOC measurements, chemicals in classroom, indoor activities that could increase VOCs in air - stoves, carpet or fresh paint, outside activities that could increase VOCs in air - commercial activities or busy roadsPM – Outdoor PM measurements, presence & characteristics of indoor sources of PM - condition of HVAC coils & filter, carpets, cleanliness of registers; presence & characteristics of outdoor sources of PM - types of ground cover near classroom, nearby activities - agricultural, commercial, busy roads, equipment with diesel engines, waste facilities
Variables for Specific Analyses - 3Variables for Specific Analyses - 3CO2 – Outdoor CO2 measurements, presence of parking lot or roadway within 50 f of classroom, nearby roadways, other combustion processes
Pollen – outdoor pollen, presence of carpets, frequency of their cleaning
Fungal spores – outdoor fungal spores, other sources of spores - carpets, measures of moisture & its effects -humidity, lawn sprinklers, musty odors, mold on walls, water stains, algae, moss, plant growth
Teachers’ assessments of ventilation, noise, light, temperature, and humidity – thermostat setting, teacher’s ability to control thermostat or HVAC
SENV% time CO2 > 1000SENVaverage CO2 In/Out difference)
CO2
Dependent Outdoor Variables for SEDependent Outdoor Variables for SE
log10(avg # particles < 10 µm)
log10(avg # particles < 2.5 µm)PM
Log10(Benzene)VOCs
Log10(Formaldehyde)Aldehydes
Dependent Variables for LTDependent Variables for LT
Satisfaction with lightTeacher Satisfaction
Light away from windows
Light near windows
Light
Stepwise RegressionStepwise RegressionSequentially selects the candidate independent variable most closely associated with the dependent variableThen selects the independent variable that, conditional on the first independent variable being in the model, is most closely associated with the dependent variableThen iteratively adds more variables in the same way until a pre-selected stopping criteria is achievedSUDAAN REGRESS, RLOGIST
Focus on Significant ModelsFocus on Significant Models
Model P-Value < 0.05(P-value for F test of overall model)
And
R2 >= 0.2(Model “explains” 20% or more of the variability in the
dependent variable)
Mechanical Ventilation & TemperatureMechanical Ventilation & Temperature
Awareness/Use ofEPA IAQ toolsRoom type
NoneNANone% timeTemperature< 20° C
NoneNoneNATeacher ever turnoff heater or ACdue to noise
Impact of Room TypeImpact of Room TypeSignificant Predictor – alone or in an interaction term for – Percent time temperature < 20°C (Port colder that trad)– Average humidity (Port < RH)– Percent time humidity >60% (Port have lower RH)– Formaldehyde (Port > Trad)– Acetaldehyde ( Port > trad)– Percent time CO2 > 1,000 ppm (Port < trad)– Avg. number of particles < 10 µm (Port > Trad)– Teacher’s assessment of ventilation (Port more acceptable
than trad)– Teacher’s assessment of humidity (urban & rural, trad more
acceptable than port, reverse in suburban)
Conclusions – 1Conclusions – 1
Source-related measures and general characteristics of the schools and classrooms are better predictors of the IEQ measures than the mechanical and natural ventilation building characteristics.
The same general variables tend to appear as significant in mechanical ventilation, natural ventilation and socioeconomic, regardless of which other independent variables are in the models.
Mechanical ventilation variables had no statistically significant effect on most of the IEQ outcome measures.
– However, the measurements available for use in the modeling limited possible analysis; further analysis based on peak measurements rather than averages.
Increased natural ventilation, e.g., having more doors or windows open, tended to be associated with lower levels of aldehydes and VOC’s.
None of the lighting models satisfied the significance criteria. However, the analysis was limited by the availability of data from the original study
Conclusions - 2Conclusions - 2
The dependent variables tend to be “snap-shot” measurements taken on the day the PCS staff visited the schools, while the independent variables are a mixture of contemporaneous “snap-shot” measurements; long-term descriptions of the schools and occupants; and teachers’ subjective recalls. These factors tend to dampen the observable statistical associations among the variables.
The original report indicated that one of the reasons fans on HVAC units do not operate all the time is that “…the thermostat control limits the amount of time the system fan is operating.” However, Cal-OSHA regulations require that the required operation be operational at all times the space is occupied. While only protective of the teacher by law, this regulation also protects the children whenever the teacher is present, virtually the entire time the students are present.
Dirty filters tend to release accumulated particles when initially started after a quiescent period. The nature of ventilation system operation in schools indicates that systems are started and stopped at least once daily.
RecommendationsRecommendationsThis study underscores the importance of maintenance and shows that it can override system or building type contributions to indoor environmental quality. Replace noisy HVAC units with quieter ones.Ventilation and filtration should fit the site and perhaps, the day and season as outdoor air conditions vary greatly among the sites.Reduce indoor pollutant sources such as formaldehyde emissions from composite wood used during school construction, modernization, and repair.Reduce indoor moisture sources such as leaks in the building shell and gutters, poor drainage under crawlspaces, and foundation skirts with inadequate gaps.Increase the awareness of use of IAQ management tools such as USEPA’s Tools for Schools and Healthy SEAT. To reduce indoor PM, improve the sealing and replacement of HVAC air filters, and reduce the proximity of classrooms to vehicle traffic.