30
Analysis of FHWA Example 5 Bridge at Tacoma by Lemuria Pathfinders Supratik Bose Sathvika Meenakshisundaram Sharath Chandra Ranganath Sandhya Ravindran Amy Ruby May 2014
| Date post: | 16-Jul-2015 |
| Category: |
Engineering |
| Upload: | sharath-chandra |
| View: | 114 times |
| Download: | 0 times |
Analysis of FHWA Example 5 Bridge at Tacoma
by
Lemuria Pathfinders
Supratik Bose
Sathvika Meenakshisundaram
Sharath Chandra Ranganath
Sandhya Ravindran
Amy Ruby
May 2014

Outline
Introduction
Motivation and Objectives
Response Spectra and Scaling of GM
Modeling Assumptions
Analysis Procedure and Results
Conclusions and Recommendations
CSEE DEPARTMENT, UNIVERSITY AT BUFFALO 2

Introduction

Introduction
CSEE DEPARTMENT, UNIVERSITY AT BUFFALO
Plan View of the Eight Span Steel Girder Continuous Bridge
4
Details of Bridge

Objectives

Objectives
CSEE DEPARTMENT, UNIVERSITY AT BUFFALO 6
Primary objective was to evaluate the bridge response using various
analysis procedures given MCEER/ATC 49 report
Comparison of the results obtained from various analysis
Critical assessment of performance of the bridge based on those results
Recommendations for improvement of performance during future
seismic event

Modeling Assumptions
Modeling Assumptions
CSEE DEPARTMENT, UNIVERSITY AT BUFFALO 8
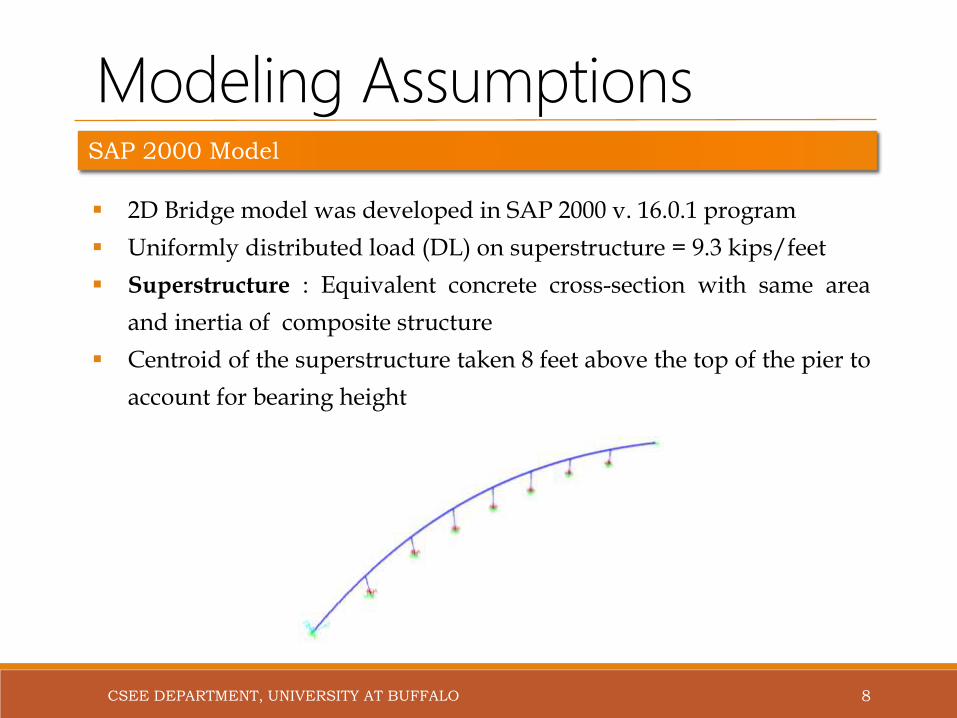
SAP 2000 Model
2D Bridge model was developed in SAP 2000 v. 16.0.1 program
Uniformly distributed load (DL) on superstructure = 9.3 kips/feet
Superstructure : Equivalent concrete cross-section with same area
and inertia of composite structure
Centroid of the superstructure taken 8 feet above the top of the pier to
account for bearing height

Modeling Assumptions…
CSEE DEPARTMENT, UNIVERSITY AT BUFFALO 9
Modeling of Substructure: Piers
Modelled as three 2D frame
elements
Foundation spring stiffness
attached to the bottommost
nodes of the piers
Pinned piers: node 6XX transfers
shears but longitudinal moment
(M3) released
Sliding piers: Only transverse
shear transferred and M3, V2
released
Relationship between actual pier and stick model
Details of sliding bearings
Modeling Assumptions…
CSEE DEPARTMENT, UNIVERSITY AT BUFFALO 10
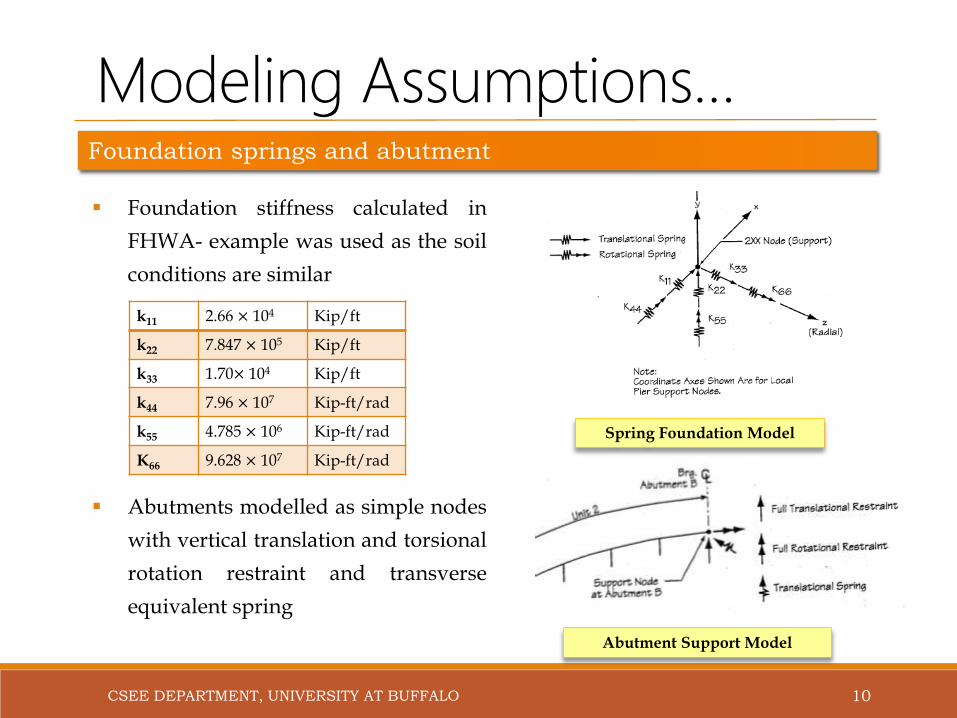
Foundation springs and abutment
Foundation stiffness calculated in
FHWA- example was used as the soil
conditions are similar
Abutments modelled as simple nodes
with vertical translation and torsional
rotation restraint and transverse
equivalent spring
Spring Foundation Model
Abutment Support Model
k11 2.66 × 10⁴ Kip/ft
k22 7.847 × 10⁵ Kip/ft
k33 1.70× 10⁴ Kip/ft
k44 7.96 × 10⁷ Kip-ft/rad
k55 4.785 × 10⁶ Kip-ft/rad
K66 9.628 × 10⁷ Kip-ft/rad

Response Spectra and Scaling
Response Spectra
CSEE DEPARTMENT, UNIVERSITY AT BUFFALO 12
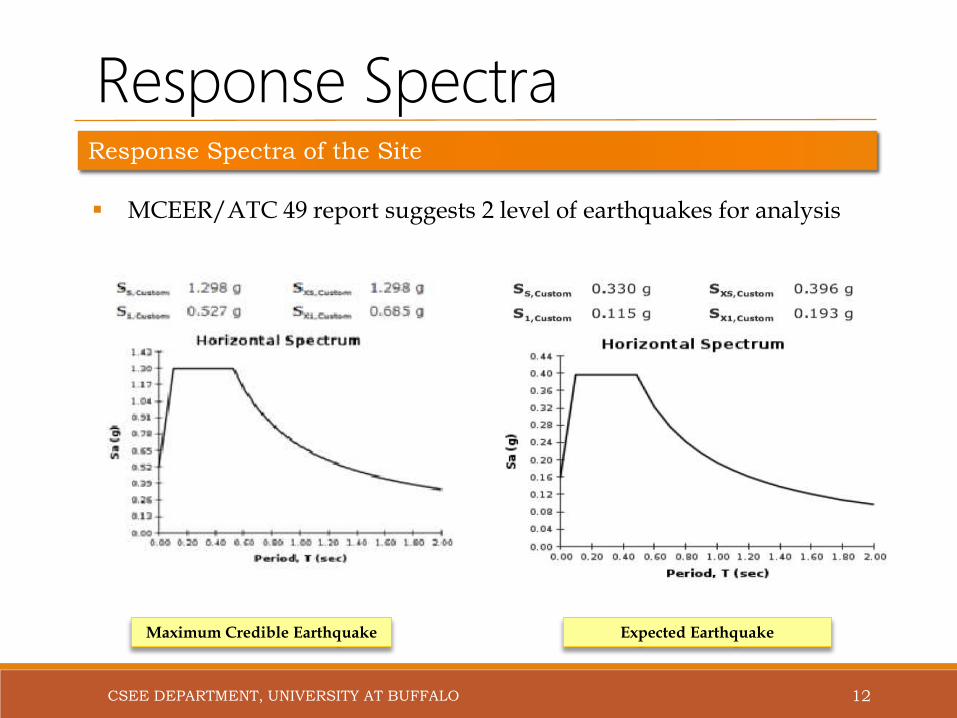
Response Spectra of the Site
MCEER/ATC 49 report suggests 2 level of earthquakes for analysis
Maximum Credible Earthquake Expected Earthquake

Scaling of GMs
CSEE DEPARTMENT, UNIVERSITY AT BUFFALO 13
Selected GMs
Selected ground motions are scaled such that
Geometric mean spectra never lies below 15% of design spectra
Average ratio of mean and target spectra not less than unity over
the period range of significance.
Selected Ground Motions
No Ground Motion NGA# Scale M Year Station
MC
E
1Cape
Mendocino828 1.0 7.01 1992 Petrolia
2 North Ridge 960 1.0 6.69 1994 Canyon Country-W Lost Cany
3 Loma-Prieto 753 1.0 6.93 1989 Corralitos
EE
1 North Ridge 1048 0.38 6.69 1994 North Ridge 17645 Saticoy St
2 Imperial Valley 181 0.47 6.53 1979 El-Centro #6
3 Kobe Japan 1116 0.72 6.90 1995 Shin-Osake

Analysis Procedure and Results
Analysis
CSEE DEPARTMENT, UNIVERSITY AT BUFFALO 15
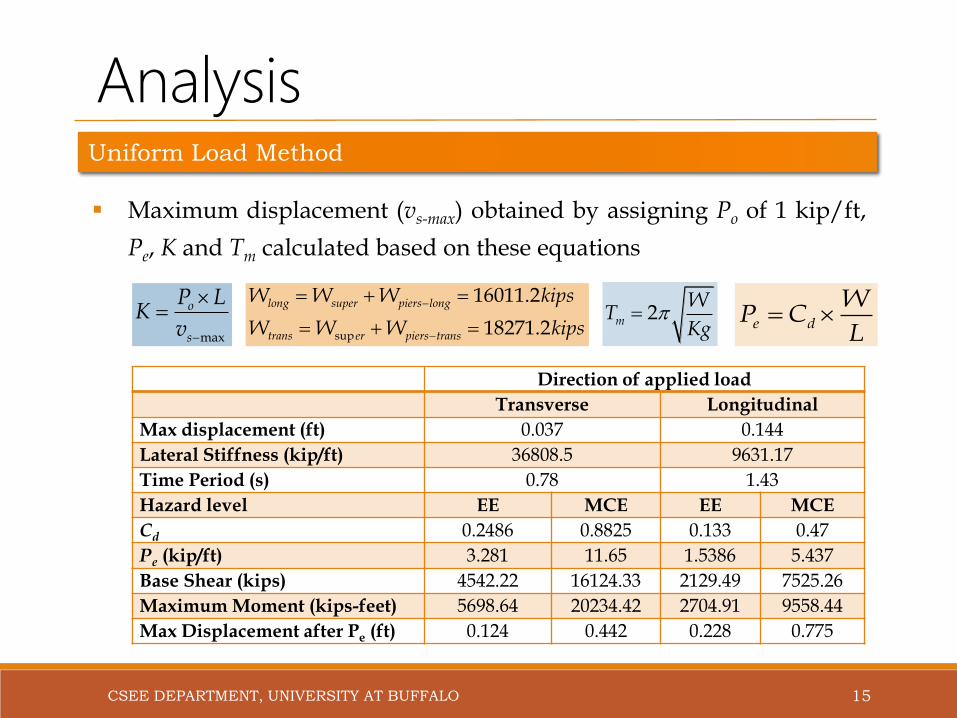
Uniform Load Method
Maximum displacement (vs-max) obtained by assigning Po of 1 kip/ft,
Pe, K and Tm calculated based on these equations
max
o
s
P LK
v
sup
16011.2
18271.2
long super piers long
trans er piers trans
W W W kips
W W W kips
2m
WT
Kg
e d
WP C
L
Direction of applied load
Transverse Longitudinal
Max displacement (ft) 0.037 0.144
Lateral Stiffness (kip/ft) 36808.5 9631.17
Time Period (s) 0.78 1.43
Hazard level EE MCE EE MCE
Cd 0.2486 0.8825 0.133 0.47
Pe (kip/ft) 3.281 11.65 1.5386 5.437
Base Shear (kips) 4542.22 16124.33 2129.49 7525.26
Maximum Moment (kips-feet) 5698.64 20234.42 2704.91 9558.44
Max Displacement after Pe (ft) 0.124 0.442 0.228 0.775
Analysis…
CSEE DEPARTMENT, UNIVERSITY AT BUFFALO 16
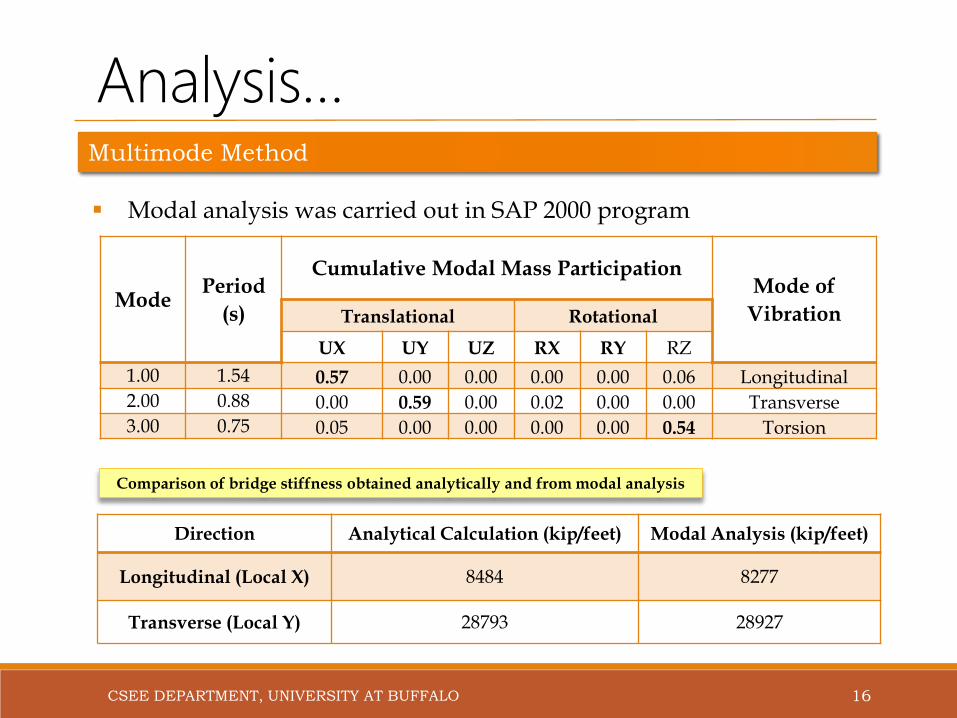
Multimode Method
Modal analysis was carried out in SAP 2000 program
ModePeriod
(s)
Cumulative Modal Mass ParticipationMode of
VibrationTranslational Rotational
UX UY UZ RX RY RZ
1.00 1.54 0.57 0.00 0.00 0.00 0.00 0.06 Longitudinal
2.00 0.88 0.00 0.59 0.00 0.02 0.00 0.00 Transverse
3.00 0.75 0.05 0.00 0.00 0.00 0.00 0.54 Torsion
Direction Analytical Calculation (kip/feet) Modal Analysis (kip/feet)
Longitudinal (Local X) 8484 8277
Transverse (Local Y) 28793 28927
Comparison of bridge stiffness obtained analytically and from modal analysis

Analysis…
CSEE DEPARTMENT, UNIVERSITY AT BUFFALO 17
Multimode Method…
Modes were combined using CQC method and the directional effects
were considered by 100%-40% combination rule
Ambient damping of 5% was considered
Results obtained from multimode response spectrum analysis at MCE
MCE Pier No.
Longitudinal TransverseAxial ForceShear Moment Shear Moment
1L
+ 0
.4T Pier 1 993.8 37327.5 221. 9 114662.1 55.6
Pier 2 1322.1 68960.6 2330.0 125658.3 32.4
Pier 3 699.8 35743.1 2301.7 159105.4 64.9
Pier 4 437.2 20518.7 2693.0 186280.0 26.3
1T
+ 0
.4L Pier 1 1413.3 53082.6 1587.5 79300.8 90.6
Pier 2 2325.7 124775.3 1573.5 84425.7 48.9
Pier 3 1310.0 71479.4 1372.0 91656.7 101.2
Pier 4 1092.5 51280.3 1078.0 74358.5 10.5

Analysis…
CSEE DEPARTMENT, UNIVERSITY AT BUFFALO 18
Pushover Analysis
Fiber PMM hinges were used to define non linearity
Simplified bilinear behaviour assumed for concrete and steel
Triangular loading pattern was used
Individual piers: Hinges only at the bottom of the members
Entire structure: Hinges considered at the base and the neck of the
trapezoidal part of the piers
Stiffness (kips/feet)Longitudinal Transverse
Pushover Analytical Pushover Analytical
70 feet pier 5872 5022 1728 1259
50 feet pier 8100 7841 3375 2983
Stiffness (kips/feet) Chord Radial
Bridge 10500 10331 28889 29521
Comparison of stiffness obtained analytically and calculated from pushover analysis

Analysis…
CSEE DEPARTMENT, UNIVERSITY AT BUFFALO 19
Pushover Curves…
70 feet - Transverse
0
500
1000
1500
2000
2500
0 5 10 15 20 25
La
tera
l F
orc
e (
kip
s)
Displacement (inches)
0
5 105
1 106
1.5 106
0 0.005 0.01 0.015 0.02 0.025
Mo
me
nt
(kip
s-i
nch
es)
Rotation (radians)
0
200
400
600
800
1000
0 5 10 15 20 25
La
tre
al F
orc
e (
kip
s)
Displacement (inches)
0
1 105
2 105
3 105
4 105
5 105
0 0.005 0.01 0.015 0.02 0.025
Mom
en
t (k
ips-i
nch
es)
Rotation (radians)
70 feet - Longitudinal
0
5000
10000
15000
20000
25000
30000
0 2 4 6 8
La
tera
l F
orc
e (
kip
s)
Displacement (feet)
Entire bridge - Transverse
0
1000
2000
3000
4000
5000
0 2 4 6 8
La
tera
l F
orc
e (
kip
s)
Displacement (feet)
Entire bridge - Longitudinal
Analysis…
CSEE DEPARTMENT, UNIVERSITY AT BUFFALO 20
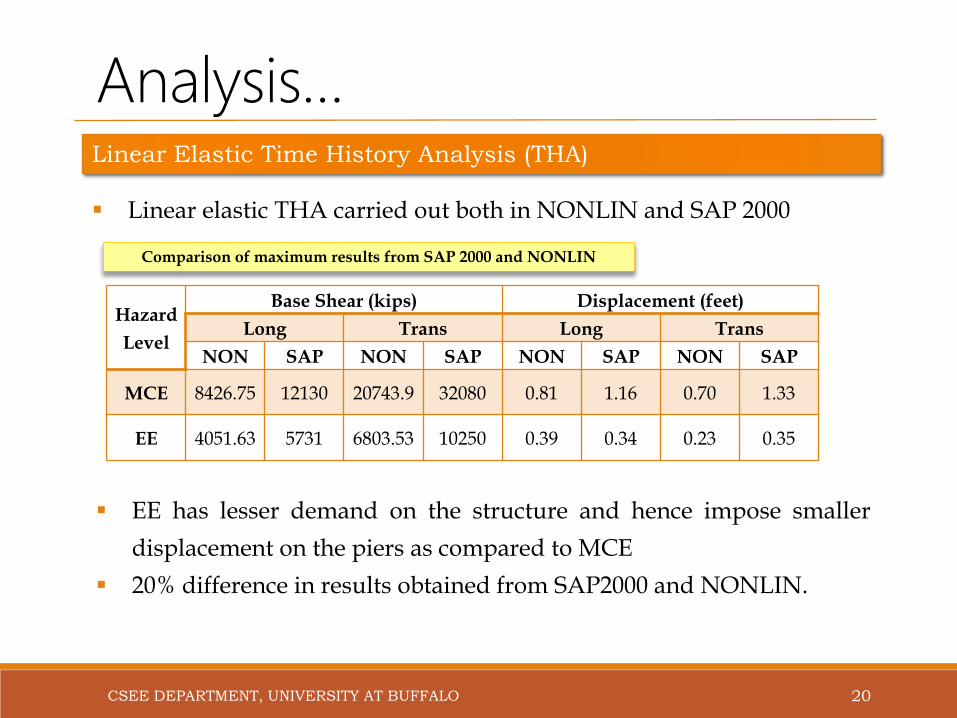
Linear Elastic Time History Analysis (THA)
Linear elastic THA carried out both in NONLIN and SAP 2000
Hazard
Level
Base Shear (kips) Displacement (feet)
Long Trans Long Trans
NON SAP NON SAP NON SAP NON SAP
MCE 8426.75 12130 20743.9 32080 0.81 1.16 0.70 1.33
EE 4051.63 5731 6803.53 10250 0.39 0.34 0.23 0.35
Comparison of maximum results from SAP 2000 and NONLIN
EE has lesser demand on the structure and hence impose smaller
displacement on the piers as compared to MCE
20% difference in results obtained from SAP2000 and NONLIN.

Analysis…
CSEE DEPARTMENT, UNIVERSITY AT BUFFALO 21
Non Linear SDoF Time History Analysis (THA)
Nonlinear SDoF THA was carried out in NONLIN
Simplified bilinear behaviour was assumed with K2 = 0
Yield strength obtained from pushover analysis
Hazard Level
GM
Global X Linear Global X Nonlinear
Global Y Linear
Global Y Nonlinear
Shear (kips)
Disp. (feet)
Shear (kips)
Disp. (feet)
Shear (kips)
Disp. (feet)
Shear (kips)
Disp. (feet)
MC
E NGA 753-FN 2757 0.27 2757 0.27 7356 0.25 7356 0.25
NGA 753-FP 6905 0.67 4250 0.72 20409 0.69 20409 0.69
NGA 828-FN 4165 0.40 4165 0.40 18876 0.64 18876 0.64
EE
NGA 1048-FP 3105 0.30 3105 0.30 5007 0.17 5007 0.17
NGA 1116-FP 2297 0.22 2297 0.22 5644 0.19 5644 0.19
NGA 1116-FP 4052 0.39 4052 0.39 6282 0.21 6282 0.21
Comparison of results from linear and nonlinear analysis in NONLIN
Analysis…
CSEE DEPARTMENT, UNIVERSITY AT BUFFALO 22
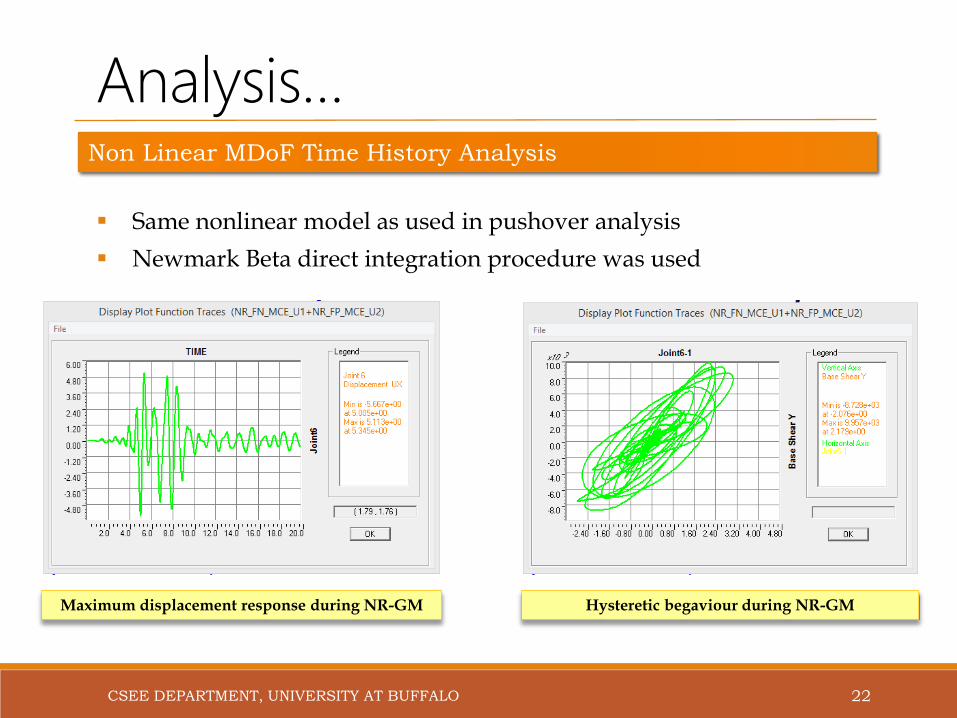
Non Linear MDoF Time History Analysis
Same nonlinear model as used in pushover analysis
Newmark Beta direct integration procedure was used
Maximum displacement response during NR-GM Hysteretic begaviour during NR-GM
Analysis…
CSEE DEPARTMENT, UNIVERSITY AT BUFFALO 23
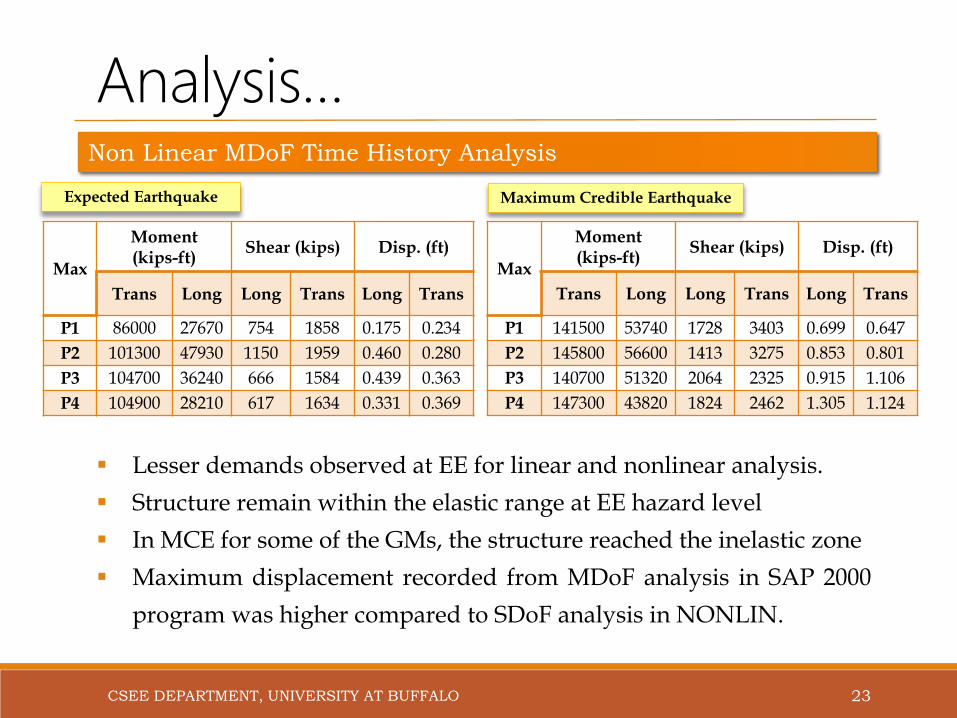
Non Linear MDoF Time History Analysis
Lesser demands observed at EE for linear and nonlinear analysis.
Structure remain within the elastic range at EE hazard level
In MCE for some of the GMs, the structure reached the inelastic zone
Maximum displacement recorded from MDoF analysis in SAP 2000
program was higher compared to SDoF analysis in NONLIN.
Max
Moment (kips-ft)
Shear (kips) Disp. (ft)
Trans Long Long Trans Long Trans
P1 86000 27670 754 1858 0.175 0.234
P2 101300 47930 1150 1959 0.460 0.280
P3 104700 36240 666 1584 0.439 0.363
P4 104900 28210 617 1634 0.331 0.369
Max
Moment (kips-ft)
Shear (kips) Disp. (ft)
Trans Long Long Trans Long Trans
P1 141500 53740 1728 3403 0.699 0.647
P2 145800 56600 1413 3275 0.853 0.801
P3 140700 51320 2064 2325 0.915 1.106
P4 147300 43820 1824 2462 1.305 1.124
Expected Earthquake Maximum Credible Earthquake
Analysis…
CSEE DEPARTMENT, UNIVERSITY AT BUFFALO 24
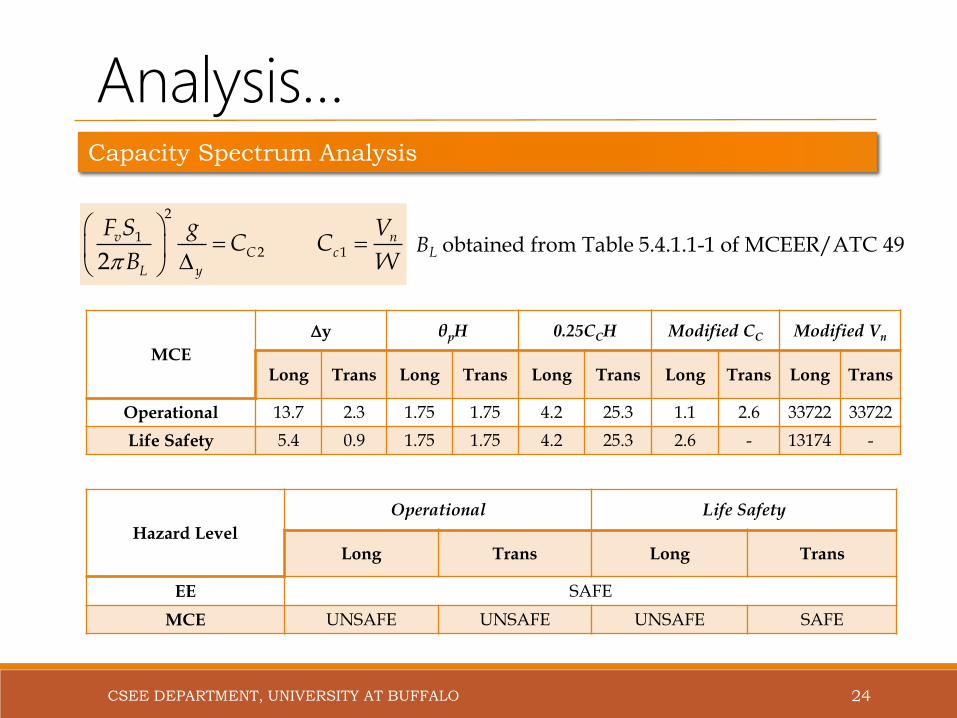
Capacity Spectrum Analysis
2
12 1
2v n
C c
L y
gF S VC C
B W
BL obtained from Table 5.4.1.1-1 of MCEER/ATC 49
MCE
y θpH 0.25CCH Modified CC Modified Vn
Long Trans Long Trans Long Trans Long Trans Long Trans
Operational 13.7 2.3 1.75 1.75 4.2 25.3 1.1 2.6 33722 33722
Life Safety 5.4 0.9 1.75 1.75 4.2 25.3 2.6 - 13174 -
Hazard Level
Operational Life Safety
Long Trans Long Trans
EE SAFE
MCE UNSAFE UNSAFE UNSAFE SAFE
Analysis Results…
CSEE DEPARTMENT, UNIVERSITY AT BUFFALO 25
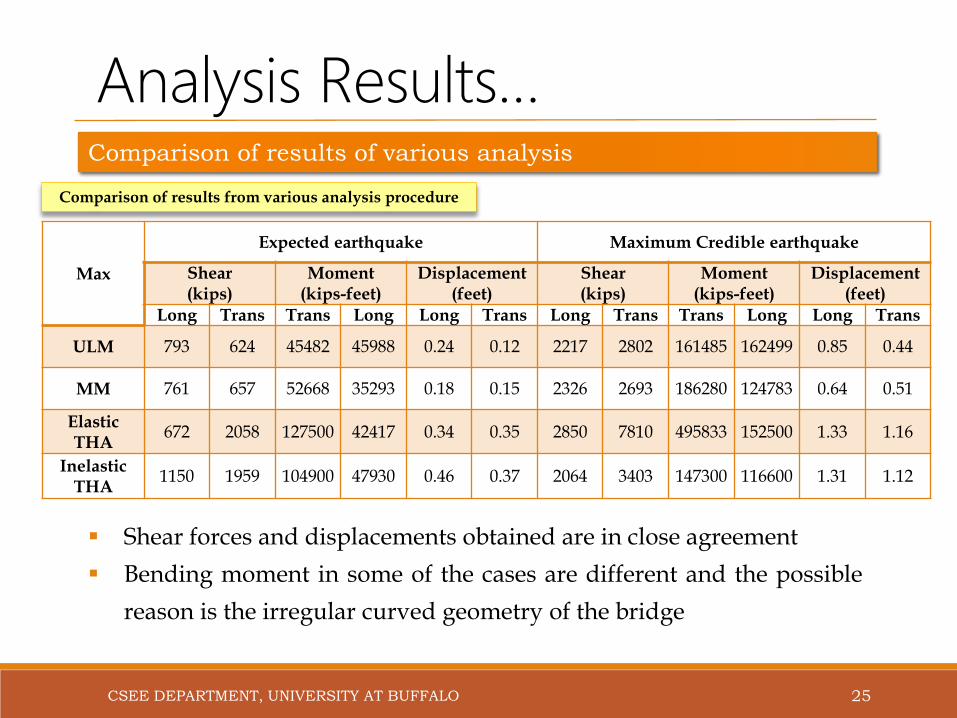
Comparison of results of various analysis
Shear forces and displacements obtained are in close agreement
Bending moment in some of the cases are different and the possible
reason is the irregular curved geometry of the bridge
Max
Expected earthquake Maximum Credible earthquake
Shear (kips)
Moment (kips-feet)
Displacement (feet)
Shear (kips)
Moment (kips-feet)
Displacement (feet)
Long Trans Trans Long Long Trans Long Trans Trans Long Long Trans
ULM 793 624 45482 45988 0.24 0.12 2217 2802 161485 162499 0.85 0.44
MM 761 657 52668 35293 0.18 0.15 2326 2693 186280 124783 0.64 0.51
Elastic THA
672 2058 127500 42417 0.34 0.35 2850 7810 495833 152500 1.33 1.16
InelasticTHA
1150 1959 104900 47930 0.46 0.37 2064 3403 147300 116600 1.31 1.12
Comparison of results from various analysis procedure
Analysis Results…
CSEE DEPARTMENT, UNIVERSITY AT BUFFALO 26
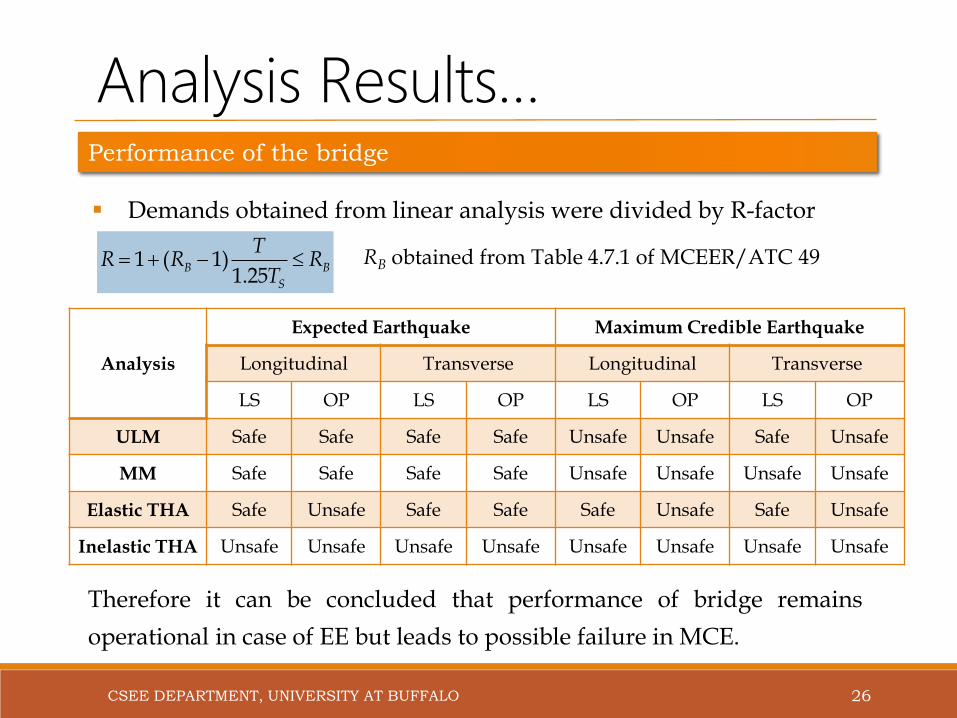
Performance of the bridge
Demands obtained from linear analysis were divided by R-factor
1 ( 1)1.25
B B
S
TR R R
T RB obtained from Table 4.7.1 of MCEER/ATC 49
Analysis
Expected Earthquake Maximum Credible Earthquake
Longitudinal Transverse Longitudinal Transverse
LS OP LS OP LS OP LS OP
ULM Safe Safe Safe Safe Unsafe Unsafe Safe Unsafe
MM Safe Safe Safe Safe Unsafe Unsafe Unsafe Unsafe
Elastic THA Safe Unsafe Safe Safe Safe Unsafe Safe Unsafe
Inelastic THA Unsafe Unsafe Unsafe Unsafe Unsafe Unsafe Unsafe Unsafe
Therefore it can be concluded that performance of bridge remains
operational in case of EE but leads to possible failure in MCE.

Recommendations
Recommendations
CSEE DEPARTMENT, UNIVERSITY AT BUFFALO 28
Recommendation for improvement of bridge performance at MCE:
Seismic isolation bearings can be used to accommodate the excess
displacement demands during high seismic event.
Sliding friction pendulum bearings can be a good alternative to those
used in the present model to ensure better performance at MCE.
Use of dampers along with the isolators can also improve the
performance of the bridge at large earthquakes.
All the piers can be converted to sliding piers to accommodate the
high displacement demands expected at MCE

Thank You

References
CSEE DEPARTMENT, UNIVERSITY AT BUFFALO 30
CSI., 2009. Integrated Software for Structural Analysis and Design, SAP 2000. CSI.
FHWA-SA-97-010. Seismic Design of Bridges, Design Example No. 5, Nine Span Viaduct Steel Girder Bridge.
BERGER/ABAM Engineers. Federal Highway Administration. 1996.
MCEER/ATC 49. Recommended LFRD Guidelines for the Seismic Design of Highway Bridges, Part I: Specifications. ATC MCEER Joint Venture. 2003
MCEER/ATC 49. Recommended LFRD Guidelines for the Seismic Design of Highway Bridges, Part II: Commentary and Appendices. ATC MCEER Joint Venture. 2003
Bruneau, M., Uang, C. M. and Sabelli, R. 2010. Ductile Design of Steel Structures. Second Edition
Lawson, R.S., Vance, V. and Krawinkler, H. 1994. Nonlinear static pushover analysis: Why, When and How?.
Proceedings of 5th US National Conference on Earthquake Engineering, July 10-14, 1994, Chicago.
Chopra, A. K. (2012). Earthquake Response of Linear Systems. Dynamics of Structures: Theory and Applications to Earthquake Engineering (). Upper Saddle River, NJ: Pearson Education Inc.
Villaverde, R., 2009. Fundamental Concepts of Earthquake Engineering.


