16

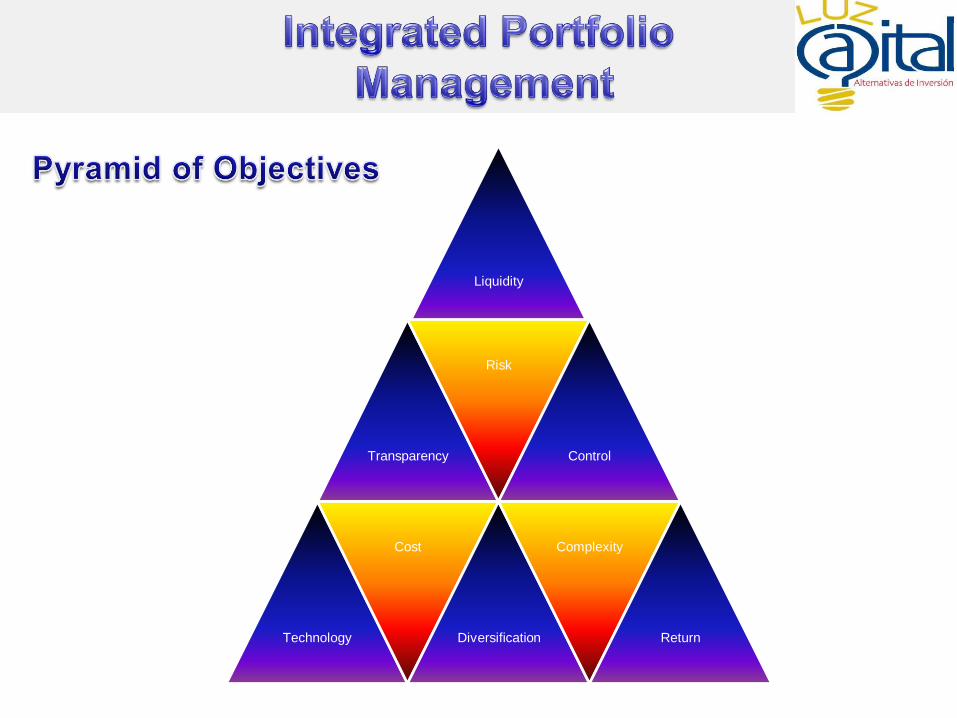
Liquidity
Transparency
Risk
Control
Technology
Cost
Diversification
Complexity
Return
The Asset Allocation Model uses modern portfolio theory and business cycle
detection to determine the major portion of the Investment Portfolio.
The Model has been backtested from January 2003 to November 2010 with daily
valuations and monthly rebalances.
The Investment Portfolio is highly diversified by type of asset (fixed income, equity,
alternative investments and commodities), currency (G10 countries proprietary
dynamic strategy and emerging markets) and geographic region (USA, Europe, Asia,
Africa, and Latin America).
The Model invests in liquid products (ETF’s and Futures).
Credit risk is minimized by taking positions in index-replicating products.
Rotation through different asset classes is governed by a proprietary business cycle
detection model.
Model determines 100% of portfolio.
Expected returns are 400 to 500 bps above 1yr Libor.
The combined backtested and virtual portfolio net return to investors is 9.51%
annually with volatility of 7.15% since January 2003.
Annual returns were always positive even though the simulation period included, the
wars in Afghanistan and Iraq and the 2007-2008 world financial crisis.

The business environment is cyclycal and is composed of four periods : Expansion,Slowdown,
Downturn and Recovery
Cycles vary in length but they usually last 44 to 60 months from begening to end.
Technology and economic changes have modified the business cycle.
In the 70’s the US economy was dominated by industrial production, currently it is more service
oriented.
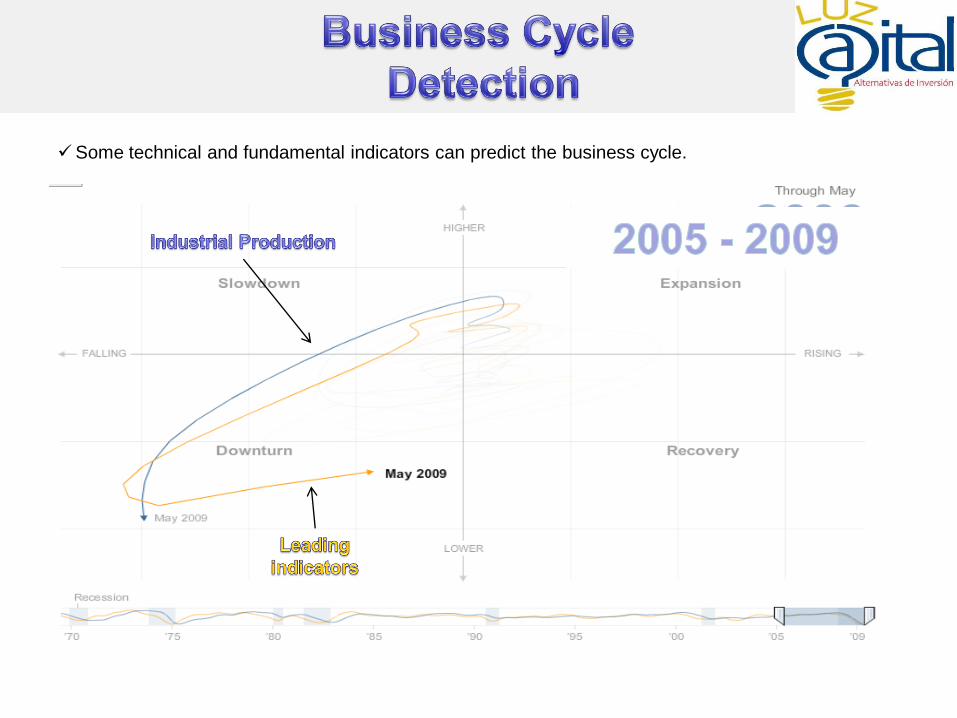
Some technical and fundamental indicators can predict the business cycle.
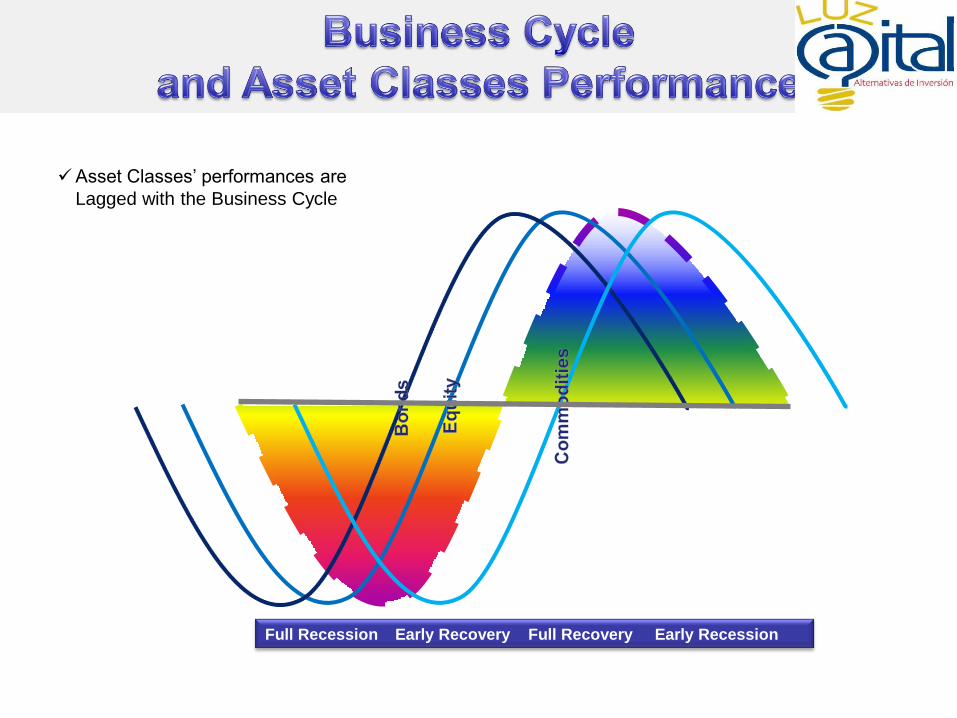
Asset Classes’ performances are
Lagged with the Business Cycle
Full Recession Early Recovery Full Recovery Early Recession

Luz Capital has developed a
proprietary business cycle
indicator
The business Cycle is partitioned
into 11 different stages.
The Indicator informs that market
data is predicting a bullish
period, only, for the Asset
Class(es) (Bonds, Equities and
Commodities) being crossed by
the radial dark blue line.
The information is used for
optimizing the asset allocation
model.
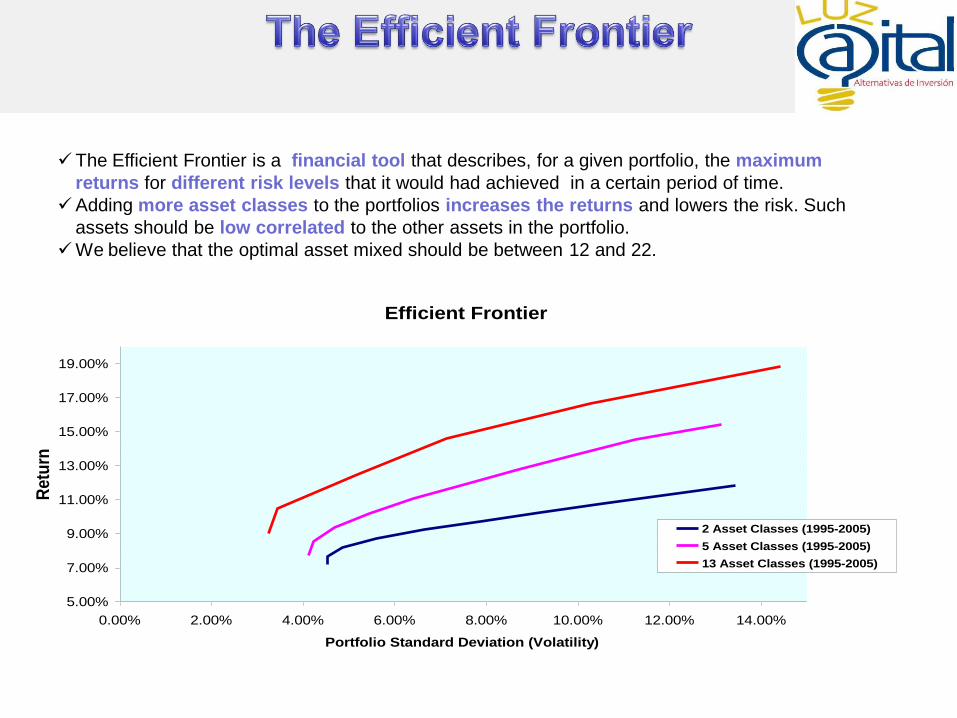
The Efficient Frontier is a financial tool that describes, for a given portfolio, the maximum
returns for different risk levels that it would had achieved in a certain period of time.
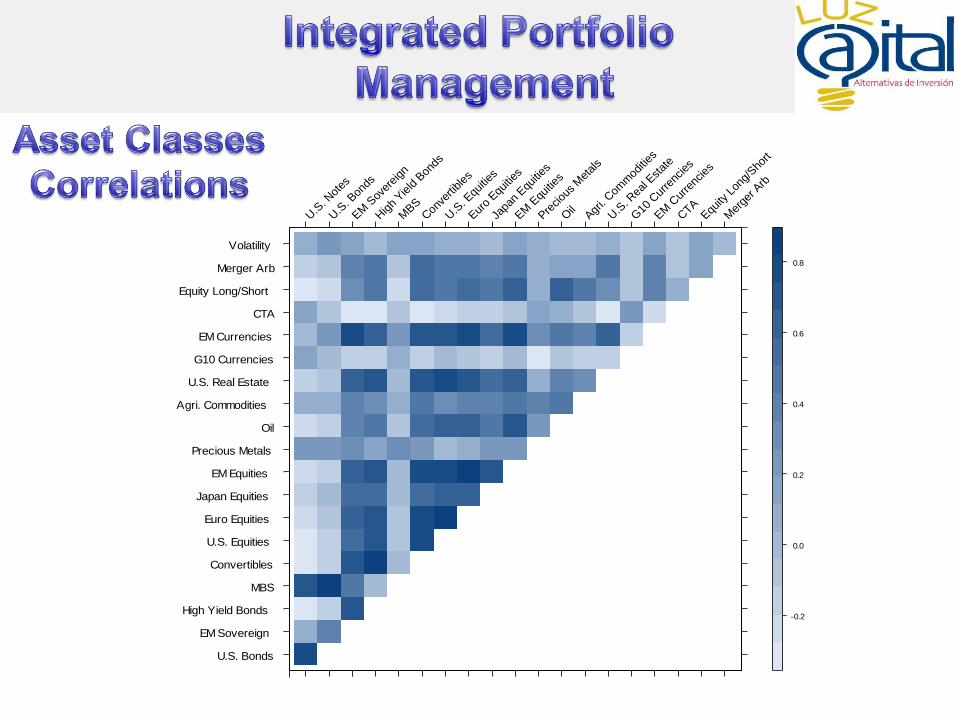
Adding more asset classes to the portfolios increases the returns and lowers the risk. Such
assets should be low correlated to the other assets in the portfolio.
We believe that the optimal asset mixed should be between 12 and 22.
Efficient Frontier
5.00%
7.00%
9.00%
11.00%
13.00%
15.00%
17.00%
19.00%
0.00% 2.00% 4.00% 6.00% 8.00% 10.00% 12.00% 14.00%
Portfolio Standard Deviation (Volatility)
Retu
rn
2 Asset Classes (1995-2005)
5 Asset Classes (1995-2005)
13 Asset Classes (1995-2005)
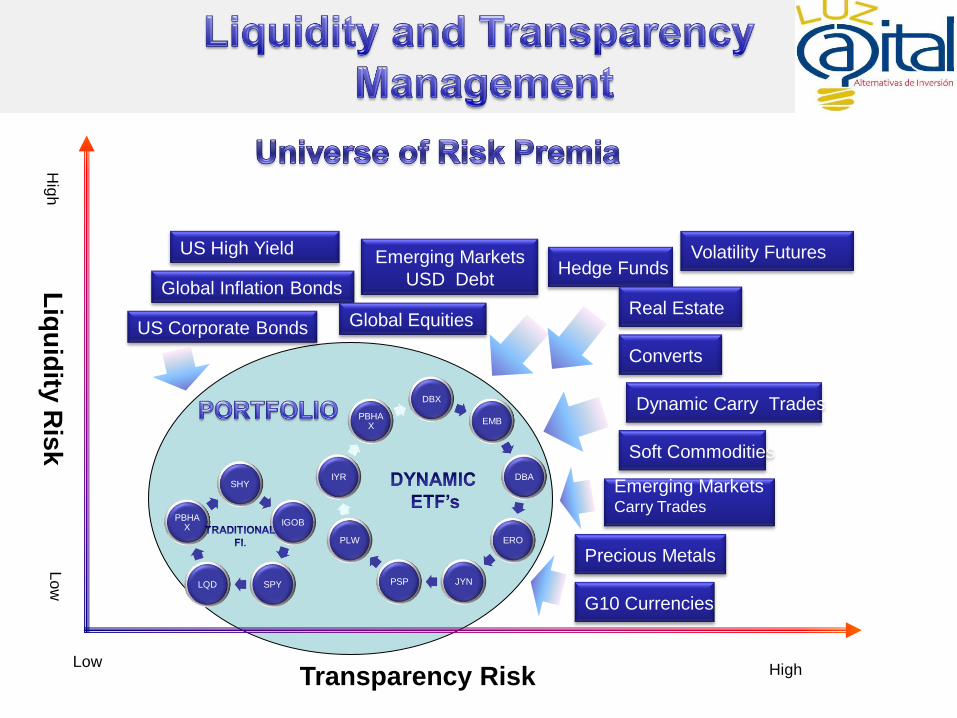
Hig
h
Low
Liq
uid
ity R
isk
Transparency Risk
Lo
w
High
DBX
EMB
DBA
ERO
JYNPSP
PLW
IYR
PBHAX
Emerging MarketsCarry Trades
US Corporate Bonds
G10 Currencies
Emerging Markets
USD Debt
SHY
IGOB
SPYLQD
PBHAX
Converts
Dynamic Carry Trades
Global Inflation Bonds
Soft Commodities
Hedge FundsUS High Yield
Precious Metals
Global EquitiesReal Estate
Volatility Futures
Efficient Frontier
5.00%
7.00%
9.00%
11.00%
13.00%
15.00%
17.00%
19.00%
0.00% 2.00% 4.00% 6.00% 8.00% 10.00% 12.00% 14.00%
Portfolio Standard Deviation (Volatility)
Re
tu
rn
2 Asset Classes (1995-2005)
5 Asset Classes (1995-2005)
13 Asset Classes (1995-2005)
U.S. Bonds
EM Sovereign
High Yield Bonds
MBS
Convertibles
U.S. Equities
Euro Equities
Japan Equities
EM Equities
Precious Metals
Oil
Agri. Commodities
U.S. Real Estate
G10 Currencies
EM Currencies
CTA
Equity Long/Short
Merger Arb
Volatility
U.S
. Not
es
U.S
. Bon
ds
EM S
over
eign
Hig
h Yie
ld B
onds
MBS
Con
verti
bles
U.S
. Equ
ities
Euro
Equities
Japa
n Equ
ities
EM E
quities
Preciou
s M
etal
s
Oil
Agri.
Com
mod
ities
U.S
. Rea
l Est
ate
G10
Cur
renc
ies
EM C
urre
ncie
s
CTA
Equity
Lon
g/Sho
rt
Mer
ger A
rb
-0.2
0.0
0.2
0.4
0.6
0.8

12/31/1994 12/23/1998 12/15/2002 12/7/2006 11/30/2010
Date
0%
20%
40%
60%
80%
100%
Allo
ca
tion
U.S..Notes
U.S..Bonds
EM.Sovereign
High.Yield.Bonds
MBS
Convertibles
U.S..Equities
Euro.Equities
Japan.Equities
EM.Equities
Precious.Metals
Oil
Agri..Commodities
U.S..Real.Estate
G10.Currencies
EM.Currencies
CTA
Equity.Long.Short
Merger.Arb
Volatility
12/31/2002 1/22/2005 2/14/2007 3/8/2009 3/31/2011
Date
0%
20%
40%
60%
80%
100%
Allo
catio
n

Monthly Returns
Jan Feb Mar Apr May Jun Jul Aug Sep Oct Nov Dec Year
2 0 0 3 0 .3 9 % 1.77% ( 0 .6 2 ) % 1.73 % 3 .59 % 0 .16 % ( 1.2 7) % 2 .53 % 1.58 % 1.9 8 % 1.2 6 % 1.18 % 15.13 %
2 0 0 4 1.15% 1.13 % 0 .9 7% ( 5.57) % ( 1.12 ) % 1.0 5% ( 0 .2 8 ) % 1.4 2 % 1.0 2 % 1.3 2 % 0 .0 5% 1.9 4 % 2 .8 9 %
2 0 0 5 0 .9 6 % 0 .11% ( 1.3 3 ) % 0 .4 2 % 1.0 9 % 1.55% ( 0 .4 7) % 0 .71% ( 0 .17) % ( 1.12 ) % 1.8 8 % 1.6 0 % 5.3 0 %
2 0 0 6 0 .3 9 % 0 .4 9 % 0 .4 5% 1.9 6 % ( 0 .8 9 ) % ( 0 .59 ) % 1.51% 1.77% 0 .3 7% 1.8 8 % 2 .14 % 0 .2 9 % 10 .15%
2 0 0 7 0 .8 4 % ( 0 .4 6 ) % 0 .15% 1.4 7% 0 .6 5% 0 .3 1% 1.8 0 % ( 0 .0 9 ) % 3 .2 2 % 2 .8 3 % ( 0 .4 0 ) % 0 .6 5% 11.4 5%
2 0 0 8 ( 1.52 ) % 3 .11% ( 1.73 ) % ( 0 .0 3 ) % 0 .59 % ( 0 .8 1) % ( 0 .8 4 ) % 0 .2 6 % ( 3 .3 3 ) % ( 4 .4 8 ) % 6 .18 % 6 .8 5% 3 .6 8 %
2 0 0 9 ( 4 .3 4 ) % ( 1.3 4 ) % 1.8 2 % 1.4 8 % 5.6 4 % ( 0 .2 6 ) % 4 .2 3 % 1.6 7% 3 .57% ( 0 .0 5) % 3 .8 3 % 0 .4 6 % 17.58 %
2010 ( 1.3 3 ) % 1.9 3 % 3 .70 % 1.73 % ( 5.3 6 ) % ( 0 .3 7) % 2 .4 0 % 0 .13 % 4 .0 8 % 2 .2 7% ( 0 .11) % 1.6 1% 10 .8 3 %
2011 ( 0 .2 3 ) % 1.4 6 % 0 .15% # # # # # # # # # # # # # # # # # # # # # # # # # # # # # # # # # # # # # # # # # # # # # # # # # # # # # # 1.3 9 %
0%
5%
10%
15%
20%
25%
Histogram of Monthly Returns

0.00%
2.00%
4.00%
6.00%
8.00%
10.00%
12.00%
14.00%
16.00%
18.00%
20.00%
Annual Returns
Summa ry Da ta
M o del
C o nserv
at ive
SP X
Index
7-10 Year
B o nd
Index
9.39% 5.10% 4.96%
7.05% 14.99% 7.02%
0.62 0.01 (0.01)
4.94% 8.13% 4.72%
0.89 0.01 (0.01)
69.70% 63.64% 60.61%
30.30% 36.36% 38.38%
1.69% 2.94% 1.61%
(1.35)% (3.74)% (1.43)%
6.85% 9.39% 8.15%
(5.57)% (16.94)% (5.56)%
(10.01)% (52.56)% (6.45)%
8 16 6
2 - - 12
Be nc hma rk Compa risons
SP X
Index
7-10 Year
B o nd
Index
7.21% 9.17%
Beta in Up Markets 0.29 0.30
Correlation in Up Markets 43.60% 22.35%
Alpha in Down Markets 7.25% 7.19%
Beta in Down Markets 0.26 0.37
Correlation in Down Markets 41.01% 25.31%
7.88% 7.69%
0.269 0.359
57.18% 35.68%
Beta in All Markets
Correlation in All Markets
Maximum Drawdown
Months In Maximum Drawdown
Months To Recover
Alpha in Up Markets
Alpha in All Markets
% of Positive Months
% of Negative Months
Average Loss
Best Month
Worst Month
Average Gain
Std. Deviation
Sharpe Ratio (5.0%)
Downside Deviation
Sortino Ratio (5.0%)
Compound ROR
$800
$1,000
$1,200
$1,400
$1,600
$1,800
$2,000
$2,200
Growth of $1,000
Conservative SPX Index 7-10 year Bond


12%
8%
34%
8%
38%
Positions by World Region
EMERGING MARKETS
EUROPE
GLOBAL
JAPAN
USA
23%
9%
17%19%
23%
5%2% 2%
Portfolio By Type of Market Risk
ALTERNATIVE
COMMODITY
CURRENCY
EQUITY
FIXED INCOME
MONEY MARKET


