63
First half results 2015 Presentation for investors and analysts 24 th July 2015
| Date post: | 22-Mar-2018 |
| Category: |
Documents |
| Upload: | hoangtuyen |
| View: | 219 times |
| Download: | 0 times |

First half results 2015Presentation for investors and analysts
24th July 2015
2
Contents
1 Key highlights
2 Consolidated financial information
34
Financial supplement
Schedule and contacts

3
Key highlights1
Million euros
Business growth, bolstered by the favourable performance of financial income
Note: Earnings per share calculated using 3,079,553,273 shares
Revenues 14,518.7 5.8%
Premiums 12,175.2 3.3%
Managed savings 37,717.8 1.7%
Non-life combined ratio 99.1% 3.4 p.p.
ROE 8.2% -1.5 p.p.
Shareholders' equity per share 2.83 2.5%Attributable result 315.6 -31.0%Earnings per share (euros) 0.10 -31.0%
(*) The variations with respect to the previous year do not reflect the impact of the restatement of CatalunyaCaixa’s business as a discontinued operation
4
1 Key highlights
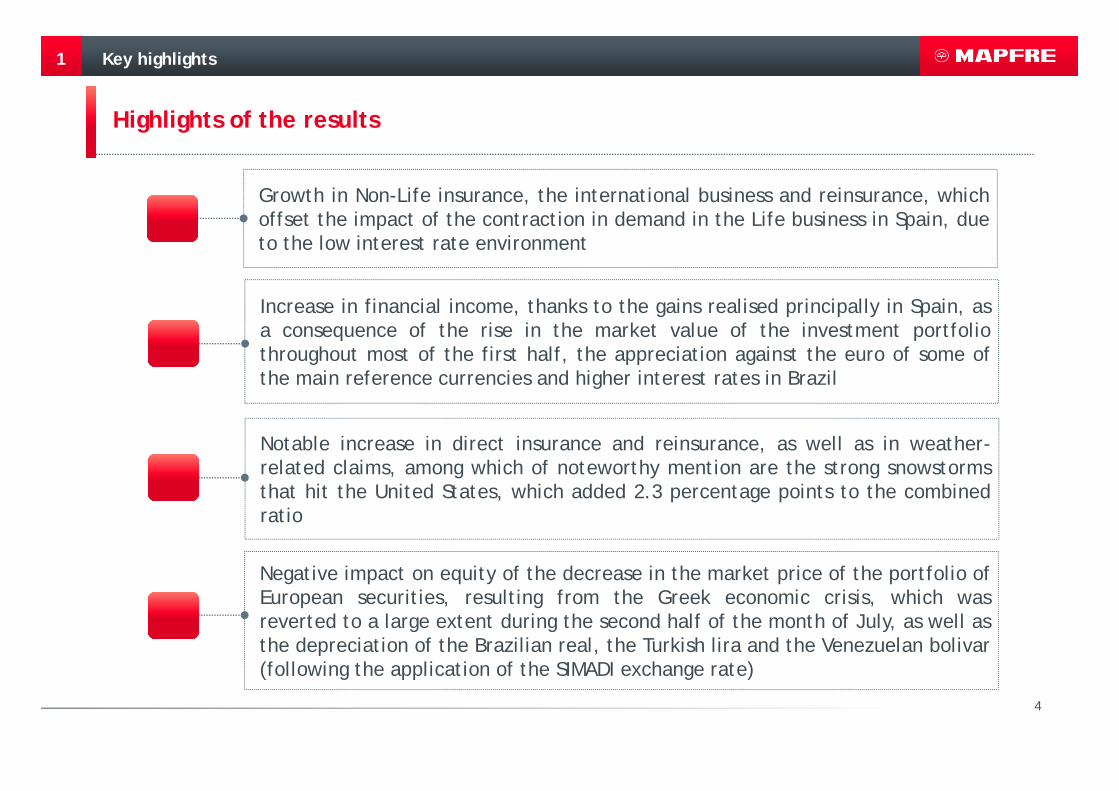
Highlights of the results
Growth in Non-Life insurance, the international business and reinsurance, whichoffset the impact of the contraction in demand in the Life business in Spain, dueto the low interest rate environment
Negative impact on equity of the decrease in the market price of the portfolio ofEuropean securities, resulting from the Greek economic crisis, which wasreverted to a large extent during the second half of the month of July, as well asthe depreciation of the Brazilian real, the Turkish lira and the Venezuelan bolivar(following the application of the SIMADI exchange rate)
Notable increase in direct insurance and reinsurance, as well as in weather-related claims, among which of noteworthy mention are the strong snowstormsthat hit the United States, which added 2.3 percentage points to the combinedratio
Increase in financial income, thanks to the gains realised principally in Spain, asa consequence of the rise in the market value of the investment portfoliothroughout most of the first half, the appreciation against the euro of some ofthe main reference currencies and higher interest rates in Brazil
5
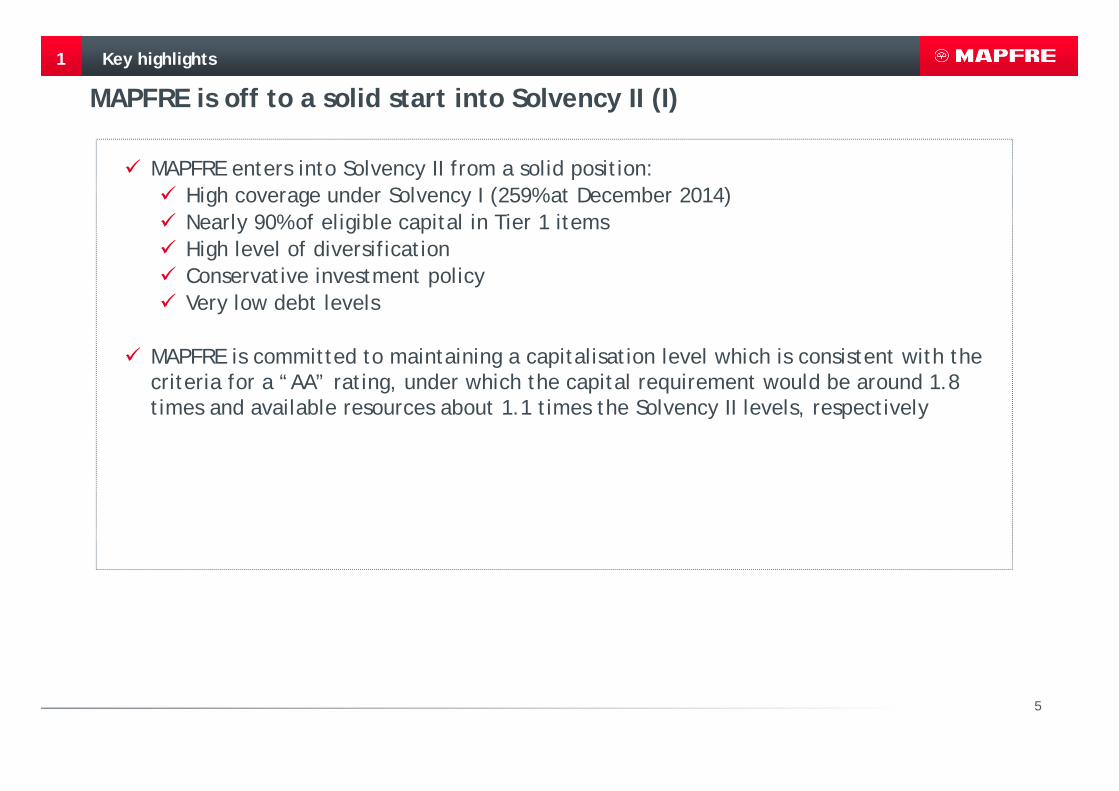
MAPFRE enters into Solvency II from a solid position:High coverage under Solvency I (259% at December 2014)Nearly 90% of eligible capital in Tier 1 itemsHigh level of diversificationConservative investment policyVery low debt levels
MAPFRE is committed to maintaining a capitalisation level which is consistent with the criteria for a “AA” rating, under which the capital requirement would be around 1.8 times and available resources about 1.1 times the Solvency II levels, respectively
Key highlights1
MAPFRE is off to a solid start into Solvency II (I)

6
According to the standard formula, MAPFRE’s capital ratio under Solvency II exceeds 160% as at 31.12.14
These levels are achieved under the following main caveats:Current interpretation of the standard formula regulationApplication of the matching adjustment and transitional rules on technical reserves to the Life portfolio in Spain Grandfathering of the Tier II subordinated debt issued in 2007
1 Key highlights
MAPFRE is off to a solid start into Solvency II (II) …
7
1
source: ICEA / UNESPA
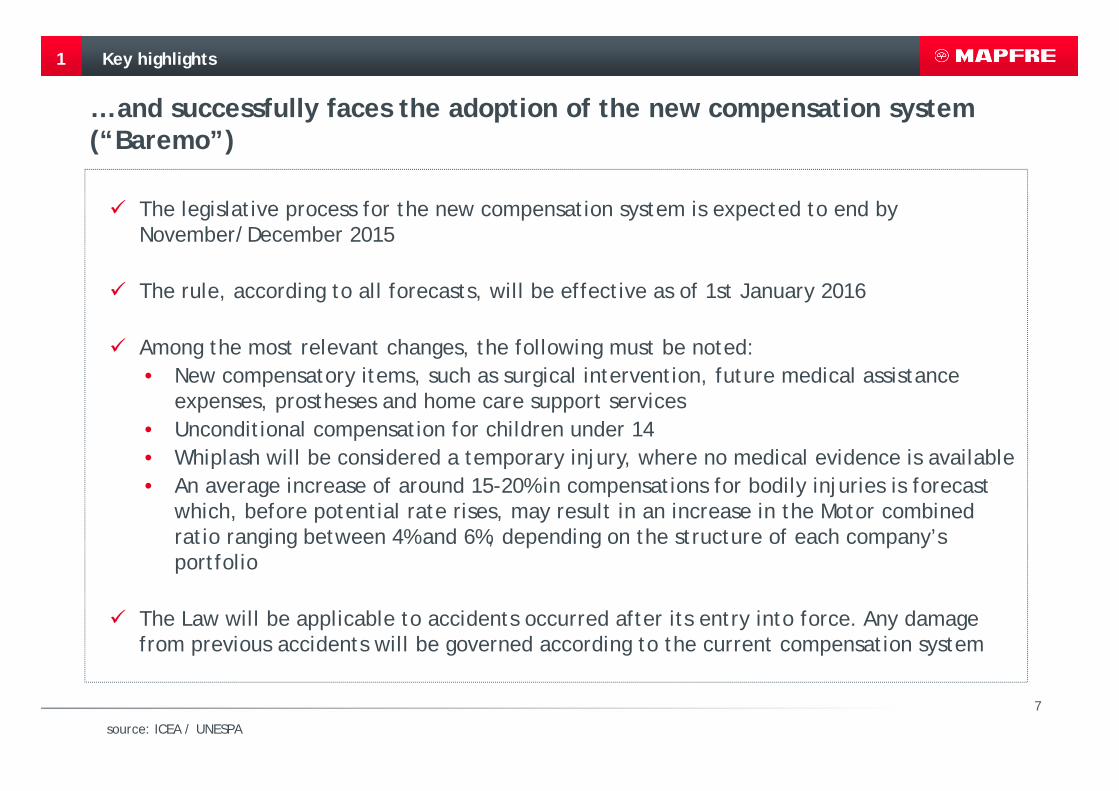
The legislative process for the new compensation system is expected to end by November/December 2015
The rule, according to all forecasts, will be effective as of 1st January 2016
Among the most relevant changes, the following must be noted:• New compensatory items, such as surgical intervention, future medical assistance
expenses, prostheses and home care support services• Unconditional compensation for children under 14 • Whiplash will be considered a temporary injury, where no medical evidence is available• An average increase of around 15-20% in compensations for bodily injuries is forecast
which, before potential rate rises, may result in an increase in the Motor combined ratio ranging between 4% and 6%, depending on the structure of each company’s portfolio
The Law will be applicable to accidents occurred after its entry into force. Any damage from previous accidents will be governed according to the current compensation system
… and successfully faces the adoption of the new compensation system (“Baremo”)
Key highlights
8
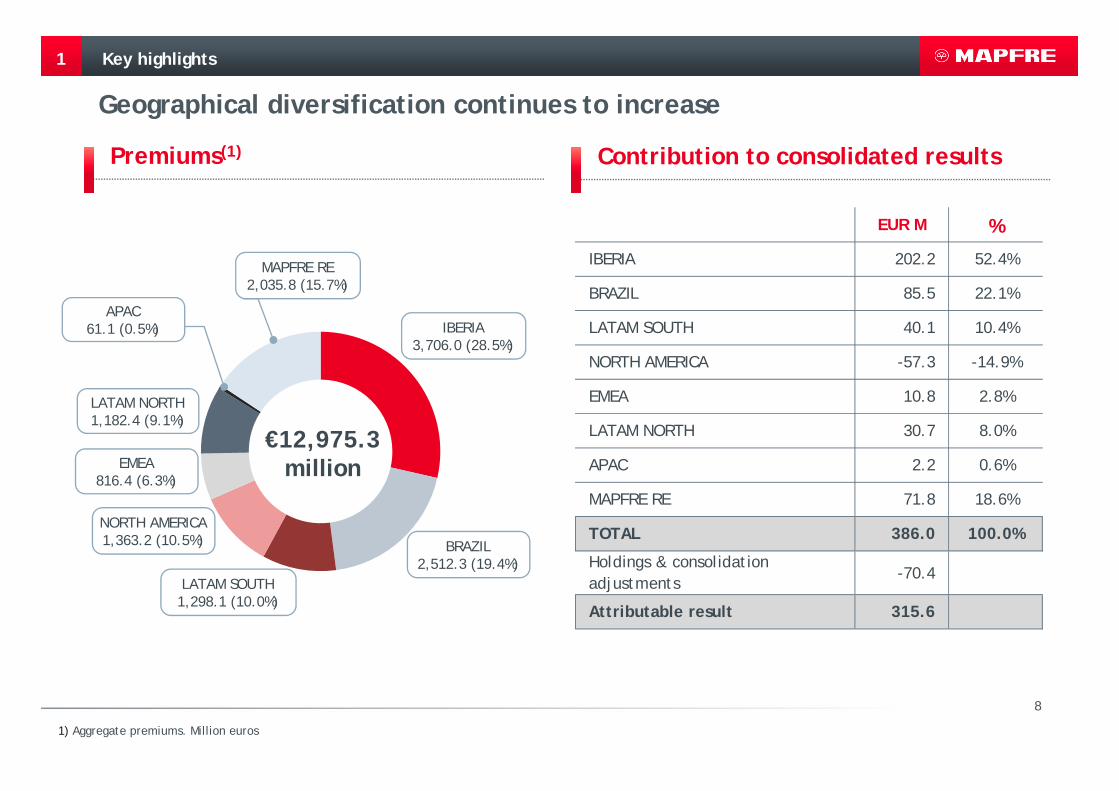
Geographical diversification continues to increase
1
Premiums(1) Contribution to consolidated results
1) Aggregate premiums. Million euros
BRAZIL2,512.3 (19.4%)
IBERIA3,706.0 (28.5%)
NORTH AMERICA1,363.2 (10.5%)
€12,975.3million
LATAM SOUTH1,298.1 (10.0%)
EMEA816.4 (6.3%)
APAC61.1 (0.5%)
LATAM NORTH1,182.4 (9.1%)
MAPFRE RE2,035.8 (15.7%)
Key highlights
EUR M %
IBERIA 202.2 52.4%
BRAZIL 85.5 22.1%
LATAM SOUTH 40.1 10.4%
NORTH AMERICA -57.3 -14.9%
EMEA 10.8 2.8%
LATAM NORTH 30.7 8.0%
APAC 2.2 0.6%
MAPFRE RE 71.8 18.6%
TOTAL 386.0 100.0%
Holdings & consolidation adjustments
-70.4
Attributable result 315.6
9
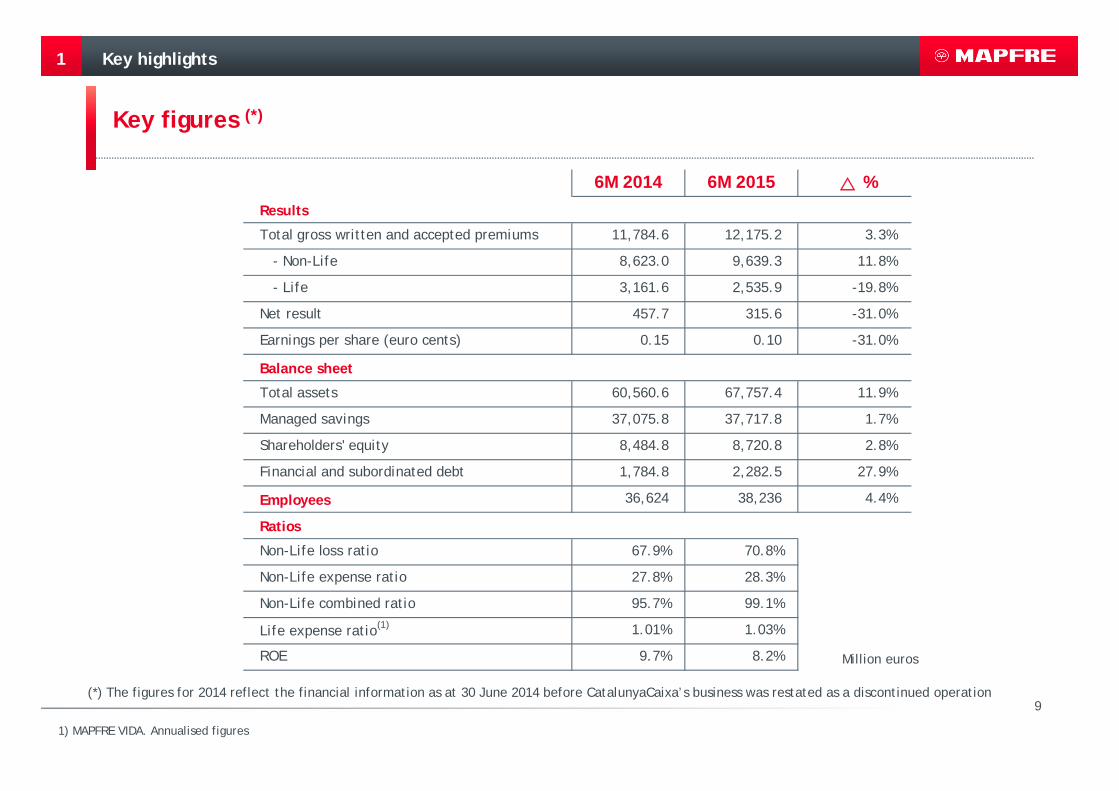
Key figures (*)
1
Million euros
Key highlights
1) MAPFRE VIDA. Annualised figures
6M 2014 6M 2015 %
Results
Total gross written and accepted premiums 11,784.6 12,175.2 3.3%
- Non-Life 8,623.0 9,639.3 11.8%
- Life 3,161.6 2,535.9 -19.8%
Net result 457.7 315.6 -31.0%
Earnings per share (euro cents) 0.15 0.10 -31.0%
Balance sheet
Total assets 60,560.6 67,757.4 11.9%
Managed savings 37,075.8 37,717.8 1.7%
Shareholders' equity 8,484.8 8,720.8 2.8%
Financial and subordinated debt 1,784.8 2,282.5 27.9%
Employees 36,624 38,236 4.4%
Ratios
Non-Life loss ratio 67.9% 70.8%
Non-Life expense ratio 27.8% 28.3%
Non-Life combined ratio 95.7% 99.1%
Life expense ratio(1) 1.01% 1.03%
ROE 9.7% 8.2%
(*) The figures for 2014 reflect the financial information as at 30 June 2014 before CatalunyaCaixa’s business was restated as a discontinued operation
10
Contents
1 Key highlights
2 Consolidated financial information
34
Financial supplement
Schedule and contacts

11
Consolidated financial information
Consolidated income statement 2
Million euros
1) Ratios as a % of net premiums earned
6M 2014 (*) 6M 2015 %NON-LIFE INSURANCE AND REINSURANCEGross written and accepted premiums 8,623.0 9,639.3 11.8%
Premiums earned, net of ceded and retroceded reinsurance 6,416.3 7,045.9 9.8%
Net claims incurred and variation in other technical provisions -4,354.8 -4,988.6 14.6%
Operating expenses, net of reinsurance -1,763.1 -1,975.1 12.0%
Other technical income and expenses -21.6 -20.0 -7.4%
Technical Result 276.8 62.2 -77.5%Net fin'l. income and other non-technical income and expenses 368.9 458.8 24.4%
Result of Non-life business 645.7 521.0 -19.3%LIFE ASSURANCE AND REINSURANCEGross written and accepted premiums 3,161.6 2,535.9 -19.8%
Premiums earned, net of ceded and retroceded reinsurance 2,727.5 2,179.9 -20.1%
Net claims incurred and variation in other technical provisions -2,530.0 -1,927.1 -23.8%
Operating expenses, net of reinsurance -541.0 -575.7 6.4%
Other technical income and expenses -8.5 -5.6 -34.1%
Technical Result -352.0 -328.5 -6.7%Net fin'l. income and other non-technical income and expenses 668.1 653.3 -2.2%
Unrealised gains and losses in Unit-Linked products 57.7 45.0 -22.0%
Result of Life business 373.8 369.8 -1.1%OTHER BUSINESS ACTIVITIESOperating income 276.3 237.9 -13.9%
Operating expenses -274.2 -266.8 -2.7%
Other income and expenses -34.3 -18.4 -46.4%
Results from other business activities -32.2 -47.3 46.9%Result on restatement of financial accounts -45.4 -29.1 -35.9%
Result before tax and minority interests 941.9 814.4 -13.5%Taxes -268.7 -272.8 1.5%
Result after tax 673.2 541.6 -19.5%Result after tax from discontinued operations -0.5 31.7 ---
Result for the year 672.7 573.3 -14.8%Result attributable to minority shareholders -215.0 -257.7 19.9%
Result attributable to the controlling Company 457.7 315.6 -31.0%
Non-life loss ratio(1) 67.9% 70.8%
Non-life expense ratio(1) 27.8% 28.3%
Non-life combined ratio(1) 95.7% 99.1%
(*) The figures for 2014 reflect the financial information as at 30 June 2014 before CatalunyaCaixa’s business was restated as a discontinued operation
12
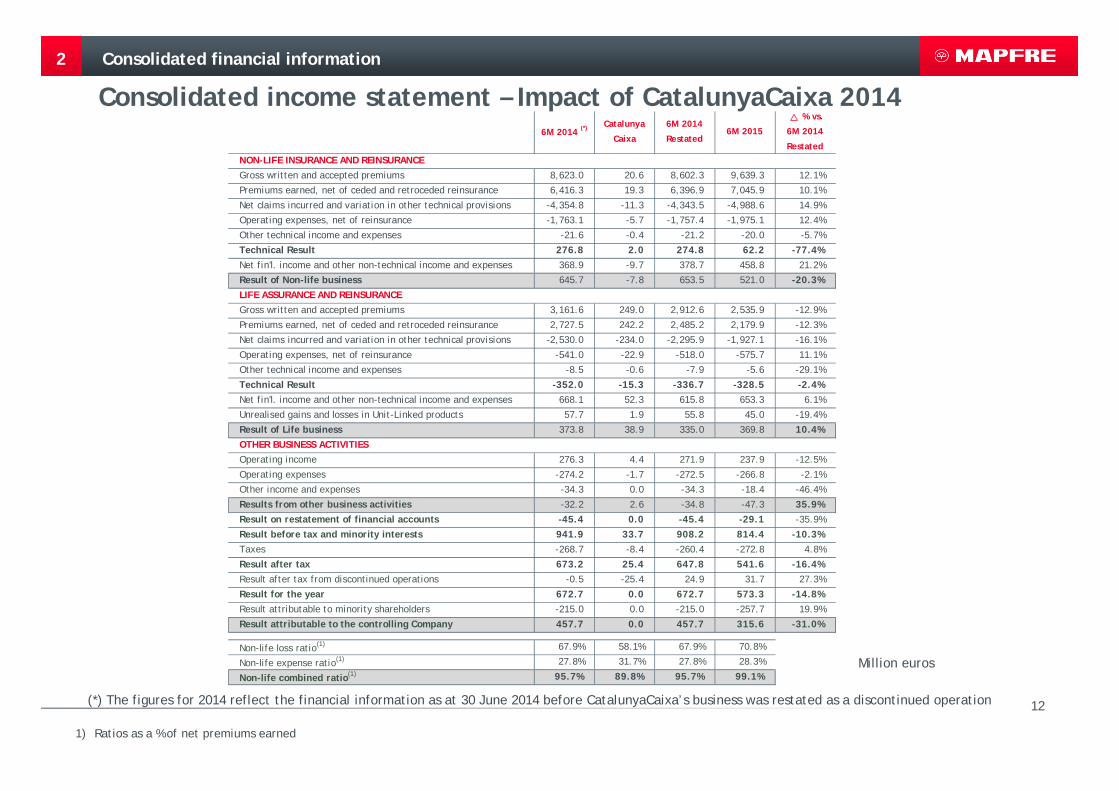
Consolidated income statement – Impact of CatalunyaCaixa 20142 Consolidated financial information
1) Ratios as a % of net premiums earned
Million euros
6M 2014 (*) Catalunya
Caixa
6M 2014
Restated6M 2015
% vs.
6M 2014
Restated
NON-LIFE INSURANCE AND REINSURANCEGross written and accepted premiums 8,623.0 20.6 8,602.3 9,639.3 12.1%
Premiums earned, net of ceded and retroceded reinsurance 6,416.3 19.3 6,396.9 7,045.9 10.1%
Net claims incurred and variation in other technical provisions -4,354.8 -11.3 -4,343.5 -4,988.6 14.9%
Operating expenses, net of reinsurance -1,763.1 -5.7 -1,757.4 -1,975.1 12.4%
Other technical income and expenses -21.6 -0.4 -21.2 -20.0 -5.7%
Technical Result 276.8 2.0 274.8 62.2 -77.4%Net fin'l. income and other non-technical income and expenses 368.9 -9.7 378.7 458.8 21.2%
Result of Non-life business 645.7 -7.8 653.5 521.0 -20.3%LIFE ASSURANCE AND REINSURANCEGross written and accepted premiums 3,161.6 249.0 2,912.6 2,535.9 -12.9%
Premiums earned, net of ceded and retroceded reinsurance 2,727.5 242.2 2,485.2 2,179.9 -12.3%
Net claims incurred and variation in other technical provisions -2,530.0 -234.0 -2,295.9 -1,927.1 -16.1%
Operating expenses, net of reinsurance -541.0 -22.9 -518.0 -575.7 11.1%
Other technical income and expenses -8.5 -0.6 -7.9 -5.6 -29.1%
Technical Result -352.0 -15.3 -336.7 -328.5 -2.4%Net fin'l. income and other non-technical income and expenses 668.1 52.3 615.8 653.3 6.1%
Unrealised gains and losses in Unit-Linked products 57.7 1.9 55.8 45.0 -19.4%
Result of Life business 373.8 38.9 335.0 369.8 10.4%OTHER BUSINESS ACTIVITIESOperating income 276.3 4.4 271.9 237.9 -12.5%
Operating expenses -274.2 -1.7 -272.5 -266.8 -2.1%
Other income and expenses -34.3 0.0 -34.3 -18.4 -46.4%
Results from other business activities -32.2 2.6 -34.8 -47.3 35.9%Result on restatement of financial accounts -45.4 0.0 -45.4 -29.1 -35.9%
Result before tax and minority interests 941.9 33.7 908.2 814.4 -10.3%Taxes -268.7 -8.4 -260.4 -272.8 4.8%
Result after tax 673.2 25.4 647.8 541.6 -16.4%Result after tax from discontinued operations -0.5 -25.4 24.9 31.7 27.3%
Result for the year 672.7 0.0 672.7 573.3 -14.8%Result attributable to minority shareholders -215.0 0.0 -215.0 -257.7 19.9%
Result attributable to the controlling Company 457.7 0.0 457.7 315.6 -31.0%
Non-life loss ratio(1) 67.9% 58.1% 67.9% 70.8%
Non-life expense ratio(1) 27.8% 31.7% 27.8% 28.3%
Non-life combined ratio(1) 95.7% 89.8% 95.7% 99.1%
(*) The figures for 2014 reflect the financial information as at 30 June 2014 before CatalunyaCaixa’s business was restated as a discontinued operation
13
Consolidated financial information
Development of Non-Life insurance results
2
Non-Life Account (*)
1) Ratios as a % of net premiums earned
Million euros
6M 2014 6M 2015 %
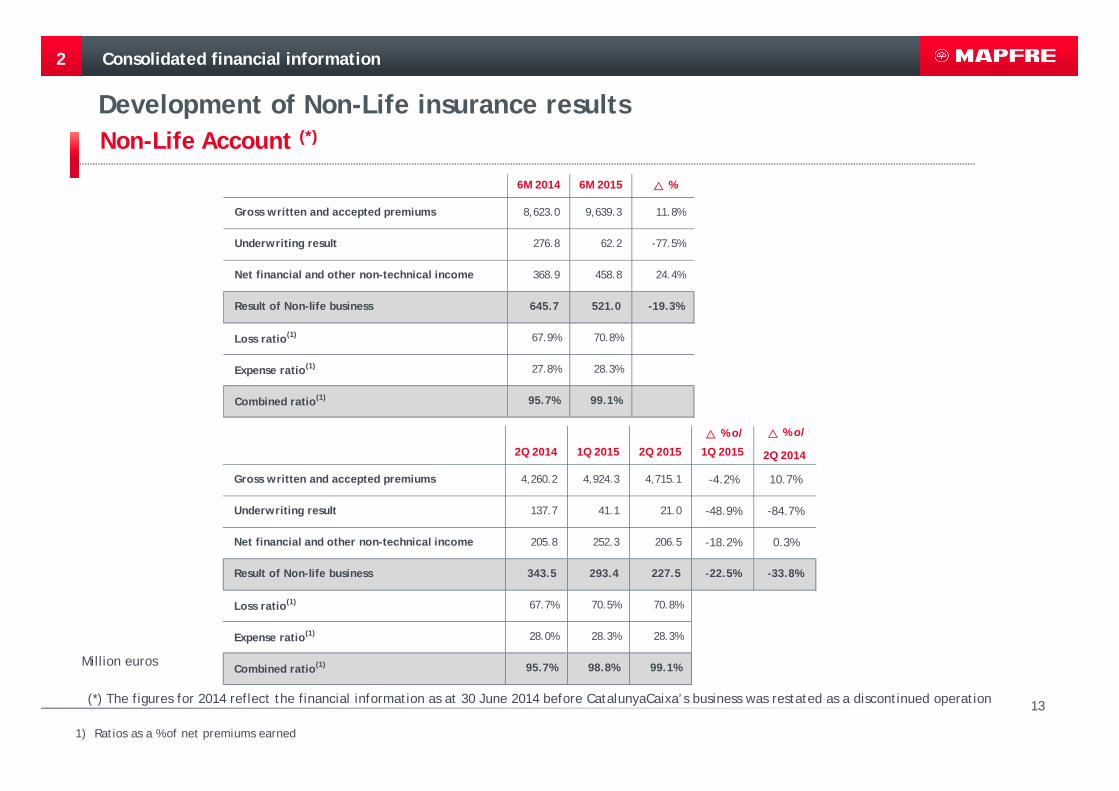
Gross written and accepted premiums 8,623.0 9,639.3 11.8%
Underwriting result 276.8 62.2 -77.5%
Net financial and other non-technical income 368.9 458.8 24.4%
Result of Non-life business 645.7 521.0 -19.3%
Loss ratio(1) 67.9% 70.8%
Expense ratio(1) 27.8% 28.3%
Combined ratio(1) 95.7% 99.1%
% o/ % o/
2Q 2014 1Q 2015 2Q 2015 1Q 2015 2Q 2014
Gross written and accepted premiums 4,260.2 4,924.3 4,715.1 -4.2% 10.7%
Underwriting result 137.7 41.1 21.0 -48.9% -84.7%
Net financial and other non-technical income 205.8 252.3 206.5 -18.2% 0.3%
Result of Non-life business 343.5 293.4 227.5 -22.5% -33.8%
Loss ratio(1) 67.7% 70.5% 70.8%
Expense ratio(1) 28.0% 28.3% 28.3%
Combined ratio(1) 95.7% 98.8% 99.1%
(*) The figures for 2014 reflect the financial information as at 30 June 2014 before CatalunyaCaixa’s business was restated as a discontinued operation

14
Consolidated financial information
Development of Non-Life insurance results: key highlights
2
Premiums
The 11.8% increase in business volumes (+€1,016 million) with respect to the first half of previous year reflects:
• the appreciation of the US dollar, which had a positive impact on business growth in NORTH AMERICA, MAPFRE ASISTENCIA, MAPFRE RE and MAPFRE GLOBAL RISKS
• the increase in issuance in LATAM NORTH (+€480 million), both in the Industrial Risks and Transport segments, thanks to the winning of the PEMEX policy (+€387 million) and the overall good performance of Non-Life businesses
• the growth in NORTH AMERICA (+€343 million), as a result of the good development of the Motor, Home and Assistance businesses, as well as the gradual contribution of the business coming from Middle Oak
• the growth in EMEA (+€162 million), thanks to the insurance and Assistance businesses in Turkey, the consolidation of Direct Line (+€58.3 million) and the Assistance and Global Risks businesses in the United Kingdom
• the slight increase in IBERIA (+€43 million), mainly stemming from Health and Burial businesses
• the decrease in Brazil (-€137 million), especially due to the contraction in the issuance of Agricultural insurance and the depreciation of the Brazilian real, which were partly offset by the growth in Motor and Assistance businesses
• the contraction in LATAM SOUTH (-€58 million), as a result of the application of the SIMADI exchange rate in Venezuela, which was partly made up for primarily by the good performance of the Motor and Mass Market Multi-Peril lines in Peru, Chile and Argentina

15
In the second quarter, the 4.2% decrease in business volumes with respect to the first quarter of 2015 reflects the following variations:
• the increase in issuance in LATAM NORTH (+€383 million), thanks to the winning of the PEMEX policy (+€387 million)
• the good performance in NORTH AMERICA (+€99 million), thanks to the impact of the appreciation of the US dollar and the good development of the Assistance business
• the increase in Brazil (+€76 million) due to a slight improvement in the Agricultural line and the Global Risks business
• the improvement in EMEA (+€53 million), which reflects the consolidation of Direct Line’s businesses in Italy and Germany since the 1st of June (+€58.3 million), as well as the good performance of the Assistance business
• the contraction in LATAM SOUTH (-€334 million), especially as a result of the application of the SIMADI exchange rate in Venezuela since 31st March 2015
• the decline in IBERIA (-€642 million), mainly due to the impact of seasonality in the Health, Burial and Commercial insurance businesses
2 Consolidated financial information
Development of Non-Life insurance results: key highlights
Premiums
16
Year-on-year increase of 2.9 percentage points, which reflects:an exceptional claims volume in NORTH AMERICA due to the strong snowstorms that hit the USA, which affected Home and Motor lines. Only this effect added 2.3 percentage points to the Group’s consolidated combined ratioin IBERIA, the increase in Burial technical reserves, resulting from the application of lower discount rates, and the higher frequency in the Motor linein Turkey, as a result of weather-related claims, which affected the Agricultural and Home segments, as well as a higher loss experience in the Motor and Health lines
Growth of 0.6 percentage points with respect to the previous quarter, mainly due to:the upturn in frequency in Spain in Home insurance lines, due to the occurrence of severe weather-related events, and in the TPL segmentat MAPFRE RE, stemming from the increase in weather-related claims, as well as a higher claims frequency
These increases were offset by improvements in:LATAM SOUTH, in comparison to 2014, which was negatively affected by the earthquake in Iquique in the direct insurance business and at MAPFRE GLOBAL RISKS
2
Loss experience
Consolidated financial information
Development of Non-Life insurance results: key highlights

17
2
Expense ratio Year-on-year increase of 0.5 percentage points, mainly due to:higher acquisition costs in Argentina, Chile, Spain and Perulower recoveries of ceded reinsurance commissions in the USA
Consolidated financial information
Development of Non-Life insurance results: key highlights
18
2
Net financial and other non-technical income
Year-on-year the increase in income reflects:the positive impact of higher interest rates in BRAZIL the depreciation of the euro against the main currencies, except the Brazilian real, the Venezuelan bolivar and the Colombian pesolarger net investment realisation gains, which amounted to €90.7 million (€49.4 million as at 30/6/2014), €55.3 million of which (€27.4 million as at 30/6/2014) stemmed from IBERIA
Consolidated financial information
Development of Non-Life insurance results: key highlights
19
Consolidated financial information
Development of Life Assurance results
2
1) This has a neutral impact on results, since it is compensated by a variation of equal amount and opposing sign in technical reserves
Life Account (*)
Million euros
6M 2014 6M 2015 %
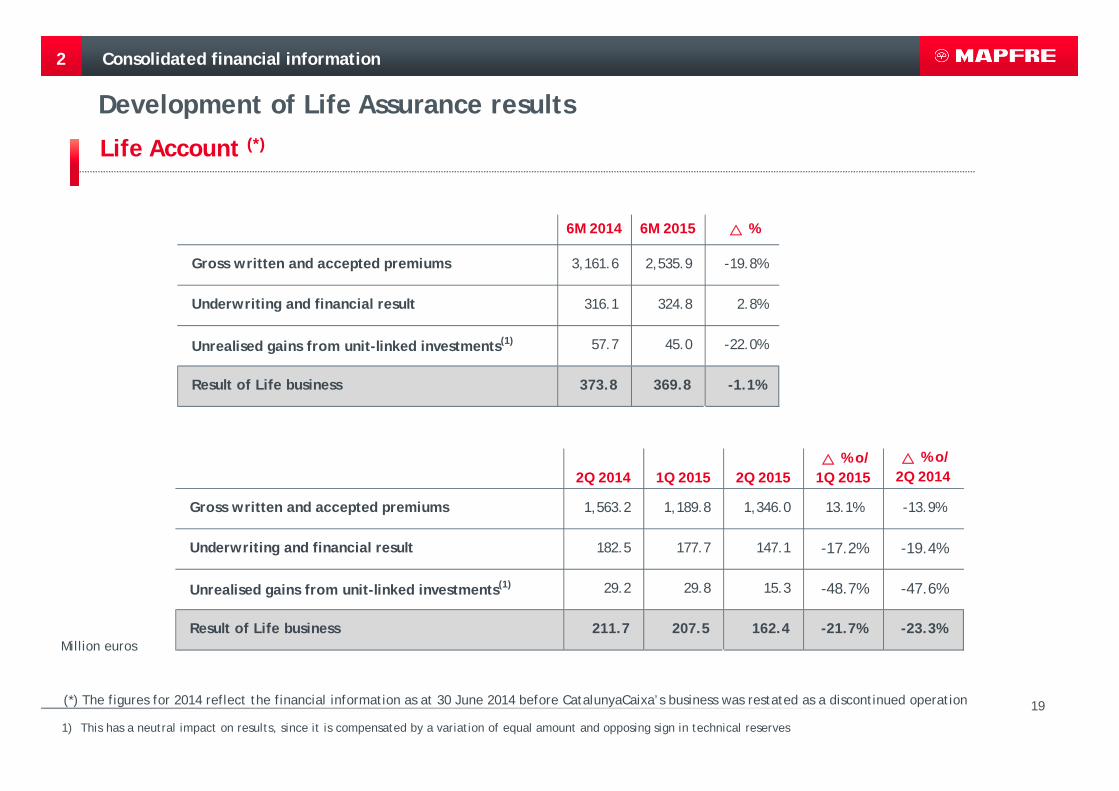
Gross written and accepted premiums 3,161.6 2,535.9 -19.8%
Underwriting and financial result 316.1 324.8 2.8%
Unrealised gains from unit-linked investments(1) 57.7 45.0 -22.0%
Result of Life business 373.8 369.8 -1.1%
% o/ % o/2Q 2014 1Q 2015 2Q 2015 1Q 2015 2Q 2014
Gross written and accepted premiums 1,563.2 1,189.8 1,346.0 13.1% -13.9%
Underwriting and financial result 182.5 177.7 147.1 -17.2% -19.4%
Unrealised gains from unit-linked investments(1) 29.2 29.8 15.3 -48.7% -47.6%
Result of Life business 211.7 207.5 162.4 -21.7% -23.3%
(*) The figures for 2014 reflect the financial information as at 30 June 2014 before CatalunyaCaixa’s business was restated as a discontinued operation
20
Consolidated financial information
Development of Life Assurance results: key highlights
2
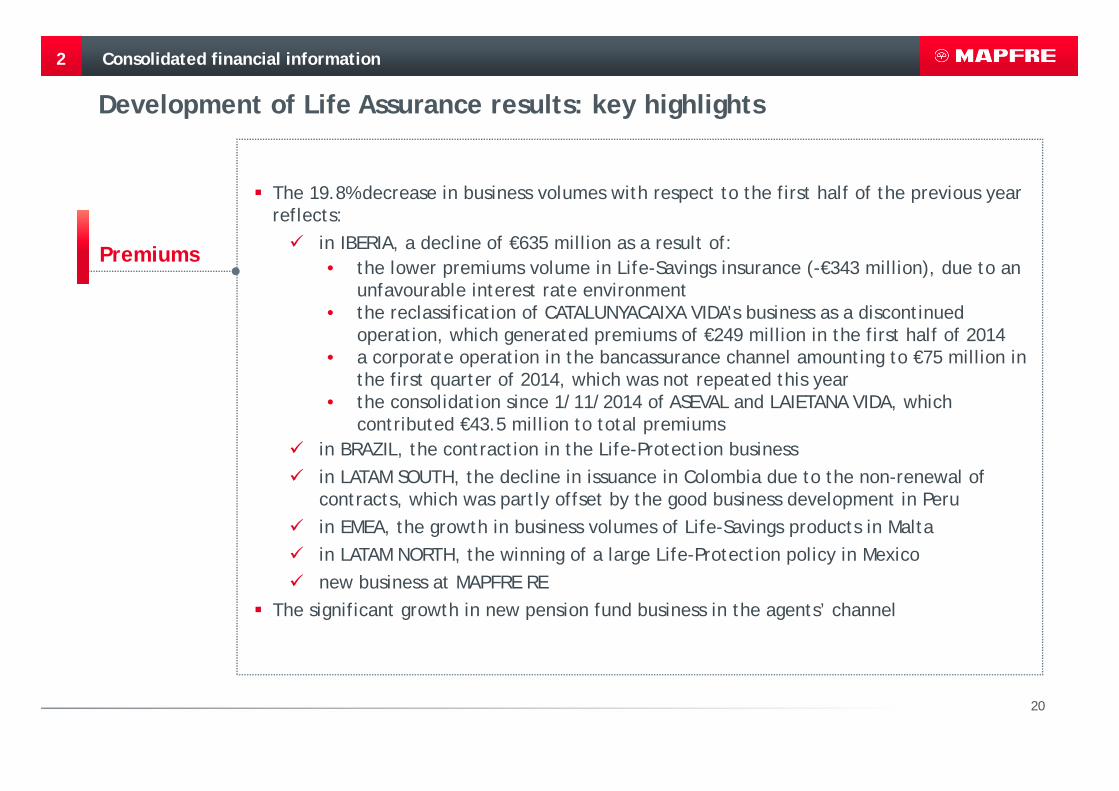
The 19.8% decrease in business volumes with respect to the first half of the previous year reflects:
in IBERIA, a decline of €635 million as a result of:• the lower premiums volume in Life-Savings insurance (-€343 million), due to an
unfavourable interest rate environment• the reclassification of CATALUNYACAIXA VIDA’s business as a discontinued
operation, which generated premiums of €249 million in the first half of 2014• a corporate operation in the bancassurance channel amounting to €75 million in
the first quarter of 2014, which was not repeated this year• the consolidation since 1/11/2014 of ASEVAL and LAIETANA VIDA, which
contributed €43.5 million to total premiumsin BRAZIL, the contraction in the Life-Protection businessin LATAM SOUTH, the decline in issuance in Colombia due to the non-renewal of contracts, which was partly offset by the good business development in Peruin EMEA, the growth in business volumes of Life-Savings products in Maltain LATAM NORTH, the winning of a large Life-Protection policy in Mexiconew business at MAPFRE RE
The significant growth in new pension fund business in the agents’ channel
Premiums

21
2
Underwriting & financial result
The 2.8% improvement, compared to the same period of previous year, which adjusted for CatalunyaCaixa’s business would amount to 16.4%, reflects:
the positive mark-to-market of investments in Maltathe growth in the volume of funds under managementthe increase in interest rates and the improvement in the underwriting result in Brazil net investment realisation gains of €2.9 million (€14.1 million as at 30/6/2014)
Consolidated financial information
Development of Life Assurance results: key highlights
22
Consolidated financial information
Development of results from Other Business Activities
2
1) “Other Business Activities” includes the Group’s non-insurance activities undertaken by the insurance subsidiaries as well as by other subsidiaries. It also includes the activities of the holding company MAPFRE S.A. The figures for 2014 reflect the financial information as at 30 June 2014 before CatalunyaCaixa’s business was restated as a discontinued operation
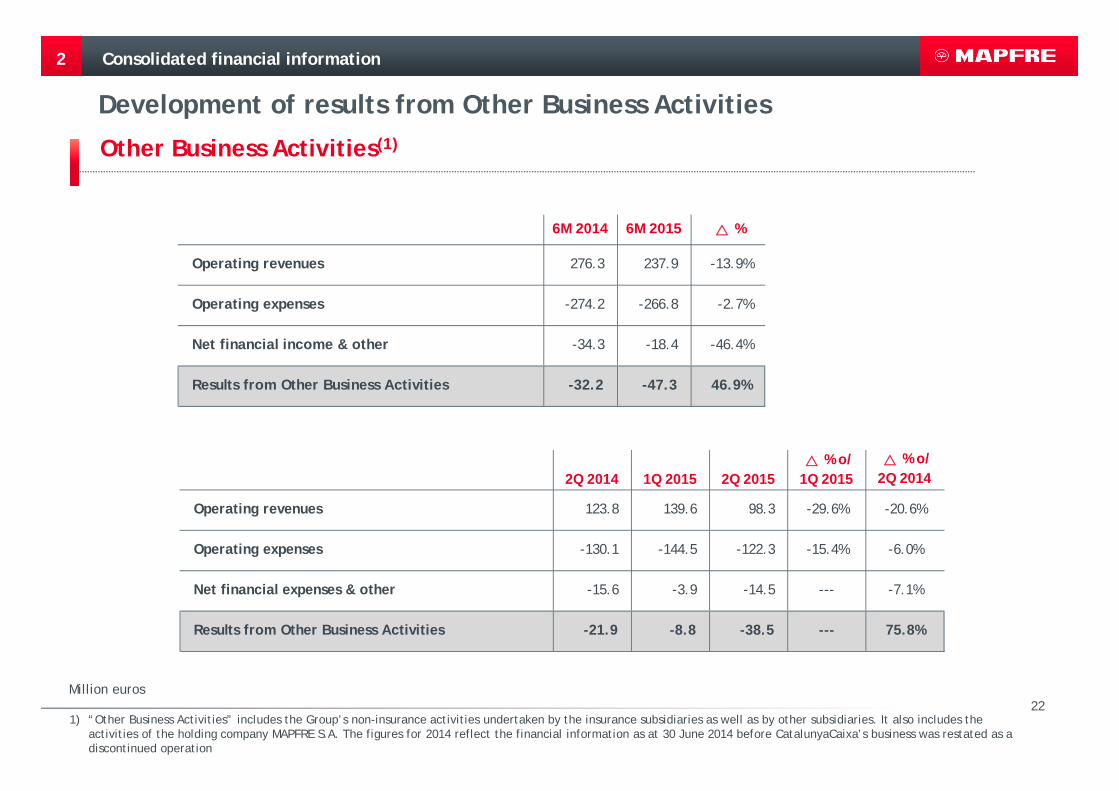
Other Business Activities(1)
Million euros
6M 2014 6M 2015 %
Operating revenues 276.3 237.9 -13.9%
Operating expenses -274.2 -266.8 -2.7%
Net financial income & other -34.3 -18.4 -46.4%
Results from Other Business Activities -32.2 -47.3 46.9%
% o/ % o/2Q 2014 1Q 2015 2Q 2015 1Q 2015 2Q 2014
Operating revenues 123.8 139.6 98.3 -29.6% -20.6%
Operating expenses -130.1 -144.5 -122.3 -15.4% -6.0%
Net financial expenses & other -15.6 -3.9 -14.5 --- -7.1%
Results from Other Business Activities -21.9 -8.8 -38.5 --- 75.8%
23
2
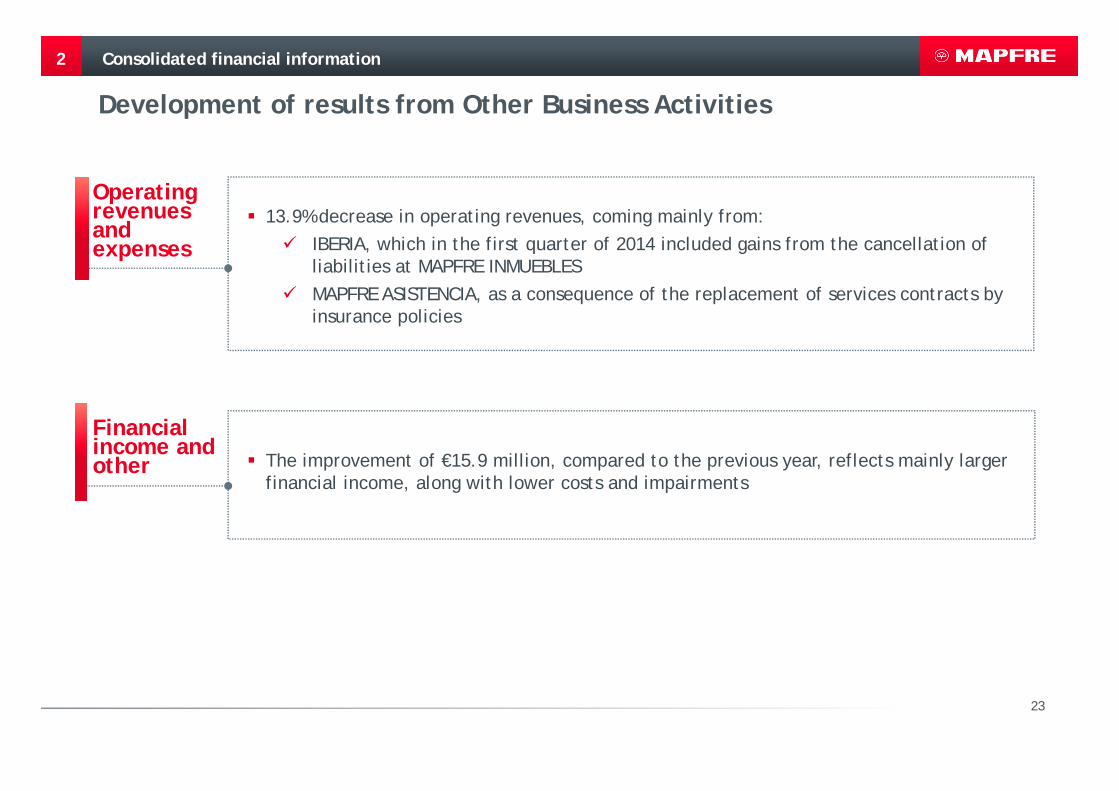
Financial income and other
13.9% decrease in operating revenues, coming mainly from:IBERIA, which in the first quarter of 2014 included gains from the cancellation of liabilities at MAPFRE INMUEBLESMAPFRE ASISTENCIA, as a consequence of the replacement of services contracts by insurance policies
The improvement of €15.9 million, compared to the previous year, reflects mainly larger financial income, along with lower costs and impairments
Operating revenues and expenses
Consolidated financial information
Development of results from Other Business Activities
24
Consolidated financial information
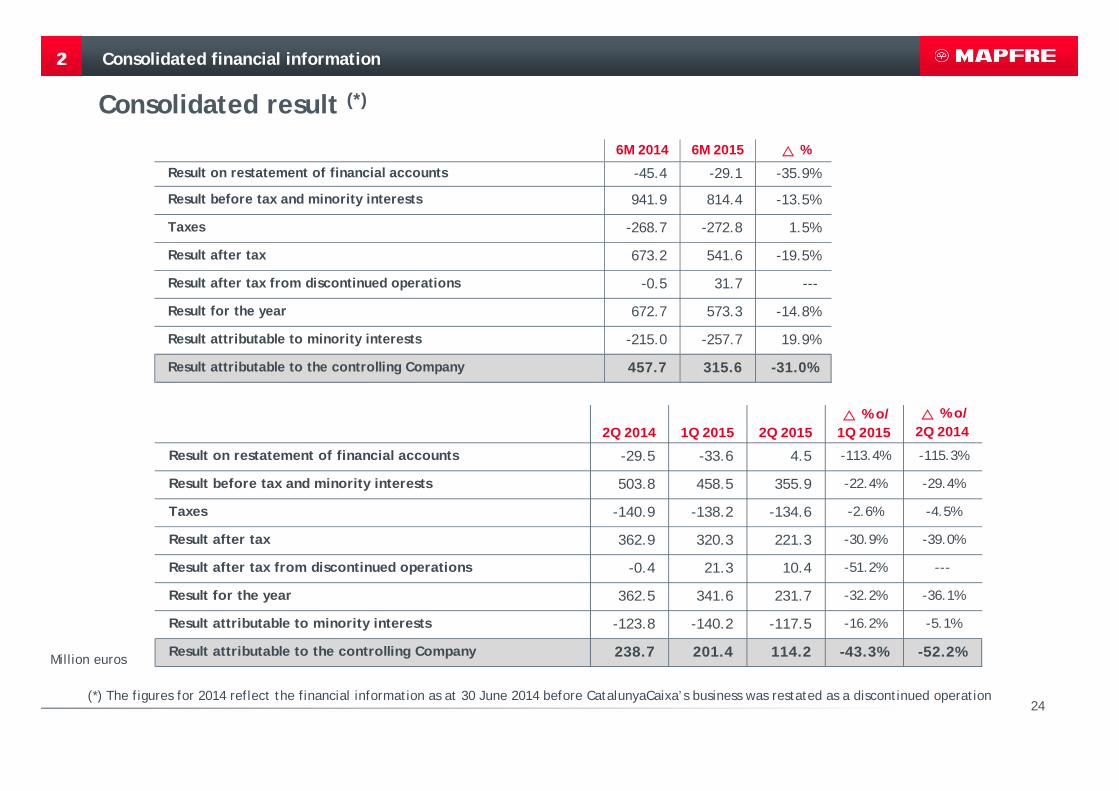
Consolidated result (*)22
Million euros
6M 2014 6M 2015 %
Result on restatement of financial accounts -45.4 -29.1 -35.9%
Result before tax and minority interests 941.9 814.4 -13.5%
Taxes -268.7 -272.8 1.5%
Result after tax 673.2 541.6 -19.5%
Result after tax from discontinued operations -0.5 31.7 ---
Result for the year 672.7 573.3 -14.8%
Result attributable to minority interests -215.0 -257.7 19.9%
Result attributable to the controlling Company 457.7 315.6 -31.0%
% o/ % o/2Q 2014 1Q 2015 2Q 2015 1Q 2015 2Q 2014
Result on restatement of financial accounts -29.5 -33.6 4.5 -113.4% -115.3%
Result before tax and minority interests 503.8 458.5 355.9 -22.4% -29.4%
Taxes -140.9 -138.2 -134.6 -2.6% -4.5%
Result after tax 362.9 320.3 221.3 -30.9% -39.0%
Result after tax from discontinued operations -0.4 21.3 10.4 -51.2% ---
Result for the year 362.5 341.6 231.7 -32.2% -36.1%
Result attributable to minority interests -123.8 -140.2 -117.5 -16.2% -5.1%
Result attributable to the controlling Company 238.7 201.4 114.2 -43.3% -52.2%
(*) The figures for 2014 reflect the financial information as at 30 June 2014 before CatalunyaCaixa’s business was restated as a discontinued operation

25
Consolidated financial information
Development of the consolidated result: key highlights
2
Decline in the underwriting result of the Non-Life business, mainly due to the losses stemming from the exceptionally strong snowstorms in the United StatesGood underwriting and financial result in the Life business in Brazil and MaltaLower losses due to the restatement of Venezuela’s accounts for inflation, resulting from the application of the SIMADI exchange rate Reclassification of CATALUNYACAIXA’s insurance business as a discontinued operationLarger investment realisation gains
Pre-tax result
Minority interests
Grew faster than pre-tax results mainly reflecting the good performance of the bancassurance business in Brazil
TaxesThe tax rate increased due to the strong growth of profits in Brazil, the elimination of the tax deductibility of the inflation adjustment in Venezuela and the activation of a tax on assets applicable to companies in Colombia
26
Consolidated financial information
Development of the balance sheet
2
1) Includes unit-linked reserves
Million euros
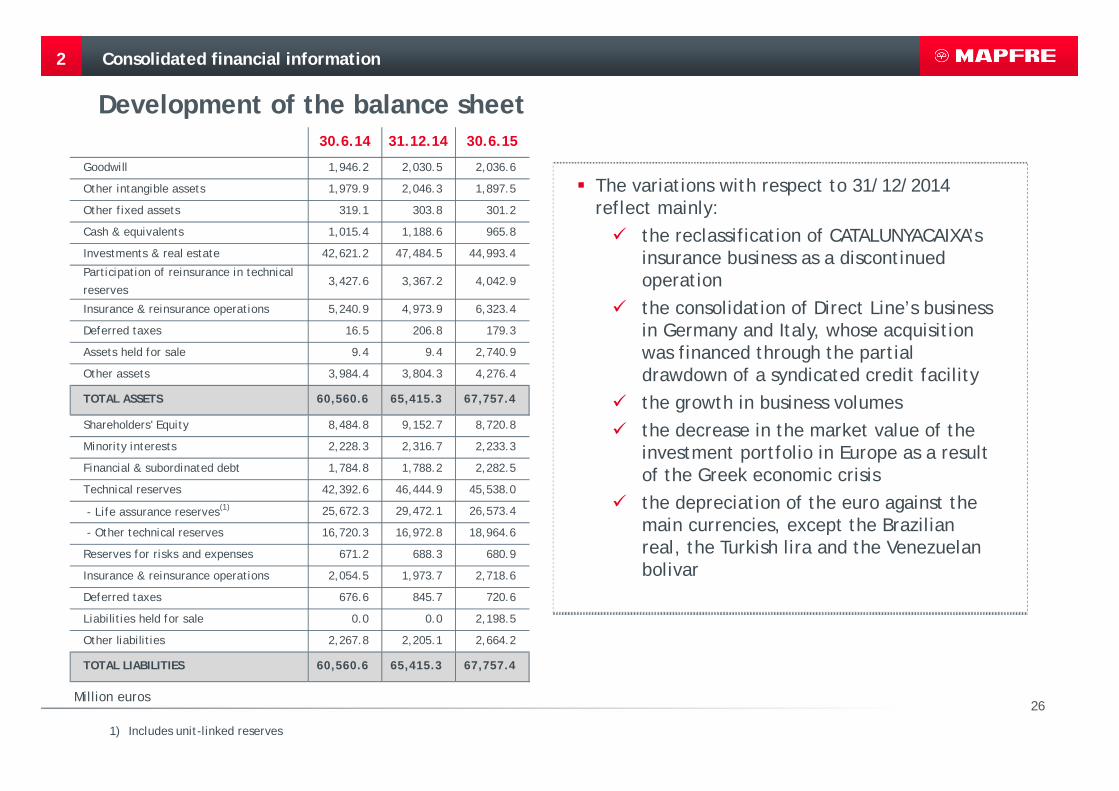
The variations with respect to 31/12/2014 reflect mainly:
the reclassification of CATALUNYACAIXA’s insurance business as a discontinued operation the consolidation of Direct Line’s business in Germany and Italy, whose acquisition was financed through the partial drawdown of a syndicated credit facilitythe growth in business volumesthe decrease in the market value of the investment portfolio in Europe as a result of the Greek economic crisisthe depreciation of the euro against the main currencies, except the Brazilian real, the Turkish lira and the Venezuelan bolivar
30.6.14 31.12.14 30.6.15
Goodwill 1,946.2 2,030.5 2,036.6
Other intangible assets 1,979.9 2,046.3 1,897.5
Other fixed assets 319.1 303.8 301.2
Cash & equivalents 1,015.4 1,188.6 965.8
Investments & real estate 42,621.2 47,484.5 44,993.4
Participation of reinsurance in technical
reserves3,427.6 3,367.2 4,042.9
Insurance & reinsurance operations 5,240.9 4,973.9 6,323.4
Deferred taxes 16.5 206.8 179.3
Assets held for sale 9.4 9.4 2,740.9
Other assets 3,984.4 3,804.3 4,276.4
TOTAL ASSETS 60,560.6 65,415.3 67,757.4
Shareholders' Equity 8,484.8 9,152.7 8,720.8
Minority interests 2,228.3 2,316.7 2,233.3
Financial & subordinated debt 1,784.8 1,788.2 2,282.5
Technical reserves 42,392.6 46,444.9 45,538.0
- Life assurance reserves(1) 25,672.3 29,472.1 26,573.4
- Other technical reserves 16,720.3 16,972.8 18,964.6
Reserves for risks and expenses 671.2 688.3 680.9
Insurance & reinsurance operations 2,054.5 1,973.7 2,718.6
Deferred taxes 676.6 845.7 720.6
Liabilities held for sale 0.0 0.0 2,198.5
Other liabilities 2,267.8 2,205.1 2,664.2
TOTAL LIABILITIES 60,560.6 65,415.3 67,757.4
27
A prudent investment policy adapted to the insurance business
2
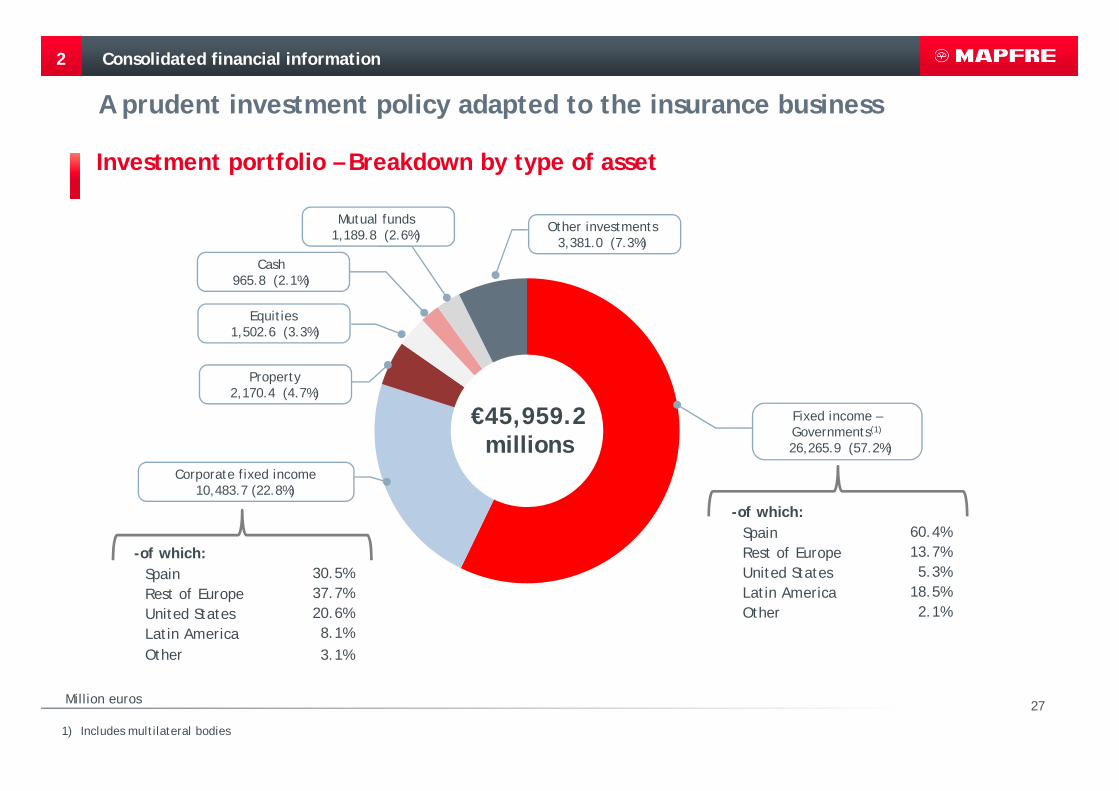
Investment portfolio – Breakdown by type of asset
Corporate fixed income 10,483.7 (22.8%)
Fixed income –Governments(1)
26,265.9 (57.2%)
Property2,170.4 (4.7%)
Cash965.8 (2.1%)
Equities1,502.6 (3.3%)
Mutual funds1,189.8 (2.6%)
Other investments 3,381.0 (7.3%)
€45,959.2millions
1) Includes multilateral bodies
Million euros
Consolidated financial information
-of which: Spain 30.5%Rest of Europe 37.7%United States 20.6%Latin America 8.1%Other 3.1%
-of which: Spain 60.4%Rest of Europe 13.7%United States 5.3%Latin America 18.5%Other 2.1%
28
Consolidated financial information
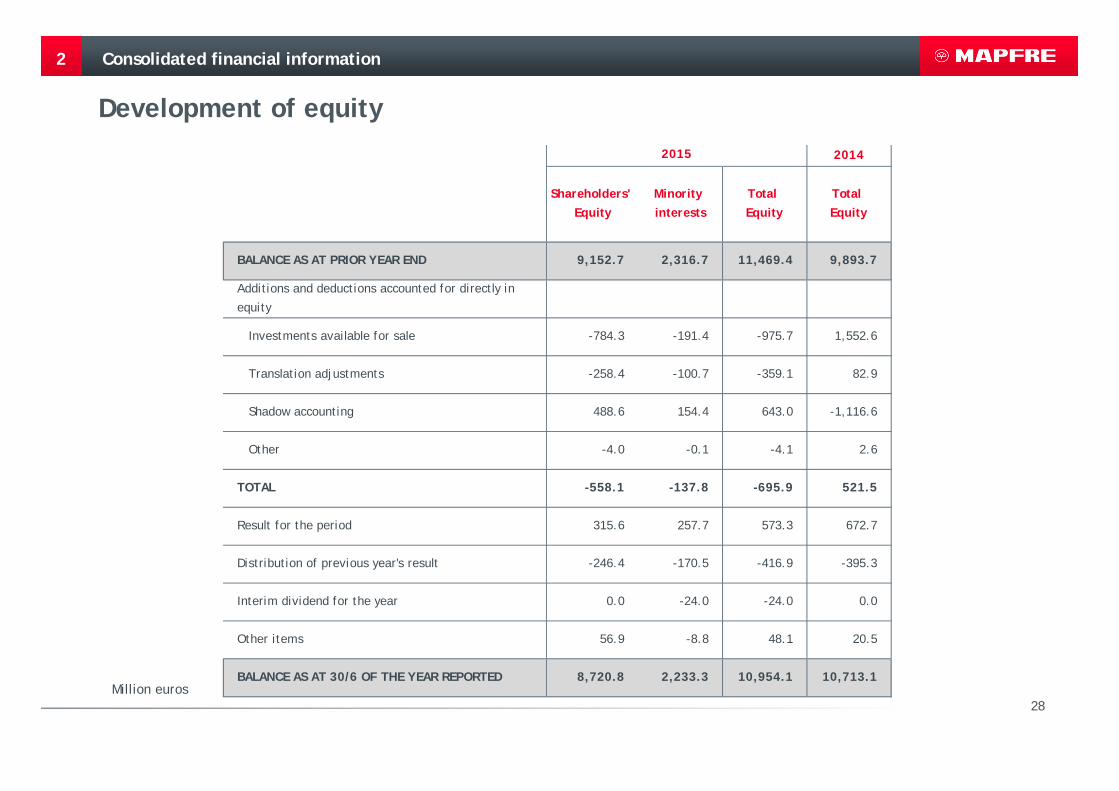
Development of equity
2
Million euros
2014
Shareholders' Equity
Minority interests
Total Equity
Total Equity
BALANCE AS AT PRIOR YEAR END 9,152.7 2,316.7 11,469.4 9,893.7
Additions and deductions accounted for directly in
equity
Investments available for sale -784.3 -191.4 -975.7 1,552.6
Translation adjustments -258.4 -100.7 -359.1 82.9
Shadow accounting 488.6 154.4 643.0 -1,116.6
Other -4.0 -0.1 -4.1 2.6
TOTAL -558.1 -137.8 -695.9 521.5
Result for the period 315.6 257.7 573.3 672.7
Distribution of previous year's result -246.4 -170.5 -416.9 -395.3
Interim dividend for the year 0.0 -24.0 -24.0 0.0
Other items 56.9 -8.8 48.1 20.5
BALANCE AS AT 30/6 OF THE YEAR REPORTED 8,720.8 2,233.3 10,954.1 10,713.1
2015
29
Consolidated financial information
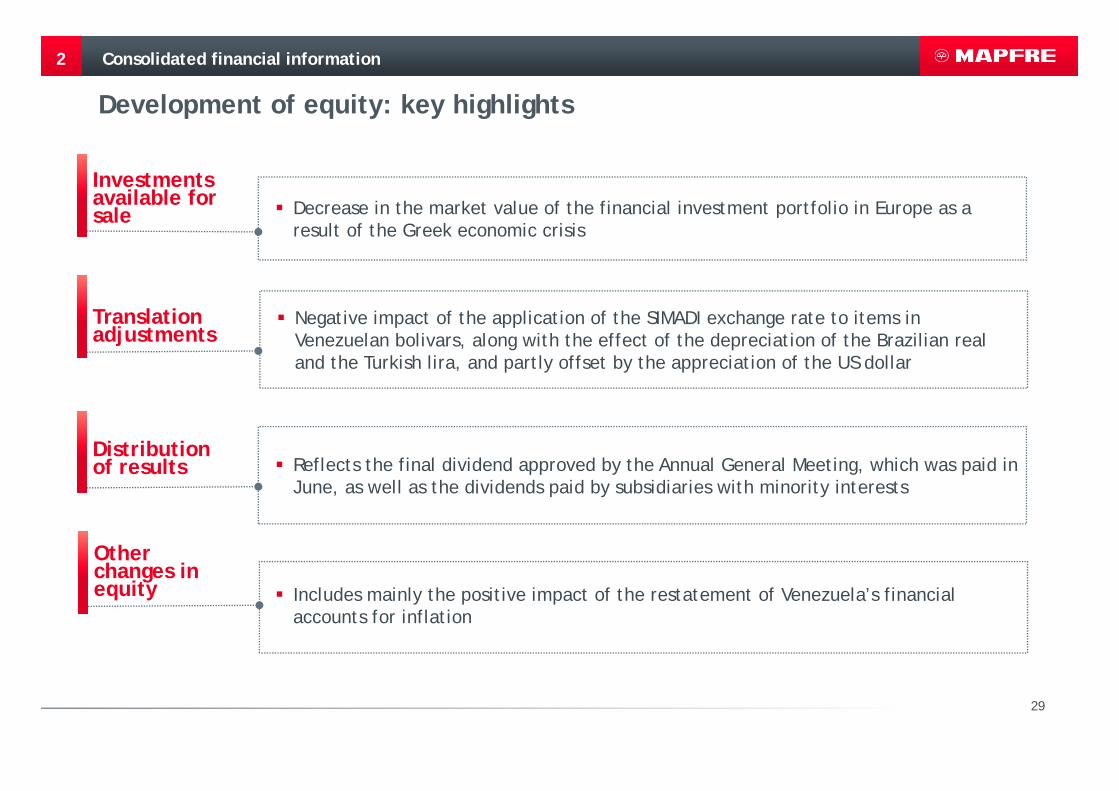
Development of equity: key highlights
2
Investments available for sale
Distribution of results
Decrease in the market value of the financial investment portfolio in Europe as a result of the Greek economic crisis
Negative impact of the application of the SIMADI exchange rate to items in Venezuelan bolivars, along with the effect of the depreciation of the Brazilian real and the Turkish lira, and partly offset by the appreciation of the US dollar
Reflects the final dividend approved by the Annual General Meeting, which was paid in June, as well as the dividends paid by subsidiaries with minority interests
Translation adjustments
Other changes in equity Includes mainly the positive impact of the restatement of Venezuela’s financial
accounts for inflation
30
Contents
1 Key highlights
2 Consolidated financial information
34
Financial supplement
Schedule and contacts
31
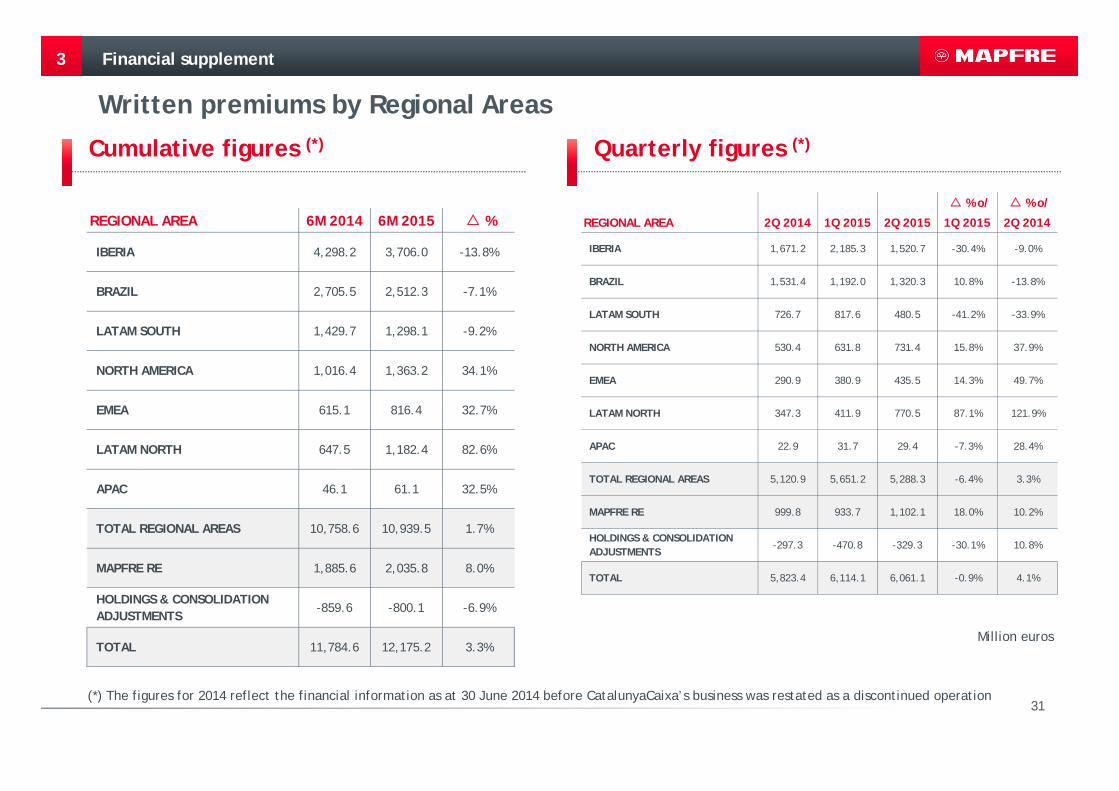
Written premiums by Regional Areas
3
Million euros
Financial supplement
Quarterly figures (*)Cumulative figures (*)
REGIONAL AREA 6M 2014 6M 2015 %
IBERIA 4,298.2 3,706.0 -13.8%
BRAZIL 2,705.5 2,512.3 -7.1%
LATAM SOUTH 1,429.7 1,298.1 -9.2%
NORTH AMERICA 1,016.4 1,363.2 34.1%
EMEA 615.1 816.4 32.7%
LATAM NORTH 647.5 1,182.4 82.6%
APAC 46.1 61.1 32.5%
TOTAL REGIONAL AREAS 10,758.6 10,939.5 1.7%
MAPFRE RE 1,885.6 2,035.8 8.0%
HOLDINGS & CONSOLIDATION ADJUSTMENTS
-859.6 -800.1 -6.9%
TOTAL 11,784.6 12,175.2 3.3%
% o/ % o/
REGIONAL AREA 2Q 2014 1Q 2015 2Q 2015 1Q 2015 2Q 2014
IBERIA 1,671.2 2,185.3 1,520.7 -30.4% -9.0%
BRAZIL 1,531.4 1,192.0 1,320.3 10.8% -13.8%
LATAM SOUTH 726.7 817.6 480.5 -41.2% -33.9%
NORTH AMERICA 530.4 631.8 731.4 15.8% 37.9%
EMEA 290.9 380.9 435.5 14.3% 49.7%
LATAM NORTH 347.3 411.9 770.5 87.1% 121.9%
APAC 22.9 31.7 29.4 -7.3% 28.4%
TOTAL REGIONAL AREAS 5,120.9 5,651.2 5,288.3 -6.4% 3.3%
MAPFRE RE 999.8 933.7 1,102.1 18.0% 10.2%
HOLDINGS & CONSOLIDATION ADJUSTMENTS
-297.3 -470.8 -329.3 -30.1% 10.8%
TOTAL 5,823.4 6,114.1 6,061.1 -0.9% 4.1%
(*) The figures for 2014 reflect the financial information as at 30 June 2014 before CatalunyaCaixa’s business was restated as a discontinued operation
32
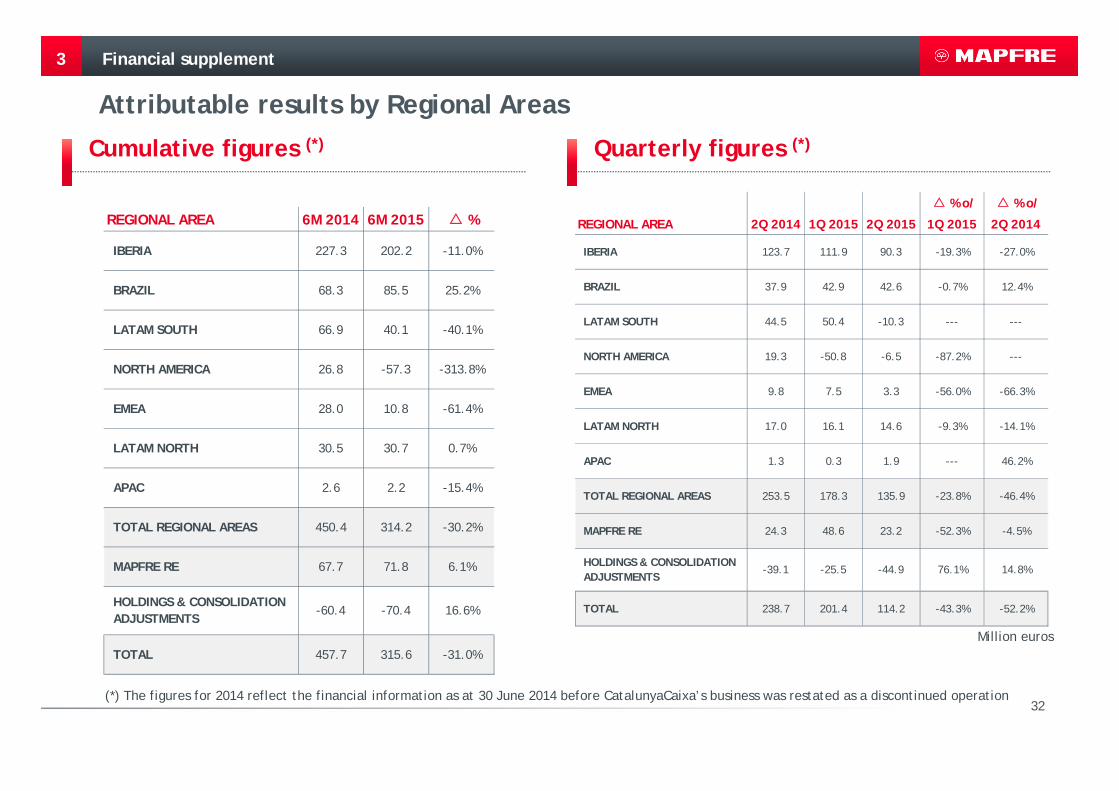
Attributable results by Regional Areas
3
Quarterly figures (*)Cumulative figures (*)
Financial supplement
REGIONAL AREA 6M 2014 6M 2015 %
IBERIA 227.3 202.2 -11.0%
BRAZIL 68.3 85.5 25.2%
LATAM SOUTH 66.9 40.1 -40.1%
NORTH AMERICA 26.8 -57.3 -313.8%
EMEA 28.0 10.8 -61.4%
LATAM NORTH 30.5 30.7 0.7%
APAC 2.6 2.2 -15.4%
TOTAL REGIONAL AREAS 450.4 314.2 -30.2%
MAPFRE RE 67.7 71.8 6.1%
HOLDINGS & CONSOLIDATION ADJUSTMENTS
-60.4 -70.4 16.6%
TOTAL 457.7 315.6 -31.0%
% o/ % o/
REGIONAL AREA 2Q 2014 1Q 2015 2Q 2015 1Q 2015 2Q 2014
IBERIA 123.7 111.9 90.3 -19.3% -27.0%
BRAZIL 37.9 42.9 42.6 -0.7% 12.4%
LATAM SOUTH 44.5 50.4 -10.3 --- ---
NORTH AMERICA 19.3 -50.8 -6.5 -87.2% ---
EMEA 9.8 7.5 3.3 -56.0% -66.3%
LATAM NORTH 17.0 16.1 14.6 -9.3% -14.1%
APAC 1.3 0.3 1.9 --- 46.2%
TOTAL REGIONAL AREAS 253.5 178.3 135.9 -23.8% -46.4%
MAPFRE RE 24.3 48.6 23.2 -52.3% -4.5%
HOLDINGS & CONSOLIDATION ADJUSTMENTS
-39.1 -25.5 -44.9 76.1% 14.8%
TOTAL 238.7 201.4 114.2 -43.3% -52.2%
Million euros
(*) The figures for 2014 reflect the financial information as at 30 June 2014 before CatalunyaCaixa’s business was restated as a discontinued operation
33
3
Quarterly figures (*)
Cumulative figures (*)
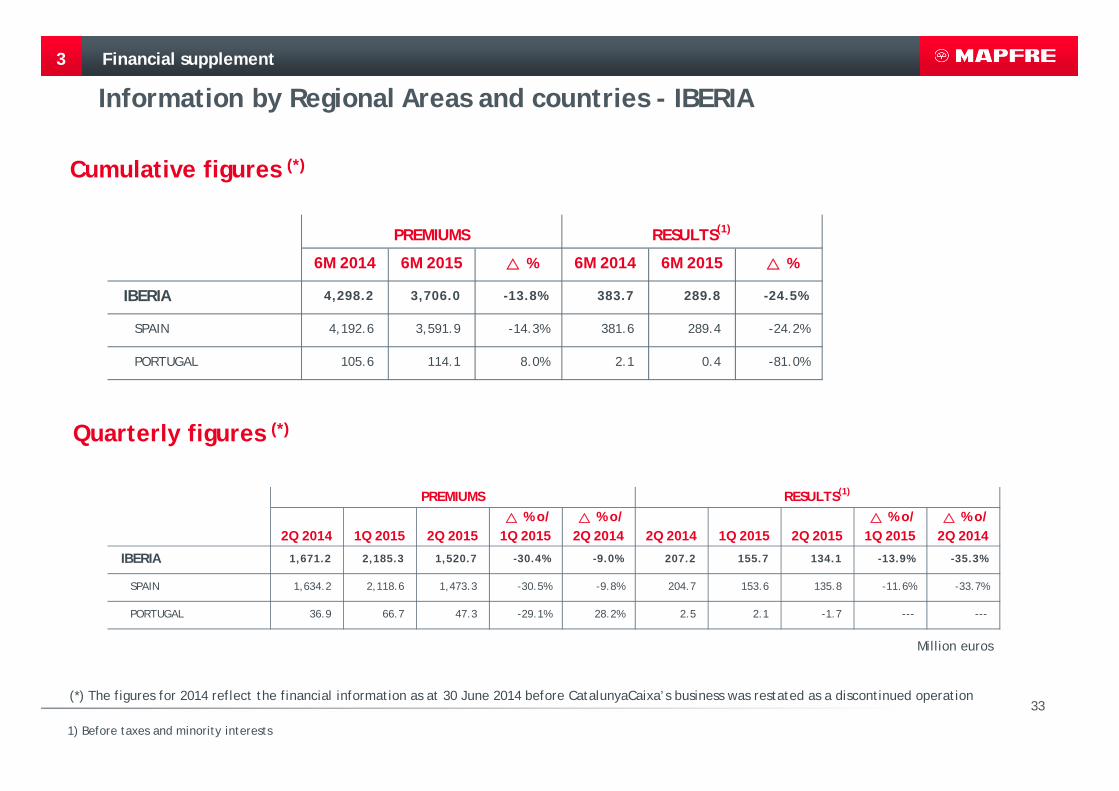
Information by Regional Areas and countries - IBERIA
1) Before taxes and minority interests
Financial supplement
6M 2014 6M 2015 % 6M 2014 6M 2015 %
IBERIA 4,298.2 3,706.0 -13.8% 383.7 289.8 -24.5%
SPAIN 4,192.6 3,591.9 -14.3% 381.6 289.4 -24.2%
PORTUGAL 105.6 114.1 8.0% 2.1 0.4 -81.0%
RESULTS(1)PREMIUMS
% o/ % o/ % o/ % o/2Q 2014 1Q 2015 2Q 2015 1Q 2015 2Q 2014 2Q 2014 1Q 2015 2Q 2015 1Q 2015 2Q 2014
IBERIA 1,671.2 2,185.3 1,520.7 -30.4% -9.0% 207.2 155.7 134.1 -13.9% -35.3%
SPAIN 1,634.2 2,118.6 1,473.3 -30.5% -9.8% 204.7 153.6 135.8 -11.6% -33.7%
PORTUGAL 36.9 66.7 47.3 -29.1% 28.2% 2.5 2.1 -1.7 --- ---
PREMIUMS RESULTS(1)
Million euros
(*) The figures for 2014 reflect the financial information as at 30 June 2014 before CatalunyaCaixa’s business was restated as a discontinued operation

34
Information by Regional Areas and countries - LATAM
3
Million euros
Cumulative figures
1) Before taxes and minority interests2) Growth excluding the contribution from MAPFRE GLOBAL RISKS and MAPFRE ASISTENCIA
Financial supplement
6M 2014 6M 2015 %
% local
currency(2) 6M 2014 6M 2015 %
% local
currency(2)
BRAZIL 2,705.5 2,512.3 -7.1% -1.2% 341.1 444.9 30.4% 41.1%
LATAM SOUTH 1,429.7 1,298.1 -9.2% 87.9 86.6 -1.5%
of which:
COLOMBIA 324.5 241.5 -25.6% -25.3% 13.9 2.4 -82.7% -107.6%
VENEZUELA 513.7 301.6 -41.3% 87.9% 44.6 47.9 7.4% 258.7%
ARGENTINA 150.9 183.0 21.3% 15.9% 1.2 0.6 -50.0% 207.0%
CHILE 148.0 184.8 24.9% 15.3% -5.8 6.3 --- -32.9%
PERU 164.6 237.2 44.1% 29.2% 27.6 21.5 -22.1% -40.0%
LATAM NORTH 647.5 1,182.4 82.6% 43.1 45.7 6.0%
of which:
MEXICO 432.8 887.4 105.0% 98.6% 24.8 19.6 -21.0% -9.6%
PREMIUMS RESULTS(1)
35
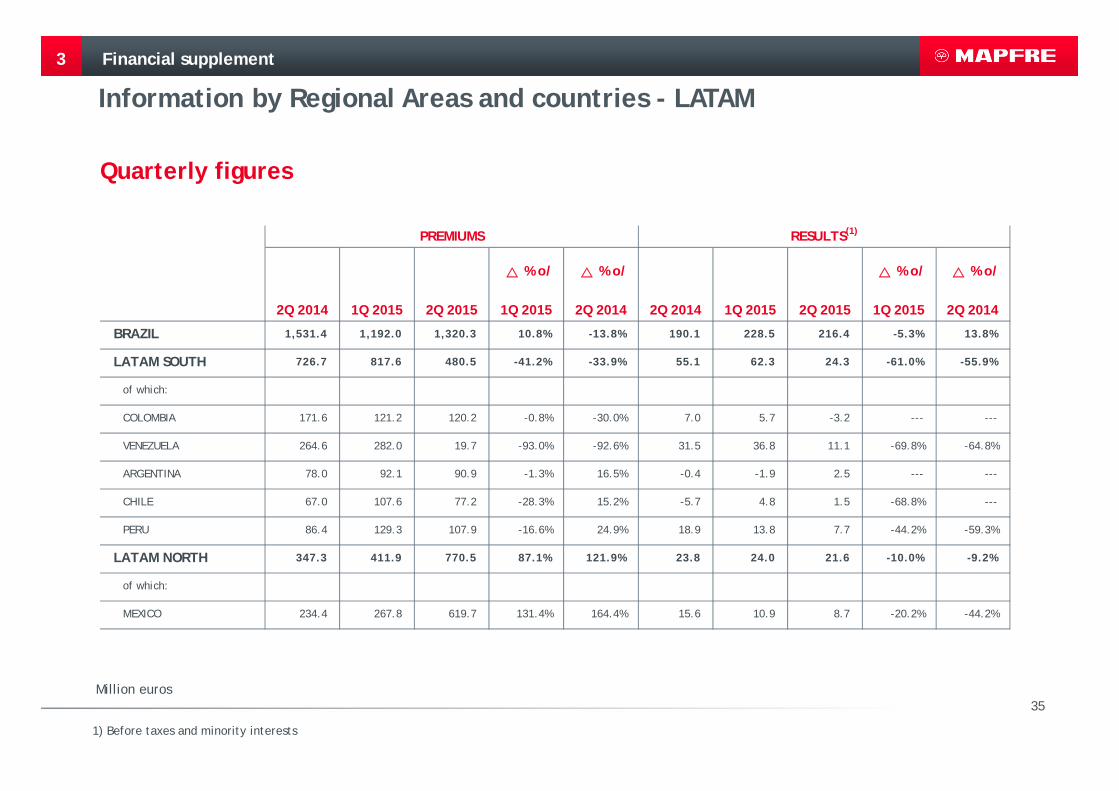
Information by Regional Areas and countries - LATAM
3
Million euros
1) Before taxes and minority interests
Quarterly figures
Financial supplement
% o/ % o/ % o/ % o/
2Q 2014 1Q 2015 2Q 2015 1Q 2015 2Q 2014 2Q 2014 1Q 2015 2Q 2015 1Q 2015 2Q 2014
BRAZIL 1,531.4 1,192.0 1,320.3 10.8% -13.8% 190.1 228.5 216.4 -5.3% 13.8%
LATAM SOUTH 726.7 817.6 480.5 -41.2% -33.9% 55.1 62.3 24.3 -61.0% -55.9%
of which:
COLOMBIA 171.6 121.2 120.2 -0.8% -30.0% 7.0 5.7 -3.2 --- ---
VENEZUELA 264.6 282.0 19.7 -93.0% -92.6% 31.5 36.8 11.1 -69.8% -64.8%
ARGENTINA 78.0 92.1 90.9 -1.3% 16.5% -0.4 -1.9 2.5 --- ---
CHILE 67.0 107.6 77.2 -28.3% 15.2% -5.7 4.8 1.5 -68.8% ---
PERU 86.4 129.3 107.9 -16.6% 24.9% 18.9 13.8 7.7 -44.2% -59.3%
LATAM NORTH 347.3 411.9 770.5 87.1% 121.9% 23.8 24.0 21.6 -10.0% -9.2%
of which:
MEXICO 234.4 267.8 619.7 131.4% 164.4% 15.6 10.9 8.7 -20.2% -44.2%
PREMIUMS RESULTS(1)
36
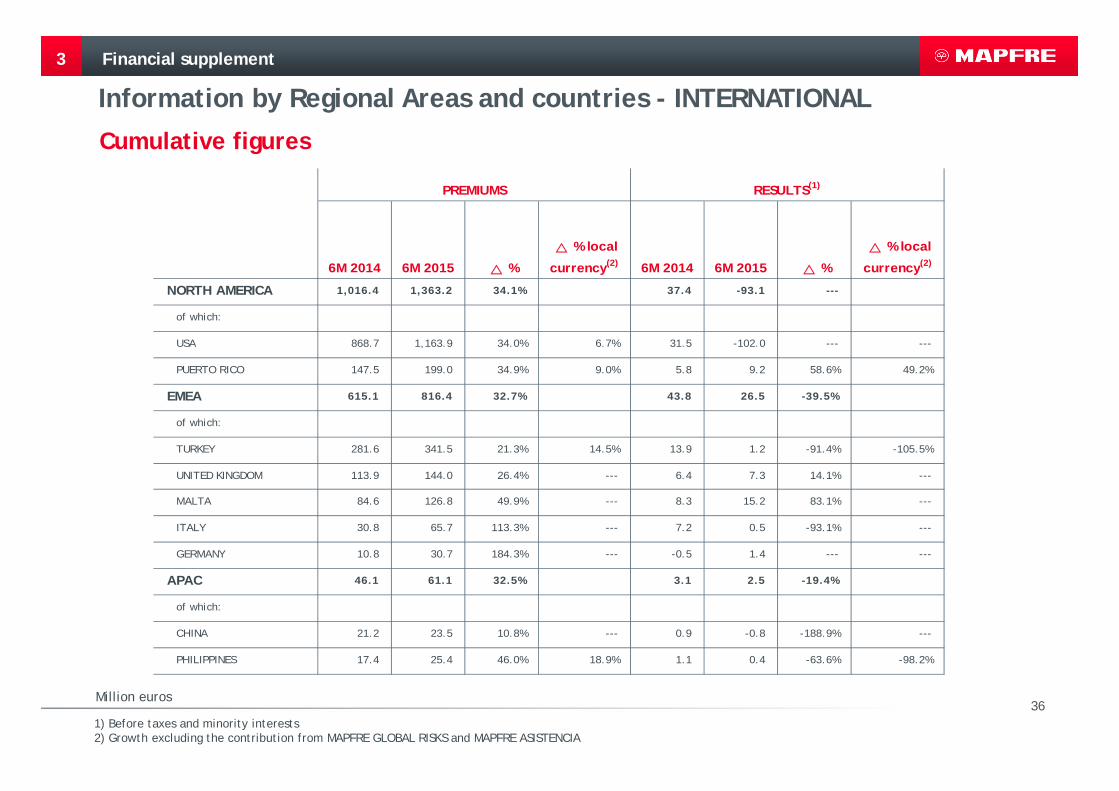
Information by Regional Areas and countries - INTERNATIONAL
3
Million euros
Cumulative figures
1) Before taxes and minority interests2) Growth excluding the contribution from MAPFRE GLOBAL RISKS and MAPFRE ASISTENCIA
Financial supplement
6M 2014 6M 2015 %
% local
currency(2) 6M 2014 6M 2015 %
% local
currency(2)
NORTH AMERICA 1,016.4 1,363.2 34.1% 37.4 -93.1 ---
of which:
USA 868.7 1,163.9 34.0% 6.7% 31.5 -102.0 --- ---
PUERTO RICO 147.5 199.0 34.9% 9.0% 5.8 9.2 58.6% 49.2%
EMEA 615.1 816.4 32.7% 43.8 26.5 -39.5%
of which:
TURKEY 281.6 341.5 21.3% 14.5% 13.9 1.2 -91.4% -105.5%
UNITED KINGDOM 113.9 144.0 26.4% --- 6.4 7.3 14.1% ---
MALTA 84.6 126.8 49.9% --- 8.3 15.2 83.1% ---
ITALY 30.8 65.7 113.3% --- 7.2 0.5 -93.1% ---
GERMANY 10.8 30.7 184.3% --- -0.5 1.4 --- ---
APAC 46.1 61.1 32.5% 3.1 2.5 -19.4%
of which:
CHINA 21.2 23.5 10.8% --- 0.9 -0.8 -188.9% ---
PHILIPPINES 17.4 25.4 46.0% 18.9% 1.1 0.4 -63.6% -98.2%
PREMIUMS RESULTS(1)

37
Information by Regional Areas and countries - INTERNATIONAL
3
Million euros
Quarterly figures
1) Before taxes and minority interests
Financial supplement
% o/ % o/ % o/ % o/
2Q 2014 1Q 2015 2Q 2015 1Q 2015 2Q 2014 2Q 2014 1Q 2015 2Q 2015 1Q 2015 2Q 2014
NORTH AMERICA 530.4 631.8 731.4 15.8% 37.9% 28.4 -68.6 -24.5 -64.3% ---
of which:
USA 443.8 544.4 619.5 13.8% 39.6% 24.6 -72.4 -29.6 -59.1% ---
PUERTO RICO 86.5 87.4 111.6 27.7% 29.0% 3.7 3.9 5.3 35.9% 43.2%
EMEA 290.9 380.9 435.5 14.3% 49.7% 19.0 24.7 1.8 -92.7% -90.5%
of which:
TURKEY 123.2 179.5 162.0 -9.7% 31.5% 5.5 1.1 0.0 -100.0% -100.0%
UNITED KINGDOM 56.4 66.6 77.4 16.2% 37.2% 3.2 3.2 4.1 28.1% 28.1%
MALTA 42.9 63.1 63.8 1.1% 48.7% 6.7 18.4 -3.2 --- ---
ITALY 16.5 11.8 53.9 --- --- 3.5 2.8 -2.3 --- ---
GERMANY 5.9 8.4 22.2 164.3% --- -0.8 -2.4 3.8 --- ---
APAC 22.9 31.7 29.4 -7.3% 28.4% 1.6 0.4 2.1 --- 31.3%
of which:
CHINA 10.1 11.4 12.1 6.1% 19.8% 0.6 0.0 -0.8 --- ---
PHILIPPINES 8.8 14.8 10.6 -28.4% 20.5% 1.0 0.2 0.3 50.0% -70.0%
PREMIUMS RESULTS(1)
38
3
Million euros
1) Before taxes and minority interests
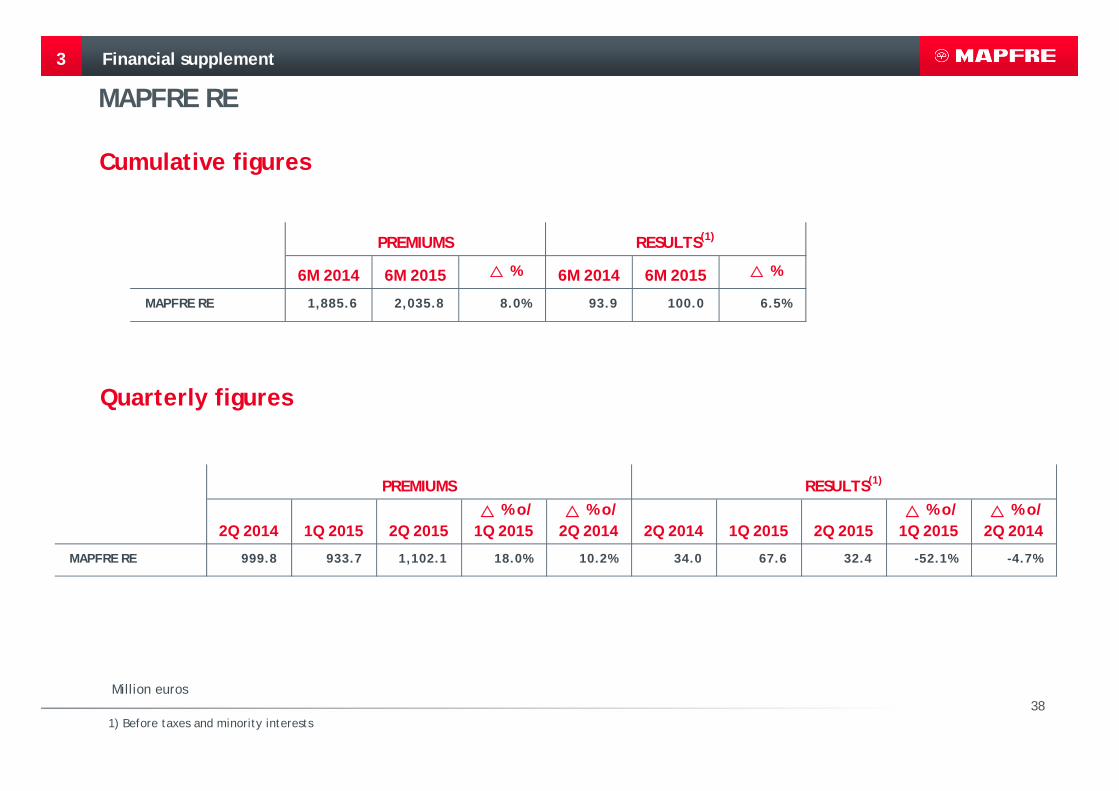
MAPFRE RE
Cumulative figures
Quarterly figures
Financial supplement
6M 2014 6M 2015 % 6M 2014 6M 2015 %
MAPFRE RE 1,885.6 2,035.8 8.0% 93.9 100.0 6.5%
PREMIUMS RESULTS(1)
% o/ % o/ % o/ % o/2Q 2014 1Q 2015 2Q 2015 1Q 2015 2Q 2014 2Q 2014 1Q 2015 2Q 2015 1Q 2015 2Q 2014
MAPFRE RE 999.8 933.7 1,102.1 18.0% 10.2% 34.0 67.6 32.4 -52.1% -4.7%
RESULTS(1)PREMIUMS

39
Regional Areas and Reinsurance: Income Statement – Non-Life
3
Million euros
1) Ratios as a % of net premiums earned
June 2015
Financial supplement
NON-LIFE INSURANCE AND REINSURANCE IBERIALATAM NORTH
LATAM SOUTH BRAZIL EMEA
NORTH AMERICA APAC REINSURANCE
CONSOLID. ADJUST. TOTAL
Gross written and accepted premiums 2,846.5 1,011.5 1,168.3 1,622.4 708.3 1,357.5 61.1 1,663.8 -800.1 9,639.3
Premiums earned, net of ceded and
retroceded reinsurance2,039.8 352.5 708.2 1,330.9 510.5 1,079.3 46.7 982.8 -4.7 7,045.9
Net claims incurred and variation in other
technical provisions-1,538.9 -210.5 -443.0 -808.4 -368.4 -925.5 -32.7 -663.4 2.1 -4,988.6
Operating expenses, net of reinsurance -435.8 -119.4 -242.9 -439.8 -143.1 -314.7 -13.0 -268.4 2.0 -1,975.1
Other technical income and expenses -11.5 -1.9 -6.9 0.8 -4.8 5.9 -0.1 -1.7 0.0 -20.0
Technical result 53.6 20.7 15.4 83.5 -5.7 -154.9 1.0 49.2 -0.6 62.2
Net fin´l. income and other non-technical
income and expenses109.3 16.3 106.4 95.9 16.9 65.2 1.5 37.6 9.7 458.8
Result of Non-Life business 162.9 37.0 121.8 179.4 11.2 -89.8 2.5 86.9 9.1 521.0
Loss ratio(1) 75.4% 59.7% 62.5% 60.7% 72.2% 85.7% 69.9% 67.5% 70.8%
Expense ratio(1) 21.9% 34.4% 35.3% 33.0% 29.0% 28.6% 28.0% 27.5% 28.3%
Combined ratio(1) 97.3% 94.1% 97.8% 93.7% 101.2% 114.3% 97.9% 95.0% 99.1%
40
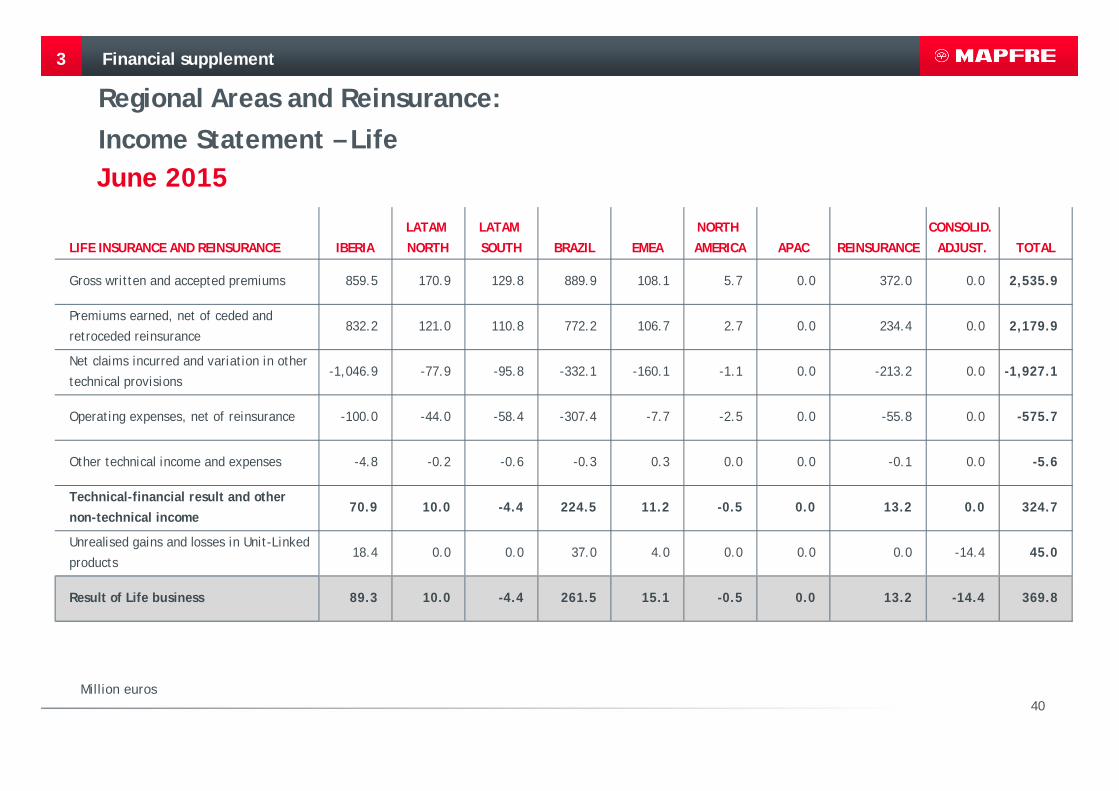
Regional Areas and Reinsurance: Income Statement – Life
3
Million euros
June 2015
Financial supplement
LIFE INSURANCE AND REINSURANCE IBERIALATAM NORTH
LATAM SOUTH BRAZIL EMEA
NORTH AMERICA APAC REINSURANCE
CONSOLID. ADJUST. TOTAL
Gross written and accepted premiums 859.5 170.9 129.8 889.9 108.1 5.7 0.0 372.0 0.0 2,535.9
Premiums earned, net of ceded and
retroceded reinsurance832.2 121.0 110.8 772.2 106.7 2.7 0.0 234.4 0.0 2,179.9
Net claims incurred and variation in other
technical provisions-1,046.9 -77.9 -95.8 -332.1 -160.1 -1.1 0.0 -213.2 0.0 -1,927.1
Operating expenses, net of reinsurance -100.0 -44.0 -58.4 -307.4 -7.7 -2.5 0.0 -55.8 0.0 -575.7
Other technical income and expenses -4.8 -0.2 -0.6 -0.3 0.3 0.0 0.0 -0.1 0.0 -5.6
Technical-financial result and other non-technical income
70.9 10.0 -4.4 224.5 11.2 -0.5 0.0 13.2 0.0 324.7
Unrealised gains and losses in Unit-Linked
products18.4 0.0 0.0 37.0 4.0 0.0 0.0 0.0 -14.4 45.0
Result of Life business 89.3 10.0 -4.4 261.5 15.1 -0.5 0.0 13.2 -14.4 369.8
41
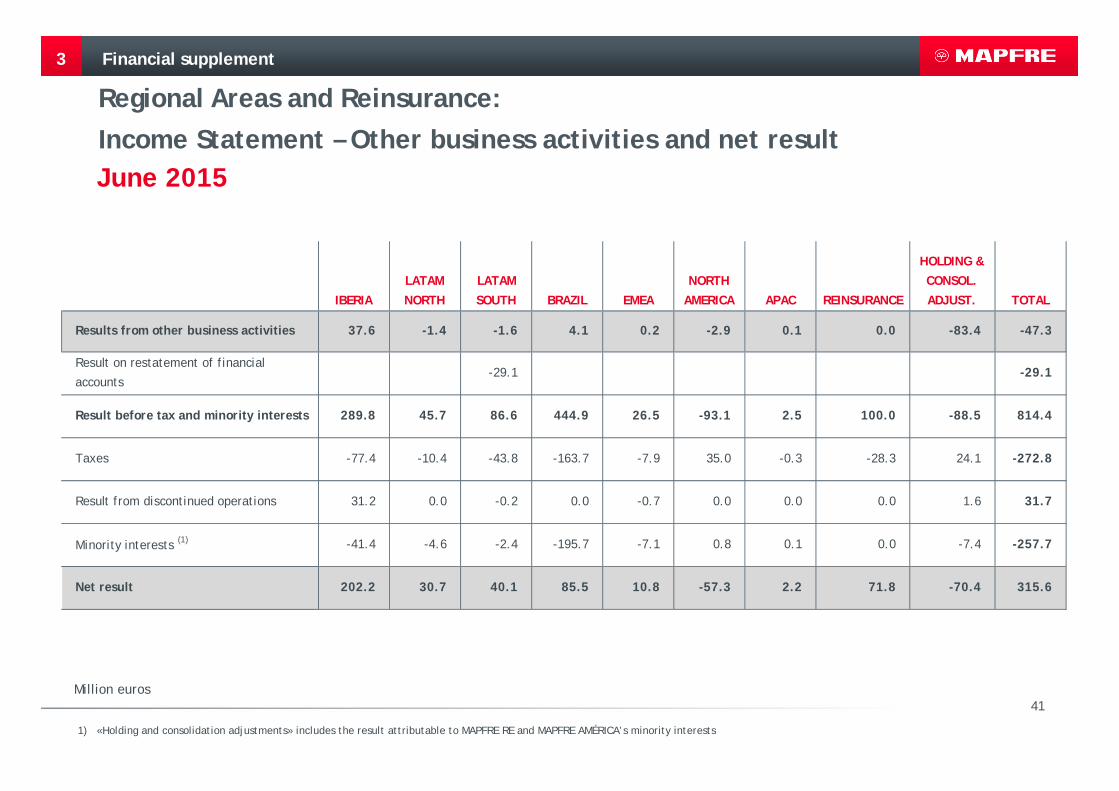
Regional Areas and Reinsurance: Income Statement – Other business activities and net result
3
Million euros
1) «Holding and consolidation adjustments» includes the result attributable to MAPFRE RE and MAPFRE AMÉRICA’s minority interests
June 2015
Financial supplement
IBERIALATAM NORTH
LATAM SOUTH BRAZIL EMEA
NORTH AMERICA APAC REINSURANCE
HOLDING & CONSOL. ADJUST. TOTAL
Results from other business activities 37.6 -1.4 -1.6 4.1 0.2 -2.9 0.1 0.0 -83.4 -47.3
Result on restatement of financial
accounts-29.1 -29.1
Result before tax and minority interests 289.8 45.7 86.6 444.9 26.5 -93.1 2.5 100.0 -88.5 814.4
Taxes -77.4 -10.4 -43.8 -163.7 -7.9 35.0 -0.3 -28.3 24.1 -272.8
Result from discontinued operations 31.2 0.0 -0.2 0.0 -0.7 0.0 0.0 0.0 1.6 31.7
Minority interests (1) -41.4 -4.6 -2.4 -195.7 -7.1 0.8 0.1 0.0 -7.4 -257.7
Net result 202.2 30.7 40.1 85.5 10.8 -57.3 2.2 71.8 -70.4 315.6
42
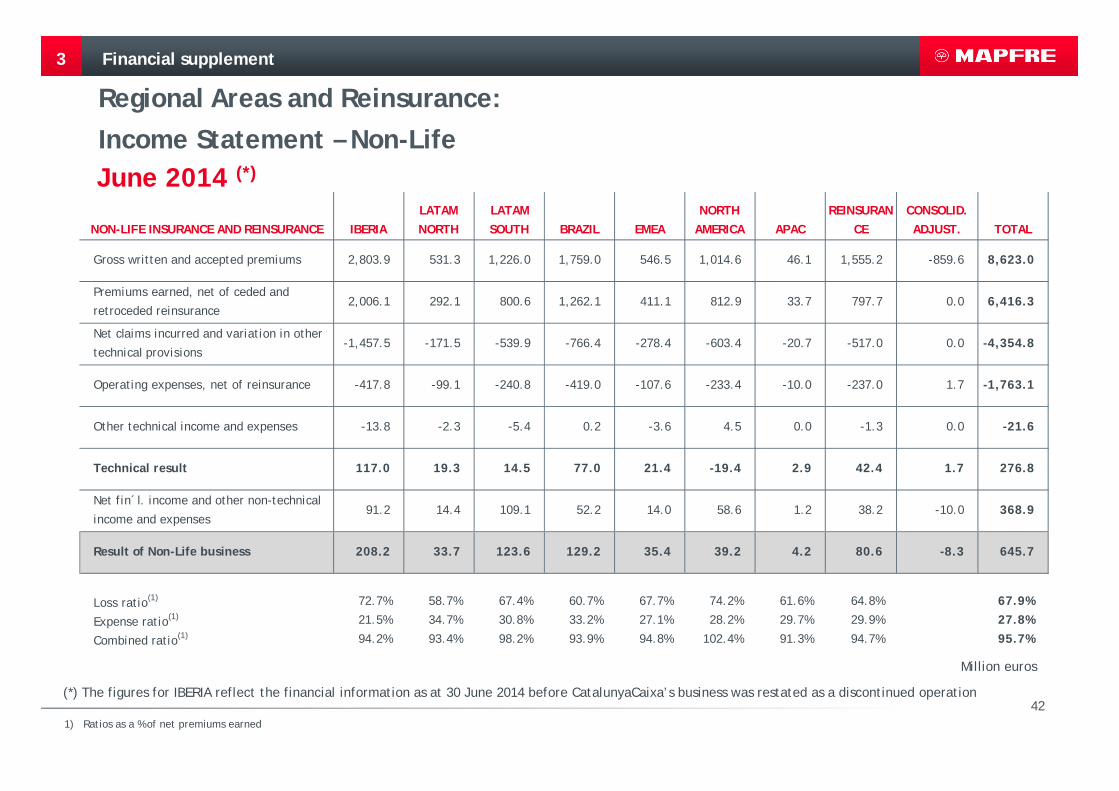
Regional Areas and Reinsurance: Income Statement – Non-Life
3
1) Ratios as a % of net premiums earned
June 2014 (*)
Financial supplement
NON-LIFE INSURANCE AND REINSURANCE IBERIALATAM NORTH
LATAM SOUTH BRAZIL EMEA
NORTH AMERICA APAC
REINSURANCE
CONSOLID. ADJUST. TOTAL
Gross written and accepted premiums 2,803.9 531.3 1,226.0 1,759.0 546.5 1,014.6 46.1 1,555.2 -859.6 8,623.0
Premiums earned, net of ceded and
retroceded reinsurance2,006.1 292.1 800.6 1,262.1 411.1 812.9 33.7 797.7 0.0 6,416.3
Net claims incurred and variation in other
technical provisions-1,457.5 -171.5 -539.9 -766.4 -278.4 -603.4 -20.7 -517.0 0.0 -4,354.8
Operating expenses, net of reinsurance -417.8 -99.1 -240.8 -419.0 -107.6 -233.4 -10.0 -237.0 1.7 -1,763.1
Other technical income and expenses -13.8 -2.3 -5.4 0.2 -3.6 4.5 0.0 -1.3 0.0 -21.6
Technical result 117.0 19.3 14.5 77.0 21.4 -19.4 2.9 42.4 1.7 276.8
Net fin´l. income and other non-technical
income and expenses91.2 14.4 109.1 52.2 14.0 58.6 1.2 38.2 -10.0 368.9
Result of Non-Life business 208.2 33.7 123.6 129.2 35.4 39.2 4.2 80.6 -8.3 645.7
Loss ratio(1) 72.7% 58.7% 67.4% 60.7% 67.7% 74.2% 61.6% 64.8% 67.9%
Expense ratio(1) 21.5% 34.7% 30.8% 33.2% 27.1% 28.2% 29.7% 29.9% 27.8%
Combined ratio(1) 94.2% 93.4% 98.2% 93.9% 94.8% 102.4% 91.3% 94.7% 95.7%
Million euros
(*) The figures for IBERIA reflect the financial information as at 30 June 2014 before CatalunyaCaixa’s business was restated as a discontinued operation

43
Regional Areas and Reinsurance: Income Statement – Life
3
June 2014 (*)
Financial supplement
LIFE INSURANCE AND REINSURANCE IBERIALATAM NORTH
LATAM SOUTH BRAZIL EMEA
NORTH AMERICA APAC
REINSURANCE
CONSOLID. ADJUST. TOTAL
Gross written and accepted premiums 1,494.3 116.2 203.8 946.5 68.6 1.8 0.0 330.4 0.0 3,161.6
Premiums earned, net of ceded and
retroceded reinsurance1,428.0 85.8 161.4 768.0 66.1 1.9 0.0 216.2 0.0 2,727.5
Net claims incurred and variation in other
technical provisions-1,695.8 -55.2 -148.6 -342.2 -108.2 -0.6 0.0 -179.4 0.0 -2,530.0
Operating expenses, net of reinsurance -105.9 -30.1 -34.2 -312.5 -5.8 -1.4 0.0 -51.1 0.0 -541.0
Other technical income and expenses -7.8 -0.3 -0.4 0.0 0.3 0.0 0.0 -0.3 0.0 -8.5
Technical-financial result and other non-technical income
103.7 10.2 8.9 173.2 6.6 0.0 0.0 13.3 0.0 316.0
Unrealised gains and losses in Unit-Linked
products37.4 0.0 0.0 31.9 2.3 0.0 0.0 0.0 -13.8 57.7
Result of Life business 141.1 10.2 8.9 205.1 8.9 0.0 0.0 13.3 -13.8 373.8
Million euros
(*) The figures for IBERIA reflect the financial information as at 30 June 2014 before CatalunyaCaixa’s business was restated as a discontinued operation
44
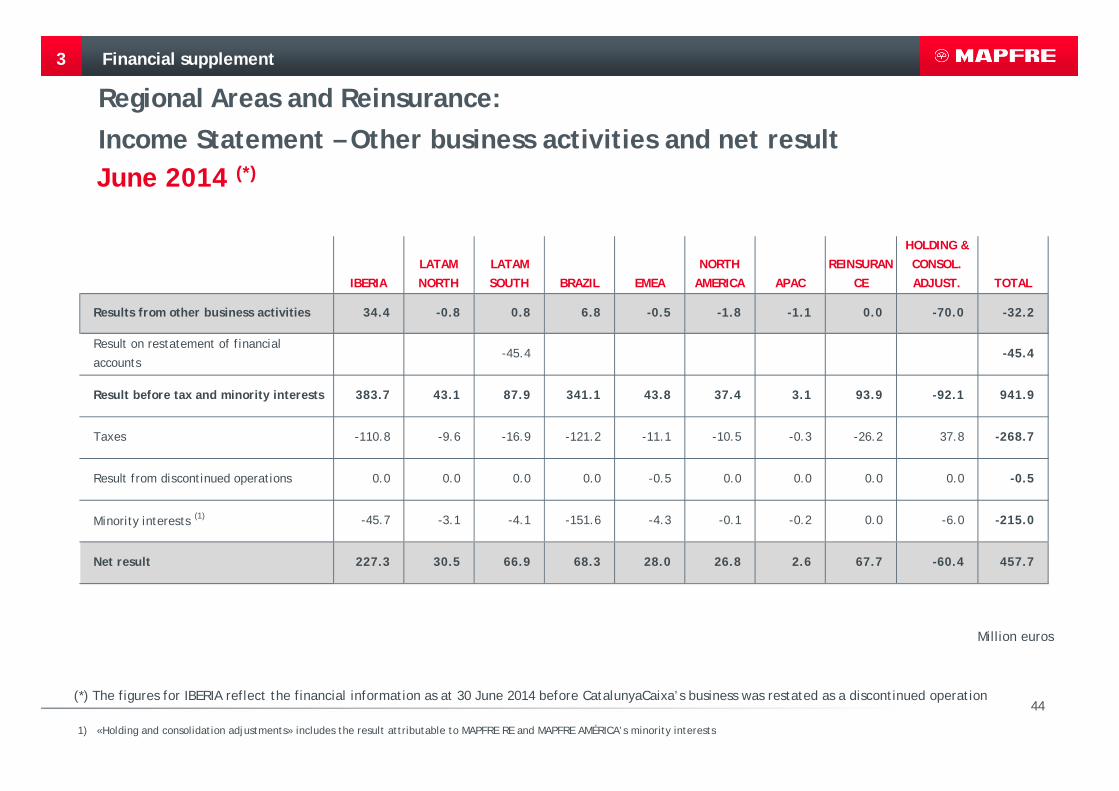
Regional Areas and Reinsurance: Income Statement – Other business activities and net result
3
1) «Holding and consolidation adjustments» includes the result attributable to MAPFRE RE and MAPFRE AMÉRICA’s minority interests
June 2014 (*)
Financial supplement
IBERIALATAM NORTH
LATAM SOUTH BRAZIL EMEA
NORTH AMERICA APAC
REINSURANCE
HOLDING & CONSOL. ADJUST. TOTAL
Results from other business activities 34.4 -0.8 0.8 6.8 -0.5 -1.8 -1.1 0.0 -70.0 -32.2
Result on restatement of financial
accounts-45.4 -45.4
Result before tax and minority interests 383.7 43.1 87.9 341.1 43.8 37.4 3.1 93.9 -92.1 941.9
Taxes -110.8 -9.6 -16.9 -121.2 -11.1 -10.5 -0.3 -26.2 37.8 -268.7
Result from discontinued operations 0.0 0.0 0.0 0.0 -0.5 0.0 0.0 0.0 0.0 -0.5
Minority interests (1) -45.7 -3.1 -4.1 -151.6 -4.3 -0.1 -0.2 0.0 -6.0 -215.0
Net result 227.3 30.5 66.9 68.3 28.0 26.8 2.6 67.7 -60.4 457.7
Million euros
(*) The figures for IBERIA reflect the financial information as at 30 June 2014 before CatalunyaCaixa’s business was restated as a discontinued operation
45
Financial supplement
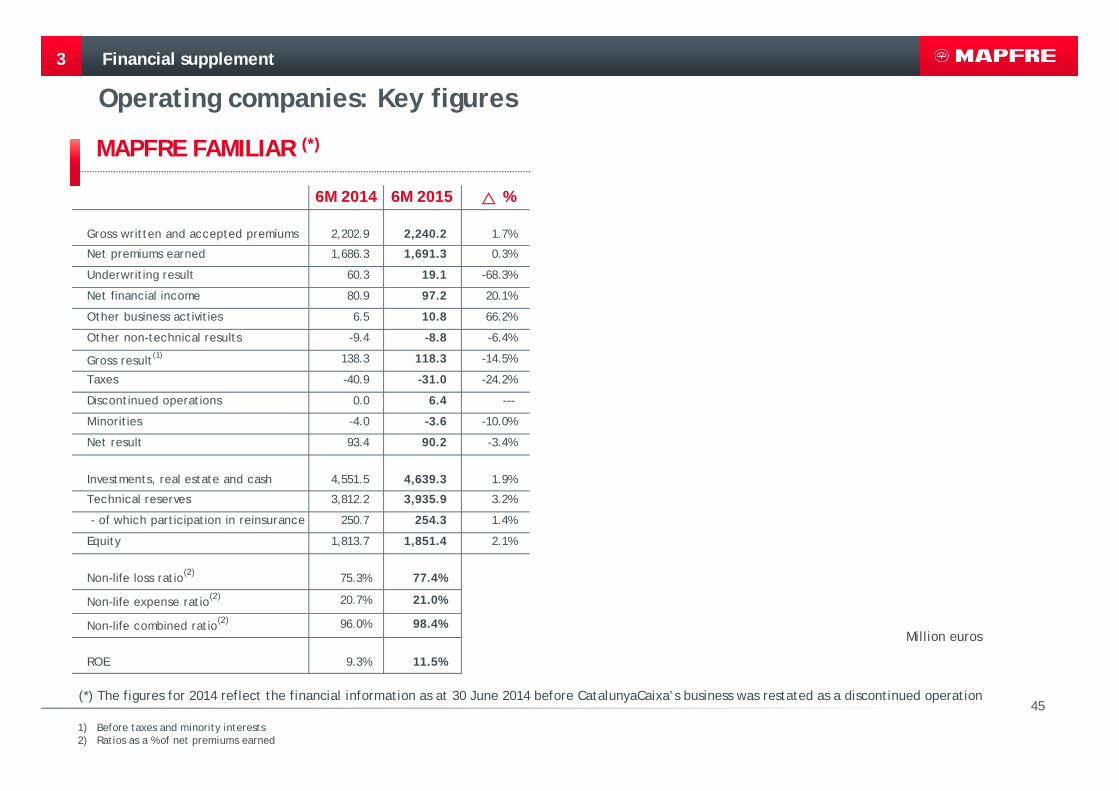
Operating companies: Key figures
3
MAPFRE FAMILIAR (*)
1) Before taxes and minority interests2) Ratios as a % of net premiums earned
6M 2014 6M 2015 %
Gross written and accepted premiums 2,202.9 2,240.2 1.7%
Net premiums earned 1,686.3 1,691.3 0.3%
Underwriting result 60.3 19.1 -68.3%
Net financial income 80.9 97.2 20.1%
Other business activities 6.5 10.8 66.2%
Other non-technical results -9.4 -8.8 -6.4%
Gross result(1) 138.3 118.3 -14.5%
Taxes -40.9 -31.0 -24.2%
Discontinued operations 0.0 6.4 ---
M inorities -4.0 -3.6 -10.0%
Net result 93.4 90.2 -3.4%
Investments, real estate and cash 4,551.5 4,639.3 1.9%
Technical reserves 3,812.2 3,935.9 3.2%
- of which participation in reinsurance 250.7 254.3 1.4%
Equity 1,813.7 1,851.4 2.1%
Non-life loss ratio(2) 75.3% 77.4%
Non-life expense ratio(2) 20.7% 21.0%
Non-life combined ratio(2) 96.0% 98.4%
ROE 9.3% 11.5%
Million euros
(*) The figures for 2014 reflect the financial information as at 30 June 2014 before CatalunyaCaixa’s business was restated as a discontinued operation
46
Financial supplement
Operating companies: Key figures
3
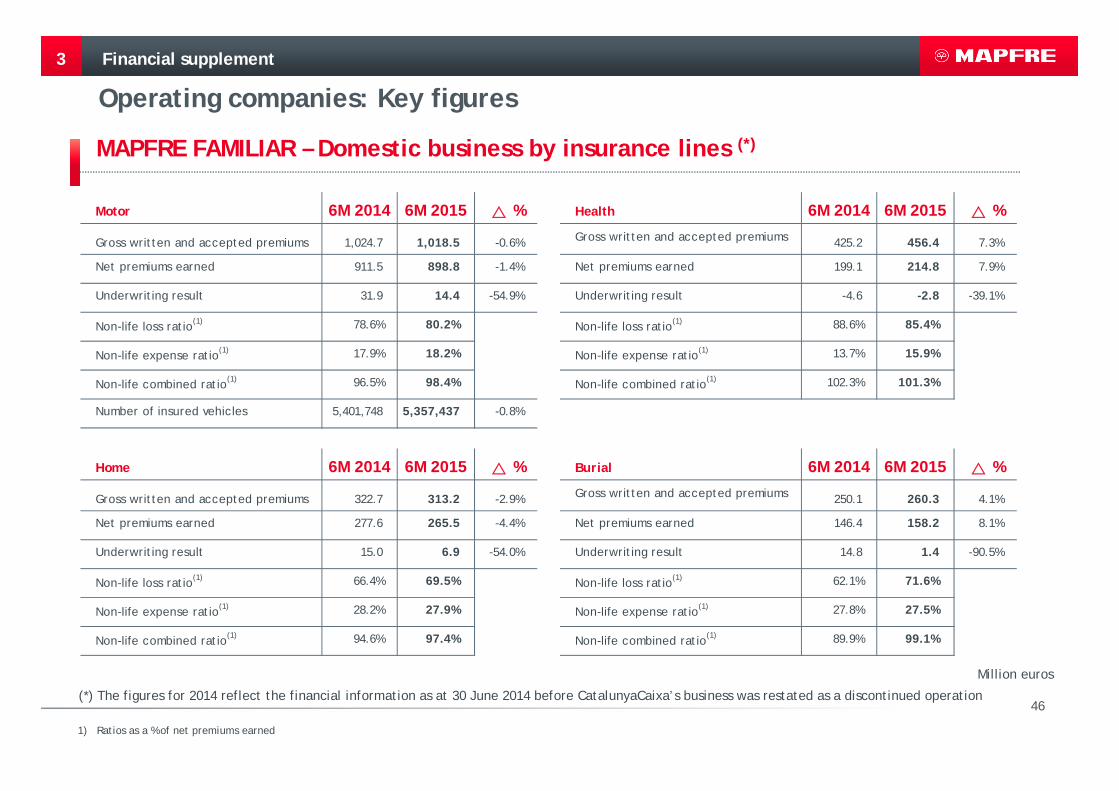
MAPFRE FAMILIAR – Domestic business by insurance lines (*)
1) Ratios as a % of net premiums earned
Motor 6M 2014 6M 2015 %
Gross written and accepted premiums 1,024.7 1,018.5 -0.6%
Net premiums earned 911.5 898.8 -1.4%
Underwriting result 31.9 14.4 -54.9%
Non-life loss ratio(1) 78.6% 80.2%
Non-life expense ratio(1) 17.9% 18.2%
Non-life combined ratio(1) 96.5% 98.4%
Number of insured vehicles 5,401,748 5,357,437 -0.8%
Home 6M 2014 6M 2015 %
Gross written and accepted premiums 322.7 313.2 -2.9%
Net premiums earned 277.6 265.5 -4.4%
Underwriting result 15.0 6.9 -54.0%
Non-life loss ratio(1) 66.4% 69.5%
Non-life expense ratio(1) 28.2% 27.9%
Non-life combined ratio(1) 94.6% 97.4%
Health 6M 2014 6M 2015 %
Gross written and accepted premiums 425.2 456.4 7.3%
Net premiums earned 199.1 214.8 7.9%
Underwriting result -4.6 -2.8 -39.1%
Non-life loss ratio(1) 88.6% 85.4%
Non-life expense ratio(1) 13.7% 15.9%
Non-life combined ratio(1) 102.3% 101.3%
Burial 6M 2014 6M 2015 %
Gross written and accepted premiums 250.1 260.3 4.1%
Net premiums earned 146.4 158.2 8.1%
Underwriting result 14.8 1.4 -90.5%
Non-life loss ratio(1) 62.1% 71.6%
Non-life expense ratio(1) 27.8% 27.5%
Non-life combined ratio(1) 89.9% 99.1%
Million euros
(*) The figures for 2014 reflect the financial information as at 30 June 2014 before CatalunyaCaixa’s business was restated as a discontinued operation
47
Financial supplement
Operating companies: Key figures
3
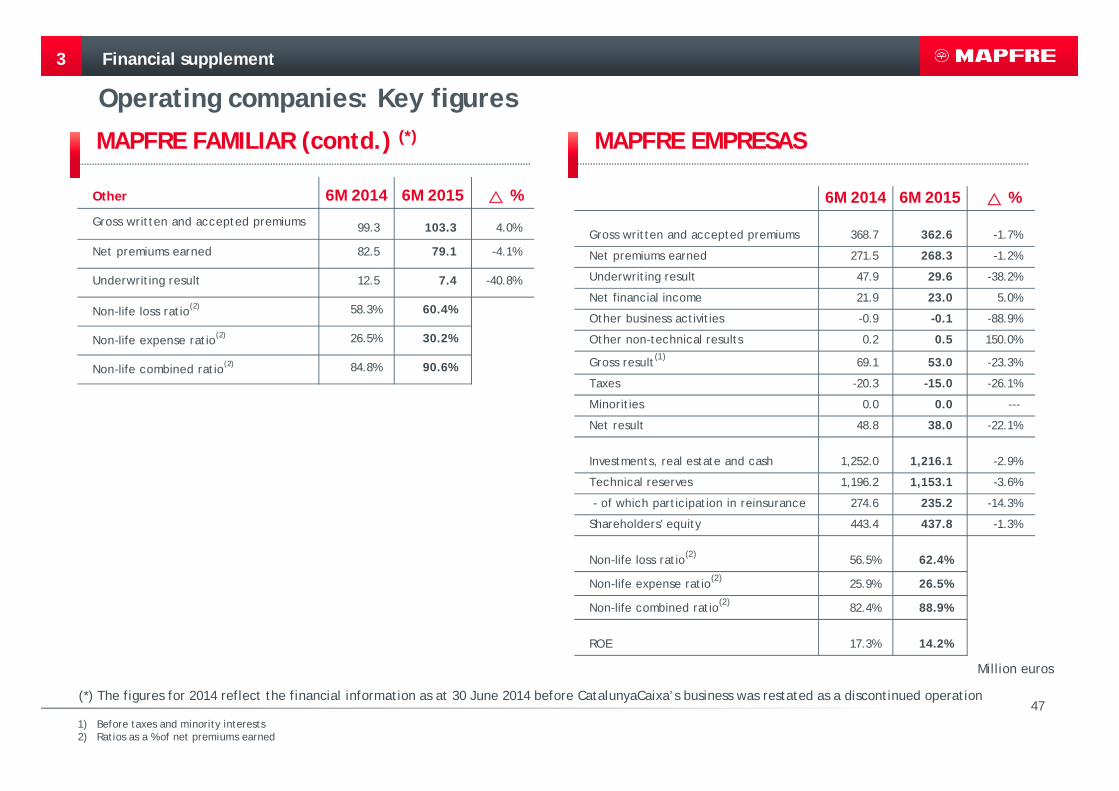
MAPFRE FAMILIAR (contd.) (*) MAPFRE EMPRESAS
1) Before taxes and minority interests2) Ratios as a % of net premiums earned
Other 6M 2014 6M 2015 %
Gross written and accepted premiums 99.3 103.3 4.0%
Net premiums earned 82.5 79.1 -4.1%
Underwriting result 12.5 7.4 -40.8%
Non-life loss ratio(2) 58.3% 60.4%
Non-life expense ratio(2) 26.5% 30.2%
Non-life combined ratio(2) 84.8% 90.6%
6M 2014 6M 2015 %
Gross written and accepted premiums 368.7 362.6 -1.7%
Net premiums earned 271.5 268.3 -1.2%
Underwriting result 47.9 29.6 -38.2%
Net financial income 21.9 23.0 5.0%
Other business activities -0.9 -0.1 -88.9%
Other non-technical results 0.2 0.5 150.0%
Gross result(1) 69.1 53.0 -23.3%
Taxes -20.3 -15.0 -26.1%
Minorities 0.0 0.0 ---
Net result 48.8 38.0 -22.1%
Investments, real estate and cash 1,252.0 1,216.1 -2.9%
Technical reserves 1,196.2 1,153.1 -3.6%
- of which participation in reinsurance 274.6 235.2 -14.3%
Shareholders' equity 443.4 437.8 -1.3%
Non-life loss ratio(2) 56.5% 62.4%
Non-life expense ratio(2) 25.9% 26.5%
Non-life combined ratio(2) 82.4% 88.9%
ROE 17.3% 14.2%
Million euros
(*) The figures for 2014 reflect the financial information as at 30 June 2014 before CatalunyaCaixa’s business was restated as a discontinued operation
48
Financial supplement
Operating companies: Key figures
3
Million euros
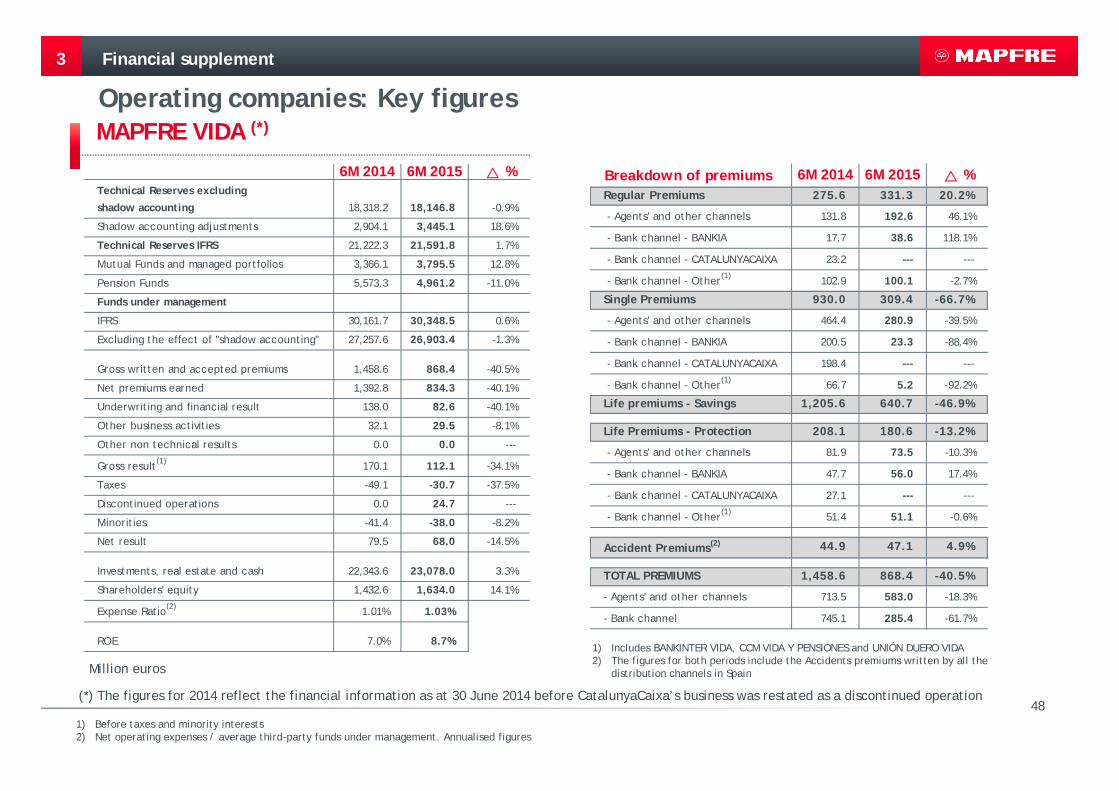
MAPFRE VIDA (*)
1) Before taxes and minority interests2) Net operating expenses / average third-party funds under management. Annualised figures
1) Includes BANKINTER VIDA, CCM VIDA Y PENSIONES and UNIÓN DUERO VIDA2) The figures for both periods include the Accidents premiums written by all the
distribution channels in Spain
6M 2014 6M 2015 %Technical Reserves excluding
shadow accounting 18,318.2 18,146.8 -0.9%
Shadow accounting adjustments 2,904.1 3,445.1 18.6%
Technical Reserves IFRS 21,222.3 21,591.8 1.7%
Mutual Funds and managed portfolios 3,366.1 3,795.5 12.8%
Pension Funds 5,573.3 4,961.2 -11.0%
Funds under management
IFRS 30,161.7 30,348.5 0.6%
Excluding the effect of "shadow accounting" 27,257.6 26,903.4 -1.3%
Gross written and accepted premiums 1,458.6 868.4 -40.5%
Net premiums earned 1,392.8 834.3 -40.1%
Underwriting and financial result 138.0 82.6 -40.1%
Other business activities 32.1 29.5 -8.1%
Other non technical results 0.0 0.0 ---
Gross result(1) 170.1 112.1 -34.1%
Taxes -49.1 -30.7 -37.5%
Discontinued operations 0.0 24.7 ---
Minorities -41.4 -38.0 -8.2%
Net result 79.5 68.0 -14.5%
Investments, real estate and cash 22,343.6 23,078.0 3.3%
Shareholders' equity 1,432.6 1,634.0 14.1%
Expense Ratio(2) 1.01% 1.03%
ROE 7.0% 8.7%
Breakdown of premiums 6M 2014 6M 2015 %Regular Premiums 275.6 331.3 20.2%
- Agents' and other channels 131.8 192.6 46.1%
- Bank channel - BANKIA 17.7 38.6 118.1%
- Bank channel - CATALUNYACAIXA 23.2 --- ---
- Bank channel - Other(1) 102.9 100.1 -2.7%
Single Premiums 930.0 309.4 -66.7%
- Agents' and other channels 464.4 280.9 -39.5%
- Bank channel - BANKIA 200.5 23.3 -88.4%
- Bank channel - CATALUNYACAIXA 198.4 --- ---
- Bank channel - Other(1) 66.7 5.2 -92.2%
Life premiums - Savings 1,205.6 640.7 -46.9%
Life Premiums - Protection 208.1 180.6 -13.2%
- Agents' and other channels 81.9 73.5 -10.3%
- Bank channel - BANKIA 47.7 56.0 17.4%
- Bank channel - CATALUNYACAIXA 27.1 --- ---
- Bank channel - Other(1) 51.4 51.1 -0.6%
Accident Premiums(2) 44.9 47.1 4.9%
TOTAL PREMIUMS 1,458.6 868.4 -40.5%
- Agents' and other channels 713.5 583.0 -18.3%
- Bank channel 745.1 285.4 -61.7%
(*) The figures for 2014 reflect the financial information as at 30 June 2014 before CatalunyaCaixa’s business was restated as a discontinued operation
49
Financial supplement
Operating companies: Key figures
3
Million euros
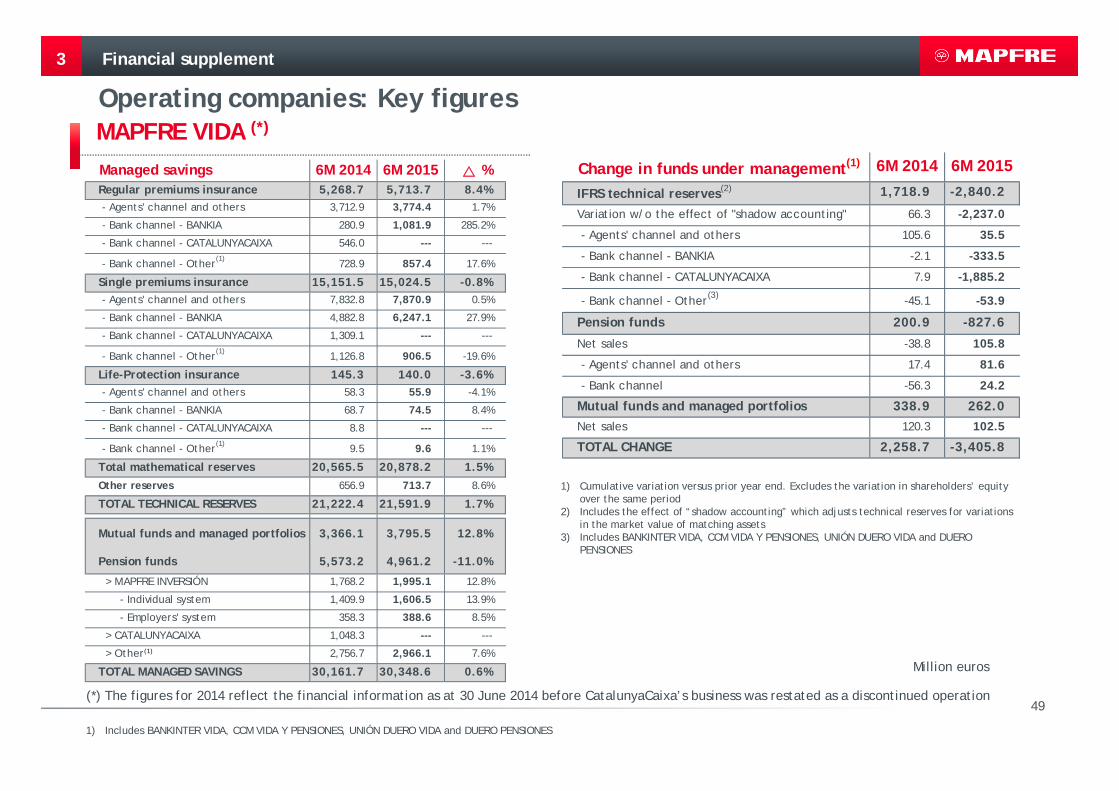
MAPFRE VIDA (*)
1) Includes BANKINTER VIDA, CCM VIDA Y PENSIONES, UNIÓN DUERO VIDA and DUERO PENSIONES
1) Cumulative variation versus prior year end. Excludes the variation in shareholders’ equity over the same period
2) Includes the effect of “shadow accounting” which adjusts technical reserves for variations in the market value of matching assets
3) Includes BANKINTER VIDA, CCM VIDA Y PENSIONES, UNIÓN DUERO VIDA and DUERO PENSIONES
Managed savings 6M 2014 6M 2015 %Regular premiums insurance 5,268.7 5,713.7 8.4% - Agents' channel and others 3,712.9 3,774.4 1.7%
- Bank channel - BANKIA 280.9 1,081.9 285.2%
- Bank channel - CATALUNYACAIXA 546.0 --- ---
- Bank channel - Other(1) 728.9 857.4 17.6%
Single premiums insurance 15,151.5 15,024.5 -0.8% - Agents' channel and others 7,832.8 7,870.9 0.5%
- Bank channel - BANKIA 4,882.8 6,247.1 27.9%
- Bank channel - CATALUNYACAIXA 1,309.1 --- ---
- Bank channel - Other(1) 1,126.8 906.5 -19.6%
Life-Protection insurance 145.3 140.0 -3.6% - Agents' channel and others 58.3 55.9 -4.1%
- Bank channel - BANKIA 68.7 74.5 8.4%
- Bank channel - CATALUNYACAIXA 8.8 --- ---
- Bank channel - Other(1) 9.5 9.6 1.1%
Total mathematical reserves 20,565.5 20,878.2 1.5%Other reserves 656.9 713.7 8.6%
TOTAL TECHNICAL RESERVES 21,222.4 21,591.9 1.7%
Mutual funds and managed portfolios 3,366.1 3,795.5 12.8%
Pension funds 5,573.2 4,961.2 -11.0%
> MAPFRE INVERSIÓN 1,768.2 1,995.1 12.8%
- Individual system 1,409.9 1,606.5 13.9%
- Employers' system 358.3 388.6 8.5%
> CATALUNYACAIXA 1,048.3 --- ---
> Other(1) 2,756.7 2,966.1 7.6%
TOTAL MANAGED SAVINGS 30,161.7 30,348.6 0.6%
Change in funds under management(1) 6M 2014 6M 2015
IFRS technical reserves(2) 1,718.9 -2,840.2
Variation w/o the effect of "shadow accounting" 66.3 -2,237.0
- Agents' channel and others 105.6 35.5
- Bank channel - BANKIA -2.1 -333.5
- Bank channel - CATALUNYACAIXA 7.9 -1,885.2
- Bank channel - Other(3) -45.1 -53.9
Pension funds 200.9 -827.6
Net sales -38.8 105.8
- Agents' channel and others 17.4 81.6
- Bank channel -56.3 24.2
Mutual funds and managed portfolios 338.9 262.0Net sales 120.3 102.5
TOTAL CHANGE 2,258.7 -3,405.8
(*) The figures for 2014 reflect the financial information as at 30 June 2014 before CatalunyaCaixa’s business was restated as a discontinued operation
50
3
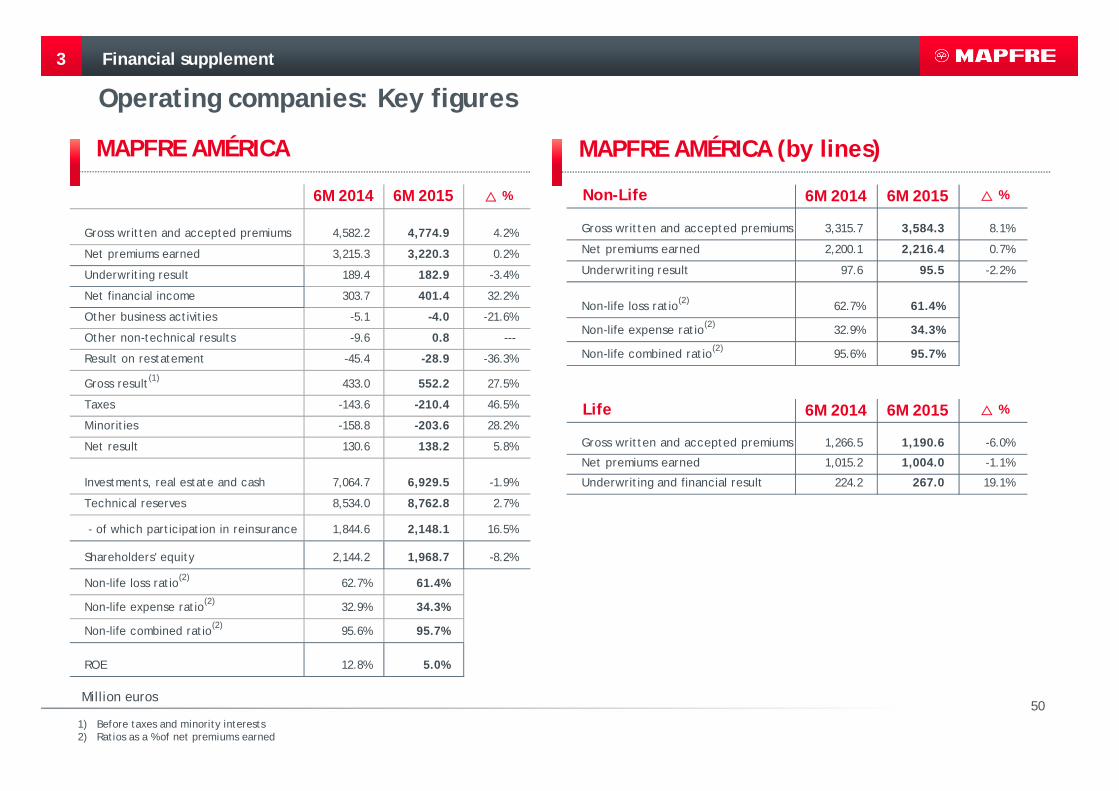
MAPFRE AMÉRICA MAPFRE AMÉRICA (by lines)
Financial supplement
Operating companies: Key figures
Million euros
1) Before taxes and minority interests2) Ratios as a % of net premiums earned
6M 2014 6M 2015 %
Gross written and accepted premiums 4,582.2 4,774.9 4.2%
Net premiums earned 3,215.3 3,220.3 0.2%
Underwriting result 189.4 182.9 -3.4%
Net financial income 303.7 401.4 32.2%
Other business activities -5.1 -4.0 -21.6%
Other non-technical results -9.6 0.8 ---
Result on restatement -45.4 -28.9 -36.3%
Gross result(1) 433.0 552.2 27.5%
Taxes -143.6 -210.4 46.5%
Minorities -158.8 -203.6 28.2%
Net result 130.6 138.2 5.8%
Investments, real estate and cash 7,064.7 6,929.5 -1.9%
Technical reserves 8,534.0 8,762.8 2.7%
- of which participation in reinsurance 1,844.6 2,148.1 16.5%
Shareholders' equity 2,144.2 1,968.7 -8.2%
Non-life loss ratio(2) 62.7% 61.4%
Non-life expense ratio(2) 32.9% 34.3%
Non-life combined ratio(2) 95.6% 95.7%
ROE 12.8% 5.0%
Non-Life 6M 2014 6M 2015 %
Gross written and accepted premiums 3,315.7 3,584.3 8.1%
Net premiums earned 2,200.1 2,216.4 0.7%
Underwriting result 97.6 95.5 -2.2%
Non-life loss ratio(2) 62.7% 61.4%
Non-life expense ratio(2) 32.9% 34.3%
Non-life combined ratio(2) 95.6% 95.7%
Life 6M 2014 6M 2015 %
Gross written and accepted premiums 1,266.5 1,190.6 -6.0%
Net premiums earned 1,015.2 1,004.0 -1.1%
Underwriting and financial result 224.2 267.0 19.1%

51
Financial supplement
Operating companies: Key figures
3
Million euros
MAPFRE BRASIL MAPFRE BRASIL (by lines)
1) Before taxes and minority interests2) Excluding minority interests3) Ratios as a % of net premiums earned
4) Includes Unit-Linked products (amounting to €705.2 and €654.6 million in 6M 2014 and 6M 2015, respectively)
6M 2014 6M 2015 %
Gross written and accepted premiums 2,636.9 2,432.1 -7.8%
Net premiums earned 2,001.2 2,068.9 3.4%
Underwriting result 186.0 212.5 14.2%
Net financial income 143.1 224.8 57.1%
Other business activities 7.4 6.0 -18.9%
Other non-technical results 0.0 0.0 ---
Gross result(1) 336.5 443.2 31.7%
Taxes -119.9 -163.8 36.6%
Minorities -151.6 -196.7 29.7%
Net result 65.0 82.7 27.2%
Investments, real estate and cash(4) 4,112.3 3,917.5 -4.7%
Technical reserves(4) 5,170.4 5,057.9 -2.2%
- of which participation in reinsurance 698.2 726.7 4.1%
Shareholders' equity(2) 1,282.8 1,198.7 -6.6%
Non-life loss ratio(3) 60.8% 60.7%
Non-life expense ratio(3) 33.3% 33.1%
Non-life combined ratio(3) 94.1% 93.8%
ROE 12.7% 13.1%
Non-Life 6M 2014 6M 2015 %Gross written and accepted premiums 1,690.4 1,542.2 -8.8%
Net premiums earned 1,233.2 1,296.6 5.1%
Underwriting result 72.7 80.0 10.0%
Non-life loss ratio(3) 60.8% 60.7%
Non-life expense ratio(3) 33.3% 33.1%
Non-life combined ratio(3) 94.1% 93.8%
Life 6M 2014 6M 2015 %Gross written and accepted premiums 946.5 889.9 -6.0%
Net premiums earned 768.0 772.2 0.5%
Underwriting and financial result 205.1 261.5 27.5%
52
3
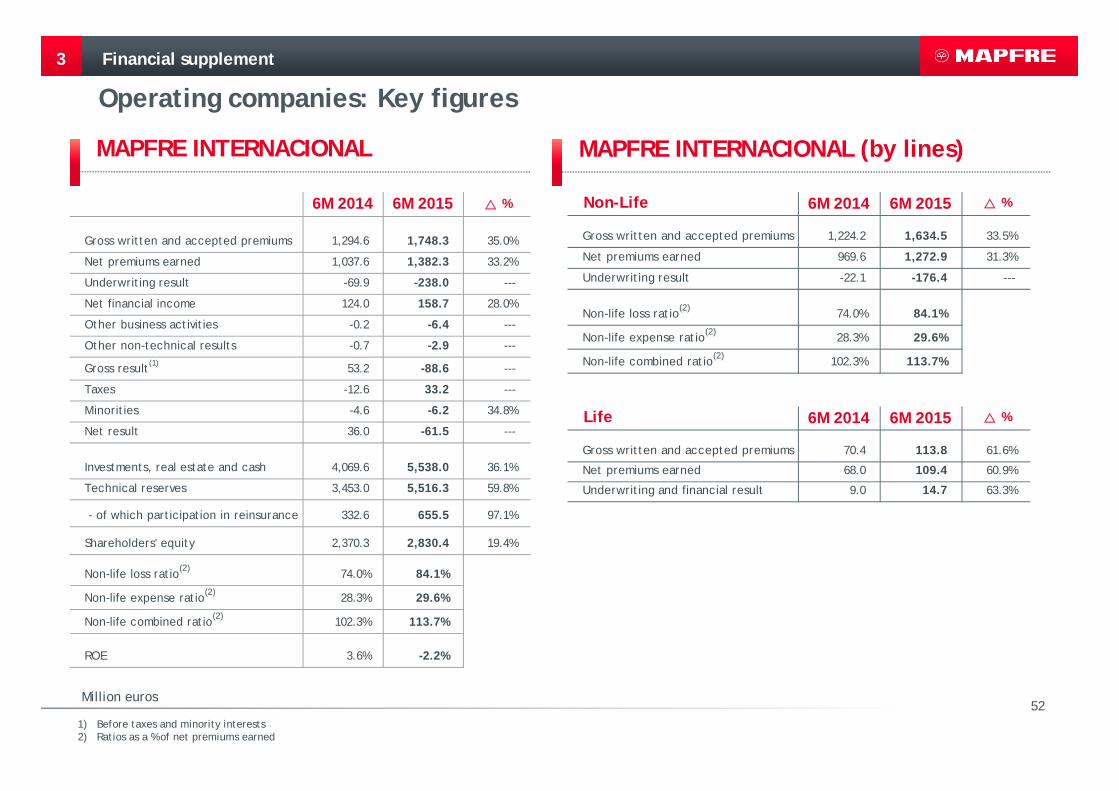
MAPFRE INTERNACIONAL MAPFRE INTERNACIONAL (by lines)
Financial supplement
Operating companies: Key figures
Million euros
1) Before taxes and minority interests2) Ratios as a % of net premiums earned
6M 2014 6M 2015 %
Gross written and accepted premiums 1,294.6 1,748.3 35.0%
Net premiums earned 1,037.6 1,382.3 33.2%
Underwriting result -69.9 -238.0 ---
Net financial income 124.0 158.7 28.0%
Other business activities -0.2 -6.4 ---
Other non-technical results -0.7 -2.9 ---
Gross result(1) 53.2 -88.6 ---
Taxes -12.6 33.2 ---
Minorities -4.6 -6.2 34.8%
Net result 36.0 -61.5 ---
Investments, real estate and cash 4,069.6 5,538.0 36.1%
Technical reserves 3,453.0 5,516.3 59.8%
- of which participation in reinsurance 332.6 655.5 97.1%
Shareholders' equity 2,370.3 2,830.4 19.4%
Non-life loss ratio(2) 74.0% 84.1%
Non-life expense ratio(2) 28.3% 29.6%
Non-life combined ratio(2) 102.3% 113.7%
ROE 3.6% -2.2%
Non-Life 6M 2014 6M 2015 %
Gross written and accepted premiums 1,224.2 1,634.5 33.5%
Net premiums earned 969.6 1,272.9 31.3%
Underwriting result -22.1 -176.4 ---
Non-life loss ratio(2) 74.0% 84.1%
Non-life expense ratio(2) 28.3% 29.6%
Non-life combined ratio(2) 102.3% 113.7%
Life 6M 2014 6M 2015 %
Gross written and accepted premiums 70.4 113.8 61.6%
Net premiums earned 68.0 109.4 60.9%
Underwriting and financial result 9.0 14.7 63.3%
53
Financial supplement
Operating companies: Key figures
3
Million euros
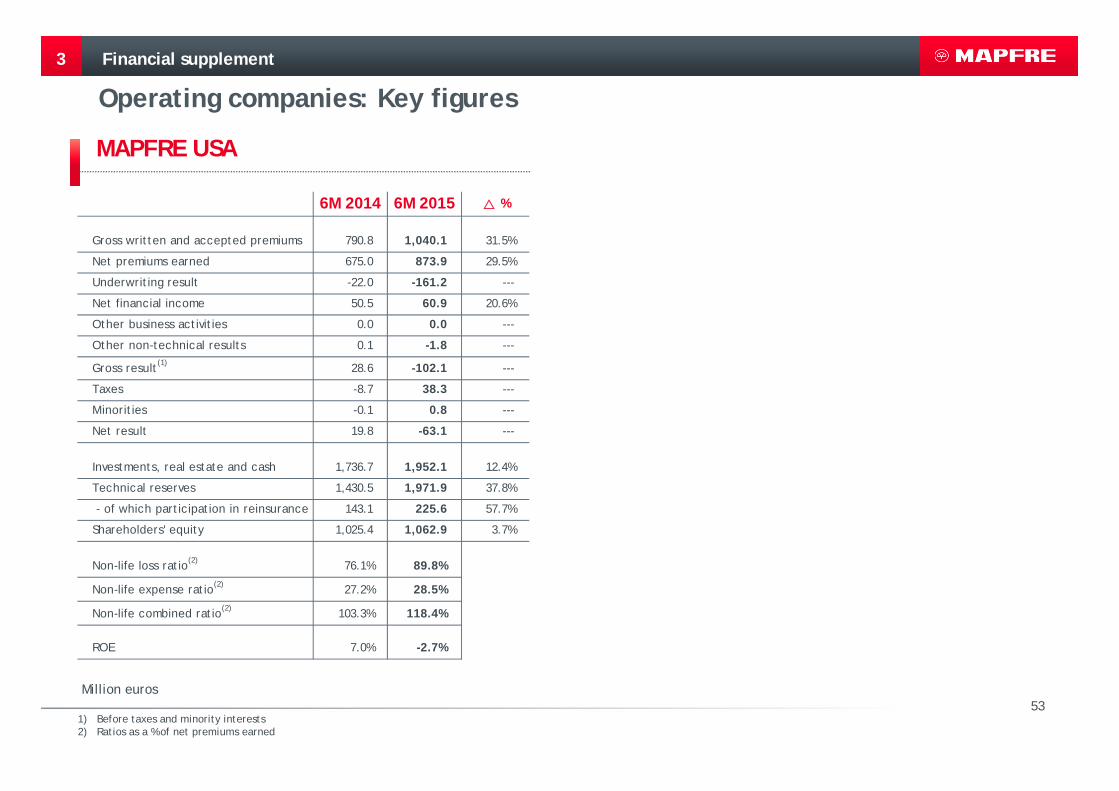
MAPFRE USA
1) Before taxes and minority interests2) Ratios as a % of net premiums earned
6M 2014 6M 2015 %
Gross written and accepted premiums 790.8 1,040.1 31.5%
Net premiums earned 675.0 873.9 29.5%
Underwriting result -22.0 -161.2 ---
Net financial income 50.5 60.9 20.6%
Other business activities 0.0 0.0 ---
Other non-technical results 0.1 -1.8 ---
Gross result(1) 28.6 -102.1 ---
Taxes -8.7 38.3 ---
M inorities -0.1 0.8 ---
Net result 19.8 -63.1 ---
Investments, real estate and cash 1,736.7 1,952.1 12.4%
Technical reserves 1,430.5 1,971.9 37.8%
- of which participation in reinsurance 143.1 225.6 57.7%
Shareholders' equity 1,025.4 1,062.9 3.7%
Non-life loss ratio(2) 76.1% 89.8%
Non-life expense ratio(2) 27.2% 28.5%
Non-life combined ratio(2) 103.3% 118.4%
ROE 7.0% -2.7%

54
Financial supplement
Operating companies: Key figures
3
Million euros
1) Before taxes and minority interests2) Ratios as a % of net premiums earned
MAPFRE RE MAPFRE RE (by lines)
6M 2014 6M 2015 %
Gross written and accepted premiums 1,885.6 2,035.8 8.0%
Net premiums earned 1,013.9 1,217.2 20.1%
Underwriting result 27.7 14.5 -47.7%
Net financial income 66.3 87.4 31.8%
Other business activities 0.0 0.0 ---
Other non-technical results -0.1 -1.9 ---
Gross result(1) 93.9 100.0 6.5%
Taxes -26.2 -28.3 8.0%
Minorities 0.0 0.0 ---
Net result 67.7 71.8 6.1%
Investments, real estate and cash 3,839.7 4,075.0 6.1%
Technical reserves 3,460.6 3,651.3 5.5%
- of which participation in reinsurance 836.4 832.3 -0.5%
Shareholders' equity 1,152.7 1,205.4 4.6%
Non-life loss ratio(2) 64.8% 67.5%
Non-life expense ratio(2) 29.9% 27.5%
Non-life combined ratio(2) 94.7% 95.0%
ROE 10.8% 12.4%
Non-Life 6M 2014 6M 2015 %
Gross written and accepted premiums 1,555.2 1,663.8 7.0%
Net premiums earned 797.7 982.8 23.2%
Underwriting result 42.4 46.0 8.5%
Non-life loss ratio(2) 64.8% 67.5%
Non-life expense ratio(2) 29.9% 27.5%
Non-life combined ratio(2) 94.7% 95.0%
Life 6M 2014 6M 2015 %
Gross written and accepted premiums 330.4 372.0 12.6%
Net premiums earned 216.2 234.4 8.4%
Underwriting and financial result 13.3 13.1 -1.5%
55
Financial supplement
Operating companies: Key figures
3
Million euros
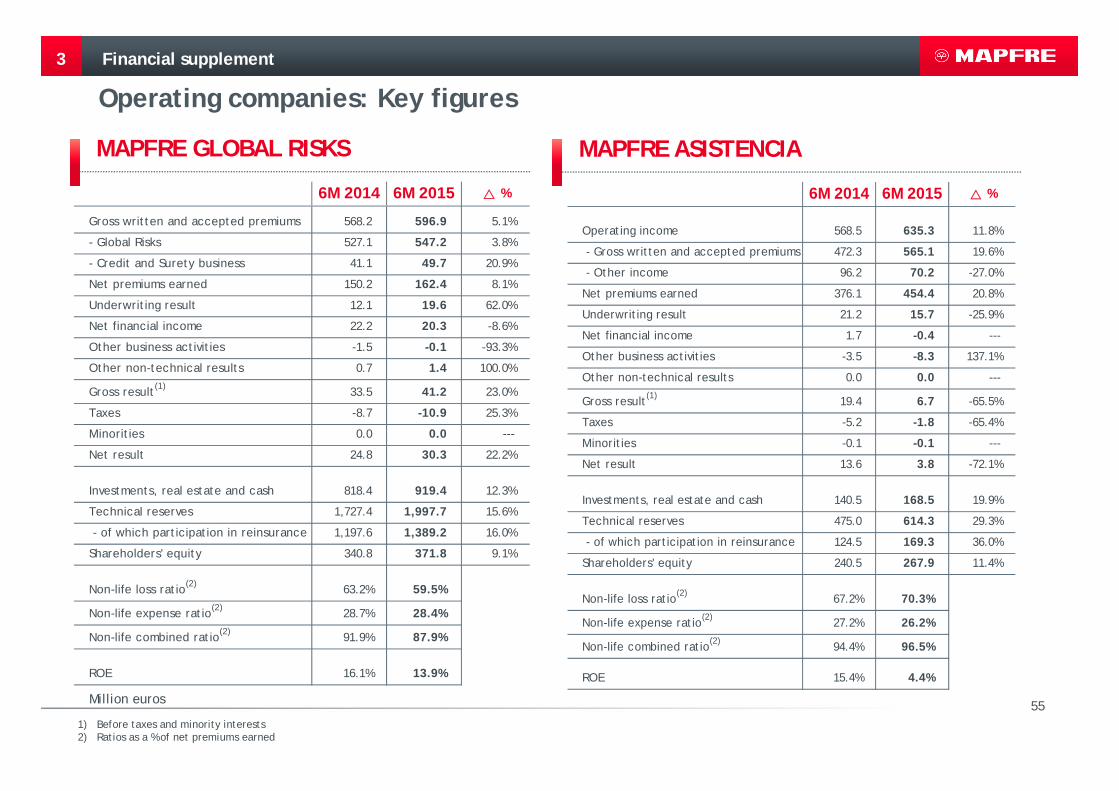
MAPFRE GLOBAL RISKS
1) Before taxes and minority interests2) Ratios as a % of net premiums earned
MAPFRE ASISTENCIA
6M 2014 6M 2015 %
Gross written and accepted premiums 568.2 596.9 5.1%
- Global Risks 527.1 547.2 3.8%
- Credit and Surety business 41.1 49.7 20.9%
Net premiums earned 150.2 162.4 8.1%
Underwriting result 12.1 19.6 62.0%
Net financial income 22.2 20.3 -8.6%
Other business activities -1.5 -0.1 -93.3%
Other non-technical results 0.7 1.4 100.0%
Gross result(1) 33.5 41.2 23.0%
Taxes -8.7 -10.9 25.3%
Minorities 0.0 0.0 ---
Net result 24.8 30.3 22.2%
Investments, real estate and cash 818.4 919.4 12.3%
Technical reserves 1,727.4 1,997.7 15.6%
- of which participation in reinsurance 1,197.6 1,389.2 16.0%
Shareholders' equity 340.8 371.8 9.1%
Non-life loss ratio(2) 63.2% 59.5%
Non-life expense ratio(2) 28.7% 28.4%
Non-life combined ratio(2) 91.9% 87.9%
ROE 16.1% 13.9%
6M 2014 6M 2015 %
Operating income 568.5 635.3 11.8%
- Gross written and accepted premiums 472.3 565.1 19.6%
- Other income 96.2 70.2 -27.0%
Net premiums earned 376.1 454.4 20.8%
Underwriting result 21.2 15.7 -25.9%
Net financial income 1.7 -0.4 ---
Other business activities -3.5 -8.3 137.1%
Other non-technical results 0.0 0.0 ---
Gross result(1) 19.4 6.7 -65.5%
Taxes -5.2 -1.8 -65.4%
Minorities -0.1 -0.1 ---
Net result 13.6 3.8 -72.1%
Investments, real estate and cash 140.5 168.5 19.9%
Technical reserves 475.0 614.3 29.3%
- of which participation in reinsurance 124.5 169.3 36.0%
Shareholders' equity 240.5 267.9 11.4%
Non-life loss ratio(2) 67.2% 70.3%
Non-life expense ratio(2) 27.2% 26.2%
Non-life combined ratio(2) 94.4% 96.5%
ROE 15.4% 4.4%
56
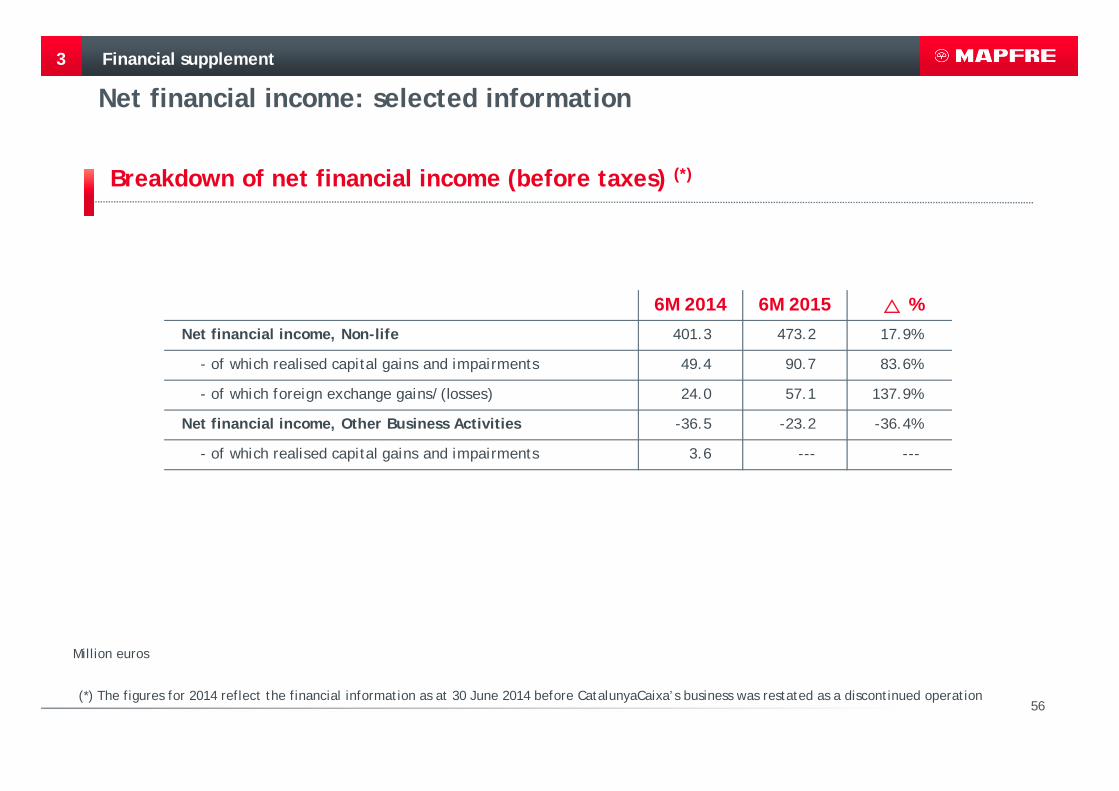
Net financial income: selected information
3
Breakdown of net financial income (before taxes) (*)
Million euros
Financial supplement
6M 2014 6M 2015 %Net financial income, Non-life 401.3 473.2 17.9%
- of which realised capital gains and impairments 49.4 90.7 83.6%
- of which foreign exchange gains/(losses) 24.0 57.1 137.9%
Net financial income, Other Business Activities -36.5 -23.2 -36.4%
- of which realised capital gains and impairments 3.6 --- ---
(*) The figures for 2014 reflect the financial information as at 30 June 2014 before CatalunyaCaixa’s business was restated as a discontinued operation
57
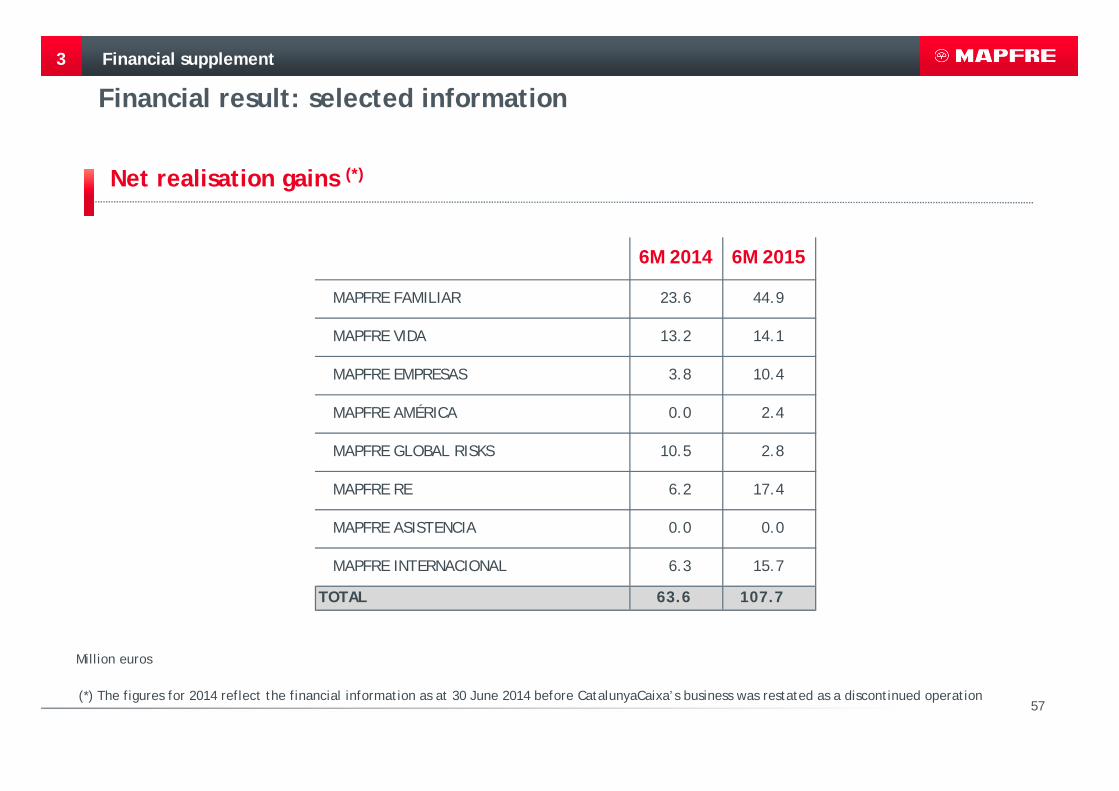
Financial result: selected information
3
Net realisation gains (*)
Million euros
Financial supplement
6M 2014 6M 2015
MAPFRE FAMILIAR 23.6 44.9
MAPFRE VIDA 13.2 14.1
MAPFRE EMPRESAS 3.8 10.4
MAPFRE AMÉRICA 0.0 2.4
MAPFRE GLOBAL RISKS 10.5 2.8
MAPFRE RE 6.2 17.4
MAPFRE ASISTENCIA 0.0 0.0
MAPFRE INTERNACIONAL 6.3 15.7
TOTAL 63.6 107.7
(*) The figures for 2014 reflect the financial information as at 30 June 2014 before CatalunyaCaixa’s business was restated as a discontinued operation
58
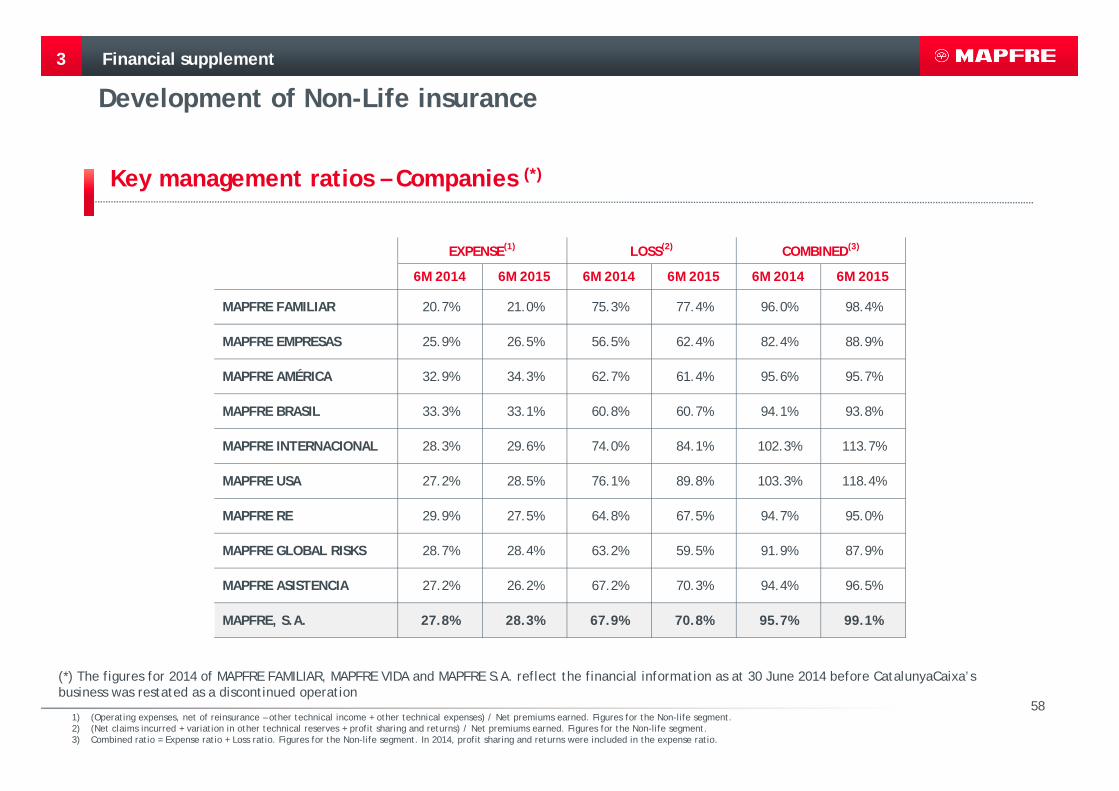
Development of Non-Life insurance
3
Key management ratios – Companies (*)
1) (Operating expenses, net of reinsurance – other technical income + other technical expenses) / Net premiums earned. Figures for the Non-life segment.2) (Net claims incurred + variation in other technical reserves + profit sharing and returns) / Net premiums earned. Figures for the Non-life segment.3) Combined ratio = Expense ratio + Loss ratio. Figures for the Non-life segment. In 2014, profit sharing and returns were included in the expense ratio.
Financial supplement
6M 2014 6M 2015 6M 2014 6M 2015 6M 2014 6M 2015
MAPFRE FAMILIAR 20.7% 21.0% 75.3% 77.4% 96.0% 98.4%
MAPFRE EMPRESAS 25.9% 26.5% 56.5% 62.4% 82.4% 88.9%
MAPFRE AMÉRICA 32.9% 34.3% 62.7% 61.4% 95.6% 95.7%
MAPFRE BRASIL 33.3% 33.1% 60.8% 60.7% 94.1% 93.8%
MAPFRE INTERNACIONAL 28.3% 29.6% 74.0% 84.1% 102.3% 113.7%
MAPFRE USA 27.2% 28.5% 76.1% 89.8% 103.3% 118.4%
MAPFRE RE 29.9% 27.5% 64.8% 67.5% 94.7% 95.0%
MAPFRE GLOBAL RISKS 28.7% 28.4% 63.2% 59.5% 91.9% 87.9%
MAPFRE ASISTENCIA 27.2% 26.2% 67.2% 70.3% 94.4% 96.5%
MAPFRE, S.A. 27.8% 28.3% 67.9% 70.8% 95.7% 99.1%
EXPENSE(1) LOSS(2) COMBINED(3)
(*) The figures for 2014 of MAPFRE FAMILIAR, MAPFRE VIDA and MAPFRE S.A. reflect the financial information as at 30 June 2014 before CatalunyaCaixa’sbusiness was restated as a discontinued operation
59
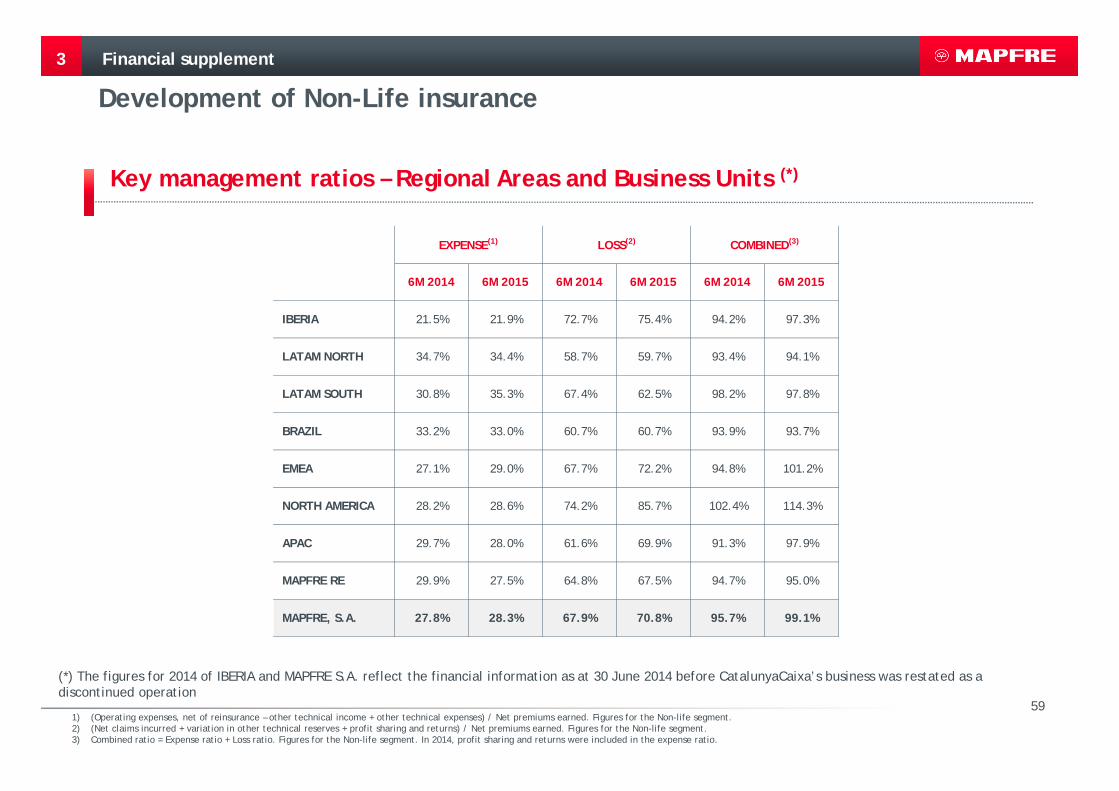
Development of Non-Life insurance
3
Key management ratios – Regional Areas and Business Units (*)
Financial supplement
(*) The figures for 2014 of IBERIA and MAPFRE S.A. reflect the financial information as at 30 June 2014 before CatalunyaCaixa’s business was restated as a discontinued operation
1) (Operating expenses, net of reinsurance – other technical income + other technical expenses) / Net premiums earned. Figures for the Non-life segment.2) (Net claims incurred + variation in other technical reserves + profit sharing and returns) / Net premiums earned. Figures for the Non-life segment.3) Combined ratio = Expense ratio + Loss ratio. Figures for the Non-life segment. In 2014, profit sharing and returns were included in the expense ratio.
6M 2014 6M 2015 6M 2014 6M 2015 6M 2014 6M 2015
IBERIA 21.5% 21.9% 72.7% 75.4% 94.2% 97.3%
LATAM NORTH 34.7% 34.4% 58.7% 59.7% 93.4% 94.1%
LATAM SOUTH 30.8% 35.3% 67.4% 62.5% 98.2% 97.8%
BRAZIL 33.2% 33.0% 60.7% 60.7% 93.9% 93.7%
EMEA 27.1% 29.0% 67.7% 72.2% 94.8% 101.2%
NORTH AMERICA 28.2% 28.6% 74.2% 85.7% 102.4% 114.3%
APAC 29.7% 28.0% 61.6% 69.9% 91.3% 97.9%
MAPFRE RE 29.9% 27.5% 64.8% 67.5% 94.7% 95.0%
MAPFRE, S.A. 27.8% 28.3% 67.9% 70.8% 95.7% 99.1%
COMBINED(3)EXPENSE(1) LOSS(2)
60
Contents
1 Key highlights
2 Consolidated financial information
34
Financial supplement
Schedule and contacts

61
Schedule and contacts
Schedule
4
24-Jul-2015 MadridRelease First Half 2015 Results
Conference Call - First Half 2015 Results
14-Oct to 3-Nov Black-out period
4-Nov-2015 MadridRelease Third Quarter 2015 Results
Conference Call – Third Quarter 2015 Results
5-Nov-2015 London Presentation to analysts – Third Quarter 2015 Results
62
Schedule and contacts
Investor Relations Department
4
Luigi Lubelli Deputy General Manager – Finance +34-91-581-6071
Natalia Núñez AranaDeputy Director Capital Markets
Head of Investor Relations +34-91-581-8664
Antonio Triguero Sánchez Investor Relations +34-91-581-5211
Alberto Fernández-Sanguino Investor Relations +34-91-581-2255
Leandra Elizabeth Clark Investor Relations +34-91-581-3773
Marisa Godino Alvarez Assistant +34-91-581-2985
MAPFRE S.A.Investor Relations DepartmentCarretera de Pozuelo, nº 5228222 [email protected]
63
Disclaimer
This document is purely informative. Its content does not constitute, nor can it be interpreted as, an offer or an invitationto sell, exchange or buy, and it is not binding on the issuer in any way. The information about the plans of the Company, itsevolution, its results and its dividends represents a simple forecast whose formulation does not represent a guarantee with respect to the future performance of the Company or the achievement of its targets or estimated results. The recipients of this information must be aware that the preparation of these forecasts is based on assumptions and estimates, which are subject to a high degree of uncertainty, and that, due to multiple factors, future results may differ materially from expected results. Among such factors, the following are worth highlighting: the development of the insurance market and the general economic situation of those countries where the Group operates; circumstances which may affect the competitiveness of insurance products and services; changes in the basis of calculation of mortality and morbidity tables which may affect the insurance activities of the Life and Health segments; frequency and severity of claims covered; effectiveness of the Groups reinsurance policies and fluctuations in the cost and availability of covers offered by third party reinsurers; changes in the legal environment; adverse legal actions; changes in monetary policy; variations in interest ratesand exchange rates; fluctuations in liquidity and the value and profitability of assets which make up the investment portfolio; restrictions in the access to third party financing.
MAPFRE S.A. does not undertake to update or revise periodically the content of this document.


![Presentation to Analysts /Institutional Investors [Company Update]](https://static.documents.pub/doc/80x56/577c7cfb1a28abe0549ce0ff/presentation-to-analysts-institutional-investors-company-update.jpg)

![Analysts/ Institutional Investors Presentation [Company Update]](https://static.documents.pub/doc/80x56/577ca7741a28abea748c67cb/analysts-institutional-investors-presentation-company-update.jpg)

