DEVELOPMENT OF HALAL TESTING METHOD TO DIFFERENTIATE THE GELATIN FROM DIFFERENT SOURCES USING AN RP-HPLC INCORPORATED WITH PRINCIPAL COMPONENT ANALYSIS Presented by; AZILAWATI MOHD ISMAIL FOOD TECHNOLOGIST MALAYSIA HALAL ANALYSIS CENTRE (MYHAC), HALAL HUB DIVISION, JAKIM
Transcript
DEVELOPMENT OF HALAL TESTING METHOD TO DIFFERENTIATE THE GELATIN FROM DIFFERENT SOURCES USING AN RP-HPLC INCORPORATED
WITH PRINCIPAL COMPONENT ANALYSIS
Presented by;AZILAWATI MOHD ISMAILFOOD TECHNOLOGISTMALAYSIA HALAL ANALYSIS CENTRE (MYHAC),HALAL HUB DIVISION, JAKIM
WHAT IS HALAL? (LAWFUL)
Halal is an Arabic term meaning “lawful” or “permissible” according to Islamic law (shariahcompliant)
Thoyyiba– good or wholesome (quality, safety, hygiene, clean, nutritious, secure)
Halal products must not involve the use of haram (prohibited) ingredients and are notharmful or intended for harmful use (toyyiban compliant).
The products should comply with following requirements:
Does not contain elements not allowed according to Islamic law
Has not been in contact with prohibited/not allowed substances during production,transportation and storage
Is not stored in facilities or premises or transported using transportation vehicleswhich are not allowed
Unlawful(haram) things are prohibited to everyone alike.
Basically, all food products are permitted except those that are explicitly forbiddenaccording to islamic dietary laws including:
i. Swine/pork/porcine and its by-products
ii. Alcohol and intoxicants
iii. Blood and blood by-products
iv. Meat from cadavers and meat of animals that have not been slaughtered accordingto islamic rules
v. Foods contaminated with any of the above products
WHAT IS HARAM? (UNLAWFUL)
MASHBOOH“HALAL IS CLEAR AND HARAM IS CLEAR;
IN BETWEEN THESE TWO ARE CERTAIN THINGS THAT ARE SHUBHAH (SUSPECTED).
MANY PEOPLE MAY NOT KNOW WHETHER THOSE ITEMS ARE HALAL OR HARAM.
WHOSOEVER LEAVES THEM, HE IS INNOCENT TOWARDS HIS RELIGION AND HIS CONSCIENCE.
HE IS, THEREFORE, SAFE.
ANYONE WHO GETS INVOLVED IN ANY OF THESE SUSPECTED ITEMS, HE MAY FALL INTO THE UNLAWFUL AND THE PROHIBITION.
THIS CASE IS SIMILAR TO THE ONE WHO WISHES TO RAISE HIS ANIMALS NEXT TO A RESTRICTED AREA,
HE MAY STEP INTO IT.
INDEED FOR EVERY LANDLORD THERE IS A RESTRICTED AREA.
INDEED THE RESTRICTIONS OF ALLAH ARE THE UNLAWFUL (HARAM).”
HADITH BUKHARI AND MUSLIM
3 MAIN COMPONENTS PRIOR TO GET HALAL PRODUCTS CERTIFIED
DOCUMENTATION SUBMISSION
AUDIT FIELDSAMPLING FOR LABORATORY
ANALYSIS
HALAL TESTING METHODS
ALCOHOL
FAT AND OIL - EMULSIFIER
PROTEIN AND GELATIN
MEAT SPECIATION
GENETICALLY MODIFIED ORGANISM
BRISTLE AND LEATHER
CHALLENGES IN HALAL PRODUCTS TESTING
i. Lack of sensitive test methods
ii. High cost for method development
iii. Products are complex and/or highly processed
iv. Low traceability as limited amount of halal/non-Halal ingredient is
used in certain products
v. Economically Motivated Adulteration products (EMA) – involving
the replacement of high cost ingredients with lower grade and
cheaper substitues
Gelatin is a product of thermal denaturation or disintegration of insoluble collagen by
partial acid or alkaline hydrolysis process.
Gelatin is only derived from sources rich in Type I collagen that generally contains no
Cys.
Consist of high molecular weight polypeptide with repetition of Gly-Pro-Hyp
A mixture of water-soluble protein (85 to 92 % of protein , mineral salts and moisture)
Type of sources – mainly derived from bones, hides, skin and cartilages
Bovine
Porcine
Marine - cold and warm water fish (scale and bone)
Poultry - chicken
Others - donkeys and horses
GELATIN
DENATURATION HYDROLYSIS PROCESS
GELATIN
Raw materials for industrial-scale manufacture are slaughter by-products andbyproduct of the fish-processing industry, available in sufficient quantities at aneconomical price
Animals that have been officially declared fit for human consumption.
2 main process:
i. Acid process
Limited to the tissue of younger animals
(calf skin : 2 – 3 years , pig skin : up to 18 months)
The collagen have a lesser degree of covalent bonding
Type A gelatin – IEP : 7 – 9, nitrogen content : 18.5%
ii. Alkaline process Bovine hides or bones Not suitable for pig skin because it leads to
saponification of the fat content, making furtherprocessing very difficult
Type B gelatin – IEP : 4.6 – 5.4, nitrogen content : 18 %
Fish gelatin can be conditioned using both acid and alkali process.
GELATIN
2 MAIN FUNCTIONAL PROPERTIES:
GELLING PROPERTIES
SURFACES EFFECTS PROPERTIES
APPLICATION AREA:
FOOD AND BEVERAGE , 29%
NEUTRACEUTICALS, 25.80%
PHARMACEUTICALS, 21%
PHOTOGRAPHY, 13.50%
COSMETICS, 5.50%
OTHERS, 6 %
GELATIN
Food and beverage, 29%
Neutraceuticals, 25.80%
Pharmaceuticals, 21%
Photography, 13.50%
Cosmetics, 5.50%
Others, 6.10%
AMINO ACIDS ANALYSIS
AMINO ACIDS
Containing an amine group, a carboxylic acid group, and a side-chain that
is specific to each amino acid.
Basic elements are carbon, hydrogen, oxygen, and nitrogen
The side-chain make an amino acid a weak acid or a weak base, a
hydrophilic if the side-chain is polar or a hydrophobic if it is non polar.
Serve as the building blocks of proteins
20 amino acids are naturally incorporated into polypeptides and are called
proteinogenic or standard amino acids and are encoded by the universal
genetic code.
9 standard amino acids are called "essential" for humans
result (OLSM method) –a) Regression acceptedb) Linearity acceptedc) working range accepted
Action – Develop calibration curve
25
Amino acid Calibration equations r2
Hyp Y = 0.00453x - 0.1769 0.98
Asp Y = 0.00257x + 0.0879 0.99
Ser Y = 0.00486x - 0.0531 0.99
Glu Y = 0.0031x + 0.0538 0.99
Gly Y = 0.00635x - 0.2645 0.97
His Y = 0.00936x - 0.2810 0.99
Arg Y = 0.00841x - 0.1206 1.00
Thr Y = 0.00861x - 0.1080 0.99
Ala Y = 0.0071x + 0.0137 0.98
Pro Y = 0.0037x + 0.0061 1.00
Cys Y = 0.0009x - 0.0155 0.99
Tyr Y = 0.0095x - 0.3066 0.98
Val Y = 0.0118x + 0.0236 0.99
Met Y = 0.0125x - 0.1791 0.99
Lys Y = 0.0039x + 0.1709 0.98
Ile Y = 0.0165x + 0.0114 0.99
Leu Y = 0.0184x - 0.0090 0.99
Phe Y = 0.0284x - 1.0510 0.98
y = 0.0026x + 0.0893
r² = 0.985
0.00
0.50
1.00
1.50
2.00
2.50
3.00
-100 100 300 500 700 900 1100
Area r
atio
Concentration (pmol/µl)
ASP
Working range : 37.5 – 1000 pmol/μl
26
Method precision : CV < 10%
r value :difference between 2 values should be lower than or equal to r
Method trueness (recovery) : average 99 % determined: range ≈ 64 – 111 %: IQC spiking ≈ 250 pmol/µl
27
ESTIMATING UNCERTAINTIES FOR AMINO ACIDS IN GELATIN
CHEMOMETRICS
‘The science of relating measurements made on a chemical system or process to the state ofthe system via application of mathematical or statistical methods.’
(International Chemometrics Society)
‘The chemical discipline that uses mathematical and statistical methods, (a) to design or selectoptimal measurement procedures and experiments, and (b) to provide maximum chemicalinformation by analyzing chemical data.’
Journal of Chemometrics (Wiley) andChemometrics and Intelligent Laboratory Systems (Elsevier).
• Was coined by Svante Wold (Swede) and Bruce R. Kowalski (American) in 1972.
• Early applications involving multivariate classification of analytical chemical
datasets.
• Current developments :–
a) involving very complex datasets (metabolomics or proteomics).
b) new application that are biologically driven and emerging a new interface
between chemometrics and bioinformatics
c) forensics (the use of chemical and spectroscopy information to determine
the origins of samples)
d) pharmaceuticals ( multivariate image analysis)
e) chemical engineering
f) thermal analysis (materials)
Basic Statistics, Signal Processing, Factorial Design, Calibration, Curve Fitting,
Factor Analysis, Detection, Pattern Recognition and Neural Networks
PATTERN RECOGNITION (PR)
Exploratory Data Analysis
(EDA)
Principal Components
Analysis (PCA)
Factor Analysis (FA)
Unsupervised PR
(detect similarities)
Cluster Analysis
Supervised PR (Classification)
Discriminant Analysis
SIMCA
PLS
K Nearest Neighbours
Multiway PR
Tucker3
Models
PARAFAC
Unfolding
• Is a subset to an exploratory data analysis (EDA) that aims to determine
underlying information from multivariate raw data.
• It is a technique that will reduce the dimensionality of a data set consisting
of a large number of interrelated variables and transform it to a new set of
uncorrelated variables called principal components (PCs).
• The variations present in the original data were retained as much as possible
to build up groups of orthogonal axes representing the PCs.
• Data pre-treatment such as centering and normalization technique was
performed to facilitate the process of differentiation among samples by
reducing the variation of the variables in the data.
The raw data were imported to Unscrambler X software version 9.7. Data matrix (X) is in the form of an (m x n) containing the responses for the n variables in
each of the m samples. Concepts in PCA:
i. rank the data matrix - identify the amino acids that are significantly present in all gelatins (n variables)
ii. PCA transforms the original data matrix into a number of principal components (PCs) or a new co-ordinate system (axes)
iii. The axes are located in the centre of the data points.iv. The first PC lies along the direction of the maximum variances of the data while the
second PC lies along the direction of the second highest variances and the process continues up to certain PCs where the total variances have been accounted.
v. The linear function of new variables constructed by separate PC is uncorrelated and having an orthogonal properties.
vi. The variation is expressed in percentage under a number of successive PCs.vii. The remaining percentage number is usually represented by error or noise.
• In matrix terms (chemical factors) : X = C.S + E • In PCA terms : X = T .P + E
X is the original data matrix
S = p is a matrix consisting of the spectra of each compound ; LoadingsC =T is a matrix consisting of the elution
profiles of each compound; Scores
E is an error matrix (the same size as X)
Each scores matrix consists of a series of column vectors and each loadings matrix consist a series of row vectors
S
A
M
P
L
E
S
,
m
VARIABLES, n
The PCA will decompose the variation of the data matrix (X) into scores (T), loadings (P) and a residuals matrix (E)
i. Eigenvalue - The amount of variation explained by each PC. Expressed as a percentage of theoverall sum of squares of the entire data matrix.
ii. Eigenvector – provides the weight to the new variables and defined the direction on to which data can be projected.
iii. Hotelling’s T2 ellipse - identify the accepted data points within 95% of confidence limits. These data points are lying inside the ellipse. The remaining 5% are the rejected data that lie outside the ellipse
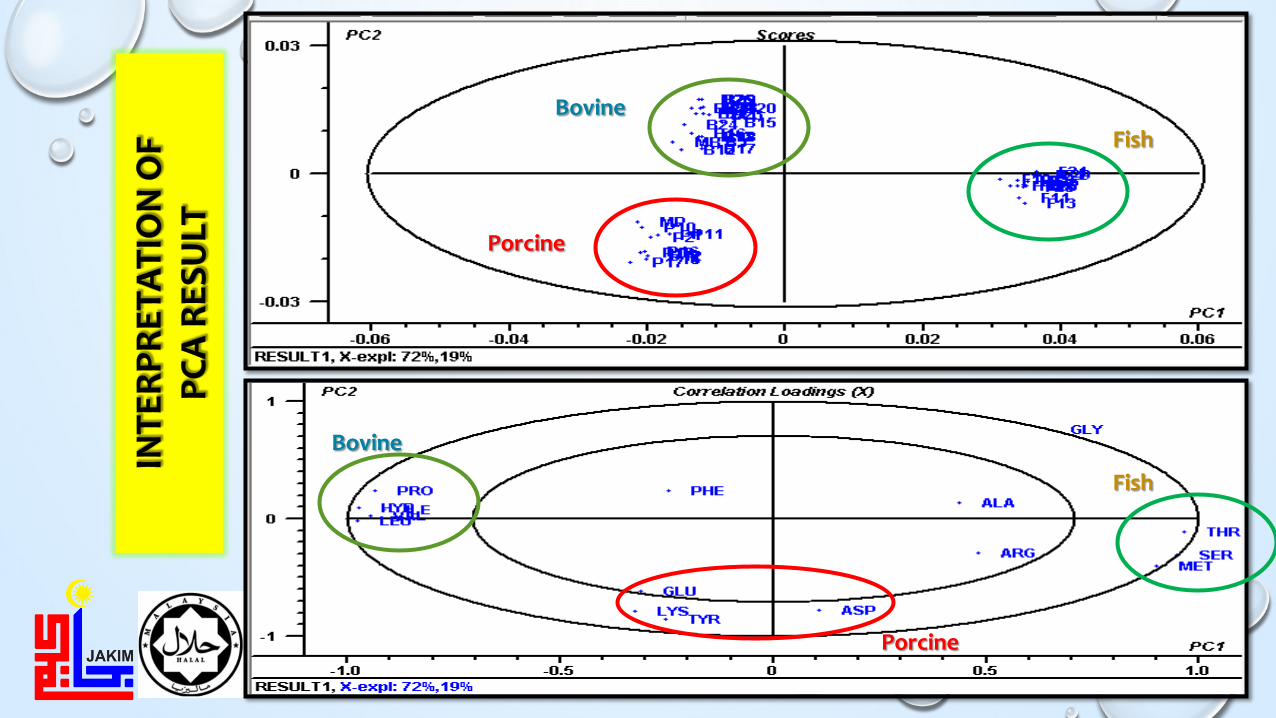
iv. Scores plot - identify the samples groupings, outliers and other strong patterns in the datav. Loading plot - interprets the relationships among variables that contribute to the effects of
sample grouping in the score plots.vi. Correlation loadings plot - consisting of two ellipse, explaining the 50% (inner circle) and 100%
(outer circle) of explained variance limits. vii. Influence plot – measure the distance of each point (sample) from the centre data point (a
grouping data) or the PC model. Detect outliers. viii. Explained variance plot - measures the distance of variables from its mean value and cause
variation in the data. The variation is expressed in percentage under a number of successive PCs.
Porcine
Bovine
Fish
Porcine
Bovine
Fish
at 0.1, 1, 5, 10, 30, 40% (w/w)
Porcine
Bovine
Porcine
Fish
EXPECTATION
CO
NT
AM
INA
TIO
N :
0.1
% (
W/W
)
CO
NT
AM
INA
TIO
N :
0.1
, 5,1
0, 3
0 &
40
% (
w/w
) Bovine gelatin
Porcine gelatin
Fish gelatin
PUBLICATIONS
PUBLICATIONS
Accepted by JOURNAL OF PHARMACEUTICAL AND BIOMEDICAL ANALYSIS –on 8th July 2016
Estimation Of Uncertainty From Method Validation Data: Application To A Reverse-phase High-performance Liquid ChromatographyMethod For The Determination Of Amino Acids In Gelatin Using 6-aminoquinolyl-N-hydroxysuccinimidyl Carbamate Reagent
REFERENCES
48
Adams, M. J. (2004). Chemometrics in analytical Spectroscopy. (2nd ed.). UK: RSC, (Chapter 1 & 3).AOAC International (1998) Peer-Verified Methods Program. Manual on policies and procedures, Arlington Va, USA.
http://www.aoac.org/vmeth/PVM.pdf. Accessed 05 Mac 2012Barwick, V.J., & Ellison, S.L.R. (2000). VAM Project 3.2.1. Part (d) : Protocol for uncertainty evaluation from validation data.
In Development and harmonisation of measurement uncertainty principles. Teddington, (LGC/VAM/1998/088).Barwick, V.(2012). Evaluating measurement uncertainty in clinical chemistry. UK National Measurement System, (Report
no: LGC/R/2010/17) .Brereton, R. G. (2003). Chemometrics. Data analysis for the laboratory and chemical plant. Chichester, UK: John Wiley & Sons,
Ltd, (Chapter 2). Brereton, R. G. (2007). Applied chemometrics for scientists. Chichester, UK: John Wiley & Sons, Ltd., (Chapter 3 & 5).Bartolomeo MP, Maisano F (2006) Validation of a reversed-phase hplc method for quantitative amino acid analysis. J
Biomol Tech 17:131-137Chaudry, M., & Riaz, M.N. (2004). Halal food production. USA: CRC Press, (Chapter 11).Cohen SA (2005) Quantitation of amino acids as 6-aminoquinolyl-N-hydroxysuccinimidyl carbamate derivatives. In: Molnr-
Perl (ed) Quantitation of amino acids and amines by chromatography. Methods and protocols. Elservier, Netherlands, pp 242-267
EURACHEM Guide (1998) The fitness for purpose of analytical methods. A laboratory guide to method validation and related topics, 1st edn. LGC (Teddington), UK
Ellison, S. L., & Barwick, V. J. (1998). Using Validation data for ISO measurement uncertainty estimation. Part 1. Principles ofan approach using cause and effect analysis. Analyst , 123, 1387-1392.
Ellison, S.L.R., & Williams, A. (2012). EURACHEM/CITAC Guide CG 4. Quantifying uncertainty in analytical measurement. (3rd ed.). Laboratory of the Government Chemist, http://www.eurachem.org (accessed February 2012).
Fountoulakis M, Lahm HW (1998) Hydrolysis and amino acid composition analysis of proteins. J Chromatogr A 826:109-134Gustavo G, Angeles H, Agustin GA (2010) Intra-laboratory assessment of method accuracy (trueness and precision) by
using validation standards. J Talanta 82(5):1995-1998Gonzalez, A.G., Herrador, M.A., & Asuero, A.G. (2005). Practical digest for evaluating the uncertainty of analytical assays
from validation data according to the LGC/VAM protocol. Talanta, 65 , 1022-1030.Julicher, B., Gowik, P., & Uhlig, S. (1999). A top-down in-house validation based approach for the investigation of the
measurement uncertainty using fractional factorial experiments. The Analyst, 124 , 537-545 Jolliffe, I. T. (1986). Principle component analysis. (2nd ed.). New York: Springer-Verlag Inc., (Chapter 3,5 , 7 & 10).
Jeffrey R (1996) Analytical detection limit guidance and laboratory guide for determining method detection limits. Wisconsin Department of Natural Resources Laboratory Certification Program. US. http://www.dnr.state.wi.us. Accessed 28 April 2012
James D, Macneil, Patterson J, Martz V (2007) Validation of analytical methods. Proving your method is ‘fit for purpose’. http://pubs.rsc.org. Accessed 19 October 2012. doi:10.1039/9781847551757-00100
Karim AA, Bhat R (2008) Gelatine alternatives for the food industry: Recent developments, challenges and prospects. Trends in Food Sci and Technol 19: 644-656
Lourdes B, Amparo A, Rosaura F (2006) Application of the 6-aminoquinolyl-N-hydroxysccinimidyl carbamate (AQC) reagent to the RP-HPLC determination of amino acids in infant foods. J Chromatogr B 831:176-183
Mark H (2003) Application of an improved procedure for testing the linearity of analytical methods to pharmaceutical analysis. J Pharm and Biomed Anal 33:7-20
Mohamad, O. (2001). Pengujian Hipotesis. In O. Mohamad, Analisis Statistik Biologi (pp. 175 - 177). UKM Selangor, Bangi, Malaysia: Ampang Press Sdn. Bhd.
Nemati M, Oveisi MR, Abdollahi H, Sabzevari O (2004) Differentiation of bovine and porcine gelatins using principle component analysis. J Pharm and Biomed Anal 34:485-492
Schrieber R, Gareis H (2007) Gelatine handbook. Theory and industrial practice. Wiley-VCH, GermanyScheilla VC, Roberto GJ (2005) A procedure to assess linearity by ordinary least squares method. J Anal Chim Acta 552:25-35Taverniers, I., Bockstaele, E.B., & Loose, M. (2004). Trends in quality in the analytical laboratory. I. Traceability and
measurement uncertainty of analytical results. Trends in Analytical Chemistry, 23 , 480 - 490.Williams, A. (1998). Review paper : Introduction to measurement uncertainty in chemical analysis. Accred Qual Assur, 3 , 92-
94.Widyaninggar, A., Triwahyudi, Triyana, K. & Rohman, A. (2012). Differentiation between porcine and bovine gelatin in
commercial capsule shells based on amino acid profiles and principle component analysis. Indonesian Journal of Pharmacy, 23(2), 96 – 101.
Yasemin, D., Pelin, U., & Hamide, Z. S. (2012). Detection of porcine DNA in gelatin and gelatin-containing processes food products - Halal/Kosher authentication. Meat Science, 90, 686-689.