54
January, 2019 Presentation Materials for Investors 3rd Quarter FY2018

January, 2019
Presentation Materials for Investors3rd Quarter FY2018
INDEX
Outline of Financial Results for Nine-Months ended December 31, 2018Summary of Financial Results
Electrical Energy Sold
Electric Power Supplied and Principal Figures
(Reference) Impact of Accrued Income Incurred by Fuel Cost Adjustment System (Result)
Summary of Forecast for FY2018
(Reference) Impact of Accrued Income Incurred by Fuel Cost Adjustment System in FY2018 (Forecast)
Copyright © CHUBU Electric Power Co.,Inc. All Right Reserved.
・・・・・・・・・・・・・・・01
・・・・・・・・・・・・・・・04
・・・・・・・・・・・・・・・05
・・・・・・・・・・・・・・・06
・・・・・・・・・・・・・・・07
・・・・・・・・・・・・・・・09
01
02Initiatives to Address Management Challenges and Toward Realization of Our “Vision”
Transition to a Business Model with Unbundling of Each SectorImproving Safety Further at Hamaoka Nuclear Power PlantStable Power Supply for a New AgeStrengthening Our Business Base for Growth and Achieving Sustainable GrowthEstablishing a Business Structure/Management Base that can Respond Instantly to Environmental Changes
・・・・・・・・・・・・・・・10・・・・・・・・・・・・・・・11・・・・・・・・・・・・・・・12・・・・・・・・・・・・・・・14・・・・・・・・・・・・・・・15・・・・・・・・・・・・・・・21
Management Situation
03 Reference Data (1) : Financial Results(2) : Management Information
・・・・・・・・・・・・・・・23・・・・・・・・・・・・・・・37
Outline of Financial Results forNine-Months ended December 31, 2018
Copyright © CHUBU Electric Power Co.,Inc. All Right Reserved.
01
Note: The company’s fiscal year (FY) is from April 1 to March 31 of the following year. FY2018 represents the fiscal year begun on April 1, 2018, and ending on March 31, 2019. 3rd Quarter (3Q) represents nine months period ended December 31, 2018. Monetary amounts are rounded down to the nearest whole number of the units being used, while principal figures like electrical energy sold or electric power supplied are rounded to the nearest unit.
Copyright © CHUBU Electric Power Co.,Inc. All Right Reserved.
Summary of Financial Results <1>
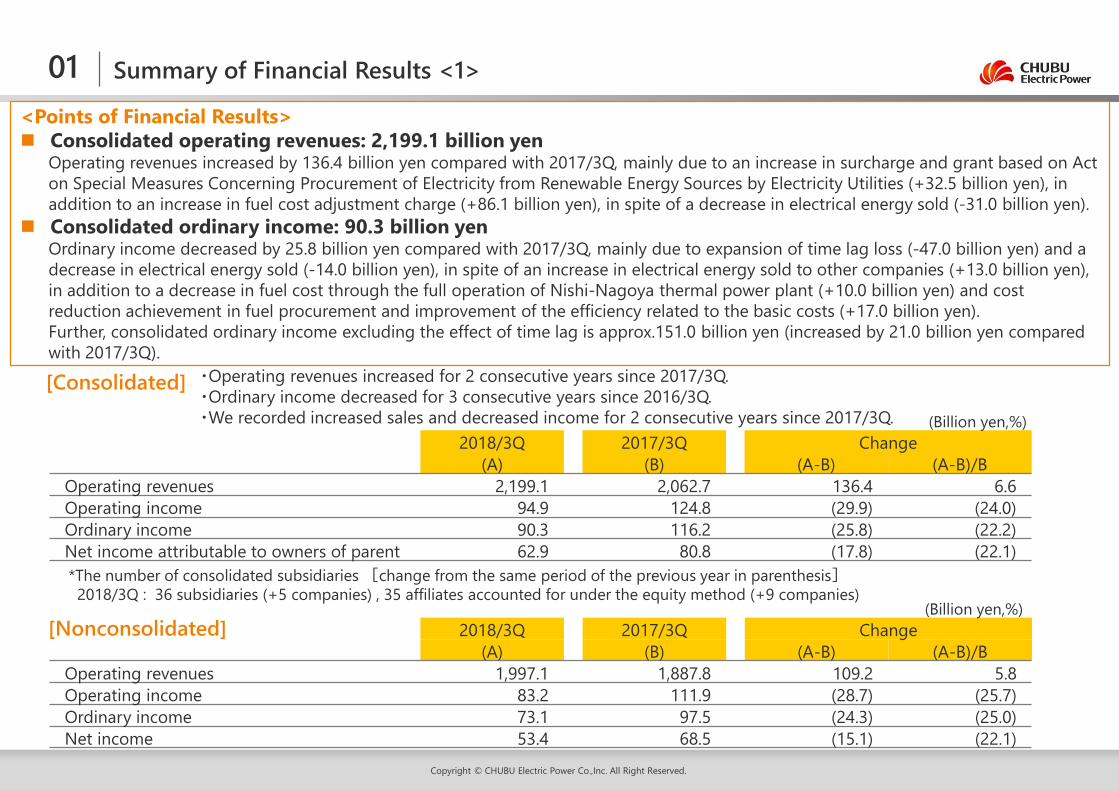
<Points of Financial Results> Consolidated operating revenues: 2,199.1 billion yen
Operating revenues increased by 136.4 billion yen compared with 2017/3Q, mainly due to an increase in surcharge and grant based on Act on Special Measures Concerning Procurement of Electricity from Renewable Energy Sources by Electricity Utilities (+32.5 billion yen), in addition to an increase in fuel cost adjustment charge (+86.1 billion yen), in spite of a decrease in electrical energy sold (-31.0 billion yen).
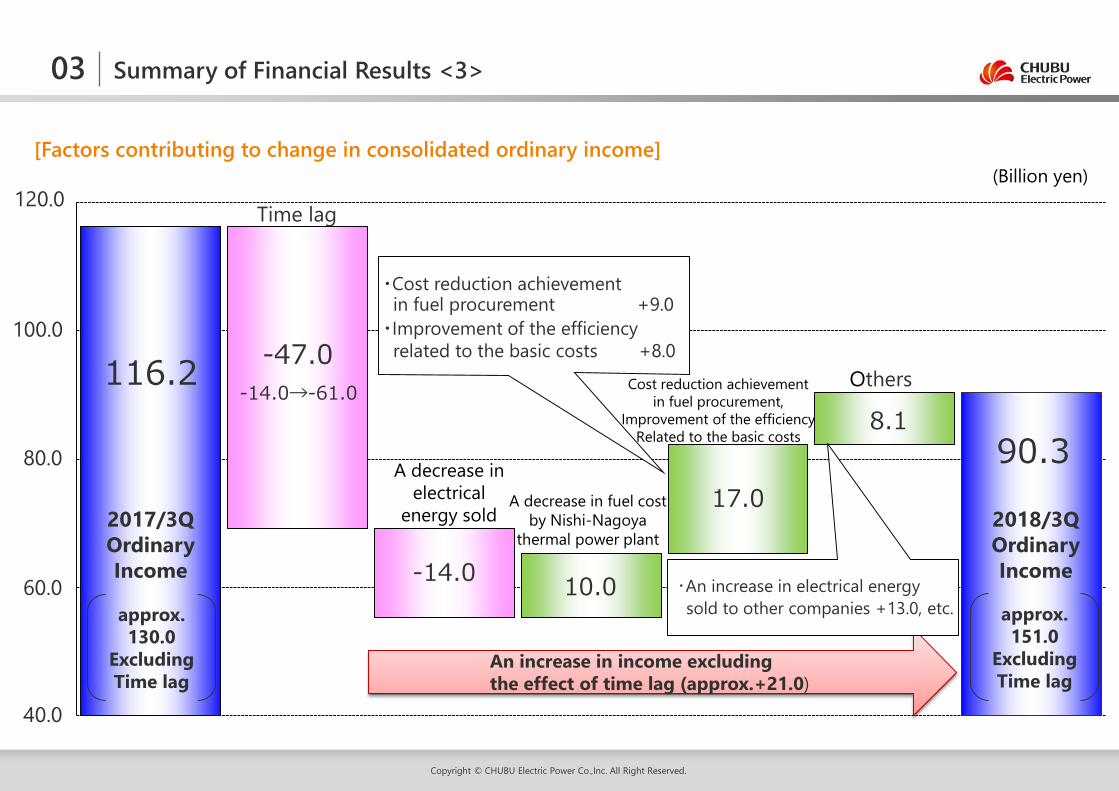
Consolidated ordinary income: 90.3 billion yenOrdinary income decreased by 25.8 billion yen compared with 2017/3Q, mainly due to expansion of time lag loss (-47.0 billion yen) and a decrease in electrical energy sold (-14.0 billion yen), in spite of an increase in electrical energy sold to other companies (+13.0 billion yen), in addition to a decrease in fuel cost through the full operation of Nishi-Nagoya thermal power plant (+10.0 billion yen) and cost reduction achievement in fuel procurement and improvement of the efficiency related to the basic costs (+17.0 billion yen). Further, consolidated ordinary income excluding the effect of time lag is approx.151.0 billion yen (increased by 21.0 billion yen compared with 2017/3Q).
[Consolidated]
(Billion yen,%)2018/3Q 2017/3Q Change
(A) (B) (A-B) (A-B)/BOperating revenues 2,199.1 2,062.7 136.4 6.6Operating income 94.9 124.8 (29.9) (24.0)Ordinary income 90.3 116.2 (25.8) (22.2)Net income attributable to owners of parent 62.9 80.8 (17.8) (22.1)
(Billion yen,%)2018/3Q 2017/3Q Change
(A) (B) (A-B) (A-B)/BOperating revenues 1,997.1 1,887.8 109.2 5.8Operating income 83.2 111.9 (28.7) (25.7)Ordinary income 73.1 97.5 (24.3) (25.0)Net income 53.4 68.5 (15.1) (22.1)
[Nonconsolidated]
*The number of consolidated subsidiaries [change from the same period of the previous year in parenthesis]2018/3Q : 36 subsidiaries (+5 companies) , 35 affiliates accounted for under the equity method (+9 companies)
01
・Operating revenues increased for 2 consecutive years since 2017/3Q.・Ordinary income decreased for 3 consecutive years since 2016/3Q. ・We recorded increased sales and decreased income for 2 consecutive years since 2017/3Q.
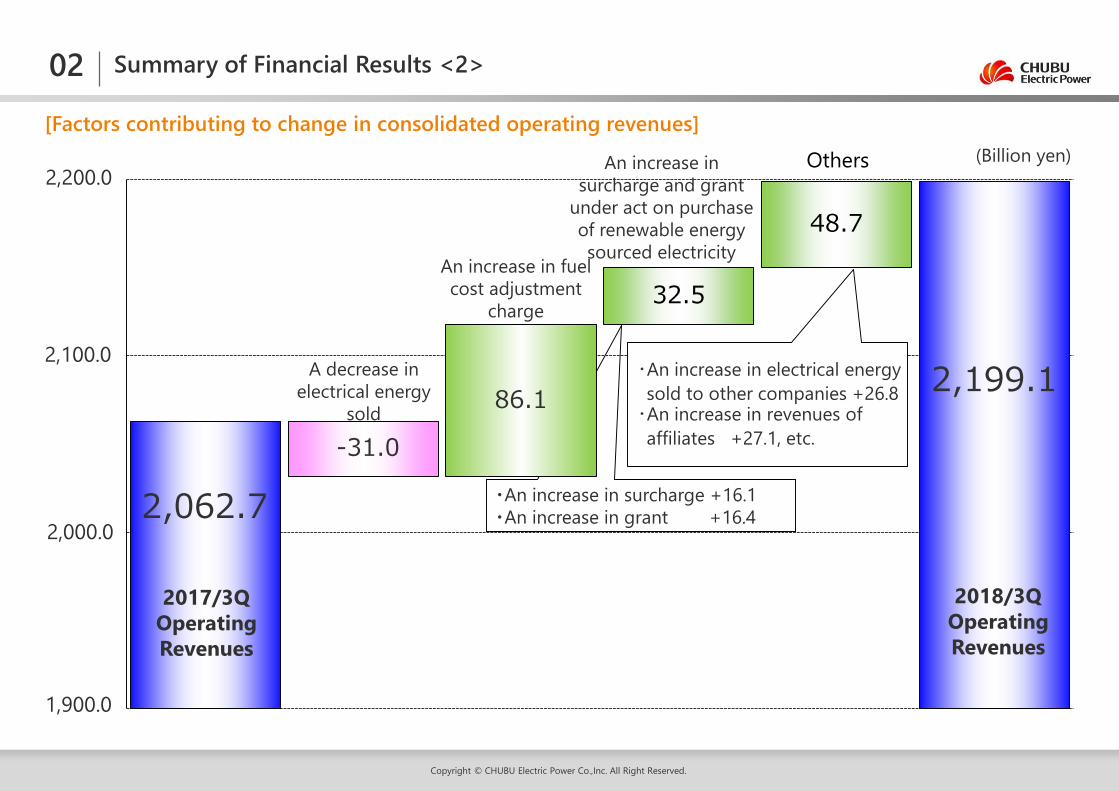
・An increase in surcharge +16.1・An increase in grant +16.42,062.7
2,199.1
-31.0
86.1
32.5
48.7
19,000
20,000
21,000
22,000
A decrease in electrical energy
sold
An increase in fuel cost adjustment
charge
Others
・An increase in electrical energy sold to other companies +26.8
・An increase in revenues of affiliates +27.1, etc.
Copyright © CHUBU Electric Power Co.,Inc. All Right Reserved.
[Factors contributing to change in consolidated operating revenues]
Summary of Financial Results <2>02
2017/3QOperating Revenues
2018/3QOperating Revenues
An increase in surcharge and grant
under act on purchase of renewable energy sourced electricity
(Billion yen)2,200.0
2,000.0
1,900.0
2,100.0
116.2
90.3
-47.0
-14.0 10.0
17.0
8.1
400
600
800
1,000
1,200
A decrease in fuel cost by Nishi-Nagoya
thermal power plant
-14.0→-61.0
(Billion yen)
Time lag
A decrease in electrical
energy sold
OthersCost reduction achievement in fuel procurement,
Improvement of the efficiencyRelated to the basic costs
Copyright © CHUBU Electric Power Co.,Inc. All Right Reserved.
[Factors contributing to change in consolidated ordinary income]
03 Summary of Financial Results <3>
120.0
80.0
60.0
100.0
40.0
2017/3QOrdinaryIncome
2018/3QOrdinaryIncome
approx.130.0
ExcludingTime lag
approx.151.0
ExcludingTime lag
An increase in income excluding the effect of time lag (approx.+21.0)
・Cost reduction achievement in fuel procurement +9.0・Improvement of the efficiency
related to the basic costs +8.0
・An increase in electrical energy sold to other companies +13.0, etc.
Copyright © CHUBU Electric Power Co.,Inc. All Right Reserved.
04
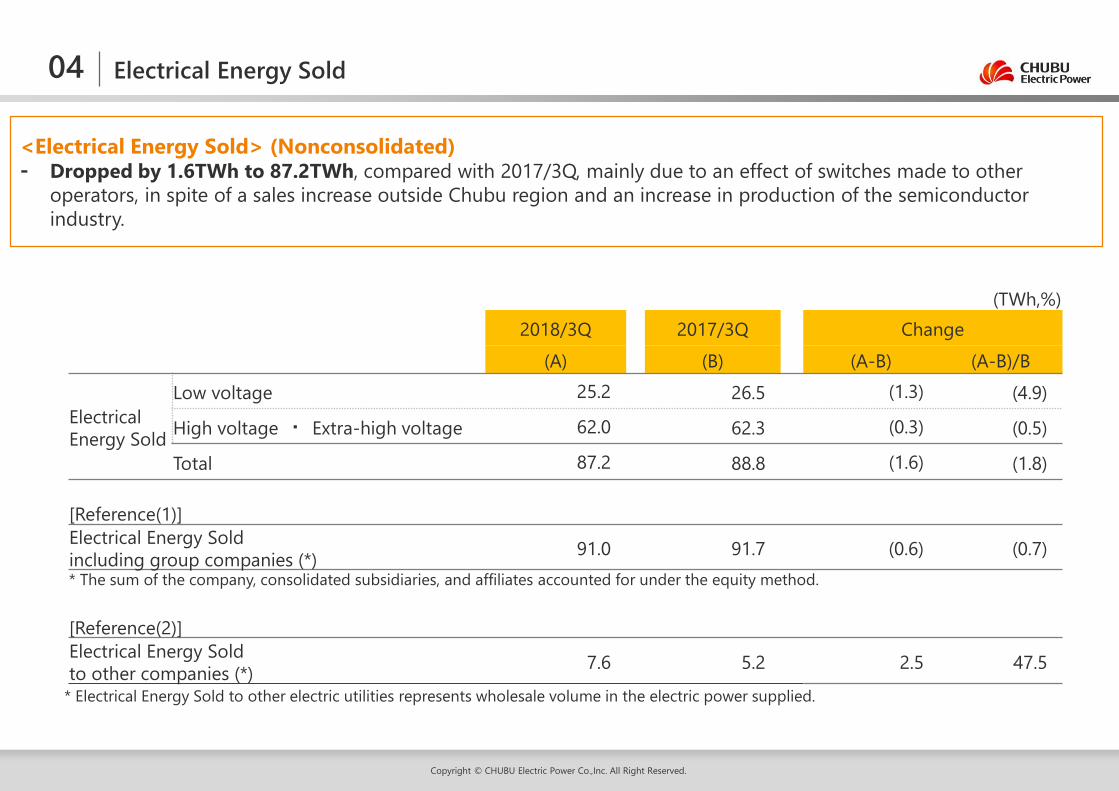
<Electrical Energy Sold> (Nonconsolidated)⁃ Dropped by 1.6TWh to 87.2TWh, compared with 2017/3Q, mainly due to an effect of switches made to other
operators, in spite of a sales increase outside Chubu region and an increase in production of the semiconductor industry.
Electrical Energy Sold
(TWh,%)2018/3Q 2017/3Q Change
(A) (B) (A-B) (A-B)/B
Electrical Energy Sold
Low voltage 25.2 26.5 (1.3) (4.9)
High voltage ・ Extra-high voltage 62.0 62.3 (0.3) (0.5)
Total 87.2 88.8 (1.6) (1.8)
[Reference(1)]Electrical Energy Sold including group companies (*) 91.0 91.7 (0.6) (0.7)
[Reference(2)]Electrical Energy Sold to other companies (*) 7.6 5.2 2.5 47.5
* Electrical Energy Sold to other electric utilities represents wholesale volume in the electric power supplied.
* The sum of the company, consolidated subsidiaries, and affiliates accounted for under the equity method.
Copyright © CHUBU Electric Power Co.,Inc. All Right Reserved.
05 Electric Power Supplied and Principal Figures
(TWh,%)2018/3Q 2017/3Q Change
(A) (B) (A-B) (A-B)/B
ElectricPower Supplied
Internally generated
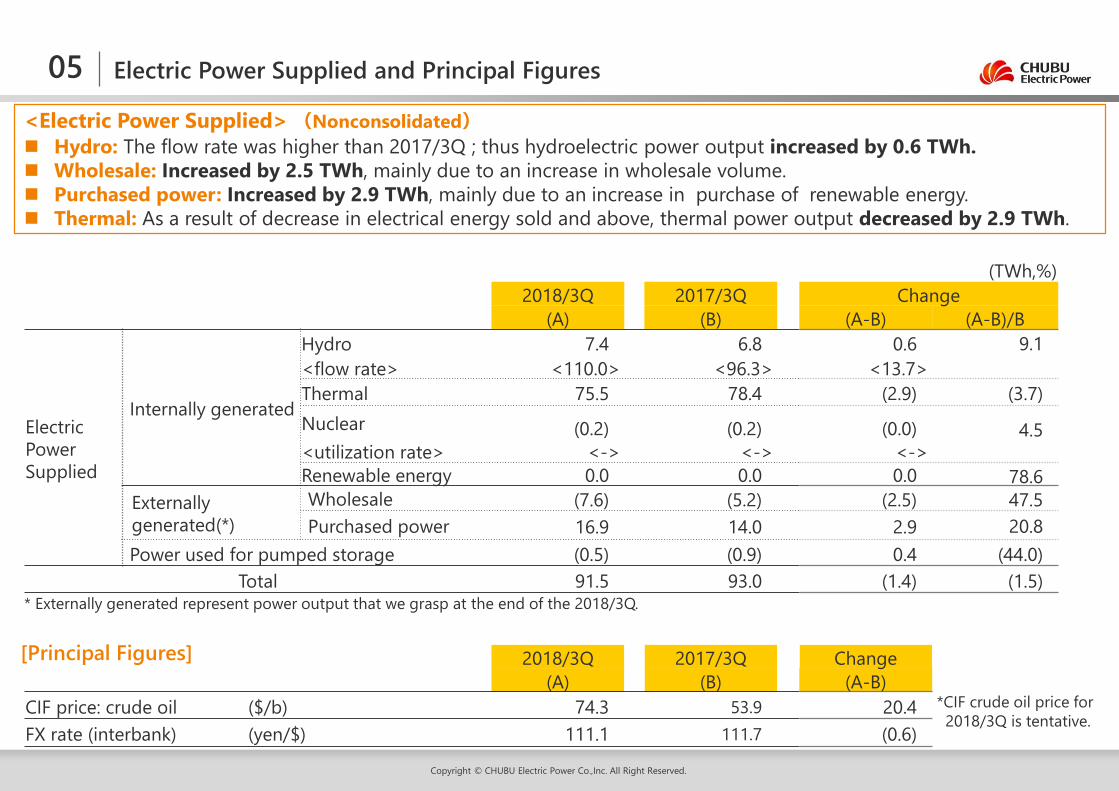
Hydro 7.4 6.8 0.6 9.1<flow rate> <110.0> <96.3> <13.7>Thermal 75.5 78.4 (2.9) (3.7)Nuclear (0.2) (0.2) (0.0) 4.5<utilization rate> <-> <-> <->Renewable energy 0.0 0.0 0.0 78.6
Externallygenerated(*)
Wholesale (7.6) (5.2) (2.5) 47.5Purchased power 16.9 14.0 2.9 20.8
Power used for pumped storage (0.5) (0.9) 0.4 (44.0)Total 91.5 93.0 (1.4) (1.5)
2018/3Q 2017/3Q Change(A) (B) (A-B)
CIF price: crude oil ($/b) 74.3 53.9 20.4FX rate (interbank) (yen/$) 111.1 111.7 (0.6)
*CIF crude oil price for 2018/3Q is tentative.
[Principal Figures]
* Externally generated represent power output that we grasp at the end of the 2018/3Q.
<Electric Power Supplied> (Nonconsolidated) Hydro: The flow rate was higher than 2017/3Q ; thus hydroelectric power output increased by 0.6 TWh. Wholesale: Increased by 2.5 TWh, mainly due to an increase in wholesale volume. Purchased power: Increased by 2.9 TWh, mainly due to an increase in purchase of renewable energy. Thermal: As a result of decrease in electrical energy sold and above, thermal power output decreased by 2.9 TWh.
Copyright © CHUBU Electric Power Co.,Inc. All Right Reserved.
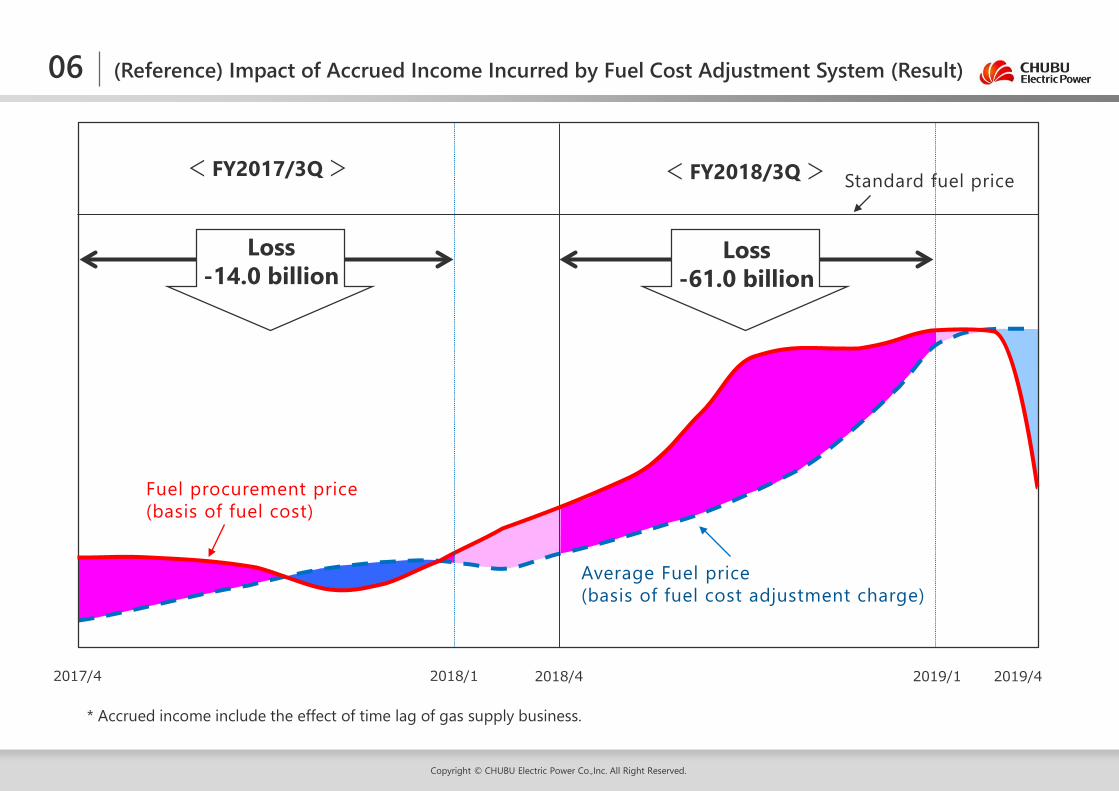
* Accrued income include the effect of time lag of gas supply business.
(Reference) Impact of Accrued Income Incurred by Fuel Cost Adjustment System (Result)06
2017/4 2018/4 2019/42018/1 2019/1
Fuel procurement price(basis of fuel cost)
Average Fuel price(basis of fuel cost adjustment charge)
Loss-14.0 billion
Loss-61.0 billion
Standard fuel price< FY2017/3Q > < FY2018/3Q >
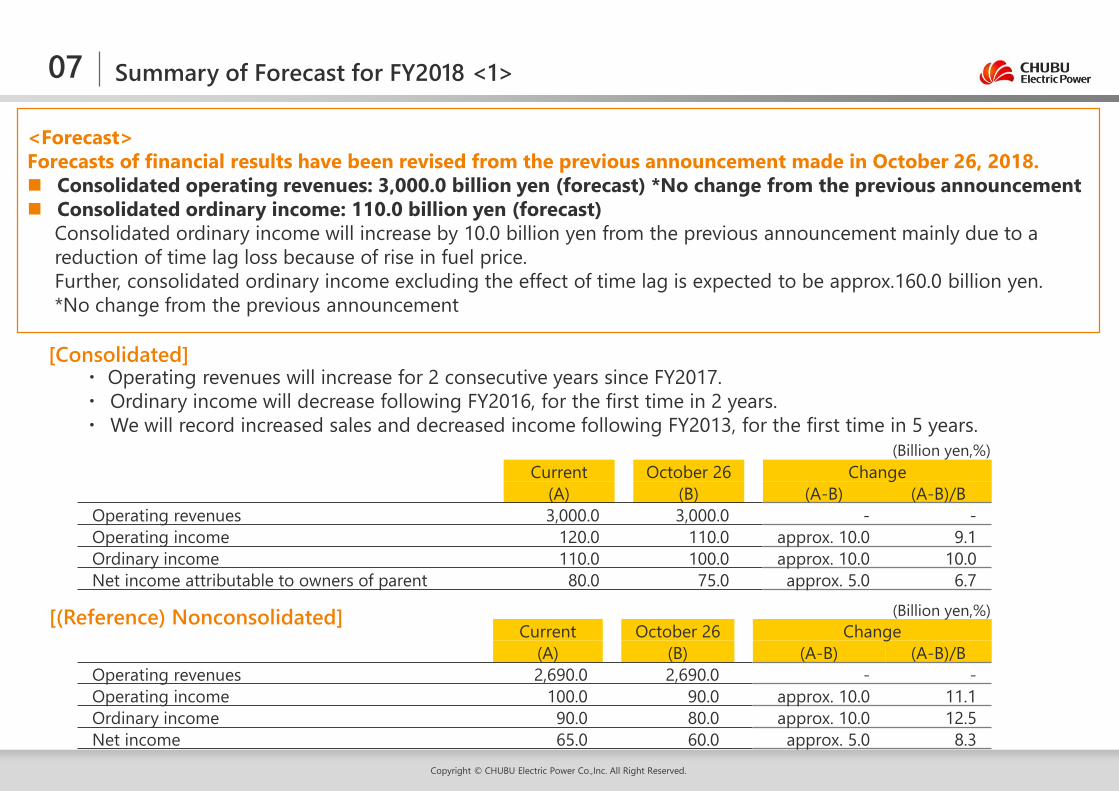
<Forecast>Forecasts of financial results have been revised from the previous announcement made in October 26, 2018. Consolidated operating revenues: 3,000.0 billion yen (forecast) *No change from the previous announcement Consolidated ordinary income: 110.0 billion yen (forecast)
Consolidated ordinary income will increase by 10.0 billion yen from the previous announcement mainly due to a reduction of time lag loss because of rise in fuel price. Further, consolidated ordinary income excluding the effect of time lag is expected to be approx.160.0 billion yen. *No change from the previous announcement
Copyright © CHUBU Electric Power Co.,Inc. All Right Reserved.
07 Summary of Forecast for FY2018 <1>
[Consolidated]
[(Reference) Nonconsolidated]
(Billion yen,%)Current October 26 Change
(A) (B) (A-B) (A-B)/BOperating revenues 3,000.0 3,000.0 - -Operating income 120.0 110.0 approx. 10.0 9.1Ordinary income 110.0 100.0 approx. 10.0 10.0Net income attributable to owners of parent 80.0 75.0 approx. 5.0 6.7
・ Operating revenues will increase for 2 consecutive years since FY2017.・ Ordinary income will decrease following FY2016, for the first time in 2 years.・ We will record increased sales and decreased income following FY2013, for the first time in 5 years.
(Billion yen,%)Current October 26 Change
(A) (B) (A-B) (A-B)/BOperating revenues 2,690.0 2,690.0 - -Operating income 100.0 90.0 approx. 10.0 11.1Ordinary income 90.0 80.0 approx. 10.0 12.5Net income 65.0 60.0 approx. 5.0 8.3
Copyright © CHUBU Electric Power Co.,Inc. All Right Reserved.
08 Summary of Forecast for FY2018 <2>
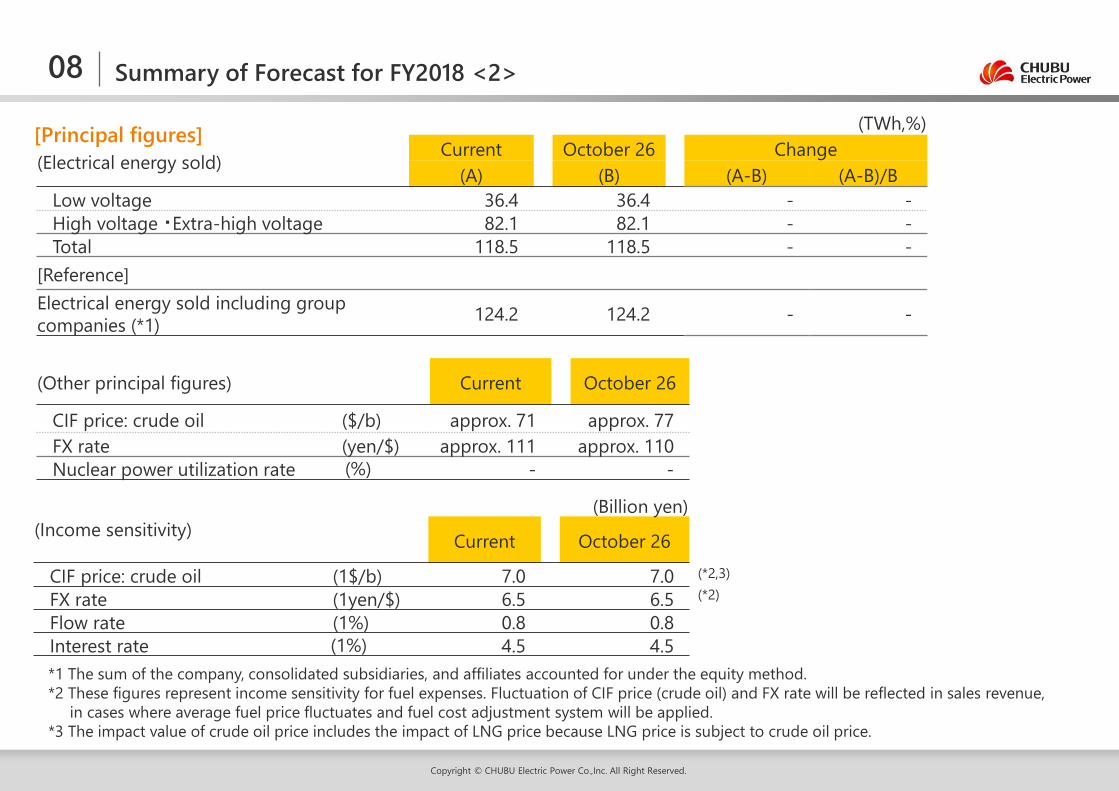
[Principal figures]
(Billion yen)(Income sensitivity) Current October 26
CIF price: crude oil (1$/b) 7.0 7.0FX rate (1yen/$) 6.5 6.5Flow rate (1%) 0.8 0.8Interest rate (1%) 4.5 4.5
(Other principal figures) Current October 26
CIF price: crude oil ($/b) approx. 71 approx. 77FX rate (yen/$) approx. 111 approx. 110Nuclear power utilization rate (%) - -
(TWh,%)
(Electrical energy sold) Current October 26 Change(A) (B) (A-B) (A-B)/B
Low voltage 36.4 36.4 - -High voltage ・Extra-high voltage 82.1 82.1 - -Total 118.5 118.5 - -
[Reference]Electrical energy sold including group companies (*1) 124.2 124.2 - -
(*2,3)(*2)
*1 The sum of the company, consolidated subsidiaries, and affiliates accounted for under the equity method.*2 These figures represent income sensitivity for fuel expenses. Fluctuation of CIF price (crude oil) and FX rate will be reflected in sales revenue,
in cases where average fuel price fluctuates and fuel cost adjustment system will be applied.*3 The impact value of crude oil price includes the impact of LNG price because LNG price is subject to crude oil price.
Copyright © CHUBU Electric Power Co.,Inc. All Right Reserved.
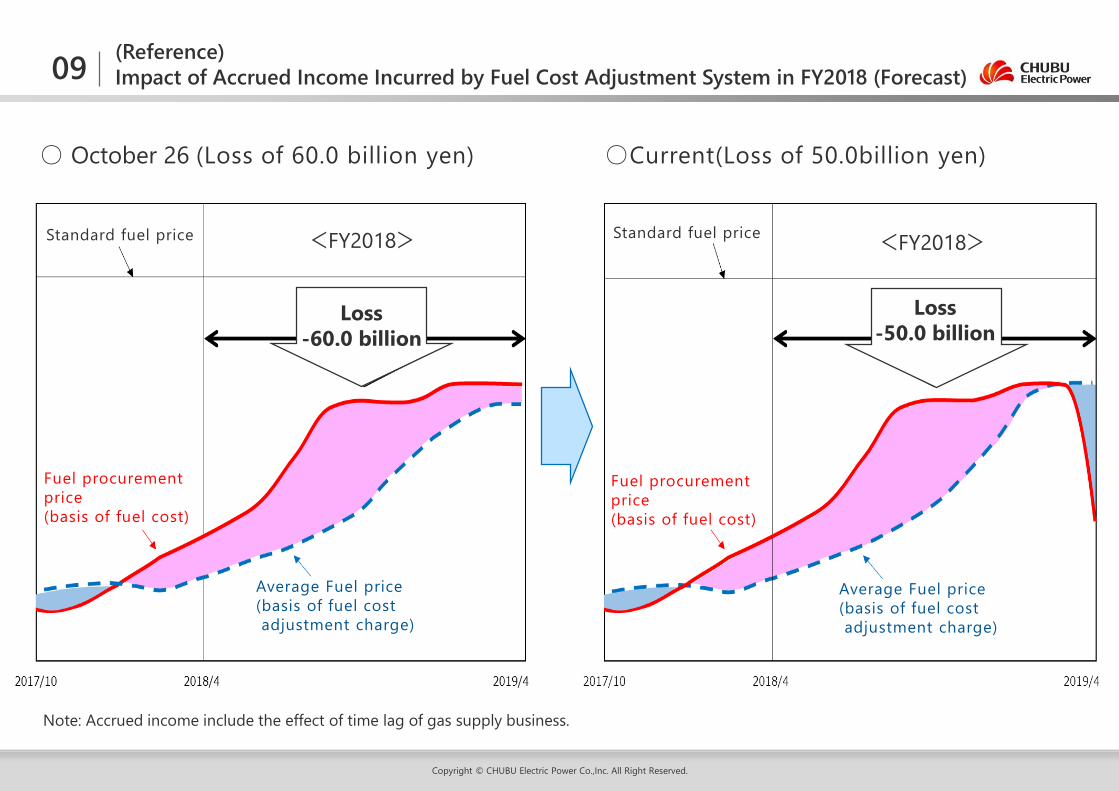
(Reference) Impact of Accrued Income Incurred by Fuel Cost Adjustment System in FY2018 (Forecast)09
○ October 26 (Loss of 60.0 billion yen) ○Current(Loss of 50.0billion yen)
Note: Accrued income include the effect of time lag of gas supply business.
<FY2018> <FY2018>Standard fuel price Standard fuel price
Fuel procurement price(basis of fuel cost)
Fuel procurement price(basis of fuel cost)
Average Fuel price(basis of fuel cost adjustment charge)
Average Fuel price(basis of fuel cost adjustment charge)
Loss-60.0 billion
Loss-50.0 billion

Management Situation
Copyright © CHUBU Electric Power Co.,Inc. All Right Reserved.
02
10
Copyright © CHUBU Electric Power Co.,Inc. All Right Reserved.
2016
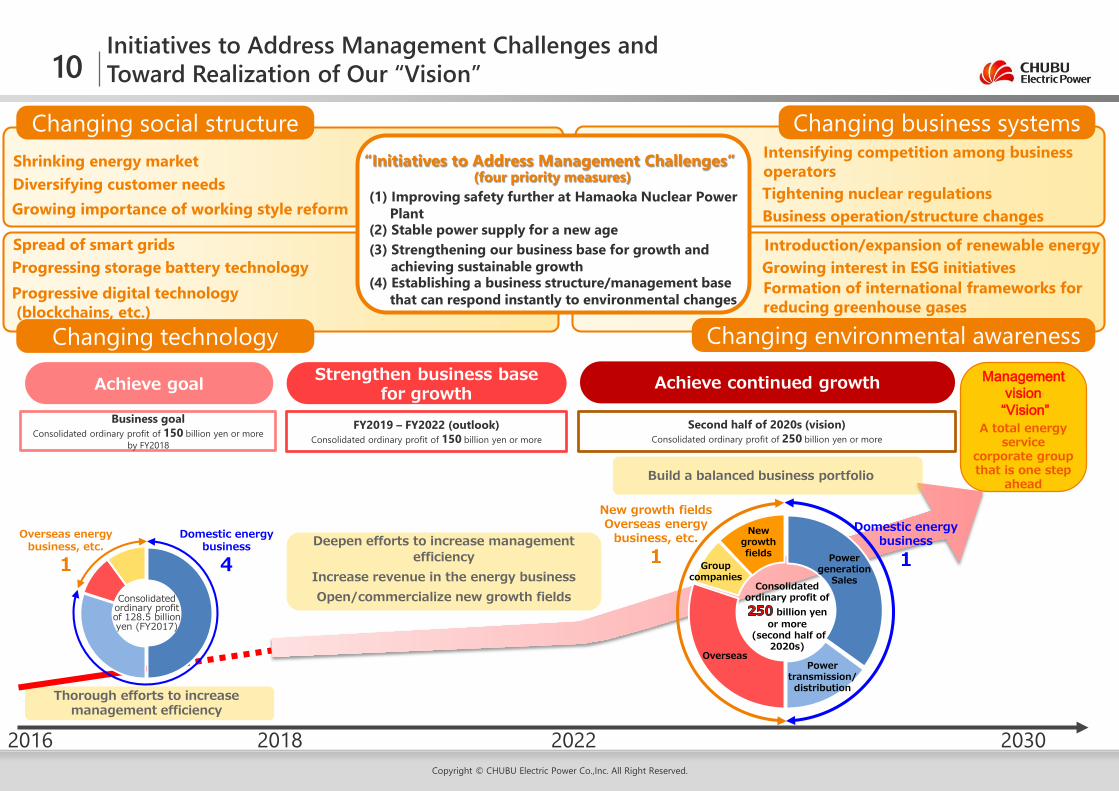
Achieve goal Achieve continued growth
Business goalConsolidated ordinary profit of 150 billion yen or more
by FY2018
Build a balanced business portfolio
Strengthen business base for growth
A total energy service
corporate group that is one step
ahead
Domestic energy business
1
New growth fieldsOverseas energy
business, etc.1
Overseas
Group companies
Power transmission/distribution
Power generation
Sales
New growth fields
Consolidated ordinary profit of
billion yen or more
(second half of 2020s)
Second half of 2020s (vision)Consolidated ordinary profit of 250 billion yen or more
Domestic energy business
4Overseas energy
business, etc.
1
FY2019 – FY2022 (outlook)Consolidated ordinary profit of 150 billion yen or more
Thorough efforts to increase management efficiency
Deepen efforts to increase managementefficiency
Increase revenue in the energy businessOpen/commercialize new growth fields
2018 2022 2030
Consolidated ordinary profit of 128.5 billion yen (FY2017)
Management vision
“Vision”
Shrinking energy market
Growing importance of working style reform
Intensifying competition among business operators
Growing interest in ESG initiativesIntroduction/expansion of renewable energy
Formation of international frameworks for reducing greenhouse gases
Spread of smart grids
Diversifying customer needs
Progressing storage battery technology
Changing technology
Changing social structure
Changing environmental awareness
Changing business systems
Tightening nuclear regulations
Progressive digital technology(blockchains, etc.)
Business operation/structure changes(1) Improving safety further at Hamaoka Nuclear Power
Plant
(3) Strengthening our business base for growth and achieving sustainable growth
(2) Stable power supply for a new age
(4) Establishing a business structure/management base that can respond instantly to environmental changes
“Initiatives to Address Management Challenges”(four priority measures)
Initiatives to Address Management Challenges andToward Realization of Our “Vision”
Copyright © CHUBU Electric Power Co.,Inc. All Right Reserved.
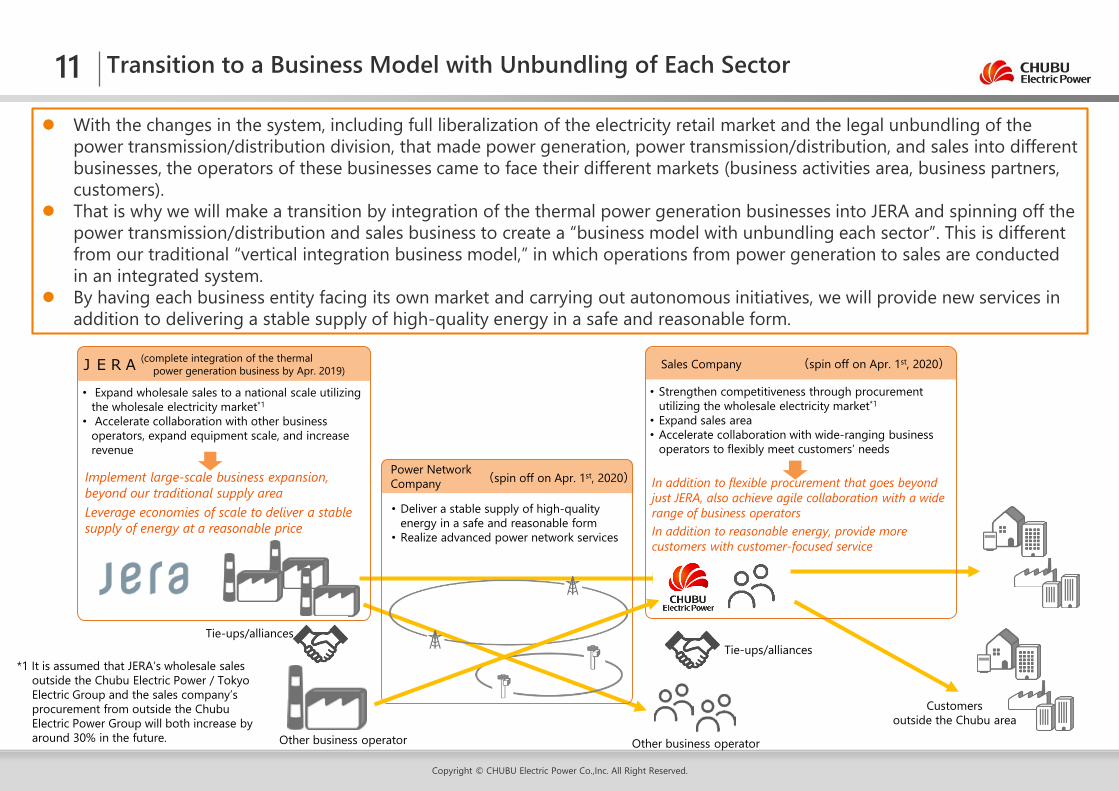
Transition to a Business Model with Unbundling of Each Sector
Other business operator
Implement large-scale business expansion, beyond our traditional supply areaLeverage economies of scale to deliver a stable supply of energy at a reasonable price
• Strengthen competitiveness through procurement utilizing the wholesale electricity market*1
• Expand sales area• Accelerate collaboration with wide-ranging business
operators to flexibly meet customers’ needs
In addition to flexible procurement that goes beyond just JERA, also achieve agile collaboration with a wide range of business operatorsIn addition to reasonable energy, provide more customers with customer-focused service
Customersoutside the Chubu area
Tie-ups/alliances
• Deliver a stable supply of high-quality energy in a safe and reasonable form
• Realize advanced power network services
(complete integration of the thermalpower generation business by Apr. 2019)JERA Sales Company
(spin off on Apr. 1st, 2020)Power NetworkCompany
• Expand wholesale sales to a national scale utilizing the wholesale electricity market*1
• Accelerate collaboration with other business operators, expand equipment scale, and increase revenue
Other business operator
Tie-ups/alliances
With the changes in the system, including full liberalization of the electricity retail market and the legal unbundling of the power transmission/distribution division, that made power generation, power transmission/distribution, and sales into different businesses, the operators of these businesses came to face their different markets (business activities area, business partners,customers).
That is why we will make a transition by integration of the thermal power generation businesses into JERA and spinning off the power transmission/distribution and sales business to create a “business model with unbundling each sector”. This is different from our traditional “vertical integration business model,” in which operations from power generation to sales are conducted in an integrated system.
By having each business entity facing its own market and carrying out autonomous initiatives, we will provide new services inaddition to delivering a stable supply of high-quality energy in a safe and reasonable form.
11
*1 It is assumed that JERA’s wholesale sales outside the Chubu Electric Power / Tokyo Electric Group and the sales company’s procurement from outside the Chubu Electric Power Group will both increase by around 30% in the future.
(spin off on Apr. 1st, 2020)
Copyright © CHUBU Electric Power Co.,Inc. All Right Reserved.
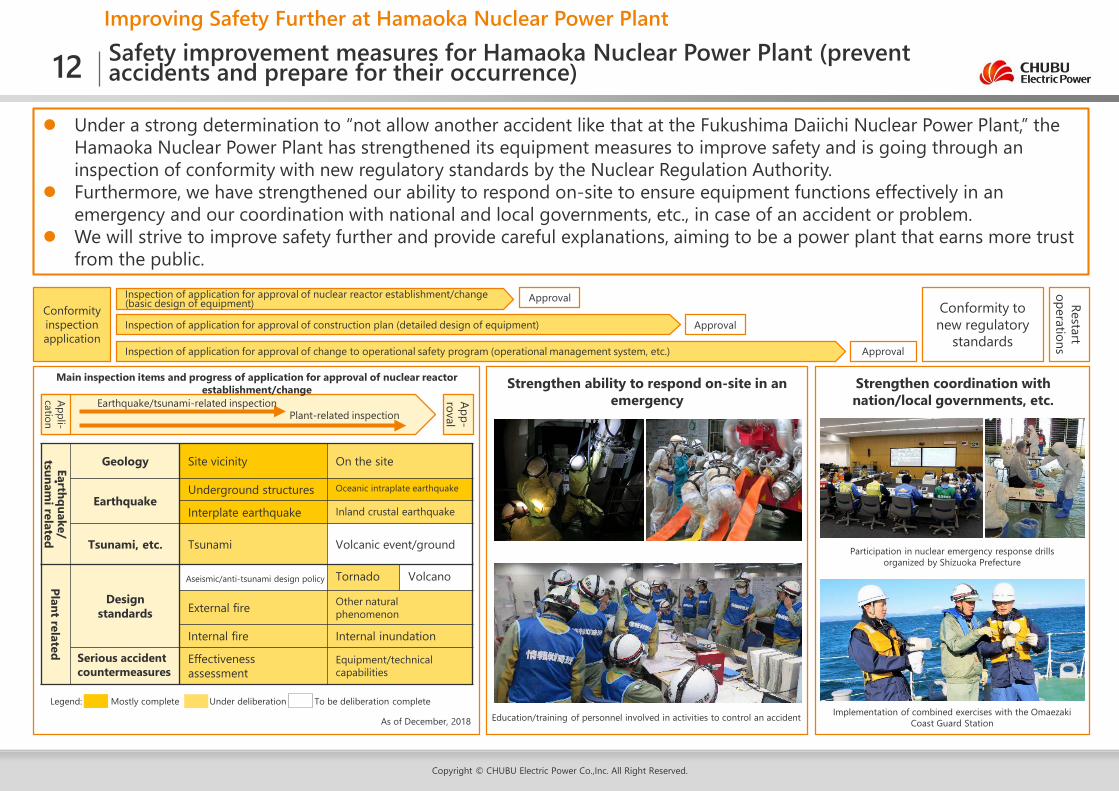
Improving Safety Further at Hamaoka Nuclear Power PlantSafety improvement measures for Hamaoka Nuclear Power Plant (prevent accidents and prepare for their occurrence)
Conformity inspection application
Inspection of application for approval of nuclear reactor establishment/change (basic design of equipment)
Inspection of application for approval of construction plan (detailed design of equipment)
Inspection of application for approval of change to operational safety program (operational management system, etc.)
Conformity to new regulatory
standards
Approval
Approval
Approval
Strengthen coordination with nation/local governments, etc.
Strengthen ability to respond on-site in an emergency
Education/training of personnel involved in activities to control an accident
Participation in nuclear emergency response drills organized by Shizuoka Prefecture
Implementation of combined exercises with the Omaezaki Coast Guard Station
Main inspection items and progress of application for approval of nuclear reactor establishment/change
Restart operations
Earthquake/tsunam
i related
Geology Site vicinity On the site
EarthquakeUnderground structures Oceanic intraplate earthquake
Interplate earthquake Inland crustal earthquake
Tsunami, etc. Tsunami Volcanic event/ground
Plant related
Design standards
Tornado Volcano
External fire Other natural phenomenon
Internal fire Internal inundation
Effectiveness assessment
Equipment/technical capabilities
Earthquake/tsunami-related inspection App-roval
Appli-cation Plant-related inspection
Serious accident countermeasures
Aseismic/anti-tsunami design policy
・
Legend: Mostly complete Under deliberation To be deliberation complete
As of December, 2018
Under a strong determination to “not allow another accident like that at the Fukushima Daiichi Nuclear Power Plant,” the Hamaoka Nuclear Power Plant has strengthened its equipment measures to improve safety and is going through an inspection of conformity with new regulatory standards by the Nuclear Regulation Authority.
Furthermore, we have strengthened our ability to respond on-site to ensure equipment functions effectively in an emergency and our coordination with national and local governments, etc., in case of an accident or problem.
We will strive to improve safety further and provide careful explanations, aiming to be a power plant that earns more trust from the public.
12
Copyright © CHUBU Electric Power Co.,Inc. All Right Reserved.
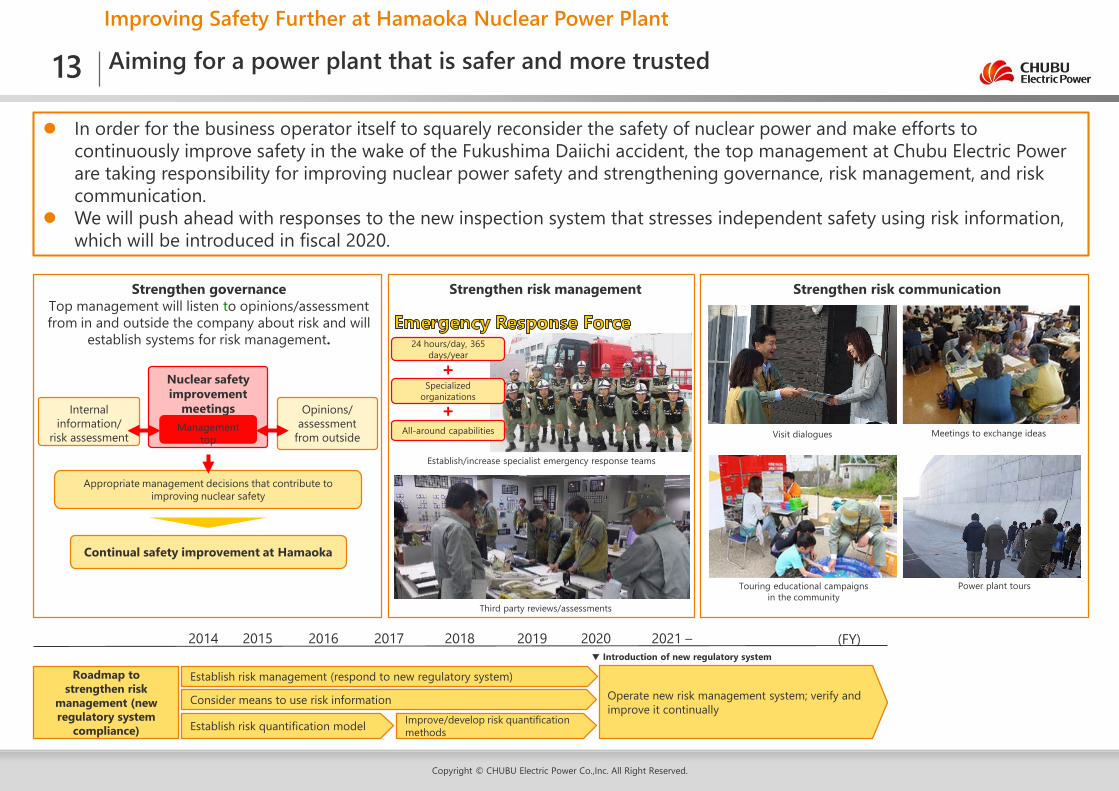
Improving Safety Further at Hamaoka Nuclear Power Plant
Aiming for a power plant that is safer and more trusted
2020 2021 –
Appropriate management decisions that contribute to improving nuclear safety
Nuclear safety improvement
meetings
2014 2017
Management top
Internal information/
risk assessment
Continual safety improvement at Hamaoka
Opinions/assessment
from outside
Strengthen risk communication
Visit dialogues Meetings to exchange ideas
Touring educational campaigns in the community
Power plant tours
Strengthen risk managementStrengthen governanceTop management will listen to opinions/assessment from in and outside the company about risk and will
establish systems for risk management.
Third party reviews/assessments
201920182015 2016
24 hours/day, 365 days/year
Specialized organizations
All-around capabilities
+
+
Establish/increase specialist emergency response teams
Establish risk management (respond to new regulatory system)Roadmap to strengthen risk
management (new regulatory system
compliance)
Consider means to use risk information
Establish risk quantification model
Operate new risk management system; verify and improve it continually
Improve/develop risk quantification methods
(FY)▼ Introduction of new regulatory system
In order for the business operator itself to squarely reconsider the safety of nuclear power and make efforts to continuously improve safety in the wake of the Fukushima Daiichi accident, the top management at Chubu Electric Power are taking responsibility for improving nuclear power safety and strengthening governance, risk management, and risk communication.
We will push ahead with responses to the new inspection system that stresses independent safety using risk information, which will be introduced in fiscal 2020.
13
Copyright © CHUBU Electric Power Co.,Inc. All Right Reserved.
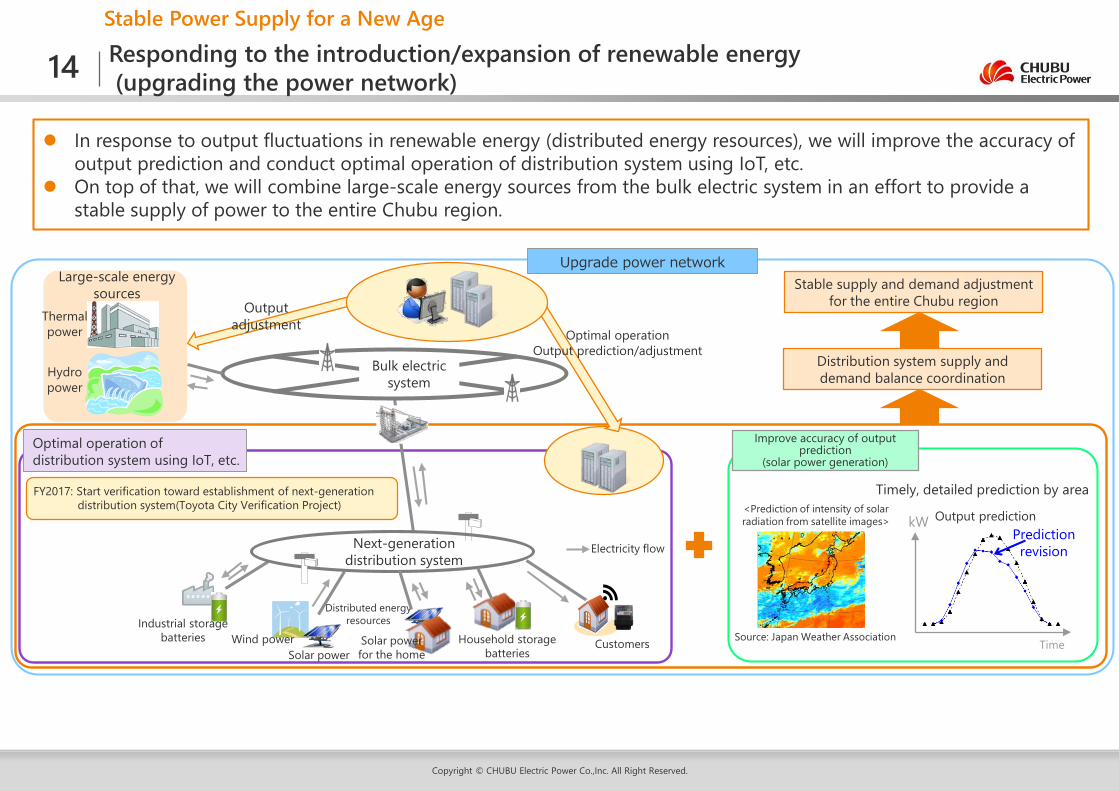
Stable Power Supply for a New AgeResponding to the introduction/expansion of renewable energy(upgrading the power network)
In response to output fluctuations in renewable energy (distributed energy resources), we will improve the accuracy of output prediction and conduct optimal operation of distribution system using IoT, etc.
On top of that, we will combine large-scale energy sources from the bulk electric system in an effort to provide a stable supply of power to the entire Chubu region.
Bulk electric system
kW
Timely, detailed prediction by area
Output prediction
Optimal operation of distribution system using IoT, etc.
Source: Japan Weather AssociationTime
<Prediction of intensity of solar radiation from satellite images>
Large-scale energy sources
Prediction revision
Output adjustment
Improve accuracy of output prediction
(solar power generation)
Optimal operationOutput prediction/adjustment
Thermal power
Hydropower
Household storage batteries
Industrial storage batteries
Next-generation distribution system
Wind powerSolar power
Customers
Distributed energy resources
Electricity flow
Solar power for the home
Upgrade power network
FY2017: Start verification toward establishment of next-generation distribution system(Toyota City Verification Project)
Distribution system supply and demand balance coordination
Stable supply and demand adjustment for the entire Chubu region
14
Copyright © CHUBU Electric Power Co.,Inc. All Right Reserved.
Strengthening Our Business Base for Growth and Achieving Sustainable Growth
Improve management efficiency to strengthen business base <1>
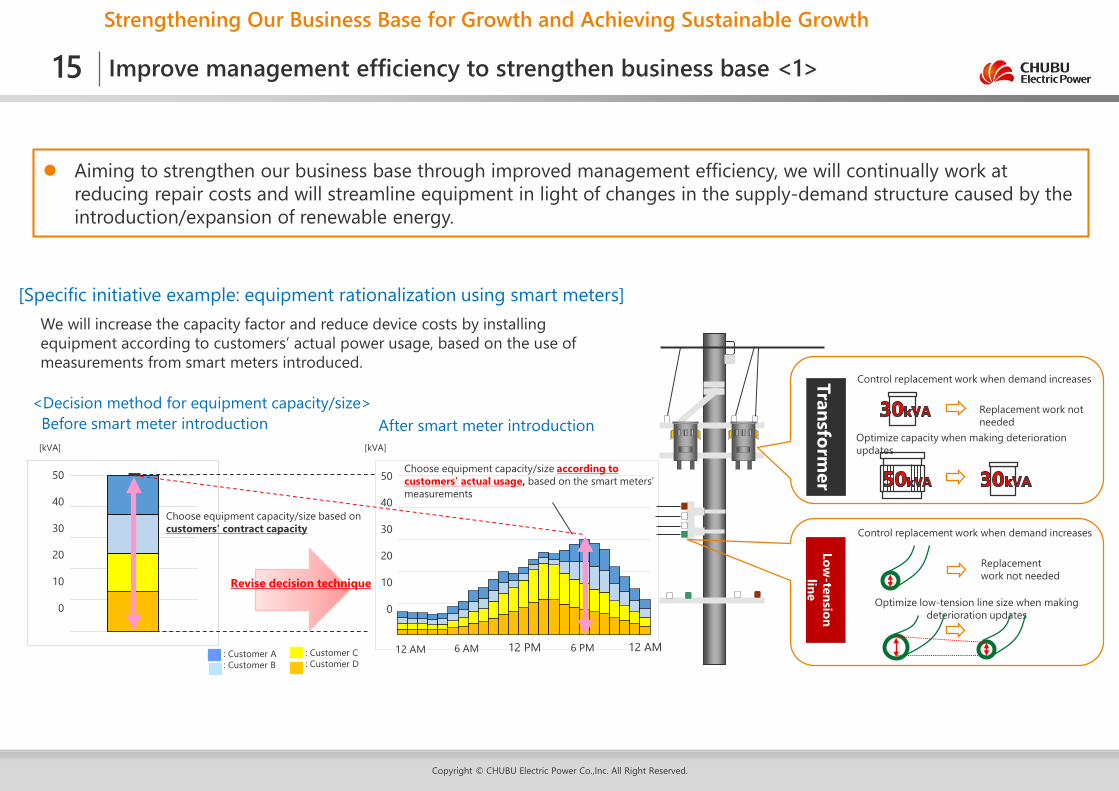
Aiming to strengthen our business base through improved management efficiency, we will continually work at reducing repair costs and will streamline equipment in light of changes in the supply-demand structure caused by the introduction/expansion of renewable energy.
[Specific initiative example: equipment rationalization using smart meters]
: Customer A: Customer B
: Customer C: Customer D
Choose equipment capacity/size based on customers’ contract capacity
Choose equipment capacity/size according to customers’ actual usage, based on the smart meters’ measurements
Revise decision technique
50
40
30
20
10
0
[kVA] [kVA]
12 PM 12 AM6 PM12 AM 6 AM
50
40
30
20
10
0
<Decision method for equipment capacity/size>
We will increase the capacity factor and reduce device costs by installing equipment according to customers’ actual power usage, based on the use of measurements from smart meters introduced.
Before smart meter introduction After smart meter introduction
Optimize low-tension line size when making deterioration updates
Transformer
Low-tension line
Control replacement work when demand increases
Replacement work not needed
Optimize capacity when making deterioration updates
Control replacement work when demand increases
Replacement work not needed
15
Copyright © CHUBU Electric Power Co.,Inc. All Right Reserved.
Strengthening Our Business Base for Growth and Achieving Sustainable Growth
Improve management efficiency to strengthen business base <2>
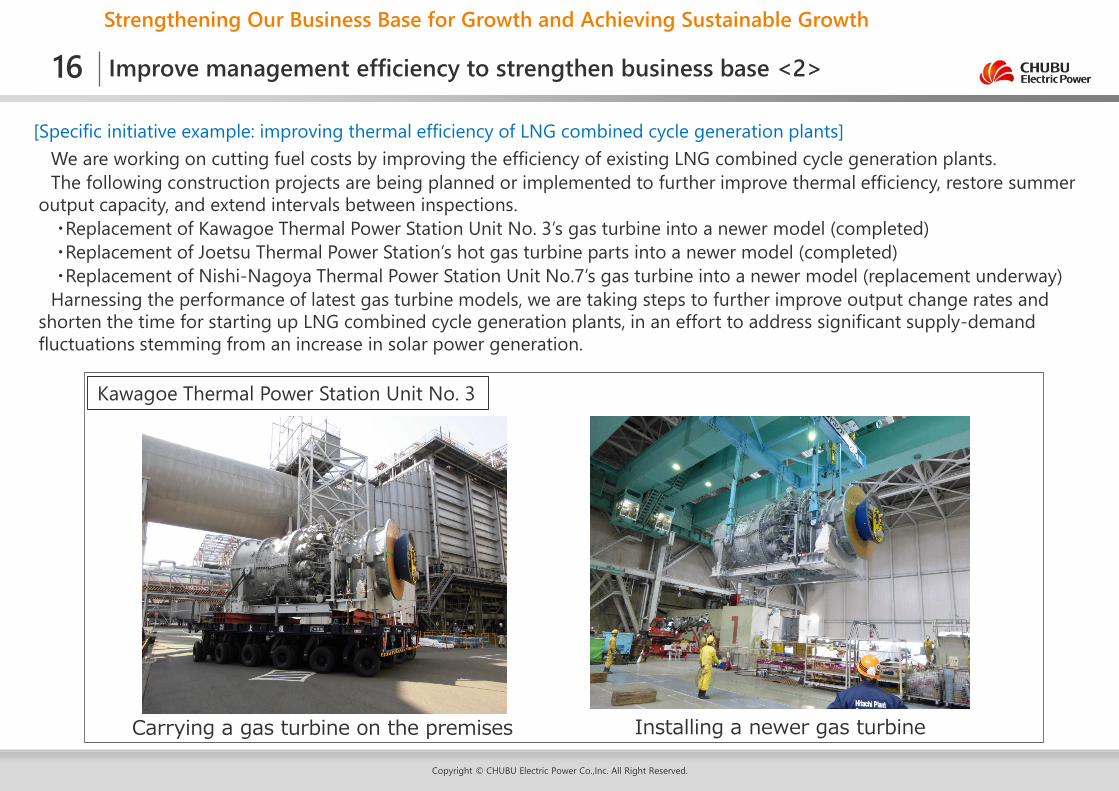
We are working on cutting fuel costs by improving the efficiency of existing LNG combined cycle generation plants.The following construction projects are being planned or implemented to further improve thermal efficiency, restore summer
output capacity, and extend intervals between inspections.・Replacement of Kawagoe Thermal Power Station Unit No. 3’s gas turbine into a newer model (completed)・Replacement of Joetsu Thermal Power Station’s hot gas turbine parts into a newer model (completed)・Replacement of Nishi-Nagoya Thermal Power Station Unit No.7’s gas turbine into a newer model (replacement underway)
Harnessing the performance of latest gas turbine models, we are taking steps to further improve output change rates and shorten the time for starting up LNG combined cycle generation plants, in an effort to address significant supply-demand fluctuations stemming from an increase in solar power generation.
16
Carrying a gas turbine on the premises Installing a newer gas turbine
[Specific initiative example: improving thermal efficiency of LNG combined cycle generation plants]
Kawagoe Thermal Power Station Unit No. 3
Copyright © CHUBU Electric Power Co.,Inc. All Right Reserved.
Strengthening Our Business Base for Growth and Achieving Sustainable Growth
Improve management efficiency to strengthen business base <3>
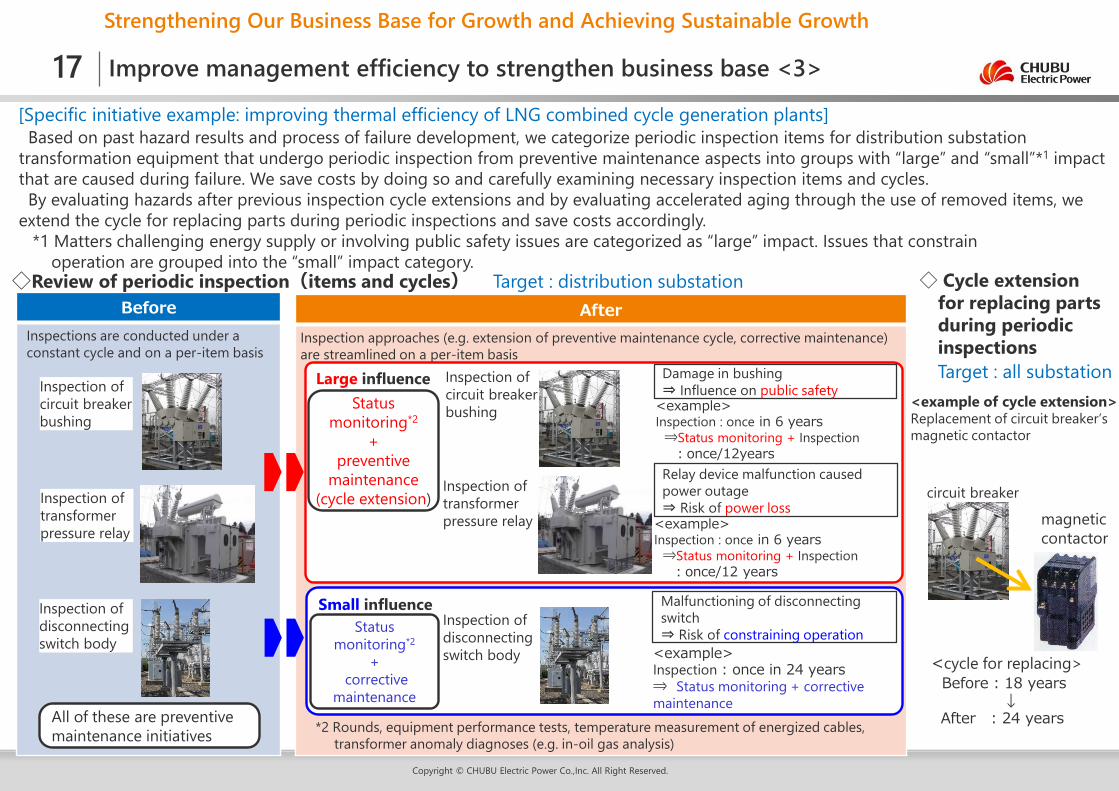
Based on past hazard results and process of failure development, we categorize periodic inspection items for distribution substation transformation equipment that undergo periodic inspection from preventive maintenance aspects into groups with “large” and “small”*1 impact that are caused during failure. We save costs by doing so and carefully examining necessary inspection items and cycles.By evaluating hazards after previous inspection cycle extensions and by evaluating accelerated aging through the use of removed items, we
extend the cycle for replacing parts during periodic inspections and save costs accordingly. *1 Matters challenging energy supply or involving public safety issues are categorized as “large” impact. Issues that constrain
operation are grouped into the “small” impact category.
17[Specific initiative example: improving thermal efficiency of LNG combined cycle generation plants]
AfterInspection approaches (e.g. extension of preventive maintenance cycle, corrective maintenance) are streamlined on a per-item basis
Large influence
Small influence
BeforeInspections are conducted under a constant cycle and on a per-item basis
*2 Rounds, equipment performance tests, temperature measurement of energized cables, transformer anomaly diagnoses (e.g. in-oil gas analysis)
Malfunctioning of disconnecting switch ⇒ Risk of constraining operation
Status monitoring*2
+ preventive
maintenance (cycle extension)
◇ Cycle extension for replacing parts during periodic inspections
◇Review of periodic inspection(items and cycles) Target : distribution substation
<example of cycle extension>Replacement of circuit breaker’s magnetic contactor
magnetic contactor
circuit breaker
Inspection of disconnecting switch body
Inspection of circuit breaker bushing
Inspection of transformer pressure relay
Relay device malfunction caused power outage⇒ Risk of power loss
All of these are preventive maintenance initiatives
Damage in bushing ⇒ Influence on public safety
Status monitoring*2
+corrective
maintenance
<cycle for replacing>Before : 18 years
↓After : 24 years
<example>Inspection : once in 6 years⇒Status monitoring + Inspection:once/12years
<example>Inspection : once in 24 years⇒ Status monitoring + corrective maintenance
Inspection of circuit breaker bushing
Inspection of transformer pressure relay
Inspection of disconnecting switch body
<example>Inspection : once in 6 years⇒Status monitoring + Inspection:once/12 years
Target : all substation
Copyright © CHUBU Electric Power Co.,Inc. All Right Reserved.
Strengthening Our Business Base for Growth and Achieving Sustainable Growth
Accelerate growth after completion of value chain in JERA
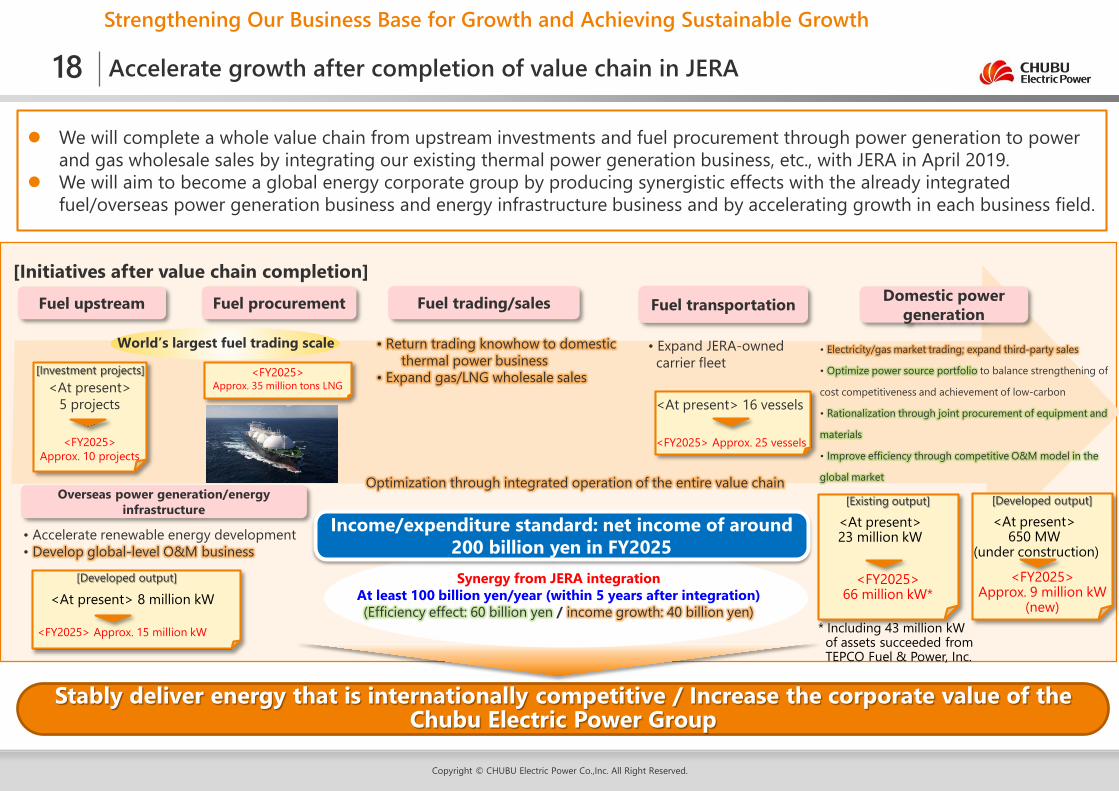
We will complete a whole value chain from upstream investments and fuel procurement through power generation to power and gas wholesale sales by integrating our existing thermal power generation business, etc., with JERA in April 2019.
We will aim to become a global energy corporate group by producing synergistic effects with the already integrated fuel/overseas power generation business and energy infrastructure business and by accelerating growth in each business field.
[Initiatives after value chain completion]Fuel trading/sales Fuel transportation Domestic power
generation
• Return trading knowhow to domestic thermal power business
• Expand gas/LNG wholesale sales
• Electricity/gas market trading; expand third-party sales
• Optimize power source portfolio to balance strengthening of
cost competitiveness and achievement of low-carbon
• Rationalization through joint procurement of equipment and
materials
• Improve efficiency through competitive O&M model in the
global marketOverseas power generation/energy
infrastructure
Optimization through integrated operation of the entire value chain
Stably deliver energy that is internationally competitive / Increase the corporate value of the Chubu Electric Power Group
• Accelerate renewable energy development• Develop global-level O&M business
Fuel upstream Fuel procurement
Income/expenditure standard: net income of around 200 billion yen in FY2025
• Expand JERA-owned carrier fleet
[Developed output]
<At present>650 MW
(under construction)
<FY2025>Approx. 9 million kW
(new)
[Developed output]
<At present> 8 million kW
<FY2025> Approx. 15 million kW
<At present> 16 vessels
<FY2025> Approx. 25 vessels
<At present>5 projects
<FY2025>Approx. 10 projects
Synergy from JERA integrationAt least 100 billion yen/year (within 5 years after integration)(Efficiency effect: 60 billion yen / income growth: 40 billion yen)
<FY2025>Approx. 35 million tons LNG
[Investment projects]
World’s largest fuel trading scale
18
[Existing output]
<At present>23 million kW
<FY2025>66 million kW*
* Including 43 million kW of assets succeeded from TEPCO Fuel & Power, Inc.
Copyright © CHUBU Electric Power Co.,Inc. All Right Reserved.
Strengthening Our Business Base for Growth and Achieving Sustainable Growth
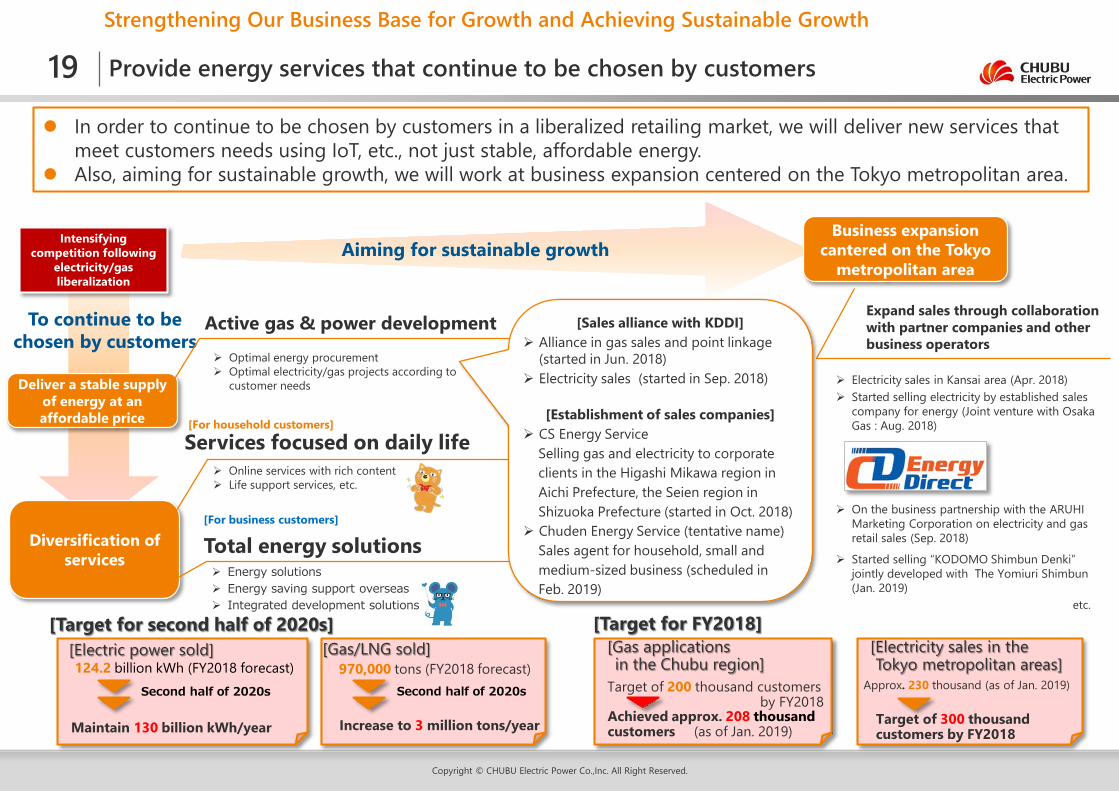
Provide energy services that continue to be chosen by customers
In order to continue to be chosen by customers in a liberalized retailing market, we will deliver new services that meet customers needs using IoT, etc., not just stable, affordable energy.
Also, aiming for sustainable growth, we will work at business expansion centered on the Tokyo metropolitan area.
Business expansion cantered on the Tokyo
metropolitan areaAiming for sustainable growth
Diversification of services
Deliver a stable supply of energy at an affordable price
To continue to be chosen by customers
Intensifying competition following
electricity/gas liberalization
Online services with rich content Life support services, etc.
Services focused on daily life[For household customers]
Total energy solutions[For business customers]
Energy solutions Energy saving support overseas Integrated development solutions
Expand sales through collaboration with partner companies and other business operators
Electricity sales in Kansai area (Apr. 2018) Started selling electricity by established sales
company for energy (Joint venture with Osaka Gas : Aug. 2018)
On the business partnership with the ARUHI Marketing Corporation on electricity and gas retail sales (Sep. 2018)
Started selling “KODOMO Shimbun Denki” jointly developed with The Yomiuri Shimbun (Jan. 2019)
etc.
Active gas & power development Optimal energy procurement Optimal electricity/gas projects according to
customer needs
[Sales alliance with KDDI] Alliance in gas sales and point linkage
(started in Jun. 2018) Electricity sales (started in Sep. 2018)
[Establishment of sales companies] CS Energy Service
Selling gas and electricity to corporate clients in the Higashi Mikawa region in Aichi Prefecture, the Seien region in Shizuoka Prefecture (started in Oct. 2018)
Chuden Energy Service (tentative name)Sales agent for household, small and medium-sized business (scheduled in Feb. 2019)
19
[Electric power sold]124.2 billion kWh (FY2018 forecast)
Maintain 130 billion kWh/year
Second half of 2020s
[Gas/LNG sold]970,000 tons (FY2018 forecast)
Increase to 3 million tons/year
[Target for second half of 2020s][Gas applications in the Chubu region]
Achieved approx. 208 thousand customers (as of Jan. 2019)
Target of 200 thousand customersby FY2018
[Electricity sales in the Tokyo metropolitan areas]
Approx. 230 thousand (as of Jan. 2019)
Target of 300 thousand customers by FY2018
[Target for FY2018]
Second half of 2020s
Copyright © CHUBU Electric Power Co.,Inc. All Right Reserved.
Strengthening Our Business Base for Growth and Achieving Sustainable Growth
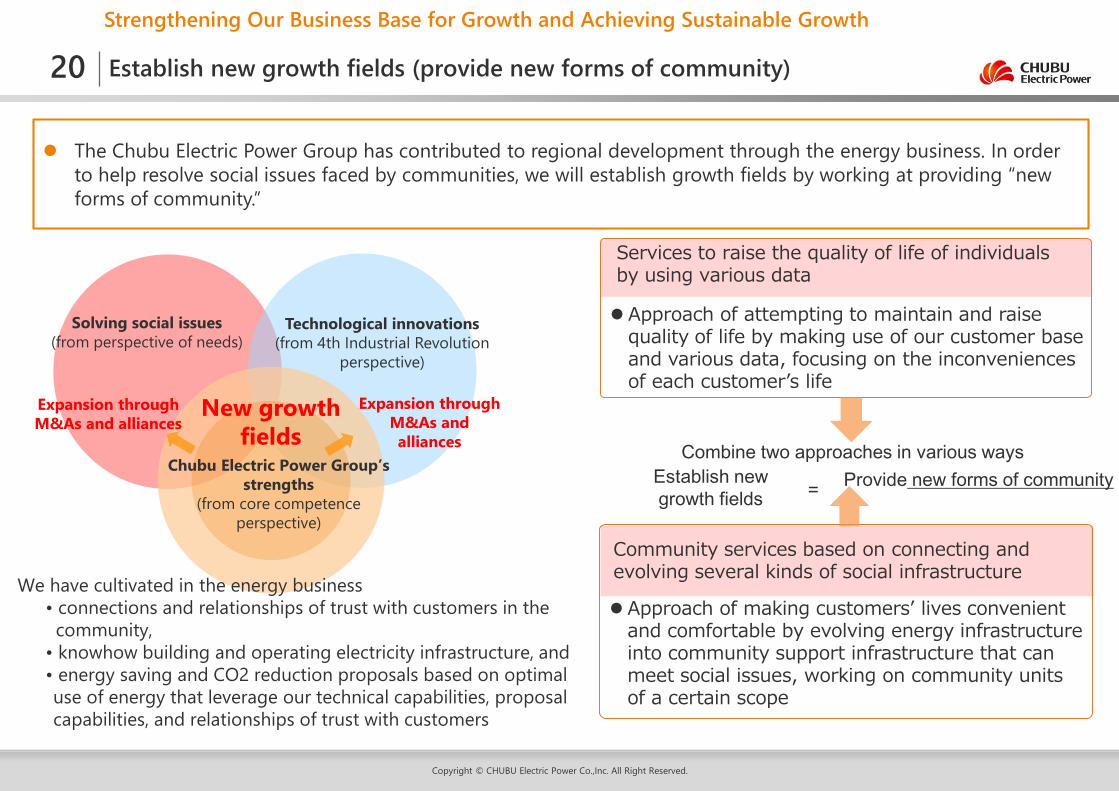
Establish new growth fields (provide new forms of community)
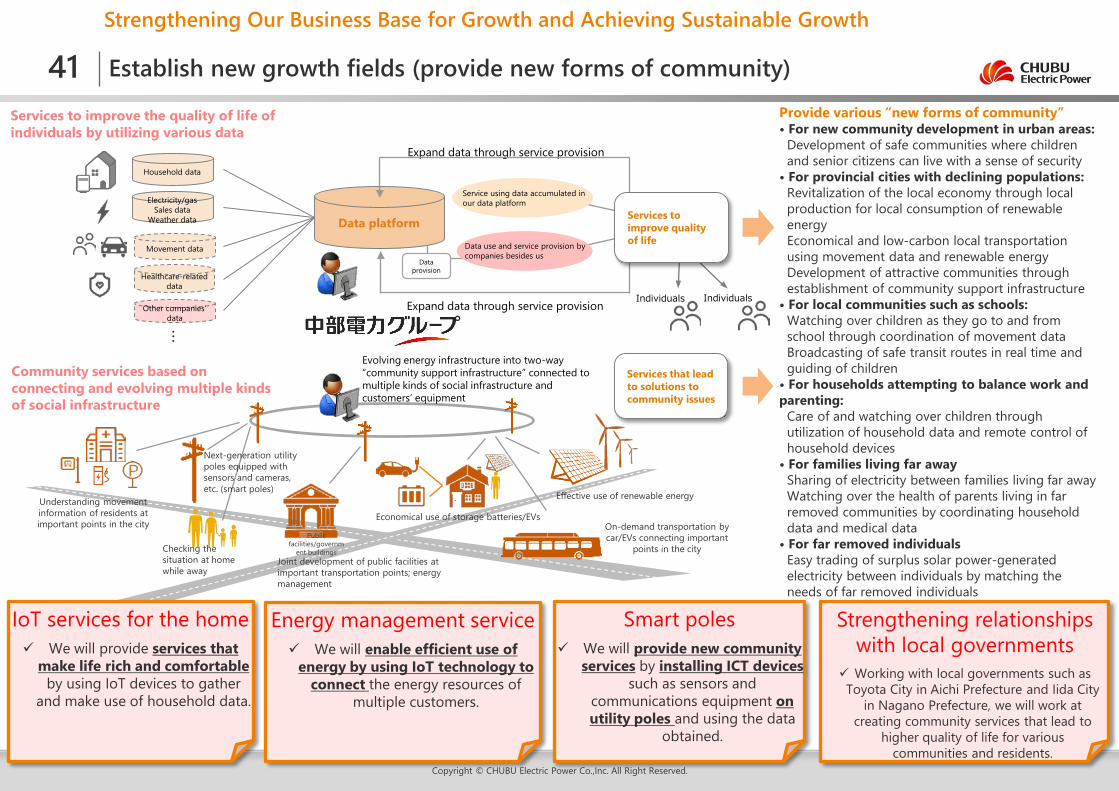
The Chubu Electric Power Group has contributed to regional development through the energy business. In order to help resolve social issues faced by communities, we will establish growth fields by working at providing “new forms of community.”
Approach of attempting to maintain and raise quality of life by making use of our customer base and various data, focusing on the inconveniences of each customer’s life
Services to raise the quality of life of individuals by using various data
Approach of making customers’ lives convenient and comfortable by evolving energy infrastructure into community support infrastructure that can meet social issues, working on community units of a certain scope
Community services based on connecting and evolving several kinds of social infrastructure
=Establish new growth fields
Provide new forms of communityCombine two approaches in various ways
Technological innovations(from 4th Industrial Revolution
perspective)
Solving social issues(from perspective of needs)
Chubu Electric Power Group’s strengths
(from core competence perspective)
New growth fields
Expansion through M&As and alliances
Expansion through M&As and alliances
We have cultivated in the energy business • connections and relationships of trust with customers in the
community, • knowhow building and operating electricity infrastructure, and• energy saving and CO2 reduction proposals based on optimal use of energy that leverage our technical capabilities, proposal capabilities, and relationships of trust with customers
20
Copyright © CHUBU Electric Power Co.,Inc. All Right Reserved.
Establishing a Business Structure/Management Base that can Respond Instantly to Environmental Changes
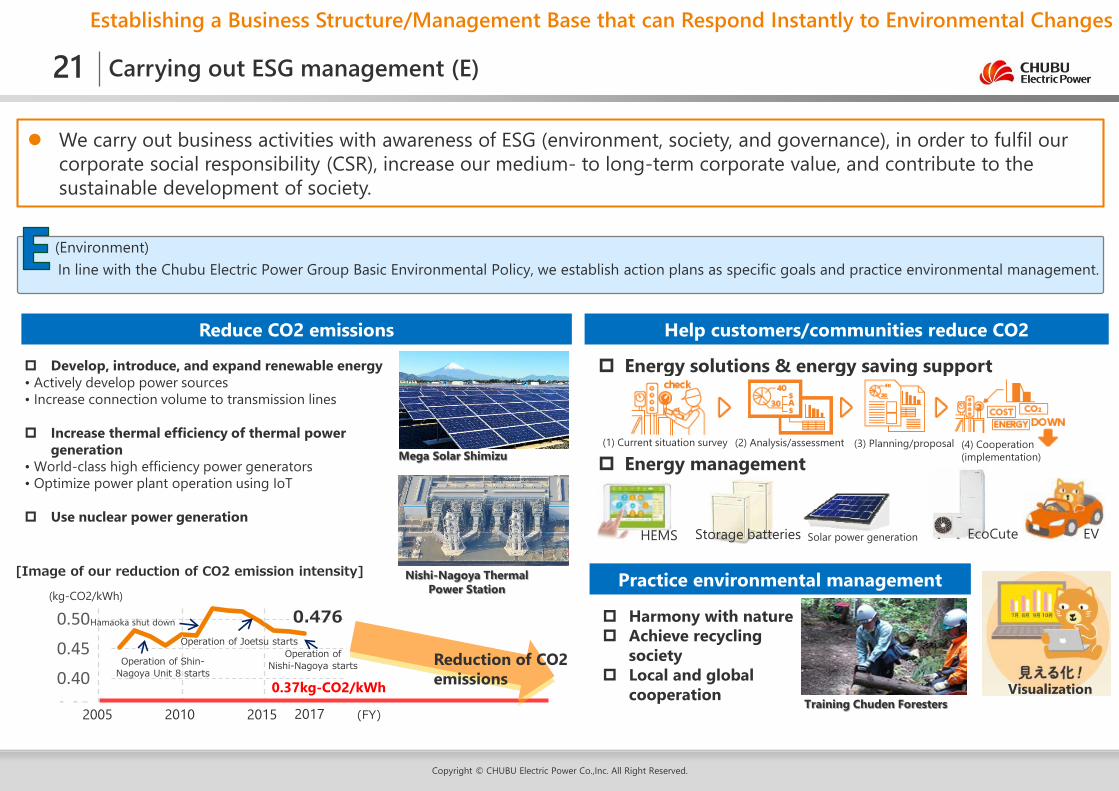
Carrying out ESG management (E)
We carry out business activities with awareness of ESG (environment, society, and governance), in order to fulfil our corporate social responsibility (CSR), increase our medium- to long-term corporate value, and contribute to the sustainable development of society.
Energy solutions & energy saving support
Energy management
(Environment)
Reduce CO2 emissions Help customers/communities reduce CO2
Practice environmental management
Develop, introduce, and expand renewable energy• Actively develop power sources• Increase connection volume to transmission lines
Increase thermal efficiency of thermal power generation
• World-class high efficiency power generators• Optimize power plant operation using IoT
Use nuclear power generation
Harmony with nature Achieve recycling
society Local and global
cooperation
In line with the Chubu Electric Power Group Basic Environmental Policy, we establish action plans as specific goals and practice environmental management.
0.35
0.40
0.45
0.50
[Image of our reduction of CO2 emission intensity]
(FY)
Operation of Shin-Nagoya Unit 8 starts
Operation of Joetsu starts
(kg-CO2/kWh)
0.37kg-CO2/kWh
Hamaoka shut down
2005 2010 2015
Reduction of CO2 emissions
(1) Current situation survey (2) Analysis/assessment (3) Planning/proposal (4) Cooperation (implementation)
EVEcoCuteSolar power generationHEMS
Training Chuden Foresters
Mega Solar Shimizu
Nishi-Nagoya Thermal Power Station
Storage batteries
Visualization
21
0.476
2017
Operation of Nishi-Nagoya starts
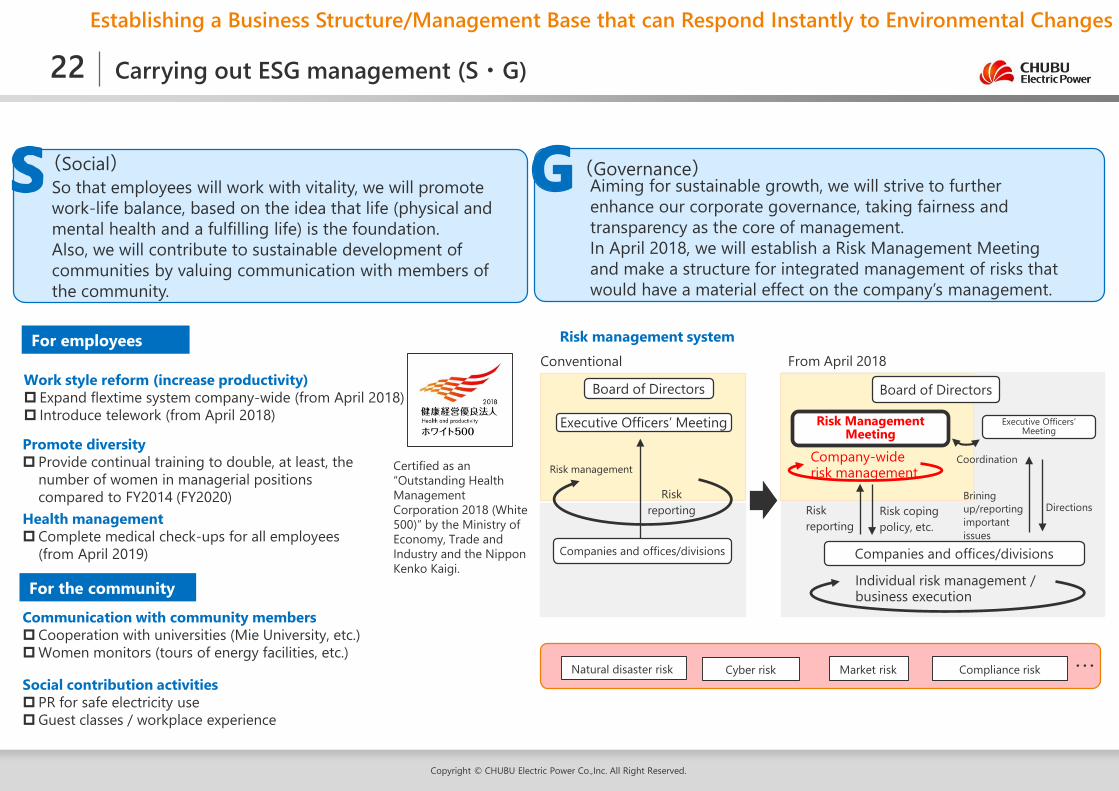
22 Carrying out ESG management (S・G)
Copyright © CHUBU Electric Power Co.,Inc. All Right Reserved.
Establishing a Business Structure/Management Base that can Respond Instantly to Environmental Changes
(Social) (Governance)
Certified as an “Outstanding Health Management Corporation 2018 (White 500)” by the Ministry of Economy, Trade and Industry and the Nippon Kenko Kaigi.
So that employees will work with vitality, we will promote work-life balance, based on the idea that life (physical and mental health and a fulfilling life) is the foundation.Also, we will contribute to sustainable development of communities by valuing communication with members of the community.
Aiming for sustainable growth, we will strive to further enhance our corporate governance, taking fairness and transparency as the core of management.In April 2018, we will establish a Risk Management Meeting and make a structure for integrated management of risks that would have a material effect on the company’s management.
For employees
For the community
Work style reform (increase productivity) Expand flextime system company-wide (from April 2018) Introduce telework (from April 2018)
Health managementComplete medical check-ups for all employees
(from April 2019)
Promote diversity Provide continual training to double, at least, the
number of women in managerial positions compared to FY2014 (FY2020)
Communication with community membersCooperation with universities (Mie University, etc.)Women monitors (tours of energy facilities, etc.)
Social contribution activities PR for safe electricity useGuest classes / workplace experience
Risk management system
Board of Directors
Executive Officers’ Meeting
Companies and offices/divisions
Risk management
Risk reporting
Board of Directors
Risk reporting
Risk coping policy, etc.
Risk Management Meeting
Coordination
Individual risk management / business execution
Companies and offices/divisions
Executive Officers’ Meeting
Company-wide risk management
Brining up/reporting important issues
Conventional From April 2018
Directions
Natural disaster risk Compliance riskMarket riskCyber risk ・・・
Reference Data(1): Financial Results
Copyright © CHUBU Electric Power Co.,Inc. All Right Reserved.
03
Copyright © CHUBU Electric Power Co.,Inc. All Right Reserved.
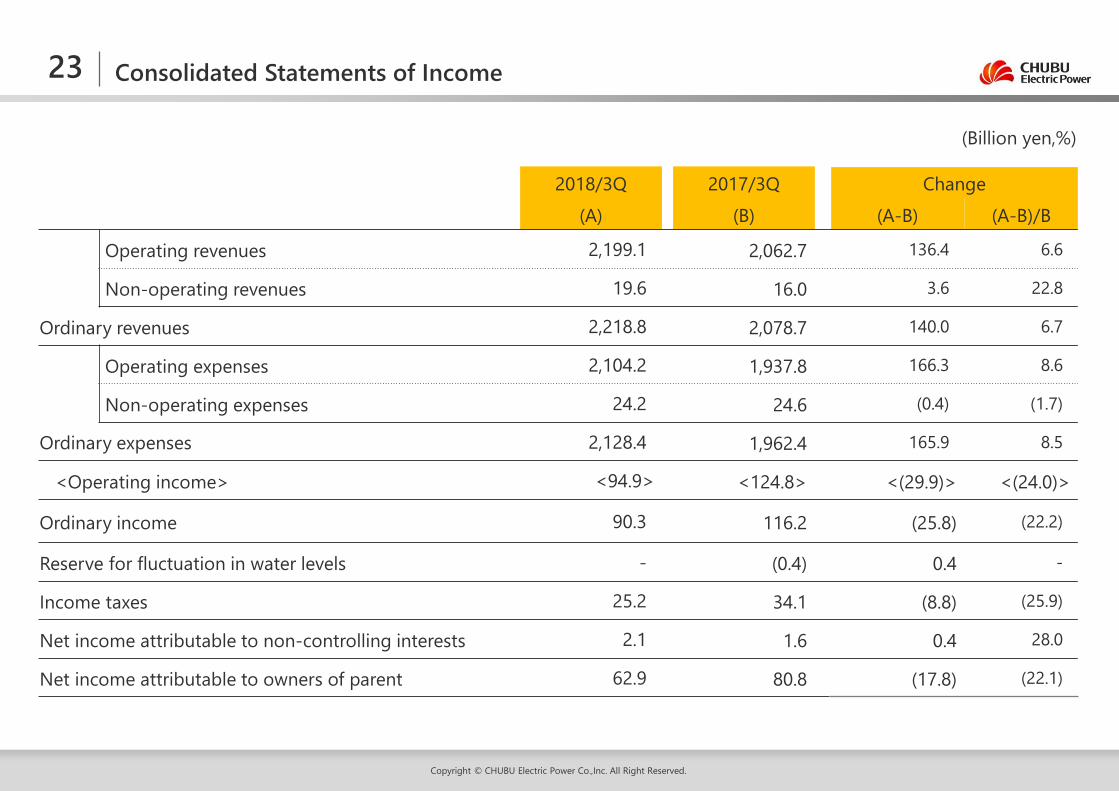
Consolidated Statements of Income
2018/3Q 2017/3Q Change(A) (B) (A-B) (A-B)/B
Operating revenues 2,199.1 2,062.7 136.4 6.6
Non-operating revenues 19.6 16.0 3.6 22.8
Ordinary revenues 2,218.8 2,078.7 140.0 6.7
Operating expenses 2,104.2 1,937.8 166.3 8.6
Non-operating expenses 24.2 24.6 (0.4) (1.7)
Ordinary expenses 2,128.4 1,962.4 165.9 8.5
<Operating income> <94.9> <124.8> <(29.9)> <(24.0)>
Ordinary income 90.3 116.2 (25.8) (22.2)
Reserve for fluctuation in water levels - (0.4) 0.4 -
Income taxes 25.2 34.1 (8.8) (25.9)
Net income attributable to non-controlling interests 2.1 1.6 0.4 28.0
Net income attributable to owners of parent 62.9 80.8 (17.8) (22.1)
(Billion yen,%)
23
Copyright © CHUBU Electric Power Co.,Inc. All Right Reserved.
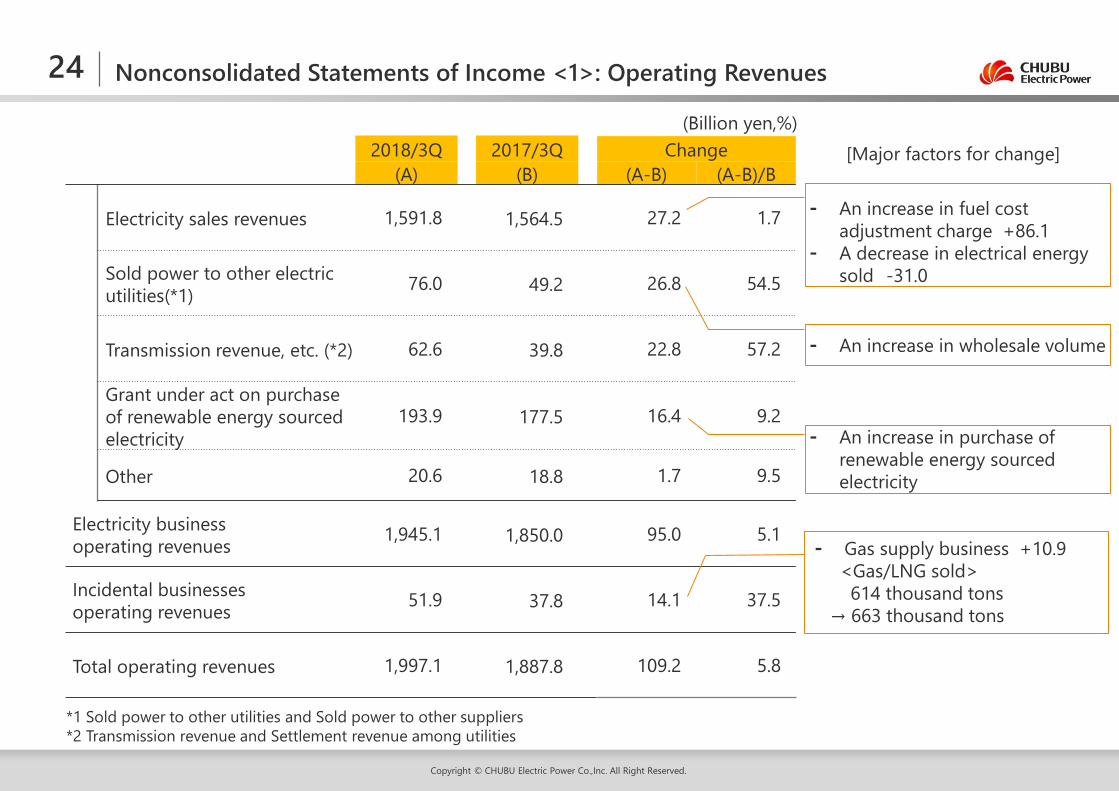
Nonconsolidated Statements of Income <1>: Operating Revenues
(Billion yen,%)[Major factors for change]
24
2018/3Q 2017/3Q Change(A) (B) (A-B) (A-B)/B
Electricity sales revenues 1,591.8 1,564.5 27.2 1.7
Sold power to other electric utilities(*1) 76.0 49.2 26.8 54.5
Transmission revenue, etc. (*2) 62.6 39.8 22.8 57.2
Grant under act on purchase of renewable energy sourced electricity
193.9 177.5 16.4 9.2
Other 20.6 18.8 1.7 9.5
Electricity businessoperating revenues 1,945.1 1,850.0 95.0 5.1
Incidental businesses operating revenues 51.9 37.8 14.1 37.5
Total operating revenues 1,997.1 1,887.8 109.2 5.8
*1 Sold power to other utilities and Sold power to other suppliers *2 Transmission revenue and Settlement revenue among utilities
⁃ An increase in purchase of renewable energy sourced electricity
⁃ Gas supply business +10.9<Gas/LNG sold>
614 thousand tons→ 663 thousand tons
⁃ An increase in wholesale volume
⁃ An increase in fuel cost adjustment charge +86.1
⁃ A decrease in electrical energy sold -31.0
・A decrease in fuel cost by Nishi-Nagoya thermal power plant ・An increase in hydroelectric power
generated
Copyright © CHUBU Electric Power Co.,Inc. All Right Reserved.
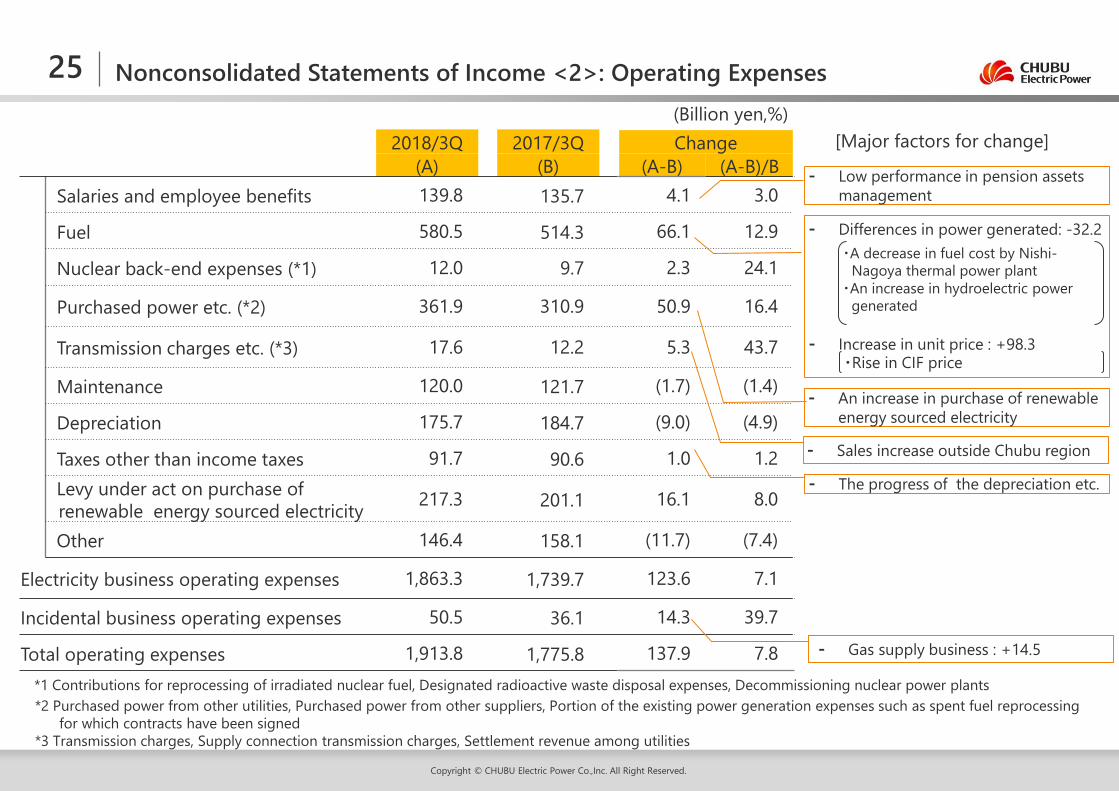
Nonconsolidated Statements of Income <2>: Operating Expenses(Billion yen,%)
[Major factors for change]
25
2018/3Q 2017/3Q Change(A) (B) (A-B) (A-B)/B
Salaries and employee benefits 139.8 135.7 4.1 3.0
Fuel 580.5 514.3 66.1 12.9
Nuclear back-end expenses (*1) 12.0 9.7 2.3 24.1
Purchased power etc. (*2) 361.9 310.9 50.9 16.4
Transmission charges etc. (*3) 17.6 12.2 5.3 43.7
Maintenance 120.0 121.7 (1.7) (1.4)
Depreciation 175.7 184.7 (9.0) (4.9)
Taxes other than income taxes 91.7 90.6 1.0 1.2Levy under act on purchase of renewable energy sourced electricity 217.3 201.1 16.1 8.0
Other 146.4 158.1 (11.7) (7.4)
Electricity business operating expenses 1,863.3 1,739.7 123.6 7.1
Incidental business operating expenses 50.5 36.1 14.3 39.7
Total operating expenses 1,913.8 1,775.8 137.9 7.8
*2 Purchased power from other utilities, Purchased power from other suppliers, Portion of the existing power generation expenses such as spent fuel reprocessing for which contracts have been signed
*3 Transmission charges, Supply connection transmission charges, Settlement revenue among utilities
*1 Contributions for reprocessing of irradiated nuclear fuel, Designated radioactive waste disposal expenses, Decommissioning nuclear power plants
⁃ Differences in power generated: -32.2
⁃ Increase in unit price : +98.3
⁃ An increase in purchase of renewable energy sourced electricity
⁃ Gas supply business : +14.5
・Rise in CIF price
⁃ Sales increase outside Chubu region
⁃ The progress of the depreciation etc.
⁃ Low performance in pension assets management
Copyright © CHUBU Electric Power Co.,Inc. All Right Reserved.
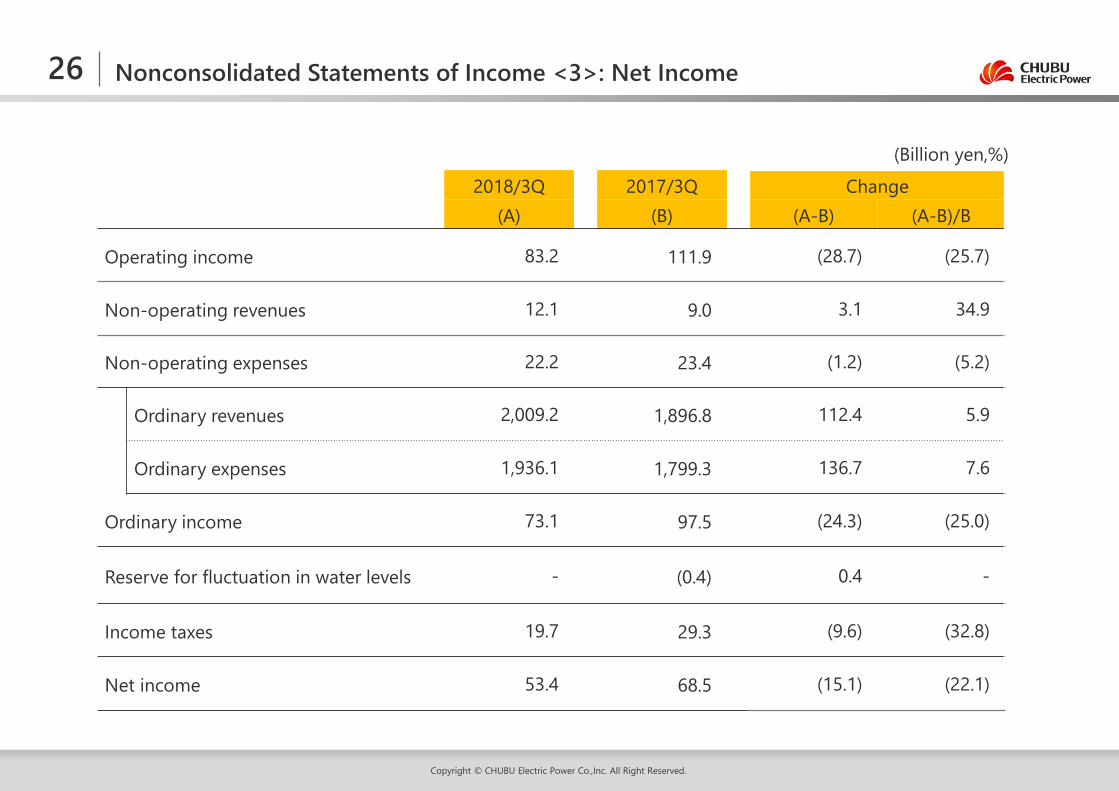
Nonconsolidated Statements of Income <3>: Net Income
2018/3Q 2017/3Q Change(A) (B) (A-B) (A-B)/B
Operating income 83.2 111.9 (28.7) (25.7)
Non-operating revenues 12.1 9.0 3.1 34.9
Non-operating expenses 22.2 23.4 (1.2) (5.2)
Ordinary revenues 2,009.2 1,896.8 112.4 5.9
Ordinary expenses 1,936.1 1,799.3 136.7 7.6
Ordinary income 73.1 97.5 (24.3) (25.0)
Reserve for fluctuation in water levels - (0.4) 0.4 -
Income taxes 19.7 29.3 (9.6) (32.8)
Net income 53.4 68.5 (15.1) (22.1)
(Billion yen,%)
26
Copyright © CHUBU Electric Power Co.,Inc. All Right Reserved.
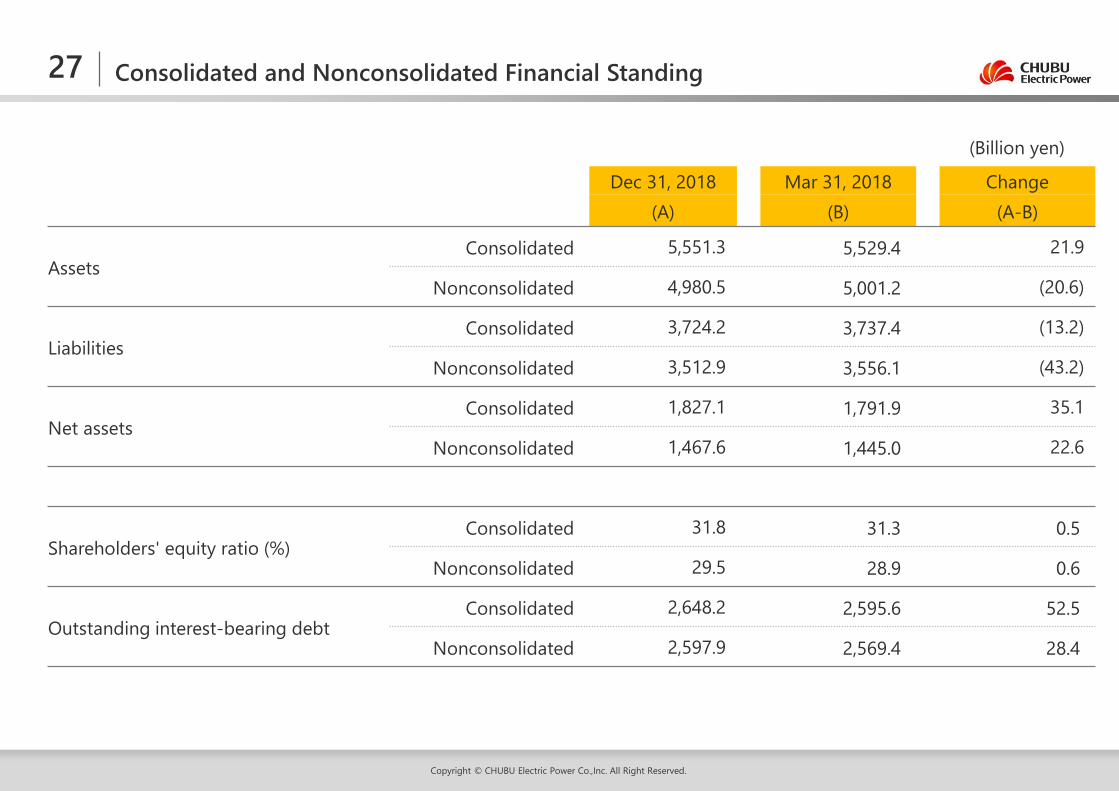
Consolidated and Nonconsolidated Financial Standing
(Billion yen)
27
Dec 31, 2018 Mar 31, 2018 Change(A) (B) (A-B)
AssetsConsolidated 5,551.3 5,529.4 21.9
Nonconsolidated 4,980.5 5,001.2 (20.6)
LiabilitiesConsolidated 3,724.2 3,737.4 (13.2)
Nonconsolidated 3,512.9 3,556.1 (43.2)
Net assetsConsolidated 1,827.1 1,791.9 35.1
Nonconsolidated 1,467.6 1,445.0 22.6
Shareholders' equity ratio (%)Consolidated 31.8 31.3 0.5
Nonconsolidated 29.5 28.9 0.6
Outstanding interest-bearing debtConsolidated 2,648.2 2,595.6 52.5
Nonconsolidated 2,597.9 2,569.4 28.4
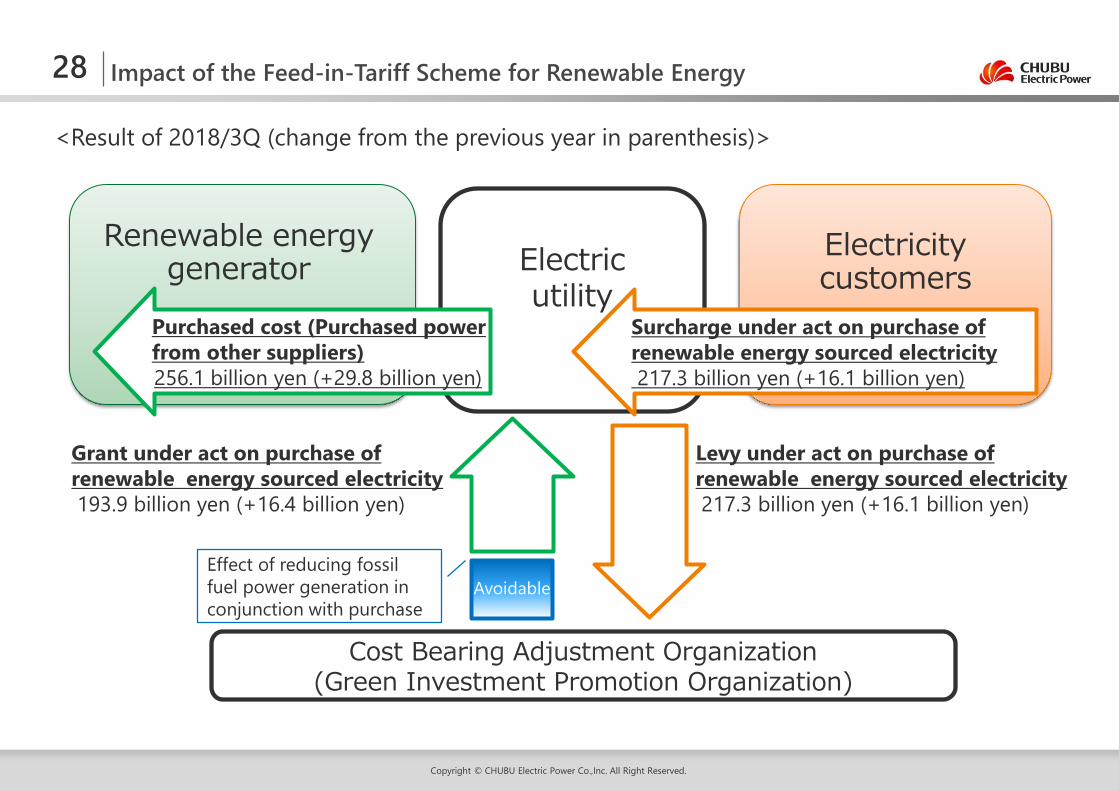
Electricitycustomers
Renewable energygenerator
Impact of the Feed-in-Tariff Scheme for Renewable Energy
Cost Bearing Adjustment Organization(Green Investment Promotion Organization)
Electricutility
Levy under act on purchase of renewable energy sourced electricity217.3 billion yen (+16.1 billion yen)
Purchased cost (Purchased power from other suppliers)256.1 billion yen (+29.8 billion yen)
Surcharge under act on purchase of renewable energy sourced electricity 217.3 billion yen (+16.1 billion yen)
AvoidableEffect of reducing fossil fuel power generation in conjunction with purchase
28
Copyright © CHUBU Electric Power Co.,Inc. All Right Reserved.
Grant under act on purchase of renewable energy sourced electricity193.9 billion yen (+16.4 billion yen)
<Result of 2018/3Q (change from the previous year in parenthesis)>
(150.0)
(100.0)
(50.0)
0.0
50.0
100.0
150.0
200.0
250.0
300.0
2009 2010 2011 2012 2013 2014 2015 2016 2017 2018
Nonconsolidated Consolidated
(Forecast)
Copyright © CHUBU Electric Power Co.,Inc. All Right Reserved.
(150.0)
(100.0)
(50.0)
0.0
50.0
100.0
150.0
200.0
250.0
300.0
2009 2010 2011 2012 2013 2014 2015 2016 2017 2018
Nonconsolidated Consolidated
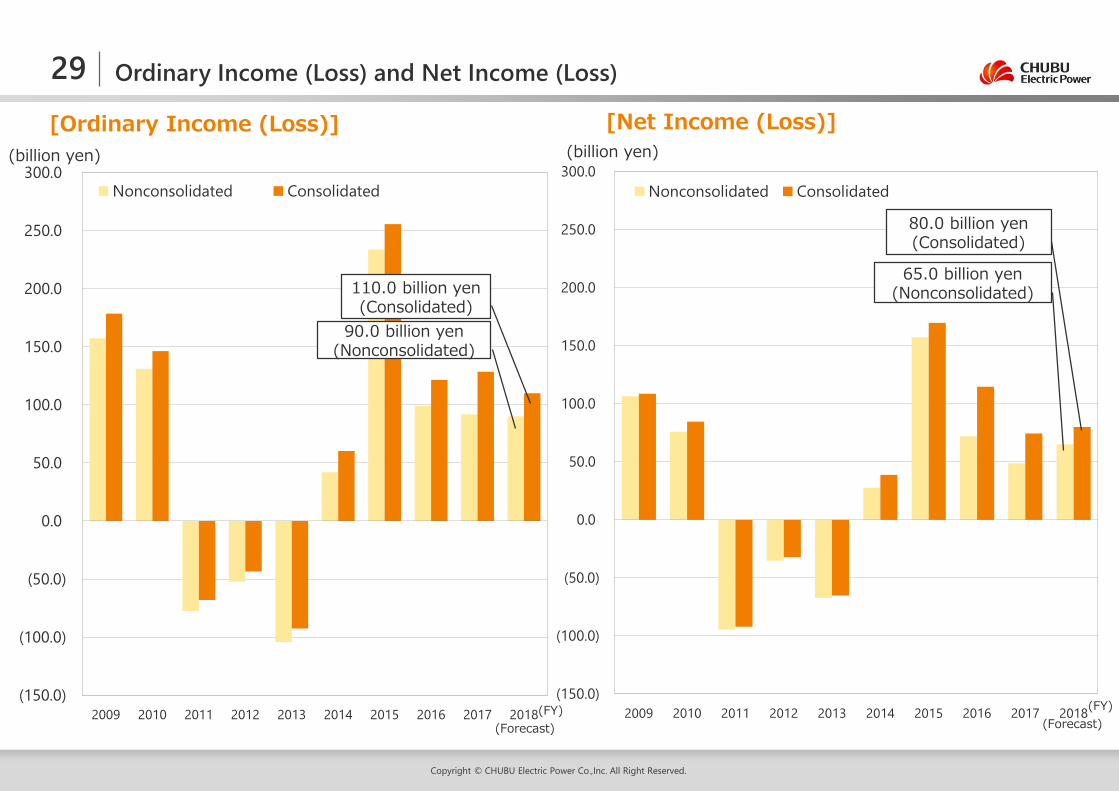
[Ordinary Income (Loss)] [Net Income (Loss)]
110.0 billion yen(Consolidated)
Ordinary Income (Loss) and Net Income (Loss)
(billion yen)
(FY)
90.0 billion yen(Nonconsolidated)
29
(Forecast)(FY)
(billion yen)
80.0 billion yen(Consolidated)
65.0 billion yen(Nonconsolidated)
Copyright © CHUBU Electric Power Co.,Inc. All Right Reserved.
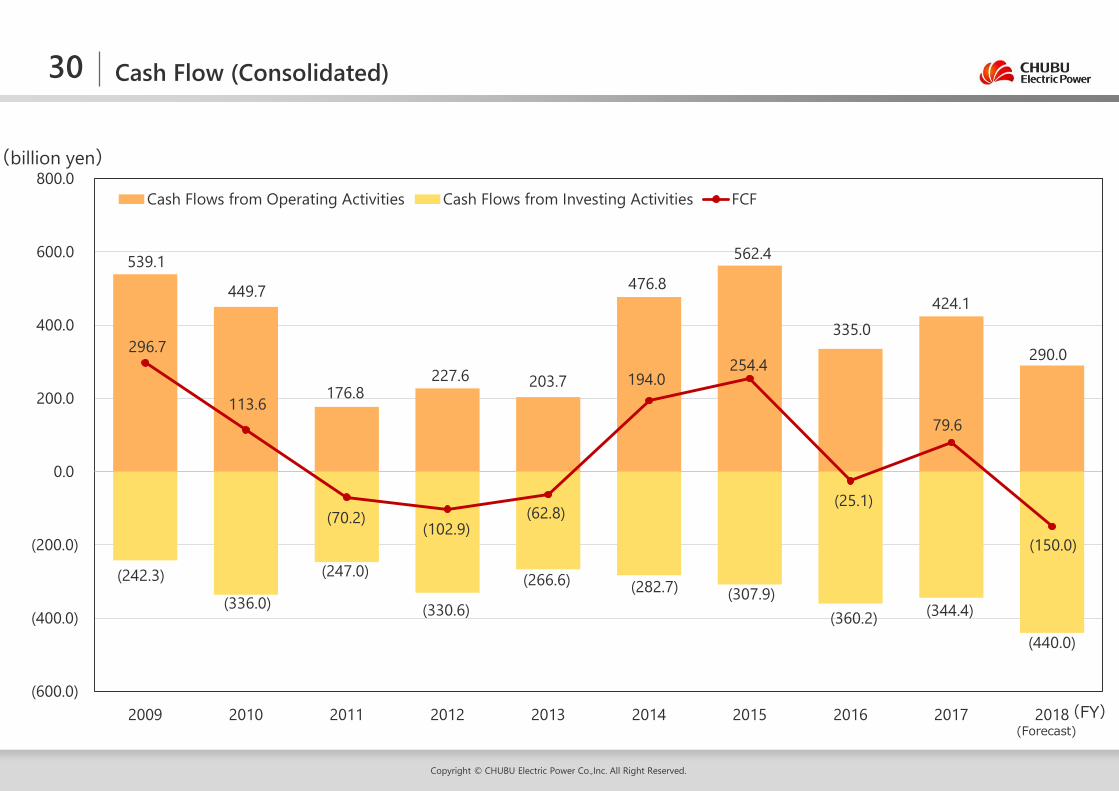
30 Cash Flow (Consolidated)
(billion yen)
539.1
449.7
176.8227.6 203.7
476.8
562.4
335.0 424.1
290.0
(242.3)(336.0)
(247.0)
(330.6)
(266.6) (282.7) (307.9)(360.2) (344.4)
(440.0)
296.7
113.6
(70.2)(102.9)
(62.8)
194.0 254.4
(25.1)
79.6
(150.0)
2009 2010 2011 2012 2013 2014 2015 2016 2017 2018(600.0)
(400.0)
(200.0)
0.0
200.0
400.0
600.0
800.0Cash Flows from Operating Activities Cash Flows from Investing Activities FCF
(FY)(Forecast)
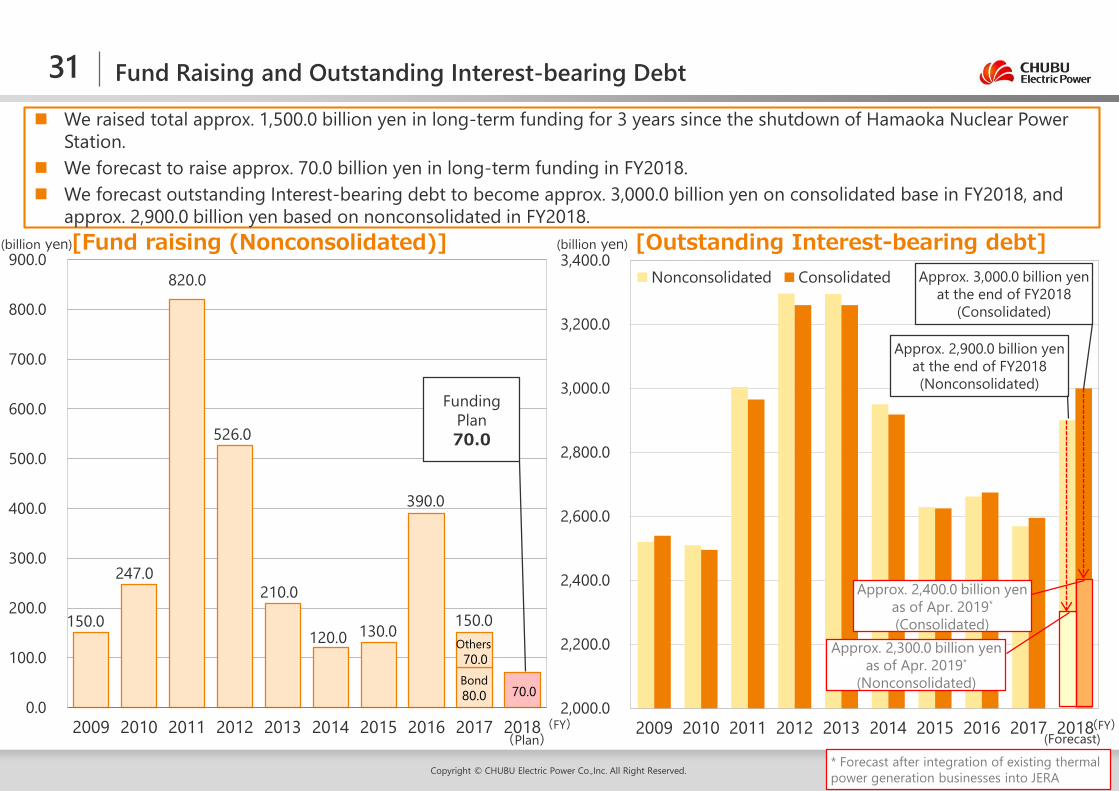
We raised total approx. 1,500.0 billion yen in long-term funding for 3 years since the shutdown of Hamaoka Nuclear Power Station.
We forecast to raise approx. 70.0 billion yen in long-term funding in FY2018. We forecast outstanding Interest-bearing debt to become approx. 3,000.0 billion yen on consolidated base in FY2018, and
approx. 2,900.0 billion yen based on nonconsolidated in FY2018.
Copyright © CHUBU Electric Power Co.,Inc. All Right Reserved.
31 Fund Raising and Outstanding Interest-bearing Debt
0.0
100.0
200.0
300.0
400.0
500.0
600.0
700.0
800.0
900.0
2009 2010 2011 2012 2013 2014 2015 2016 2017 2018
Bond80.0
Others70.0
70.0
820.0
526.0
210.0
120.0 130.0
(billion yen)
(FY)
390.0
150.0150.0
247.0
(Plan)
[Fund raising (Nonconsolidated)] [Outstanding Interest-bearing debt]
2,000.0
2,200.0
2,400.0
2,600.0
2,800.0
3,000.0
3,200.0
3,400.0
2009 2010 2011 2012 2013 2014 2015 2016 2017 2018
Nonconsolidated Consolidated
(Forecast)
(billion yen)
Approx. 3,000.0 billion yenat the end of FY2018
(Consolidated)
(FY)
Funding Plan70.0
Approx. 2,400.0 billion yenas of Apr. 2019*
(Consolidated)
Approx. 2,900.0 billion yenat the end of FY2018(Nonconsolidated)
Approx. 2,300.0 billion yenas of Apr. 2019*
(Nonconsolidated)
* Forecast after integration of existing thermal power generation businesses into JERA
Copyright © CHUBU Electric Power Co.,Inc. All Right Reserved.
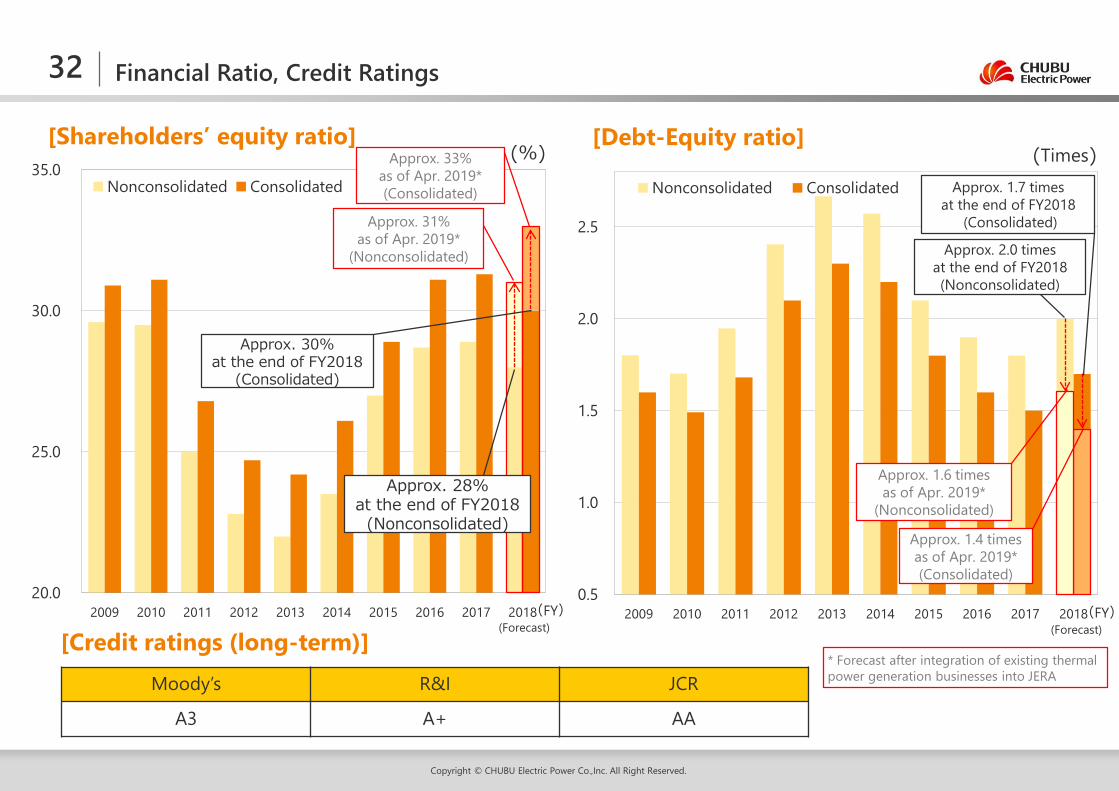
Financial Ratio, Credit Ratings
[Shareholders’ equity ratio] [Debt-Equity ratio]
[Credit ratings (long-term)]Moody’s R&I JCR
A3 A+ AA
(%) (Times)
32
20.0
25.0
30.0
35.0
2009 2010 2011 2012 2013 2014 2015 2016 2017 2018
Nonconsolidated Consolidated
0.5
1.0
1.5
2.0
2.5
2009 2010 2011 2012 2013 2014 2015 2016 2017 2018
Nonconsolidated Consolidated
Approx. 2.0 timesat the end of FY2018(Nonconsolidated)
Approx. 33%as of Apr. 2019*(Consolidated)
Approx. 28%at the end of FY2018
(Nonconsolidated)
Approx. 31%as of Apr. 2019*
(Nonconsolidated)
Approx. 1.4 timesas of Apr. 2019*(Consolidated)
Approx. 1.7 timesat the end of FY2018
(Consolidated)
* Forecast after integration of existing thermal power generation businesses into JERA
Approx. 30%at the end of FY2018
(Consolidated)
(FY)(Forecast)
(FY)(Forecast)
Approx. 1.6 timesas of Apr. 2019*
(Nonconsolidated)
Copyright © CHUBU Electric Power Co.,Inc. All Right Reserved.
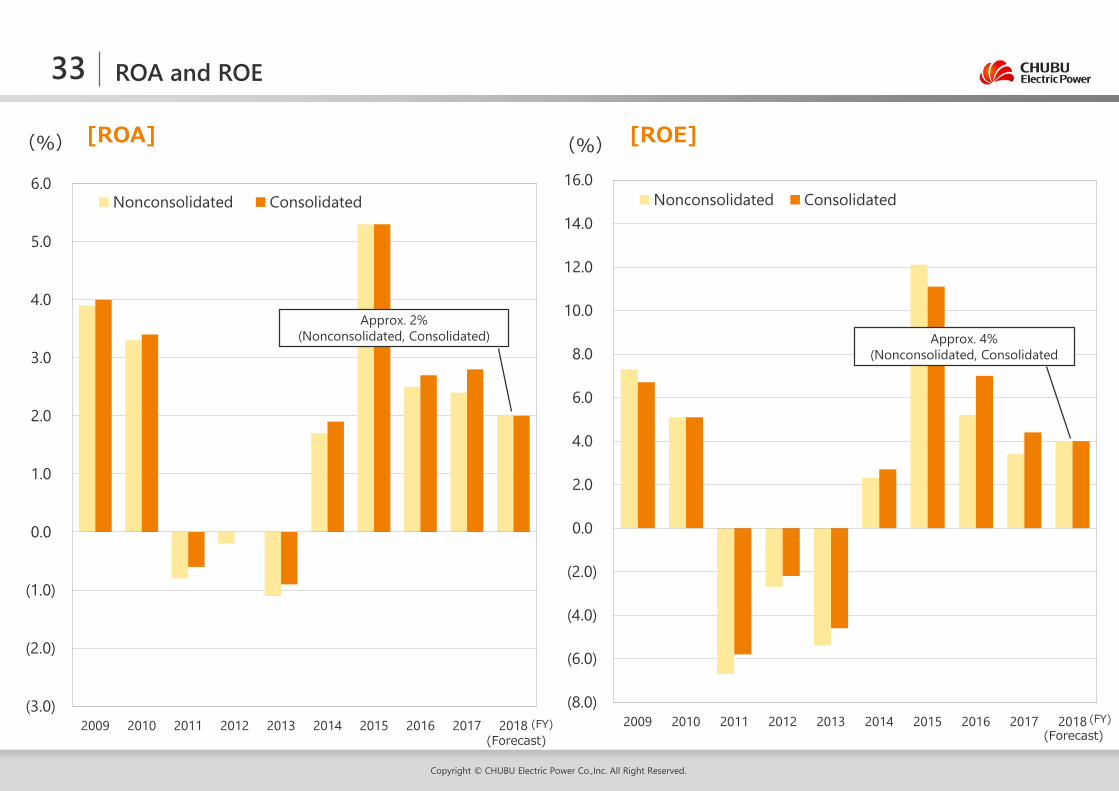
[ROA] [ROE]
ROA and ROE
(%)
33
(3.0)
(2.0)
(1.0)
0.0
1.0
2.0
3.0
4.0
5.0
6.0
2009 2010 2011 2012 2013 2014 2015 2016 2017 2018
Nonconsolidated Consolidated
(8.0)
(6.0)
(4.0)
(2.0)
0.0
2.0
4.0
6.0
8.0
10.0
12.0
14.0
16.0
2009 2010 2011 2012 2013 2014 2015 2016 2017 2018
Nonconsolidated Consolidated
Approx. 4%(Nonconsolidated, Consolidated
(%)
Approx. 2%(Nonconsolidated, Consolidated)
(Forecast)(FY) (FY)
(Forecast)
Copyright © CHUBU Electric Power Co.,Inc. All Right Reserved.
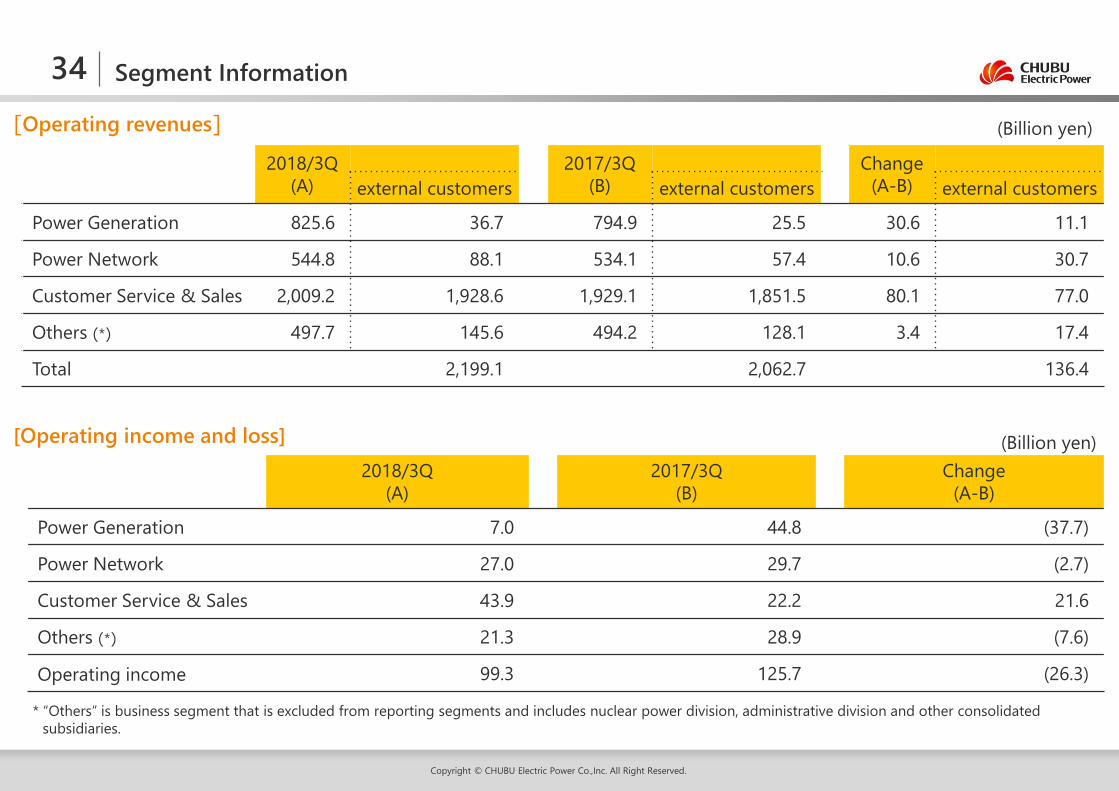
Segment Information34[Operating revenues]
[Operating income and loss]
2018/3Q(A)
2017/3Q(B)
Change(A-B)external customers external customers external customers
Power Generation 825.6 36.7 794.9 25.5 30.6 11.1
Power Network 544.8 88.1 534.1 57.4 10.6 30.7
Customer Service & Sales 2,009.2 1,928.6 1,929.1 1,851.5 80.1 77.0
Others (*) 497.7 145.6 494.2 128.1 3.4 17.4
Total 2,199.1 2,062.7 136.4
2018/3Q(A)
2017/3Q(B)
Change(A-B)
Power Generation 7.0 44.8 (37.7)
Power Network 27.0 29.7 (2.7)
Customer Service & Sales 43.9 22.2 21.6
Others (*) 21.3 28.9 (7.6)
Operating income 99.3 125.7 (26.3)
* “Others” is business segment that is excluded from reporting segments and includes nuclear power division, administrative division and other consolidated subsidiaries.
(Billion yen)
(Billion yen)
Copyright © CHUBU Electric Power Co.,Inc. All Right Reserved.
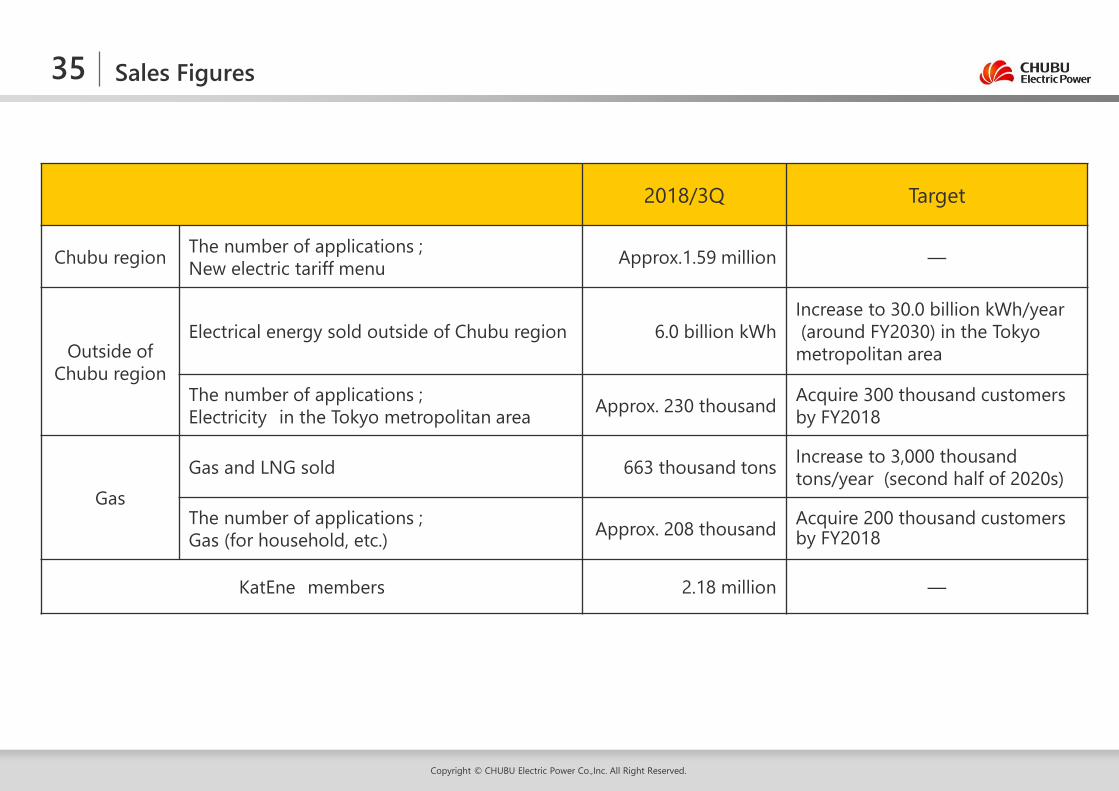
2018/3Q Target
Chubu region The number of applications ;New electric tariff menu Approx.1.59 million ―
Outside of Chubu region
Electrical energy sold outside of Chubu region 6.0 billion kWhIncrease to 30.0 billion kWh/year(around FY2030) in the Tokyo
metropolitan area
The number of applications ;Electricity in the Tokyo metropolitan area Approx. 230 thousand Acquire 300 thousand customers
by FY2018
GasGas and LNG sold 663 thousand tons Increase to 3,000 thousand
tons/year (second half of 2020s)
The number of applications ;Gas (for household, etc.) Approx. 208 thousand Acquire 200 thousand customers
by FY2018
KatEne members 2.18 million ―
Sales Figures35
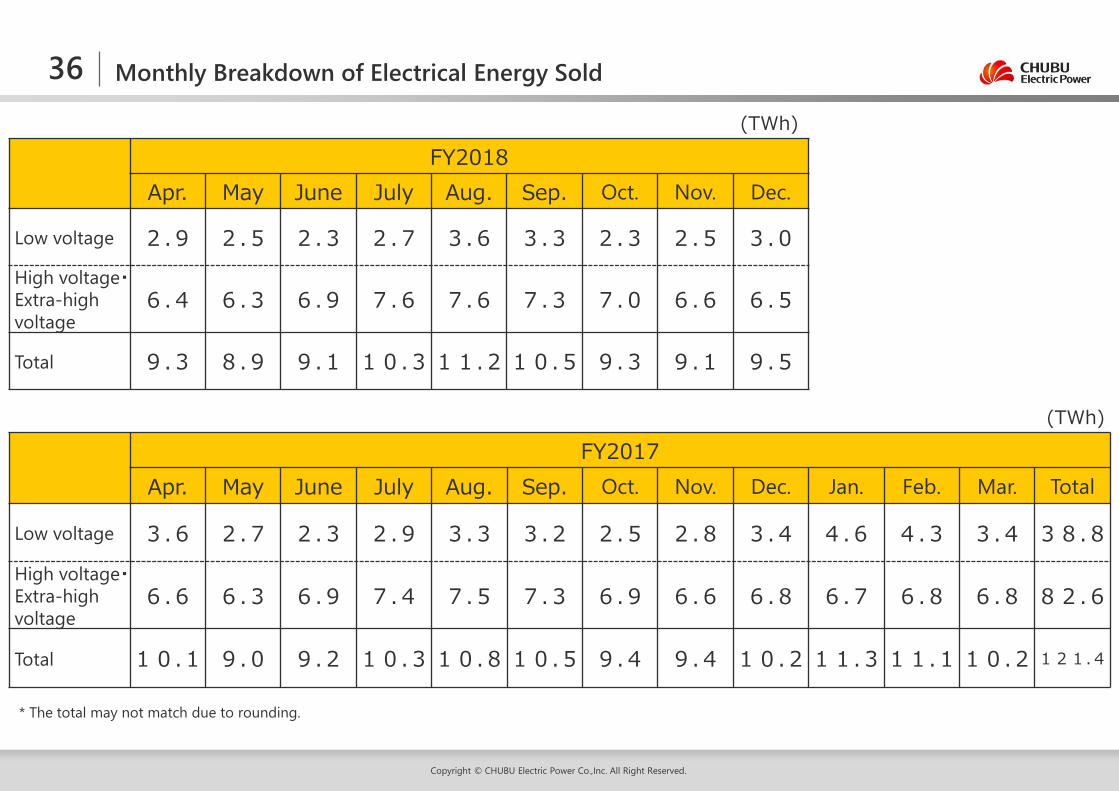
36 Monthly Breakdown of Electrical Energy Sold
(TWh)
Copyright © CHUBU Electric Power Co.,Inc. All Right Reserved.
FY2017Apr. May June July Aug. Sep. Oct. Nov. Dec. Jan. Feb. Mar. Total
Low voltage 3.6 2.7 2.3 2.9 3.3 3.2 2.5 2.8 3.4 4.6 4.3 3.4 38.8High voltage・Extra-high voltage
6.6 6.3 6.9 7.4 7.5 7.3 6.9 6.6 6.8 6.7 6.8 6.8 82.6
Total 10.1 9.0 9.2 10.310.810.5 9.4 9.4 10.211.311.110.2121.4
FY2018Apr. May June July Aug. Sep. Oct. Nov. Dec.
Low voltage 2.9 2.5 2.3 2.7 3.6 3.3 2.3 2.5 3.0High voltage・Extra-high voltage
6.4 6.3 6.9 7.6 7.6 7.3 7.0 6.6 6.5
Total 9.3 8.9 9.1 10.311.210.5 9.3 9.1 9.5
* The total may not match due to rounding.
(TWh)
Reference Data (2) :Management Information
Copyright © CHUBU Electric Power Co.,Inc. All Right Reserved.
03
Copyright © CHUBU Electric Power Co.,Inc. All Right Reserved.
Stable Power Supply for a New AgeResponding to the introduction/expansion of renewable energy (reuse storage batteries for EVs)
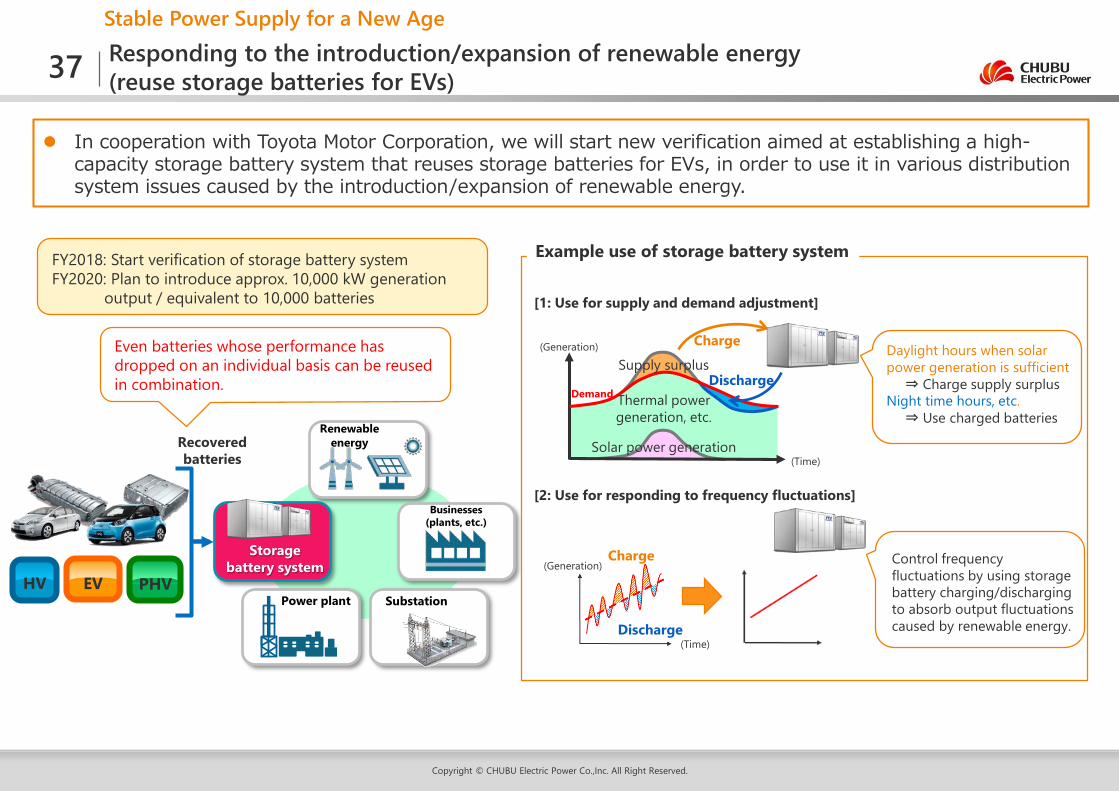
In cooperation with Toyota Motor Corporation, we will start new verification aimed at establishing a high-capacity storage battery system that reuses storage batteries for EVs, in order to use it in various distribution system issues caused by the introduction/expansion of renewable energy.
FY2018: Start verification of storage battery systemFY2020: Plan to introduce approx. 10,000 kW generation
output / equivalent to 10,000 batteries
Storage battery system
Recovered batteries
HV EV PHV
Renewable energy
Businesses (plants, etc.)
Power plant
Example use of storage battery system
Even batteries whose performance has dropped on an individual basis can be reused in combination.
Substation
Charge
Discharge
Solar power generation
Thermal power generation, etc.
(Generation)
(Time)
[1: Use for supply and demand adjustment]
Daylight hours when solar power generation is sufficient
⇒ Charge supply surplusNight time hours, etc.
⇒ Use charged batteries
[2: Use for responding to frequency fluctuations]
Discharge(Time)
Charge(Generation)
Supply surplus
Control frequency fluctuations by using storage battery charging/discharging to absorb output fluctuations caused by renewable energy.
Demand
37
Copyright © CHUBU Electric Power Co.,Inc. All Right Reserved.
(50Hzエリア)
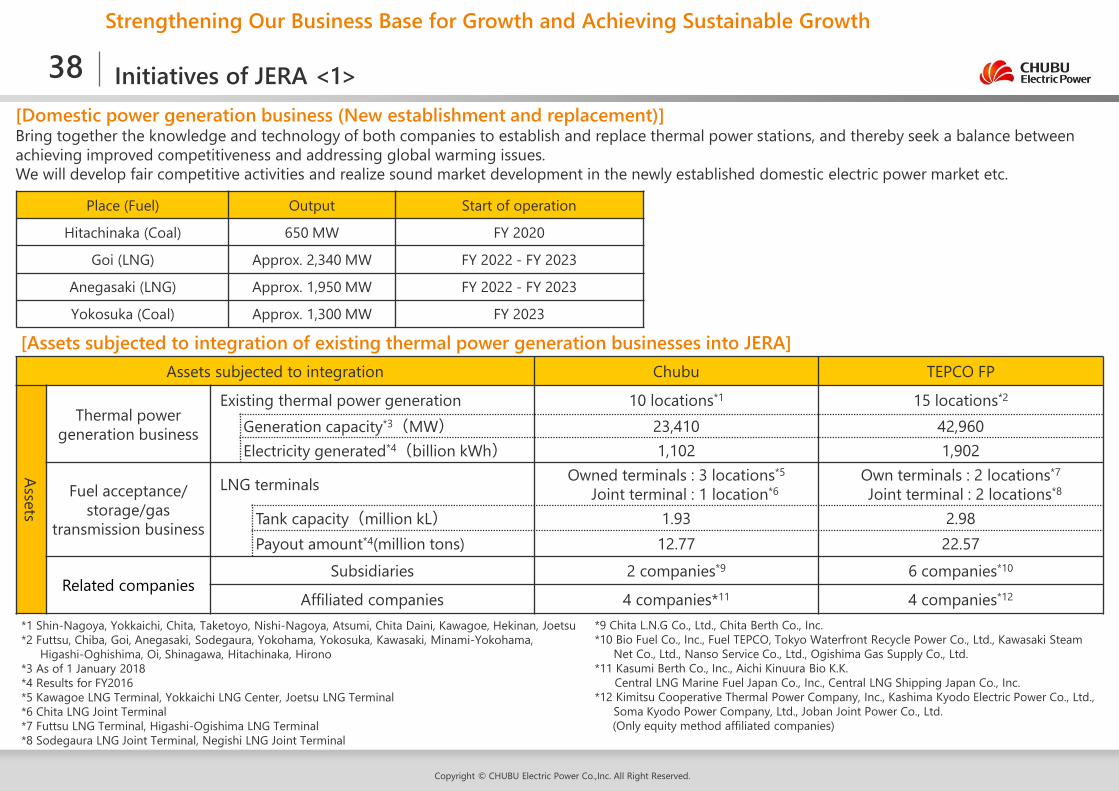
[Assets subjected to integration of existing thermal power generation businesses into JERA]Assets subjected to integration Chubu TEPCO FP
Assets
Thermal powergeneration business
Existing thermal power generation 10 locations*1 15 locations*2
Generation capacity*3(MW) 23,410 42,960Electricity generated*4(billion kWh) 1,102 1,902
Fuel acceptance/ storage/gas
transmission business
LNG terminals Owned terminals : 3 locations*5
Joint terminal : 1 location*6Own terminals : 2 locations*7
Joint terminal : 2 locations*8
Tank capacity(million kL) 1.93 2.98Payout amount*4(million tons) 12.77 22.57
Related companiesSubsidiaries 2 companies*9 6 companies*10
Affiliated companies 4 companies*11 4 companies*12
38[Domestic power generation business (New establishment and replacement)]Bring together the knowledge and technology of both companies to establish and replace thermal power stations, and thereby seek a balance between achieving improved competitiveness and addressing global warming issues.We will develop fair competitive activities and realize sound market development in the newly established domestic electric power market etc.
Initiatives of JERA <1>
Strengthening Our Business Base for Growth and Achieving Sustainable Growth
Place (Fuel) Output Start of operation
Hitachinaka (Coal) 650 MW FY 2020
Goi (LNG) Approx. 2,340 MW FY 2022 - FY 2023
Anegasaki (LNG) Approx. 1,950 MW FY 2022 - FY 2023
Yokosuka (Coal) Approx. 1,300 MW FY 2023
*1 Shin-Nagoya, Yokkaichi, Chita, Taketoyo, Nishi-Nagoya, Atsumi, Chita Daini, Kawagoe, Hekinan, Joetsu*2 Futtsu, Chiba, Goi, Anegasaki, Sodegaura, Yokohama, Yokosuka, Kawasaki, Minami-Yokohama,
Higashi-Oghishima, Oi, Shinagawa, Hitachinaka, Hirono*3 As of 1 January 2018*4 Results for FY2016*5 Kawagoe LNG Terminal, Yokkaichi LNG Center, Joetsu LNG Terminal*6 Chita LNG Joint Terminal*7 Futtsu LNG Terminal, Higashi-Ogishima LNG Terminal*8 Sodegaura LNG Joint Terminal, Negishi LNG Joint Terminal
*9 Chita L.N.G Co., Ltd., Chita Berth Co., Inc.*10 Bio Fuel Co., Inc., Fuel TEPCO, Tokyo Waterfront Recycle Power Co., Ltd., Kawasaki Steam
Net Co., Ltd., Nanso Service Co., Ltd., Ogishima Gas Supply Co., Ltd. *11 Kasumi Berth Co., Inc., Aichi Kinuura Bio K.K.
Central LNG Marine Fuel Japan Co., Inc., Central LNG Shipping Japan Co., Inc.*12 Kimitsu Cooperative Thermal Power Company, Inc., Kashima Kyodo Electric Power Co., Ltd.,
Soma Kyodo Power Company, Ltd., Joban Joint Power Co., Ltd.(Only equity method affiliated companies)
Copyright © CHUBU Electric Power Co.,Inc. All Right Reserved.
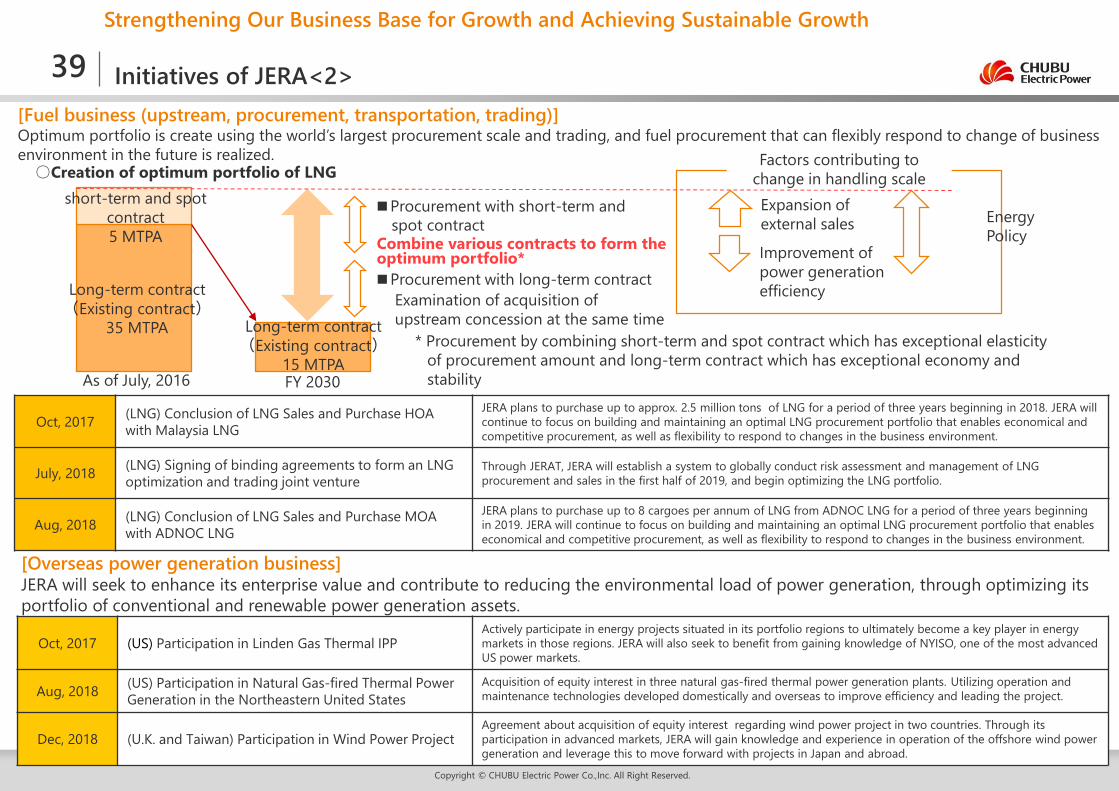
[Fuel business (upstream, procurement, transportation, trading)]Optimum portfolio is create using the world’s largest procurement scale and trading, and fuel procurement that can flexibly respond to change of business environment in the future is realized.
As of July, 2016 FY 2030
short-term and spot contract5 MTPA
Long-term contract(Existing contract)
35 MTPA
■Procurement with short-term and spot contract
■Procurement with long-term contractExamination of acquisition of upstream concession at the same time
Combine various contracts to form the optimum portfolio*
○Creation of optimum portfolio of LNGFactors contributing to
change in handling scaleExpansion of external sales
Improvement of power generation efficiency
* Procurement by combining short-term and spot contract which has exceptional elasticity of procurement amount and long-term contract which has exceptional economy and stability
[Overseas power generation business]JERA will seek to enhance its enterprise value and contribute to reducing the environmental load of power generation, through optimizing its portfolio of conventional and renewable power generation assets.
Initiatives of JERA<2>
Long-term contract(Existing contract)
15 MTPA
Energy Policy
Strengthening Our Business Base for Growth and Achieving Sustainable Growth
39
Oct, 2017 (LNG) Conclusion of LNG Sales and Purchase HOA with Malaysia LNG
JERA plans to purchase up to approx. 2.5 million tons of LNG for a period of three years beginning in 2018. JERA will continue to focus on building and maintaining an optimal LNG procurement portfolio that enables economical and competitive procurement, as well as flexibility to respond to changes in the business environment.
July, 2018 (LNG) Signing of binding agreements to form an LNG optimization and trading joint venture
Through JERAT, JERA will establish a system to globally conduct risk assessment and management of LNG procurement and sales in the first half of 2019, and begin optimizing the LNG portfolio.
Aug, 2018 (LNG) Conclusion of LNG Sales and Purchase MOA with ADNOC LNG
JERA plans to purchase up to 8 cargoes per annum of LNG from ADNOC LNG for a period of three years beginning in 2019. JERA will continue to focus on building and maintaining an optimal LNG procurement portfolio that enables economical and competitive procurement, as well as flexibility to respond to changes in the business environment.
Oct, 2017 (US) Participation in Linden Gas Thermal IPPActively participate in energy projects situated in its portfolio regions to ultimately become a key player in energy markets in those regions. JERA will also seek to benefit from gaining knowledge of NYISO, one of the most advanced US power markets.
Aug, 2018 (US) Participation in Natural Gas-fired Thermal Power Generation in the Northeastern United States
Acquisition of equity interest in three natural gas-fired thermal power generation plants. Utilizing operation and maintenance technologies developed domestically and overseas to improve efficiency and leading the project.
Dec, 2018 (U.K. and Taiwan) Participation in Wind Power ProjectAgreement about acquisition of equity interest regarding wind power project in two countries. Through its participation in advanced markets, JERA will gain knowledge and experience in operation of the offshore wind power generation and leverage this to move forward with projects in Japan and abroad.
Copyright © CHUBU Electric Power Co.,Inc. All Right Reserved.
Strengthening Our Business Base for Growth and Achieving Sustainable GrowthProvide energy services that continue to be chosen by customers (expand business in the Tokyo metropolitan area)
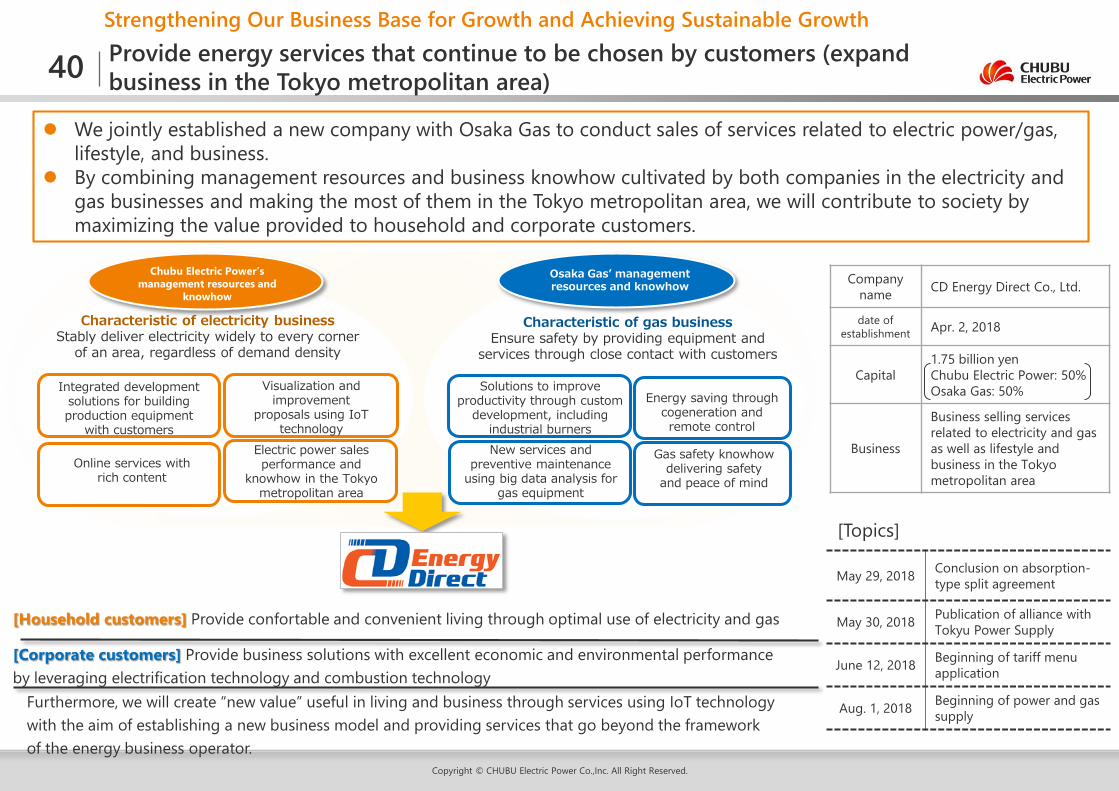
We jointly established a new company with Osaka Gas to conduct sales of services related to electric power/gas, lifestyle, and business.
By combining management resources and business knowhow cultivated by both companies in the electricity and gas businesses and making the most of them in the Tokyo metropolitan area, we will contribute to society by maximizing the value provided to household and corporate customers.
40
Chubu Electric Power’s management resources and
knowhow
Integrated development solutions for building production equipment
with customers
Energy saving through cogeneration and remote control
Osaka Gas’ management resources and knowhow
Solutions to improve productivity through custom
development, including industrial burners
Gas safety knowhow delivering safety
and peace of mind
New services and preventive maintenance
using big data analysis for gas equipment
Visualization and improvement
proposals using IoT technology
Online services with rich content
Electric power sales performance and
knowhow in the Tokyo metropolitan area
Characteristic of electricity businessStably deliver electricity widely to every corner
of an area, regardless of demand density
Characteristic of gas businessEnsure safety by providing equipment and
services through close contact with customers
Furthermore, we will create “new value” useful in living and business through services using IoT technology with the aim of establishing a new business model and providing services that go beyond the framework of the energy business operator.
[Corporate customers] Provide business solutions with excellent economic and environmental performance by leveraging electrification technology and combustion technology
[Household customers] Provide confortable and convenient living through optimal use of electricity and gas
Company name CD Energy Direct Co., Ltd.
date of establishment Apr. 2, 2018
Capital1.75 billion yenChubu Electric Power: 50%Osaka Gas: 50%
Business
Business selling services related to electricity and gas as well as lifestyle and business in the Tokyo metropolitan area
May 29, 2018 Conclusion on absorption-type split agreement
May 30, 2018 Publication of alliance with Tokyu Power Supply
June 12, 2018 Beginning of tariff menu application
Aug. 1, 2018 Beginning of power and gas supply
[Topics]
Copyright © CHUBU Electric Power Co.,Inc. All Right Reserved.
Strengthening Our Business Base for Growth and Achieving Sustainable Growth
Establish new growth fields (provide new forms of community)Provide various “new forms of community”• For new community development in urban areas:
Development of safe communities where children and senior citizens can live with a sense of security
• For provincial cities with declining populations:Revitalization of the local economy through local production for local consumption of renewable energyEconomical and low-carbon local transportation using movement data and renewable energyDevelopment of attractive communities through establishment of community support infrastructure
• For local communities such as schools:Watching over children as they go to and from school through coordination of movement dataBroadcasting of safe transit routes in real time and guiding of children
• For households attempting to balance work and parenting:
Care of and watching over children through utilization of household data and remote control of household devices
• For families living far awaySharing of electricity between families living far awayWatching over the health of parents living in far removed communities by coordinating household data and medical data
• For far removed individualsEasy trading of surplus solar power-generated electricity between individuals by matching the needs of far removed individuals
Movement data
Household data
Electricity/gasSales data
Weather data
Healthcare-related data
…
Data platform
Effective use of renewable energy
Joint development of public facilities at important transportation points; energy management
Public facilities/governm
ent buildings
Economical use of storage batteries/EVsUnderstanding movement information of residents at important points in the city On-demand transportation by
car/EVs connecting important points in the cityChecking the
situation at home while away
Expand data through service provision
Individuals
Services to improve the quality of life of individuals by utilizing various data
Community services based on connecting and evolving multiple kinds of social infrastructure
Services that lead to solutions to community issues
Evolving energy infrastructure into two-way “community support infrastructure” connected to multiple kinds of social infrastructure and customers’ equipment
Next-generation utility poles equipped with sensors and cameras, etc. (smart poles)
Data provision
Data use and service provision by companies besides us
Service using data accumulated in our data platform
Individuals
Services to improve quality of life
Other companies’ data
Expand data through service provision
IoT services for the home We will provide services that
make life rich and comfortable by using IoT devices to gather
and make use of household data.
Energy management service We will enable efficient use of
energy by using IoT technology to connect the energy resources of
multiple customers.
Smart poles We will provide new community
services by installing ICT devices such as sensors and
communications equipment on utility poles and using the data
obtained.
Strengthening relationships with local governments
Working with local governments such as Toyota City in Aichi Prefecture and Iida City
in Nagano Prefecture, we will work at creating community services that lead to
higher quality of life for various communities and residents.
41
26%
27%
3%
22~24%
20~22%
2030
12%
51%
7%
19%
11%
0%
20%
40%
60%
80%
100%
2017
Nuclear
Hydro
Oil
LNG
Coal
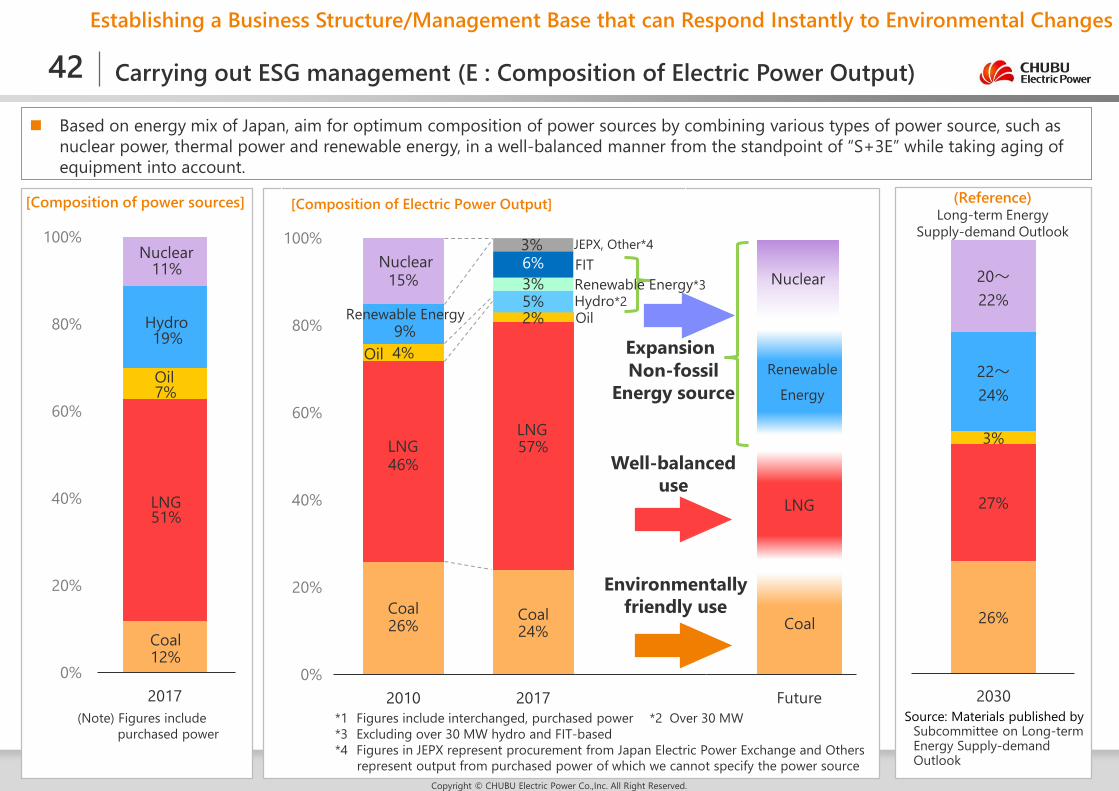
Based on energy mix of Japan, aim for optimum composition of power sources by combining various types of power source, such as nuclear power, thermal power and renewable energy, in a well-balanced manner from the standpoint of “S+3E” while taking aging ofequipment into account.
Carrying out ESG management (E : Composition of Electric Power Output)
[Composition of power sources]
(Note) Figures include purchased power
Copyright © CHUBU Electric Power Co.,Inc. All Right Reserved.
(Reference)Long-term Energy
Supply-demand Outlook
Source: Materials published by Subcommittee on Long-term Energy Supply-demand Outlook
26% 24%
46%57%
4%
2%9%
15%5%3%6%3%
0%
20%
40%
60%
80%
100%
2010 2017
[Composition of Electric Power Output]
Coal
LNG
Nuclear
Future
RenewableEnergy
Renewable Energy
Oil
LNG
Coal
Well-balanced use
Nuclear
Expansion
FIT
Environmentally friendly use
Oil
LNG
Coal
*1 Figures include interchanged, purchased power *2 Over 30 MW *3 Excluding over 30 MW hydro and FIT-based*4 Figures in JEPX represent procurement from Japan Electric Power Exchange and Others
represent output from purchased power of which we cannot specify the power source
Non-fossilEnergy source
Establishing a Business Structure/Management Base that can Respond Instantly to Environmental Changes
42
Hydro*2Renewable Energy*3
JEPX, Other*4
0.30
0.35
0.40
0.45
0.50
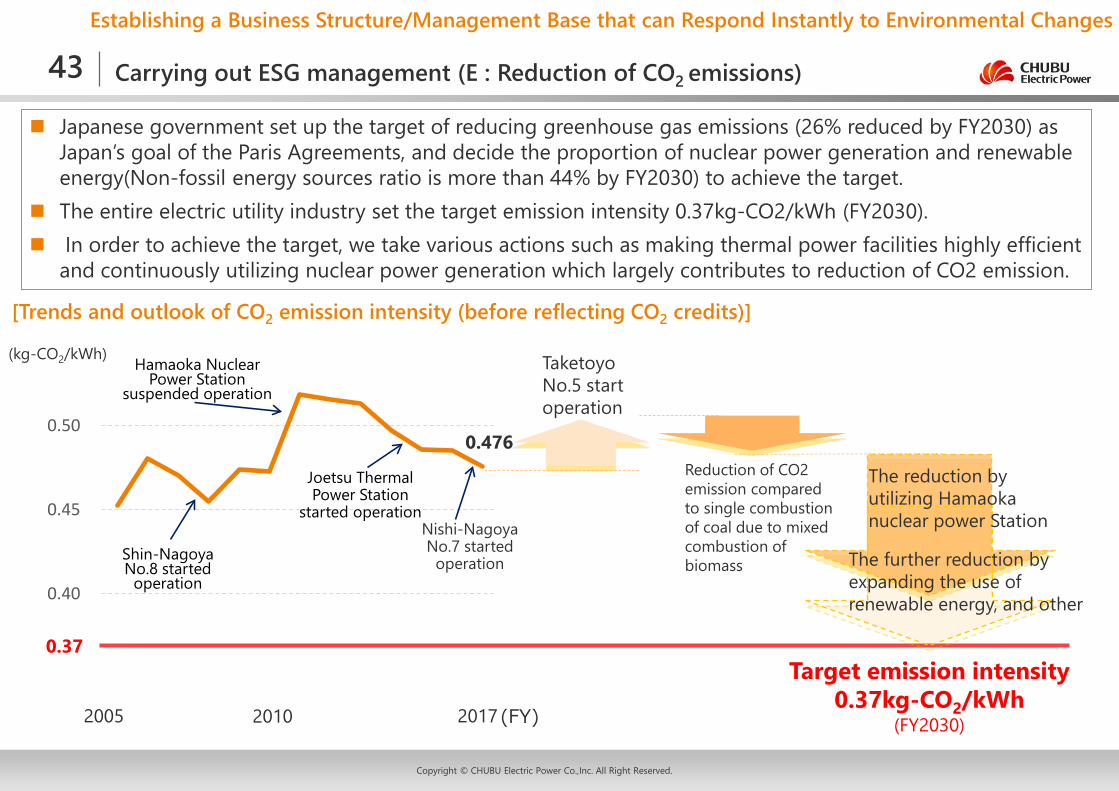
Carrying out ESG management (E : Reduction of CO2 emissions)
[Trends and outlook of CO2 emission intensity (before reflecting CO2 credits)]
(kg-CO2/kWh)
2005 2010 2017 (FY)
Shin-Nagoya No.8 started
operation
Hamaoka Nuclear Power Station
suspended operation
Joetsu Thermal Power Station
started operation
Target emission intensity 0.37kg-CO2/kWh
(FY2030)
TaketoyoNo.5 start operation
The further reduction by expanding the use of renewable energy, and other
Japanese government set up the target of reducing greenhouse gas emissions (26% reduced by FY2030) as Japan’s goal of the Paris Agreements, and decide the proportion of nuclear power generation and renewable energy(Non-fossil energy sources ratio is more than 44% by FY2030) to achieve the target.
The entire electric utility industry set the target emission intensity 0.37kg-CO2/kWh (FY2030). In order to achieve the target, we take various actions such as making thermal power facilities highly efficient
and continuously utilizing nuclear power generation which largely contributes to reduction of CO2 emission.
Reduction of CO2 emission compared to single combustion of coal due to mixed combustion of biomass
The reduction by utilizing Hamaokanuclear power Station
0.37
Copyright © CHUBU Electric Power Co.,Inc. All Right Reserved.
Establishing a Business Structure/Management Base that can Respond Instantly to Environmental Changes
43
0.476
Nishi-Nagoya No.7 started
operation
Copyright © CHUBU Electric Power Co.,Inc. All Right Reserved.
Establishing a Business Structure/Management Base that can Respond Instantly to Environmental Changes
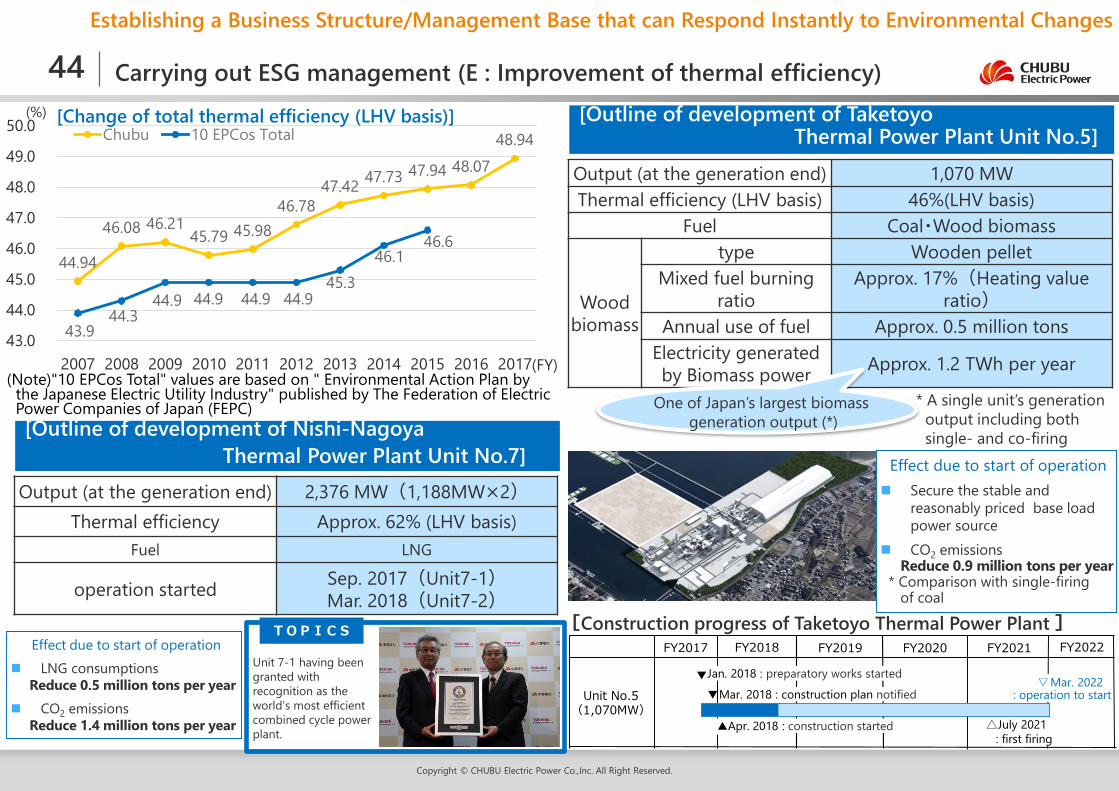
Carrying out ESG management (E : Improvement of thermal efficiency)44
Output (at the generation end) 2,376 MW(1,188MW×2)Thermal efficiency Approx. 62% (LHV basis)
Fuel LNG
operation started Sep. 2017(Unit7-1)Mar. 2018(Unit7-2)
Output (at the generation end) 1,070 MWThermal efficiency (LHV basis) 46%(LHV basis)
Fuel Coal・Wood biomass
Woodbiomass
type Wooden pelletMixed fuel burning
ratioApprox. 17%(Heating value
ratio)Annual use of fuel Approx. 0.5 million tons
Electricity generated by Biomass power Approx. 1.2 TWh per year
[Outline of development of Nishi-Nagoya Thermal Power Plant Unit No.7]
[Outline of development of TaketoyoThermal Power Plant Unit No.5]
Effect due to start of operation Secure the stable and
reasonably priced base load power source
CO2 emissionsReduce 0.9 million tons per year
* Comparison with single-firing of coal
* A single unit’s generation output including both single- and co-firing
Unit No.5(1,070MW)
▼Jan. 2018 : 準備工事着手▼
▲Apr. 2018 : construction started
▽Mar. 2022: operation to start
△July 2021: first firing
FY2022[Construction progress of Taketoyo Thermal Power Plant ]
One of Japan’s largest biomass generation output (*)
44.94
46.08 46.2145.79 45.98
46.7847.42 47.73 47.94 48.07
48.94
43.944.3
44.9 44.9 44.9 44.945.3
46.146.6
43.0
44.0
45.0
46.0
47.0
48.0
49.0
50.0
2007 2008 2009 2010 2011 2012 2013 2014 2015 2016 2017
Chubu 10 EPCos Total[Change of total thermal efficiency (LHV basis)](%)
(FY)(Note)"10 EPCos Total" values are based on " Environmental Action Plan by
the Japanese Electric Utility Industry" published by The Federation of Electric Power Companies of Japan (FEPC)
Effect due to start of operation LNG consumptions
Reduce 0.5 million tons per year CO2 emissions
Reduce 1.4 million tons per year
FY2021FY2020FY2019FY2018FY2017Unit 7-1 having been granted with recognition as the world’s most efficient combined cycle power plant.
TOPICS
Jan. 2018 : preparatory works startedMar. 2018 : construction plan notified
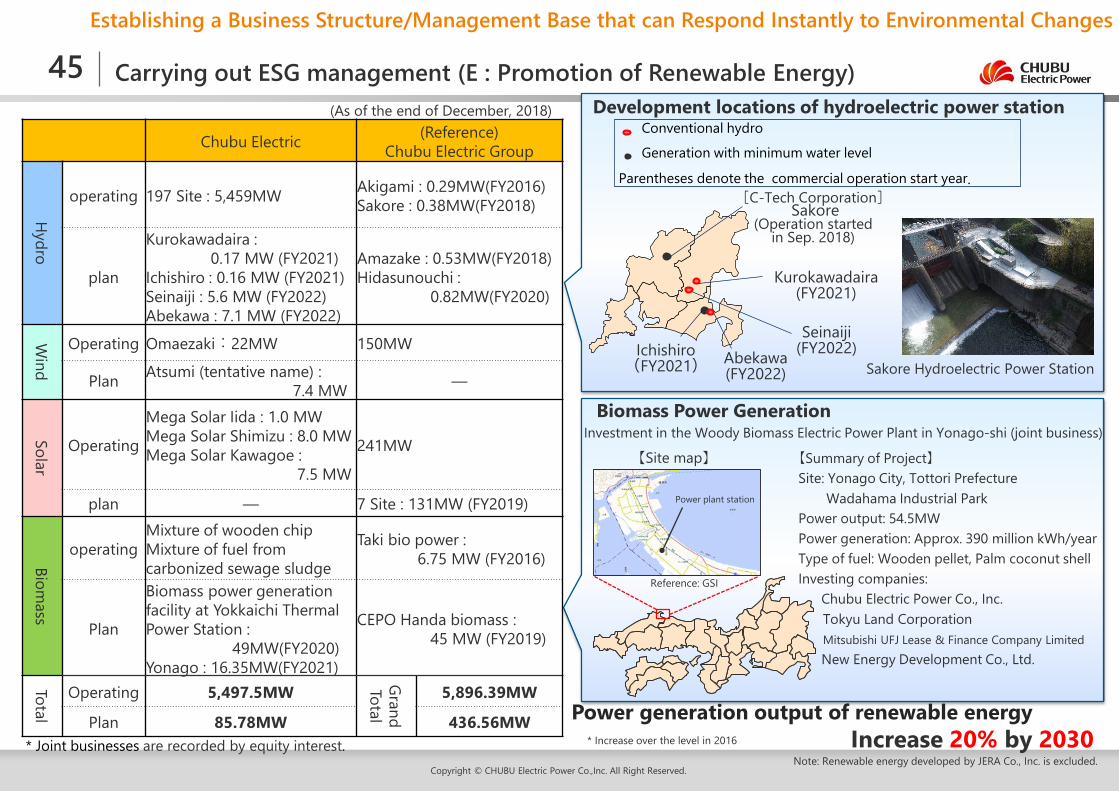
Chubu Electric (Reference)Chubu Electric Group
Hydro
operating 197 Site : 5,459MW Akigami : 0.29MW(FY2016)Sakore : 0.38MW(FY2018)
plan
Kurokawadaira :0.17 MW (FY2021)
Ichishiro : 0.16 MW (FY2021)Seinaiji : 5.6 MW (FY2022)Abekawa : 7.1 MW (FY2022)
Amazake : 0.53MW(FY2018)Hidasunouchi :
0.82MW(FY2020)
Wind
Operating Omaezaki:22MW 150MW
Plan Atsumi (tentative name) :7.4 MW ―
Solar
Operating
Mega Solar Iida : 1.0 MWMega Solar Shimizu : 8.0 MW Mega Solar Kawagoe :
7.5 MW
241MW
plan ― 7 Site : 131MW (FY2019)
Biomass
operatingMixture of wooden chipMixture of fuel from carbonized sewage sludge
Taki bio power : 6.75 MW (FY2016)
Plan
Biomass power generation facility at Yokkaichi Thermal Power Station :
49MW(FY2020)Yonago : 16.35MW(FY2021)
CEPO Handa biomass :45 MW (FY2019)
Total
Operating 5,497.5MW
GrandTotal
5,896.39MW
Plan 85.78MW 436.56MW
(As of the end of December, 2018)
45 Carrying out ESG management (E : Promotion of Renewable Energy)
Copyright © CHUBU Electric Power Co.,Inc. All Right Reserved.
* Joint businesses are recorded by equity interest.
Establishing a Business Structure/Management Base that can Respond Instantly to Environmental Changes
Power generation output of renewable energy Increase 20% by 2030
Note: Renewable energy developed by JERA Co., Inc. is excluded.
* Increase over the level in 2016
Ichishiro(FY2021)
Conventional hydro
Generation with minimum water level
Parentheses denote the commercial operation start year.
Development locations of hydroelectric power station
[C-Tech Corporation]Sakore
(Operation startedin Sep. 2018)
Seinaiji(FY2022)Abekawa
(FY2022)
Kurokawadaira(FY2021)
Sakore Hydroelectric Power Station
Biomass Power Generation
【Summary of Project】Site: Yonago City, Tottori Prefecture
Wadahama Industrial ParkPower output: 54.5MWPower generation: Approx. 390 million kWh/yearType of fuel: Wooden pellet, Palm coconut shellInvesting companies:
Chubu Electric Power Co., Inc.Tokyu Land CorporationMitsubishi UFJ Lease & Finance Company LimitedNew Energy Development Co., Ltd.
Investment in the Woody Biomass Electric Power Plant in Yonago-shi (joint business)
Reference: GSI
Power plant station
【Site map】
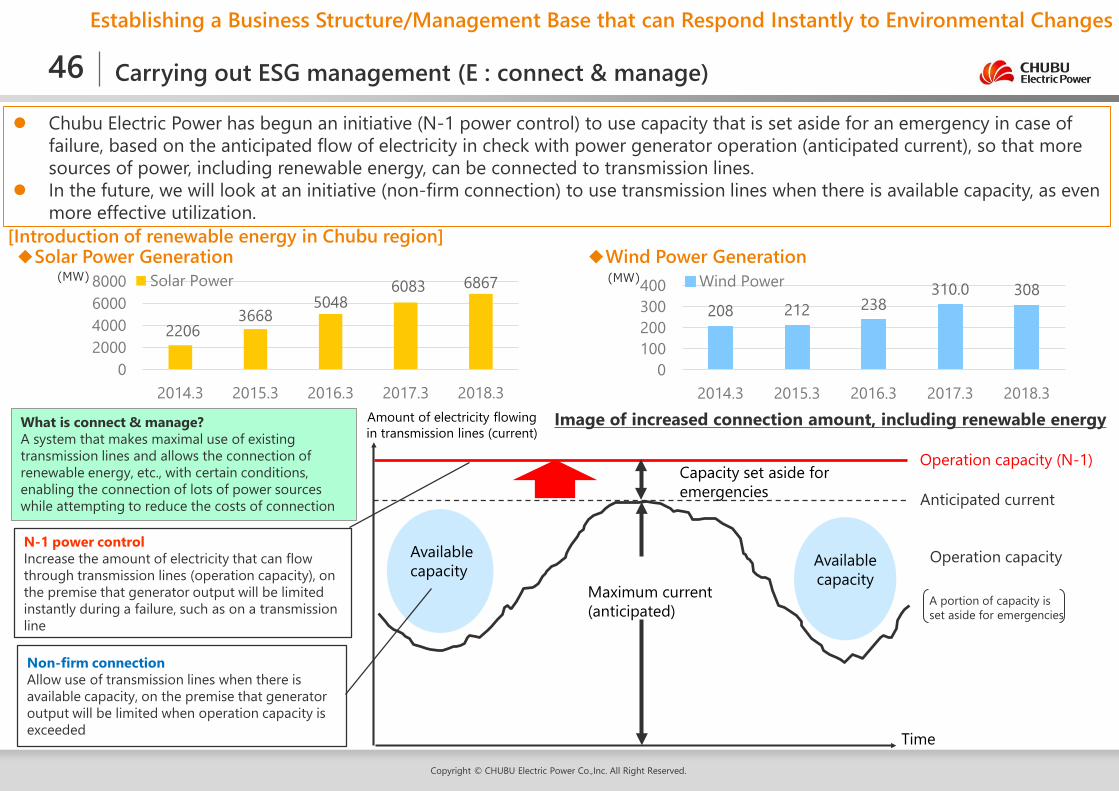
46 Carrying out ESG management (E : connect & manage)
Copyright © CHUBU Electric Power Co.,Inc. All Right Reserved.
Establishing a Business Structure/Management Base that can Respond Instantly to Environmental Changes
22063668
50486083 6867
02000400060008000
2014.3 2015.3 2016.3 2017.3 2018.3
Solar Power
208 212 238310.0 308
0100200300400
2014.3 2015.3 2016.3 2017.3 2018.3
Wind Power
Chubu Electric Power has begun an initiative (N-1 power control) to use capacity that is set aside for an emergency in case of failure, based on the anticipated flow of electricity in check with power generator operation (anticipated current), so that more sources of power, including renewable energy, can be connected to transmission lines.
In the future, we will look at an initiative (non-firm connection) to use transmission lines when there is available capacity, as even more effective utilization.
Time
Operation capacity
Anticipated current
Operation capacity (N-1)
Image of increased connection amount, including renewable energy
A portion of capacity is set aside for emergencies
Amount of electricity flowing in transmission lines (current)
Maximum current (anticipated)
Capacity set aside for emergencies
N-1 power controlIncrease the amount of electricity that can flow through transmission lines (operation capacity), on the premise that generator output will be limited instantly during a failure, such as on a transmission line
Non-firm connectionAllow use of transmission lines when there is available capacity, on the premise that generator output will be limited when operation capacity is exceeded
What is connect & manage?A system that makes maximal use of existing transmission lines and allows the connection of renewable energy, etc., with certain conditions, enabling the connection of lots of power sources while attempting to reduce the costs of connection
Available capacity Available
capacity
[Introduction of renewable energy in Chubu region]◆Solar Power Generation ◆Wind Power Generation
(MW) (MW)
Copyright © CHUBU Electric Power Co.,Inc. All Right Reserved.
DISCLAIMER
This presentation contains assumptions and forward-looking statements with respect to the financial conditions, and forecasts of the company, which are based on information currently available.
These assumptions involve certain risks and uncertainties, and may cause actual results materially differ from them, by changes in the managerial environment such as economic activities and market trends.
Though great care is exercised in the preparation of such literature, Chubu Electric Power Co., Inc. shall not be liable in any manner for any loss whatever incurred as a result of erroneous information contained therein or in this presentation.
Copyright © CHUBU Electric Power Co.,Inc. All Right Reserved.


