33
Group Presentation Association of Greek Institutional Investors 24 June 2009
| Date post: | 26-Aug-2018 |
| Category: |
Documents |
| Upload: | truongdiep |
| View: | 214 times |
| Download: | 0 times |

Group Presentation
Association of Greek Institutional Investors
24 June 2009

2
DISCLAIMER
These preliminary materials and any accompanying oral presentation (together, the “Materials”) have been prepared by Mytilineos Holdings SA (the “Company”) and are intended solely for the information of the Recipient. The Materials are in draft form and the analyses and conclusions contained in the Materials are preliminary in nature and subject to further investigation and analysis. The Materials are not intended to provide any definitive advice or opinion of any kind and the Materials should not be relied on for any purpose. The Materials may not be reproduced, in whole or in part, nor summarised, excerpted from, quoted or otherwise publicly referred to, nor discussed with or disclosed to anyone else without the prior written consent of the Company.
The Company has not verified any of the information provided to it for the purpose of preparing the Materials and no representation or warranty, express or implied, is made and no responsibility is or will be accepted by the Company as to or in relation to the accuracy, reliability or completeness of any such information. The conclusions contained in the Materials constitute the Company’s preliminary views as of the date of the Materials and are based solely on the information received by it up to the date hereof. The information included in this document may be subject to change and the Company has no obligation to update any information given in this report. The Recipient will be solely responsible for conducting its own assessment of the information set out in the Materials and for the underlying business decision to effect any transaction recommended by, or arising out of, the Materials. The Company has not had made an independent evaluation or appraisal of the shares, assets or liabilities (contingent or otherwise) of the Company .
All projections and forecasts in the Materials are preliminary illustrative exercises using the assumptions described herein, which assumptions may or may not prove to be correct. The actual outcome may be materially affected by changes in economic and other circumstances which cannot be foreseen. No representation or warranty is made that any estimate contained herein will be achieved.

3
� Group Overview
� Financial Review
� Areas of Activity
�Metallurgy & Mining
�Energy
�Engineering Procurement Construction (EPC)
� Stock Data
� Summary
AGENDA
4
Group Overview

5
GROUP HISTORY
2007 -20082006200520021998-20001995-19971908-1994
1908: Company founded by Mytilineos family members in Athens, Greece.
1995: Company listed on the Athens Stock Exchange.
1996: Signing of strategic agreements with metal, mining & mineral companies in Southeast Europe.
1998: Hostile acquisition of Metka S.A. the leading electromechanical and metallic construction company in Greece.
2000: Participation in state –owned ELVO S.A., major supplier of the Hellenic Armed Forces of trucks, armoured vehicles and other appropriately modified military vehicles.
2005: Acquisition of Aluminium of Greece S.A. one of the largest vertical integrated alumina and aluminium producers in Europe.
1998: Acquisition of Romania - based Sometra S.A. the largest South Eastern Europe’s Lead (Pb) and Zinc (Zn) producer.
1999: Acquisition of Cyprus-based Hellenic Copper Mines.
2002: Establishment of Mytilineos Power Generation and Supplies S.A. (MPGS). and Mytilineos Hellenic Wind Power S.A. (MHWP).
2006: Acquisition of Delta Project S.A. a company engaging in the development, construction and operation of hydroelectric power stations and wind parks.
2008: Motor Oil and Mytilineos Group sign major deal in the Energy Sector to construct and operate a 437 MW CCGT.
Source: Company Information.
2008: COGEN successfully dispatched. The first thermal power plant of Mytilineos Group has started its commissioning period.
2007: Merger by absorption of Aluminium of Greece and Delta Project by Mytilineos Holdings. Delisting of both subsidiaries.
2007: Strategic Partnership with Endesa. Endesa (Hellas) is created – a reference player in the Greek Energy Market seeking to expand into S.E. Europe.

6
GROUP OVERVIEW
Metallurgy& Mining
Energy
EPC
• Largest Aluminium (Al) and Alumina (Ox) producer in South Eastern Europe with international presence through Aluminium of Greece S.A.
• Second largest Bauxite producer in Greece through Delphes-Distomon S.A.
• Endesa Hellas: JV with Endesa, with a significant portfolio in the pipeline and under construction and a well balanced mix between thermal and RES soon to become the largest independent power operator in Greece. Current Portfolio includes:
– 334 MW CHP – Combined Heat & Power Plant in Viotia Region (in operation).
– 444 MW CCGT – Merchant Power Plant in Viotia Region (to be completed by March 10).
– 437 MW CCGT – Merchant Power Plant in Korinthos Region (to be completed by April 11).
– 437 MW CCGT – Merchant Power Plant in Volos Region (to be completed by January 12).
– Portfolio of Renewable Energy Generation Assets (RES) (Wind parks, Hydroelectric Power Stations and Photovoltaic Parks) of total capacity of 1,000 MW. 45MW RES in full commercial operation.
– Electricity Trading Licence of 310 MW.
– CO2 Emission Trading Platform.
– Production Licence for a 600 MW Coal – Fired Power Plant in Viotia Region.
• Leading Greek EPC company through METKA S.A. and Subsidiaries and one of the most reliable EPC Contractors throughout Europe.
Source: Company Information.

7
GROUP’S CORPORATE STRUCTURE
Source: Company Information.Note: Market data 22 June 2009.METKA is the only remaining listed subsidiary.
MYTILINEOS HOLDINGS
METKA(56.6%*)
ALUMINA & ALUMINIUM(100%)
54.0%METALLURGY & MINING
ENERGY EPC
ENDESA (HELLAS) (49.99%)
ELVO (43%)
DELPHI DISTOMON (100%) Non Core Sector
Mkt Cap*: € 695 mn
Mkt Cap*: € 421 mn
VEHICLE MANUFACTURING
8
Financial Review

9
238
283
281
103
132194
708
634
66166
302
779
857
509
196185
402
800
773
877
268
219
631
901
902
868
367
501
368
542
FINANCIAL REVIEW
Source: Company Information.
* Net Debt = Debt – Cash Position.To note that Net Debt does not include the share % of the Group in Endesa.
2004
2005
2006
2007
Total Equity
Fixed Assets
Current Assets
Net Debt
Long TermLiabilities
Short TermLiabilities
Balance Sheet
� Solid Balance Sheet.� Healthy Debt to Equity Ratio.� Substantial Growth of Equity.
2008

10
509
877 868
402
631
368
542
281 302194
1.3
2.4
1.5
1.8
1.4
0
100
200
300
400
500
600
700
800
900
1,000
2004 2005 2006 2007 2008
0.0
0.5
1.0
1.5
2.0
2.5
Current Assets Current Liabilities Current Ratio
FINANCIAL REVIEW
Evolution of Group Turnover, EBITDA & Earnings after Taxes
Source: Company Information.
(in € mn)
Financial Performance
779 800
901
196268
367238
708
103 66
25.1%
40.7%
33.5%
9.3%
43.2%
0
100
200
300
400
500
600
700
800
900
1,000
2004 2005 2006 2007 2008
0.0%
5.0%
10.0%
15.0%
20.0%
25.0%
30.0%
35.0%
40.0%
45.0%
50.0%
Equity Net Debt Net Debt / Equity
837913
976
157 21131
311
747
20256
18.8%
3.2%
23.1%
34.3%
6.4%
0
200
400
600
800
1,000
1,200
2004 2005 2006 2007 2008
0.0%
5.0%
10.0%
15.0%
20.0%
25.0%
30.0%
35.0%
40.0%
Turnover EAT EAT %
837913
976
187 154 118
311
747
42 158
22.3%
12.1%
16.9%
21.2%
13.5%
0
200
400
600
800
1,000
1,200
2004 2005 2006 2007 2008
0.0%
5.0%
10.0%
15.0%
20.0%
25.0%
Turnover EBITDA EBITDA%

11
Areas of Activity
Metallurgy & Mining

12
M & M – BUSINESS OUTLOOK
� Facilities established in 1960’s. Leading industrial producer of alumina and aluminium in South Eastern Europe.
� Production facilities occupy an area of 7,035,700m2 and constitute a vertically integrated production unit.
� Owner of port facilities for large tonnage ships.
� Low cost production base in Europe both for Alumina and Aluminium - production in half of cost curve in Europe.
� Enough alumina to cover own aluminium production needs and to export 460,000 tn per annum.
� 10-year contract with Glencore AG regarding 100% of excess alumina production.
� Steam is produced by the 334 MW CHP Plant of Endesa Hellas, 50% owned by Mytilineos Group.
� Exploitation of bauxite reserves by the 100% owned subsidiary Delphes – Distomon S.A. covering half of its Bauxite requirements. Long term contracts with other suppliers (Alcan, S&B, Glencore AG).
� Efficient risk management strategy. The Group acting proactively secured Aluminum sales in prices well above current market levels for 2009 and 2010. Hedging book currently valued over $300m.
Alumina & AluminumBusiness Overview Operational & Financial Overview
Key Strengths
Source: Company Information.
788,900 771,769
164,500 168,000 162,339
780,000782,000
165,300
0
100,000
200,000
300,000
400,000
500,000
600,000
700,000
800,000
900,000
2005 2006 2007 2008
tn OX AL
471
73 4952 77 37 20
469382
471
79110
10.4%
23.4%
20.7%
15.5%
0
50
100
150
200
250
300
350
400
450
500
2005 2006 2007 2008
€ mil
0.0%
5.0%
10.0%
15.0%
20.0%
25.0%
Turnover EBITDA EAT % EBITDA

13
Other Raw
Materials Cost
10%
Average
Delivered
Alumina Cost
25%
Total Other
Costs 15%
Labour Cost
10%
Total Energy
Cost 40%
Other Raw
Materials Cost
16%
Total Energy
Cost 29%
Labour Cost 6%
Total Other
Costs 9%
Average
Delivered
Alumina Cost
40%
M & M – BUSINESS OUTLOOK
Source: Company Information, CRU ANALYSIS.
Aluminum Cost Analysis
Total Market AoG
95 82 78124 109 107 72 5773 67 59 63 75100109
0
20
40
60
80
100
120
140
2008 2007 2006 2005 2004
€ mil
0%
5%
10%
15%
20%
25%
30%
35%
40%
45%
Raw M. Energy Fabrication
Raw M.% Energy% Fabrication%
95 82 78124 109 107 72 5773 67 59 63 75100109
0
20
40
60
80
100
120
140
2008 2007 2006 2005 2004
€ mil
0%
5%
10%
15%
20%
25%
30%
35%
40%
45%
Raw M.
95 82 78124 109 107 72 5773 67 59 63 75100109
0
20
40
60
80
100
120
140
2008 2007 2006 2005 2004
€ mil
0%
5%
10%
15%
20%
25%
30%
35%
40%
45%
Raw M. Energy Fabrication
Raw M.% Energy% Fabrication%
AL Division – Cost Structure

14
North America
15%
Europe
14%Asia
42%
CIS
12%C&S America
7%Australia
6%
Africa
4%
North America
16%
Europe
24%Asia
54%
Africa
1%
Australia
1%
C&S America
4%
North America
14%
Europe 25%
C&S America
7%Australia 6%
Africa 4%
Asia 44%
Europe 7%
North America
7%C&S America
20%
Australia 25%
Africa 1%
CIS 8%
Asia 33%
M & M – INDUSTRY OUTLOOK
Alumina & Aluminum
Alumina Supply (2008) Aluminium Supply (2008)
Total Market 79 MT Total Market 40 MT
Source: CRU ANALYSIS.
Alumina Demand (2008) Aluminium Demand (2008)
Total Market 78 MT Total Market 38 MT

15
ALUMINIUM
� The average Aluminum price the 1st Quarter of 2009 has settled at $1,360 down 50.2% y-o-y and well below the Group’s hedged price level.
� Inventory Level: Production cuts seem still not enough to prevent total reported stocks from rising at 5.5 Mt at the end of the 1st
Quarter. Stocks have risen around the globe with the only exception of Asia mainly due to Chinese imports.
� Supply: Global surplus the 1st Quarter of 2009 has reached nearly 1.3 Mt. Total world supply is down 9.1% y-o-y however cutback announcements from producers have slowed considerably after March 2009.
� Demand: Consumption outside China remains weak with leading indicators pointing towards stabilization in Europe and the USA.
AL Consumption Analysis 1Q09
North America
16%
Africa
2%Australia
1%
C&S America
4%
Asia
54%
Europe
23%
Announced Production Cuts by March 09
North America
17%
China
54%
Rest of the
world
3%
South America
1%Europe
25%
M&M - INDUSTRY & MACRO ENVIRONMENT
6Mt which represents 15% of 2008 total Production
Source: Company Information, CRU ANALYSIS.
7.6Mt, down 20% y-o-y

16
Areas of Activity
Energy

17
ENERGY - INDUSTRY OUTLOOK
The Greek Electricity Market
Source: Endesa Hellas.
Key Characteristics and Trends
Demand
Supply
Market Equilibrium
Competitive Dynamics
Future Outlook
�Consumption has grown with a yearly average of 3,7% in the decade 1998-2007, peaking during the summer (strong air cooling penetration in the commercial and residential sectors).
�The percentage of domestic lignite in generation, in the interconnected System, is around 56-60%, and Greece has reserves for another 50 years.
�Gas’s share is rising, 25% in 2007 and 26% in 2008, as most planned recent investments have been in CCGTs. Greece is importing gas (DEPA), mainly from Russia and Turkey via pipeline and LNG from Algeria and occasionally from the spotmarket.
�Wind only accounts for 3 percent of the mix, but Greece relies on important wind and solar potential and strong incentives estimated at more than 6 GW.
�Greece is not self-sufficient as it relies on imports between 7 and 11 percent of its consumption.
�Remaining capacity (UCTE definitions) is positive throughout the year, and higher than 5% of net generating capacity but remaining margin is negative in July-August period.
�PPC is the incumbent with >99% market share in retail and around 95% in the wholesale market. Currently, there are 3 independent units in the market but PPC has overtaken the operation of Heron’s 147 MW OCGT.
�Foreign players have entered the market since 2006, teaming up with local (non-operator) investors (Endesa-Mytilineos, Edison-ELPE, …). Mytilineos has replaced Iberdrola in the joint venture with Motor-Oil. GDF-Suez will cooperate with the Greek company Terna.
�The low demand scenario of HTSO predicts a 2,5% yearly growth rate in demand up to 2012. However, the economic slump could keep the growth rate for 2009-2010 around zero.
�Lignite will remain a cornerstone, though its share will decrease.
�All the new capacity up to 2012, at least, will be in CCGTs and perhaps some hundreds MW of OCGTs.
�Renewable generation is also set to rise as a very favorable framework has been put into place. Feed-in tariff for the energy and up to 40% subsidy for construction of wind and solar parks.
� Imports rise even though Bulgaria has closed two nuclear units. New nuclear capacity in Romania, high prices in Greece and new interconnection lines in region will keep that trend.
�Remaining capacity will be decreased in the next couple of years with few new capacity coming online.
�PPC is looking for strategic partners to finance new commissioning plan.
�Private players might concentrate.

18
Energy Market – Developments in 2009
� Total Power production during 1Q 2009: 12.1 m MWh (down 1.67% y-o-y).
� Net Imports amounted 1.1 m MWh (down 23.1% y-o-y).
� Hydro production was up 61.5% when on the contrary Natural Gas production decreased by 54% y-o-y.
� Aggregate demand is decreased by 3.8% mainly due to lower demand from the industrial sector (19%).
Capacity per Technology GW
10.9 10.911.6 12.1 12.4 12.7
13.8 13.9 14.114.6
15.3
0
2
4
6
8
10
12
14
16
2000 2001 2002 2003 2004 2005 2006 2007 2008 2009 2010
Coal Oil Natural Gas Hydro Renewables
ENERGY - INDUSTRY & MACRO ENVIRONMENT
The Greek Electricity Market
Source: Endesa Hellas, HTSO.
4,0%p.a.
2,7%p.a.
10,000
15,000
20,000
25,000
30,000
35,000
40,000
45,000
50,000
55,000
60,000
2000 2002 2004 2006 2008 2010
Demand GWh
-1,000
1,000
3,000
5,000
7,000
9,000
11,000
13,000
Peak MW
Demand Peak

19
ENERGY - INDUSTRY OUTLOOK
The Greek Electricity Market
Source: Endesa Hellas.
1.772
738
1.034
2.500
3.000
5.502
2.108
Commissioning Decommissioning New Net CapacityPlanned
New Net CapacityPlanned
New Net CapacityNeeded
3.394
Projected (De)/Commissioning schedule for all players in Greece
Strategic Plan of PPC (November 2007)
GAP1.466-
1.966
2008 - 2010 2011 - 2020
40% of
current
system
Commissioning Decommissioning
MW

20
ENERGY – BUSINESS OUTLOOK
Endesa Hellas
• Mytilineos’ assets valued at Euro 600 mn.
• Endesa participates in Endesa Hellas through consecutive share capital increases already effected – to be finalized within November 2008.
Strategic Partnership Overview – a Euro 1.2 bn Company is Formed
Endesa
• Cash (€ 600 mn)
Mytilineos
• Assets (Valued at € 600 mn)
ENDESA HELLAS
• Endesa Hellas valued at € 1.2 bn, while enjoying significant financial firepower to fund its ambitious expansion programme.
Total Firing Power Total Firing Power €€ 3 3 bnbn
• The two parties have agreed to leverage the company 60:40 Debt/Equity – raising € 1.8 bn to invest in Greece and SE Europe territory (Albania, FYROM, Bulgaria, Turkey, Cyprus).
Source: Endesa Hellas.

21
CHP334 MW
CCGT444 MW
CCGT437 MW
GAS1,652 MW
RES
RES
RES
2008 2009 2010 2011 2012 2012
RES
RES
379 MW
406 MW
966 MW
1,417 MW
1,928 MW
Installed Generation
45 MW
27 MW
116 MW
14 MW
74 MWSt. Nicholas
Volos
Target GreekMarket Share
14%
RES276 MW
Power
MW
1,000
2,000
Korinthos
CCGT437 MW
1,928 MW
Endesa Hellas – Generation (2008 – 2012)
ENERGY - BUSINESS OUTLOOK
Source: Endesa Hellas.

22
Areas of Activity
EPC

23
**Source: EC/World Bank, GIS for SEE report, 2004-05.
•Tight supply – demand balance expected to continue despite new CCGT projects.
•Majority of existing capacity is old and inefficient.
•PPC Megalopolis 800MW CCGT – first part of PPC’smajor new-build program.
•EPC for continuation of Endesa Hellas’ investment program: 400MW IPP plant in Volos.
Fundamentals Prospects
•SEE: 11,000 MW new capacity needed up to 2020. Rehabilitation of 11,500 MW of existing generation - €4.8bn**
•Turkey: major investments in gas and indigenous coal plants.
•EU membership and convergence impose obligations for plant upgrades and/or closures whilst power consumption increasing.
•Years of near zero investment.
•Government support and relatively high level of acceptance for nuclear.
Greece
South-East
& Central
Europe,
Turkey
•Combined cycle projects across the Middle East.
•Numerous Integrated Water & Power Plant (IWPP) projects in the Gulf.
•Emphasis on mega-projects in the Gulf, several affected by global financial crisis.
•Gas for power generation becoming scarce –increased need for fuel efficiency.
Middle East
•Pakistan: multiple IPP projects under development.
•Despite global economic slow-down there is continued power demand growth in developing countries.
•Power shortages common.
•Massive need for energy infrastructure investments, often on fast-track basis.
Developing
Countries
EPC - INDUSTRY & MACRO ENVIRONMENT

24
EPC – INDUSTRY OUTLOOK
Source: Credit Suisse.
• Economic downturn impacts investment plans. Spending has only marginally
deteriorated.
• Evidence that interest on coal powered generation equipment retreats and a
shift is noticed towards natural gas and clean power technologies.
• The priorities set by the various fiscal spending programs around the globe are
expected to play an important role in the coming future.
Investments Plans over 2009
Credit Suisse Global Infrastructure Survey on investment plans evolution covering 300 Utilities globally.
25
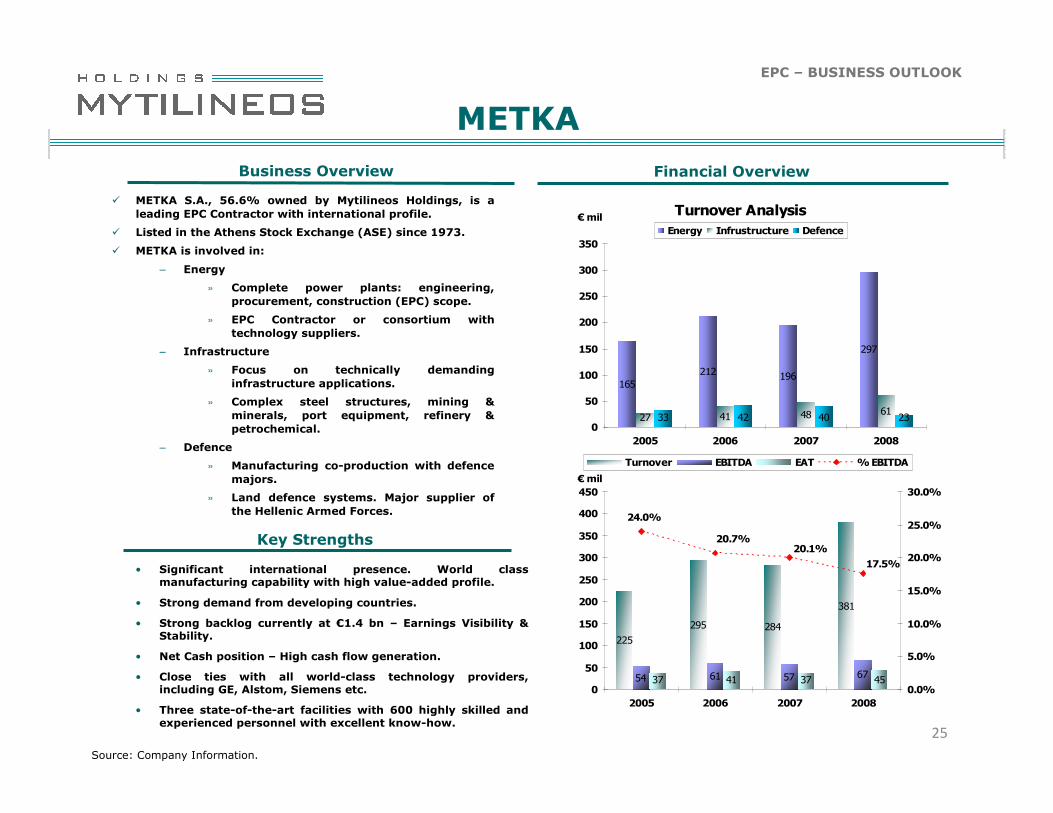
EPC – BUSINESS OUTLOOK
METKA
Business Overview Financial Overview
Key Strengths
• Significant international presence. World class manufacturing capability with high value-added profile.
• Strong demand from developing countries.
• Strong backlog currently at €1.4 bn – Earnings Visibility & Stability.
• Net Cash position – High cash flow generation.
• Close ties with all world-class technology providers, including GE, Alstom, Siemens etc.
• Three state-of-the-art facilities with 600 highly skilled and experienced personnel with excellent know-how.
Source: Company Information.
Turnover Analysis
212 196
297
48 6133 42 40 23
165
27 410
50
100
150
200
250
300
350
2005 2006 2007 2008
€ mil
Energy Infrustructure Defence
284
381
57 6737 41 37 45
295
225
6154
20.1%
24.0%
20.7%
17.5%
0
50
100
150
200
250
300
350
400
450
2005 2006 2007 2008
€ mil
0.0%
5.0%
10.0%
15.0%
20.0%
25.0%
30.0%
Turnover EBITDA EAT % EBITDA
� METKA S.A., 56.6% owned by Mytilineos Holdings, is a
leading EPC Contractor with international profile.
� Listed in the Athens Stock Exchange (ASE) since 1973.
� METKA is involved in:
– Energy
» Complete power plants: engineering,
procurement, construction (EPC) scope.
» EPC Contractor or consortium with
technology suppliers.
– Infrastructure
» Focus on technically demanding
infrastructure applications.
» Complex steel structures, mining &
minerals, port equipment, refinery &
petrochemical.
– Defence
» Manufacturing co-production with defence
majors.
» Land defence systems. Major supplier of
the Hellenic Armed Forces.

26
PROJECTS
ABROAD
60%
PPC
11%
ENDESA HELLAS
25%
OTHER
4%
EPC - BACKLOG
Source: Company Information.
�Strong Backlog – Visibility – International Profile
� PPC: 417 MW in Aliveri, Natural Gas Fired combined cycle. Alstom
sub supplier for the main equipment. Contract value of €219 m.
� ENDESA HELLAS : 444 MW in Ag. Nikolaos, Natural Gas Fired
combined cycle. GE sub supplier for the main equipment. Contract
value of €232 m.
� OMV PETROM: 860 MW in Romania, Natural Gas fired. 50-50
Consortium with GE. Contract value of €210 m.
� PEEGT: 700 MW in Syria, Natural Gas fired. METKA leader of
Consortium with Ansaldo. Contract value of €650 m (contract
award).
� KORINTHOS POWER: 437 MW in Ag. Theodoroi, Natural Gas Fired
combined cycle. GE sub supplier for the main
equipment. Contract value of €285.
€1.4 bn
Backlog - Sales Evolution
230
605
1,460
284381
165 212 196 297
450295
225
0
200
400
600
800
1,000
1,200
1,400
1,600
2005 2006 2007 2008
€ mil
Backlog Evolution Group Sales of which EPC Sales

27
Stock Data

28
0.02 0.03 0.070.14
0.21
0.51
0.10
2002 2003 2004 2005 2006 2007 2008
Dividend
STOCK DATA – MYTILINEOS HOLDINGS S.A.
Share Price Information
� Market Cap: € 695 mn
� Avg. Trading Value: € 1.9 mn
� Total No of shares: 116,984,338
� Free Float: 61%
� Listing FTSE/ASE 20 FTSE INTERNATIONAL, MSCI Small Cap and HSBC Small Cap
Notes: Data as of 22 June 2009.
Source: Company Information.
Stock Symbols
� ASE: MYTIL
� Reuters: MYTr.AT
� Bloomberg: MYTIL GA
Shareholder Structure
Dividend Per Share (€)
Dividend Distribution Table
Mytilineos
Family 30.3% Retail 32.9%
Greek Institutional
Investors 12.8%
Foreign Institutional
Investors 15.1%
Treasury
Stock 8.9%
(€ mn) 2003 2004 2005 2006 2007 2008
Profit After Taxes 10.308 14.399 44.834 52.632 161.073 21.592
Total Dividend 4.052 8.104 16.208 24.312 59.662 11.698
Dividend Payout % 39.3% 56.3% 36.2% 46.2% 37.0% 54.2%

29
0.16 0.160.20
0.30
1.35
0.40
0.50
0.40
2002 2003 2004 2005 2006 2007 2008
Dividend
STOCK DATA – METKA S.A.
Share Price Information
� Market Cap: € 421 mn
� Avg. Trading Value: € 0.5 mn
� Total No of shares: 51,950,600
� Free Float: 43.4%
� Listing FTSE/ASE Mid-40,FTSEINTERNATIONAL,
MSCI Small Cap
and HSBC Small Cap
Stock Symbols
� ASE: METK
� Reuters: MTKr.AT
� Bloomberg: METTK GA
Shareholder Structure
Dividend Per Share (€)
Dividend Distribution Table
Mytilineos Holdings
56.6%
Retail 12.3%
Greek Institutional Investors 13.4%
Foreign Institutional Investors 17.7%
Notes: Data as of 22 June 2009.
Source: Company Information.
Capital Return
(€ mn) 2003 2004 2005 2006 2007 2008
Profit After Taxes 11.202 16.371 34.339 40.764 37.288 44.785
Total Dividend 8.312 10.390 15.585 20.780 25.975 20.780
Dividend Payout % 74.2% 63.5% 45.4% 51.0% 69.7% 46.4%

30
Summary

31
STRATEGY
Awards and recognition for community safety and environment. Very valuable operating assets.
Explore investment opportunities in SE Europe, North Africa, Middle East through organic growth and/or acquisitions in all sectors of activity.
GrowthOptions
Project Pipeline
Fianancial Strength and Discipline
Significant Assets
Licence to Operate
People
3,000 employees, operations and project contractors.
EBITDA margins around 12% and EBITDA over € 110 mil.
Source: Company Information.
Strategic Focus
• Bauxite Residue Treatment Facility.
• Aluminum Wagstaf -Enhancement of the Final Product.
• CAPEX in the Energy Sector over € 1bn within the next 3 years.
• Largest vertical integrated Alumina and Aluminum producer in SE Europe.
• CHP Plant 334MW.• RES 45 MW.• 444 MW / 437 MW CCGT’s (under construction).
• World – class manufacturing capabilities in EPC.

32
SUMMARY
� With a well balanced business portfolio the Group is well placed:
� To benefit from the imminent liberalization of the domestic energy market.
� To benefit from the massive need for energy infrastructure investments in the wider
SE Europe region.
� Good organic growth potential in all areas of activities to maintain strong cash
flows and support future CAPEX.
� Attractive Debt/Equity ratio to support further expansion.
� The company has issued a bond loan up to €465 mil. in order to secure adequate
funding requirements necessary for executing its demanding development plan.
� Strong Cash flows supported significantly by the effective risk management
strategy.
� Growth projects are gathering momentum and remain largely on track.
� Attractive dividend policy.
� Successful management’s track record in value creation through a series of value
enhancing deals.
Investment Highlights
Source: Company Information.

33
CONTACT INFORMATION
Nikos KontosGroup Investor Relations OfficerEmail: [email protected]: +30-210-6877395Fax: +30-210-6877400
Mytilineos Holdings S.A.5-7 Patroklou Str.15125 MaroussiAthensGreeceTel: +30-210-6877300Fax: +30-210-6877400
www.mytilineos.grwww.metka.gr
Dimitris KatralisFinancial AnalystEmail:[email protected]: +30-210-6877476Fax: +30-210-6877400
Mytilineos Holdings S.A.5-7 Patroklou Str.15125 MaroussiAthensGreeceTel: +30-210-6877300Fax: +30-210-6877400
www.mytilineos.grwww.metka.gr


