Albania’s First National Communication to the United Nations Framework Convention on Climate Change Presented by: Ermira FIDA, MBA Project Manager Climate Change Enabling Activities COP 8, New Delhi, 23 October 2002
Transcript
Albania’s FirstNational Communication
to the United Nations FrameworkConvention on Climate Change
Presented by:
Ermira FIDA, MBAProject Manager
Climate Change Enabling Activities
COP 8, New Delhi, 23 October 2002
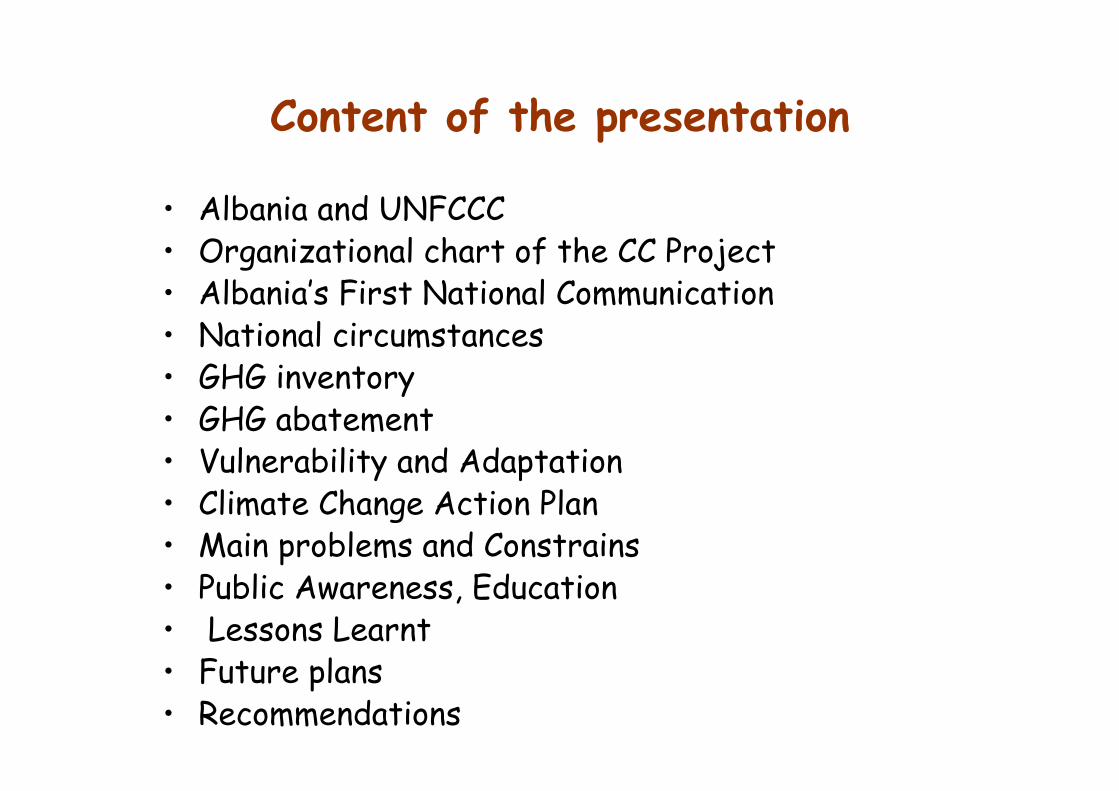
Content of the presentation
• Albania and UNFCCC• Organizational chart of the CC Project• Albania’s First National Communication• National circumstances• GHG inventory• GHG abatement• Vulnerability and Adaptation• Climate Change Action Plan• Main problems and Constrains• Public Awareness, Education• Lessons Learnt• Future plans• Recommendations
Albania and UNFCCC
• UNFCCC ratified in 1995• Non-Annex I Party• National Focal Point - MoE• Member of CACAM since 2001• Climate Change Project launched on October 1998• The FNC submitted on September 2002• A National Climate Change Action Plan - developed• Technology Needs Assessment – started
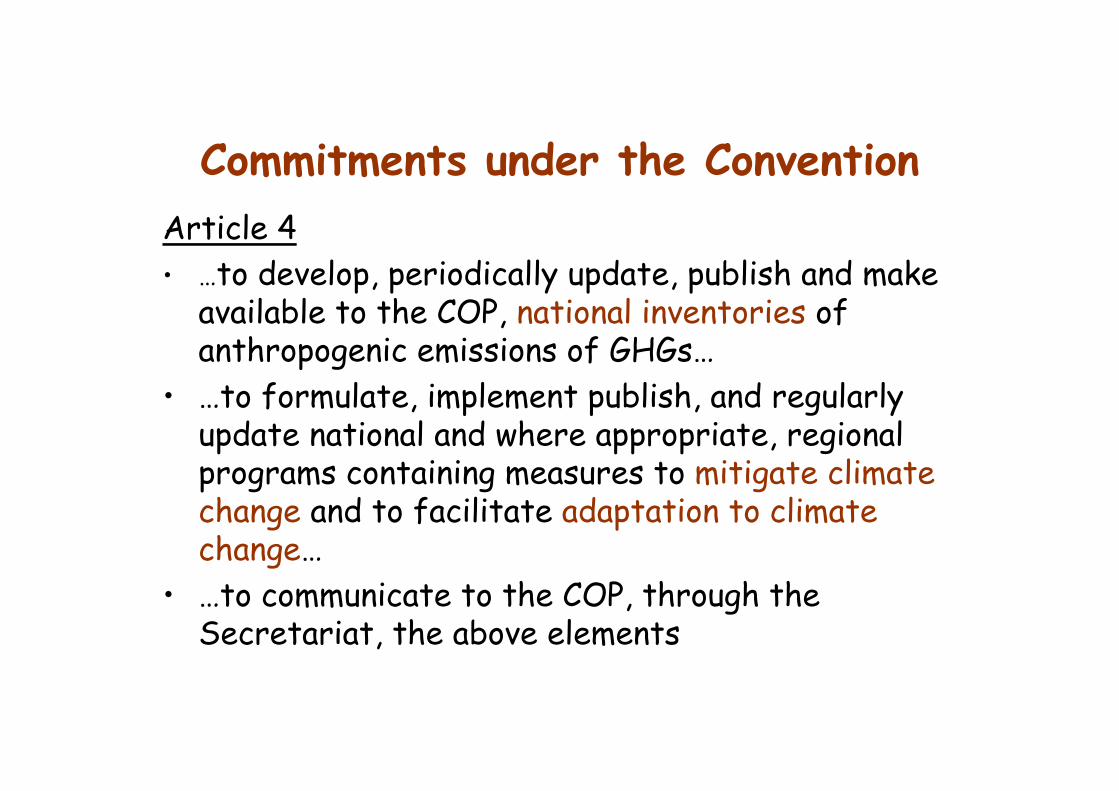
Commitments under the ConventionArticle 4• …to develop, periodically update, publish and make
available to the COP, national inventories ofanthropogenic emissions of GHGs…
• …to formulate, implement publish, and regularlyupdate national and where appropriate, regionalprograms containing measures to mitigate climatechange and to facilitate adaptation to climatechange…
• …to communicate to the COP, through theSecretariat, the above elements
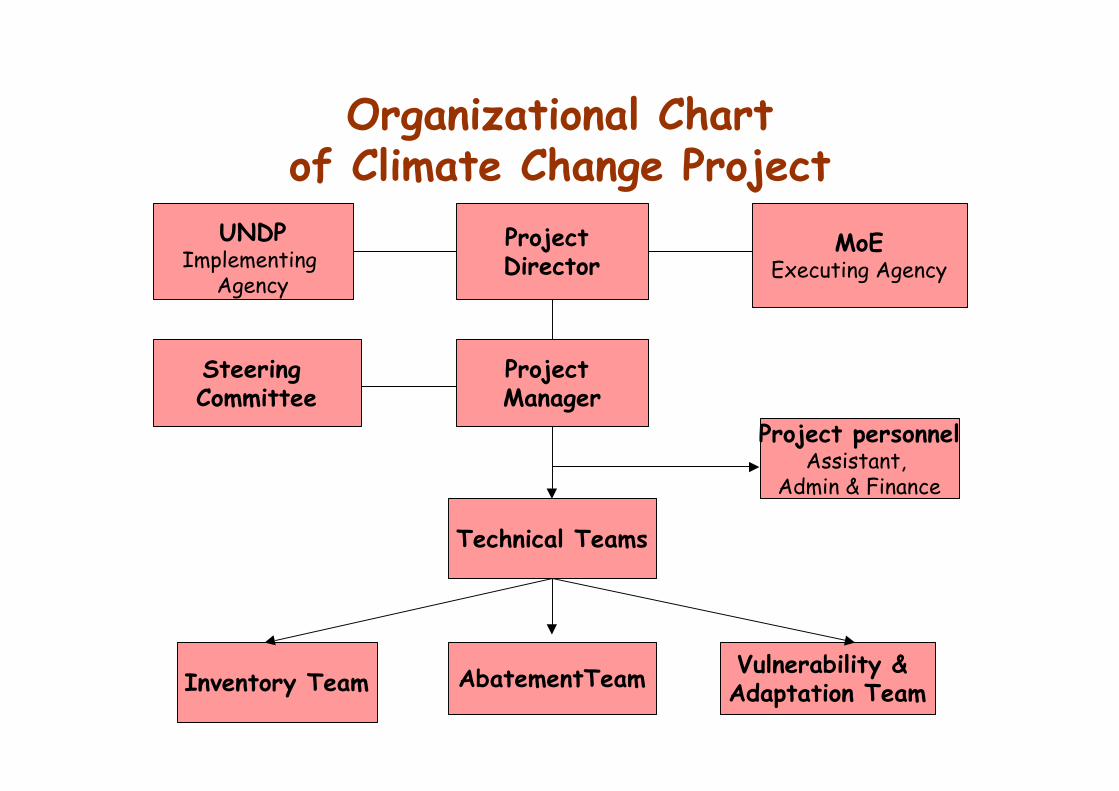
Organizational Chartof Climate Change Project
UNDPImplementing
Agency
MoEExecuting Agency
Project Director
Project Manager
Steering Committee
Technical Teams
Project personnelAssistant,
Admin & Finance
Inventory Team AbatementTeam Vulnerability & Adaptation Team
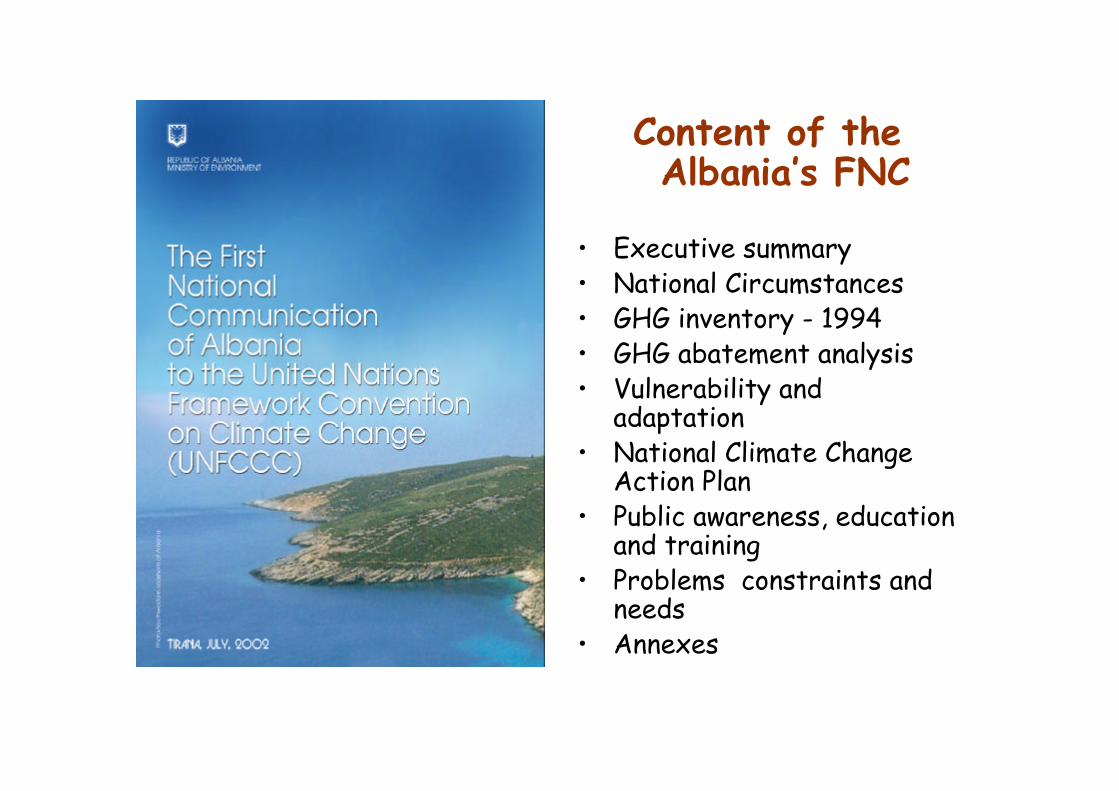
Content of theAlbania’s FNC
• Executive summary• National Circumstances• GHG inventory - 1994• GHG abatement analysis• Vulnerability and
adaptation• National Climate Change
Action Plan• Public awareness, education
and training• Problems constraints and
needs• Annexes
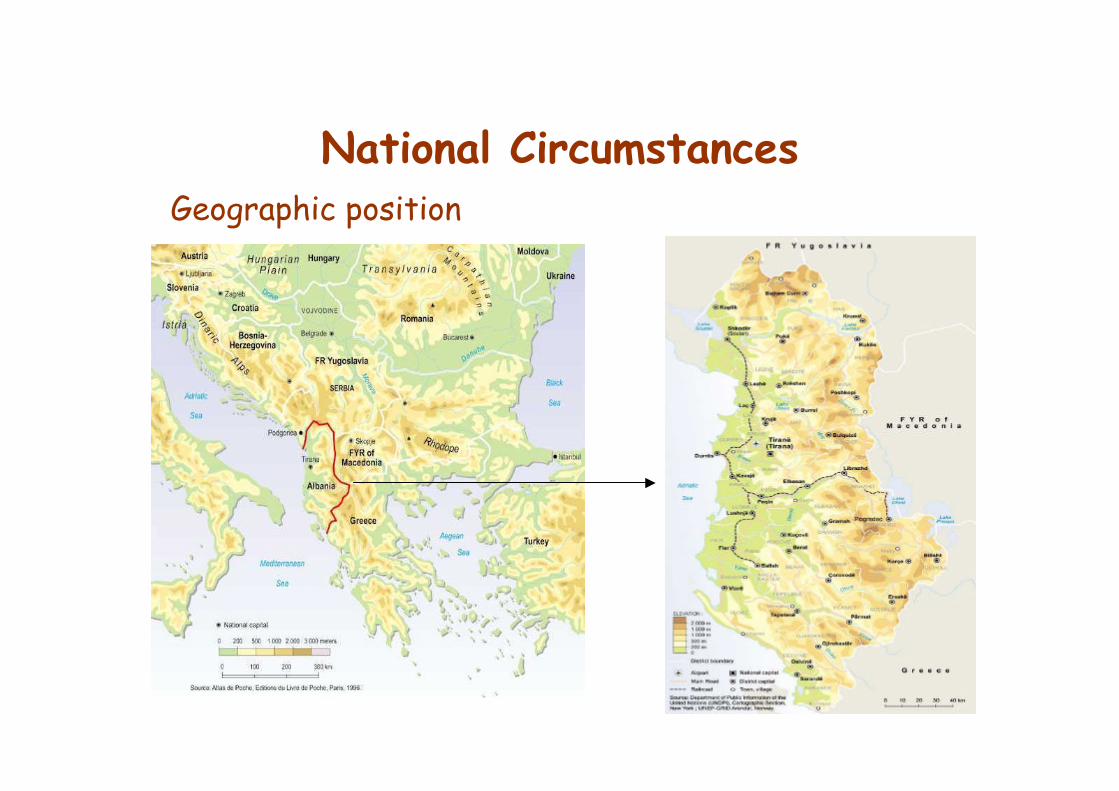
National Circumstances
• dGeographic position
National Circumstances (cont.)
• Area – 28,745 Km2
– Hills and mountains accounts for 77 %• Average altitude - 708 m• Length of the state border – 1, 093 Km2
• Population – 3,3 million• Capitol - Tirana• Official language – Albanian• Local currency – Leks• GDP per capita (1994) – 610 $/capita• Shares of GDP (1994)
– Agriculture – 54 %– Services - 19.8 %– Industry – 12.5 %– Transport – 3.4 %
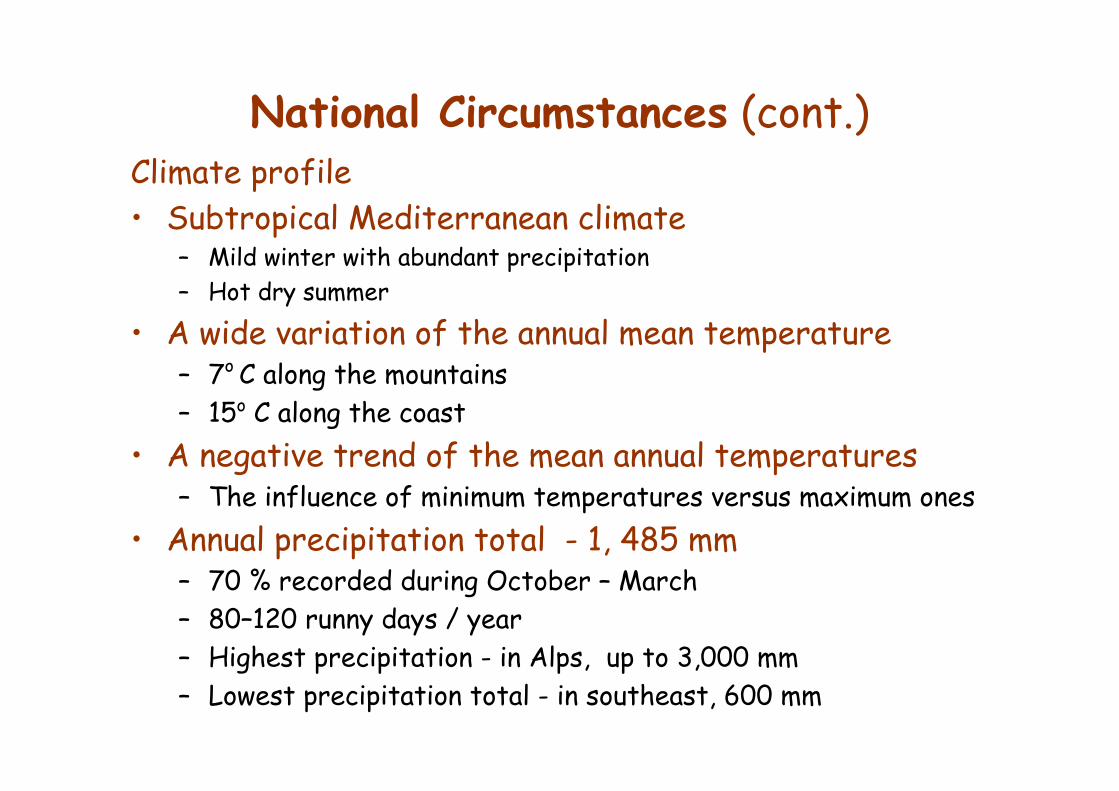
National Circumstances (cont.)Climate profile• Subtropical Mediterranean climate
– Mild winter with abundant precipitation– Hot dry summer
• A wide variation of the annual mean temperature– 7o C along the mountains– 15o C along the coast
• A negative trend of the mean annual temperatures– The influence of minimum temperatures versus maximum ones
• Annual precipitation total - 1, 485 mm– 70 % recorded during October – March– 80–120 runny days / year– Highest precipitation - in Alps, up to 3,000 mm– Lowest precipitation total - in southeast, 600 mm
National Circumstances (cont.)• Water resources
– relatively abundant water resources– surface, ground and marine
• Forests– accounts for 36 % of the territory
• 83% - natural and semi natural• damaged due to illegal cuttings and burning
• Agriculture– 50% of GDP– before 1990 - focused on cereals– after 1990 - shifted to animal foodstuffs supply
• Mining– rich in chromium, copper, iron – nickel– after 1990 - production collapsed– technology equipment - obsolete
National Circumstances (cont.)Energy• Energy consumption
– Electricity – 60 % of total consumption in urban area– Electricity – 30 % of total consumption in rural area– Fuel wood - 60 % of total consumption in rural area– LPG and kerosene – the rest
• Energy supply– Electricity: HPP - 94%, TPP – 6%– After 1990 - frequent electricity cuttings due to:
• Overuse• Lack of other alternatives
Transport• After 1990, a rapid expansion of private carsEnvironment
– MoE - established on October 2001– A package of environmental laws and by laws - adopted– An updated NEAP – adopted– Environmental monitoring – a weak point
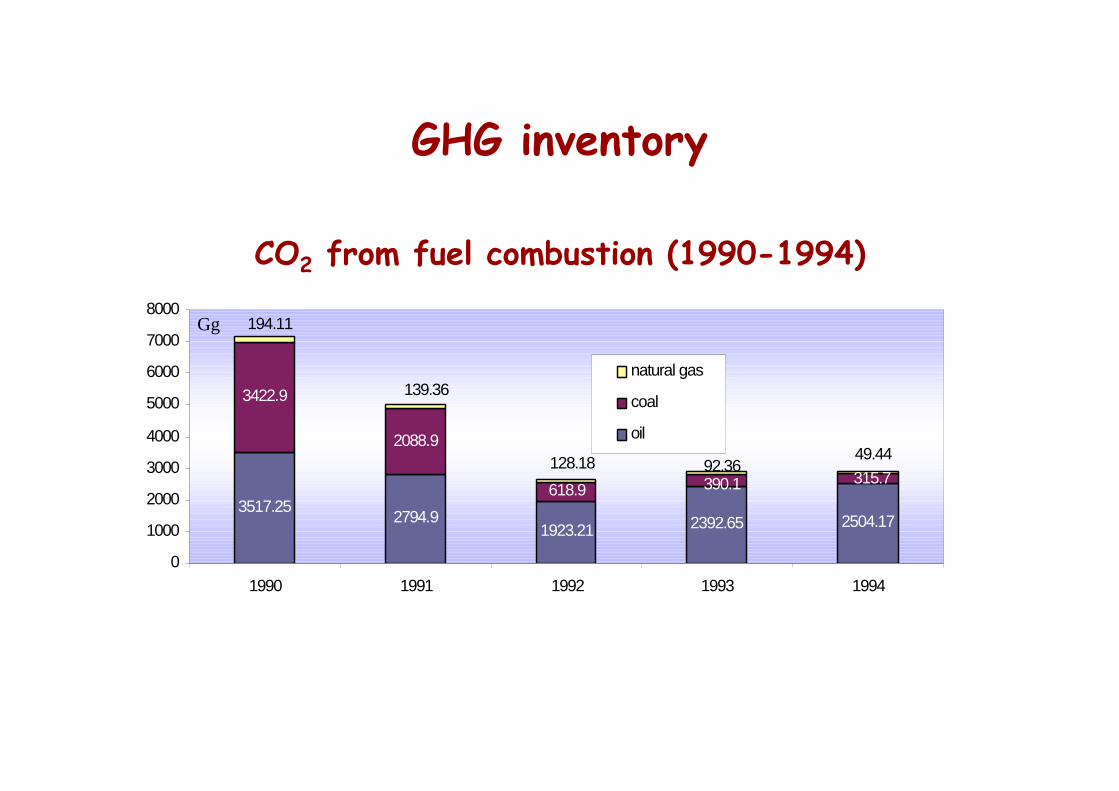
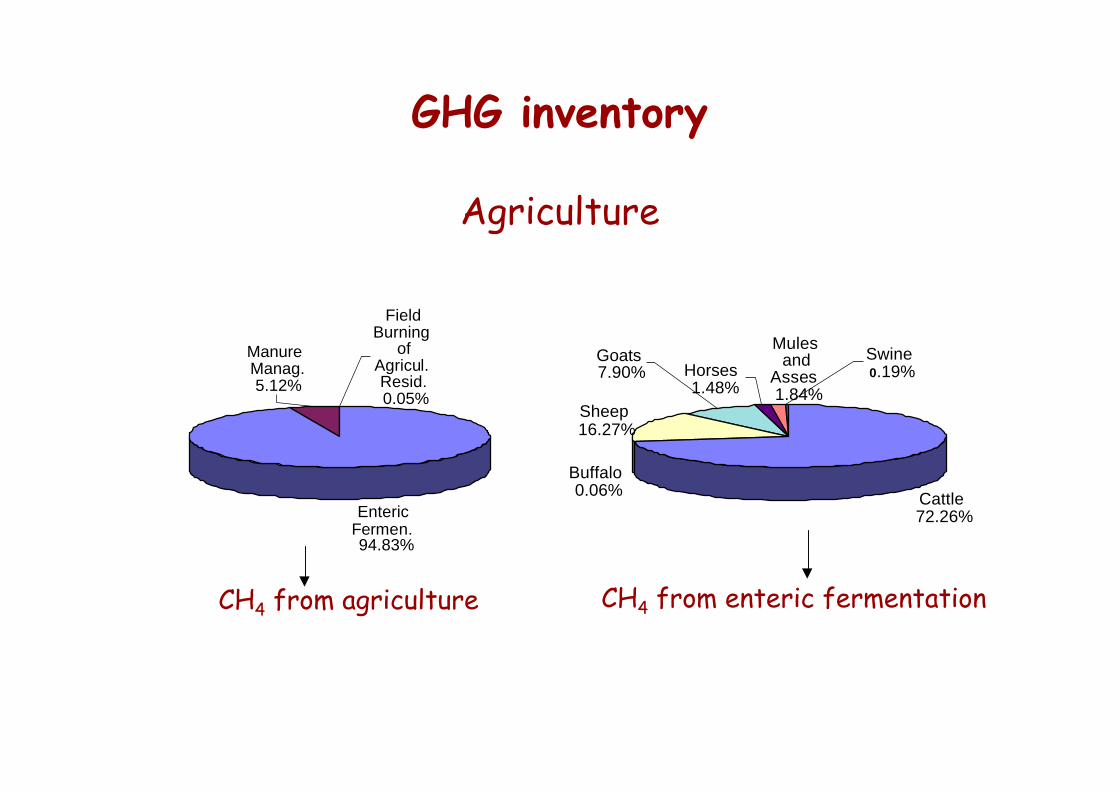
GHG Inventory– Report on direct GHG emissions in 1994
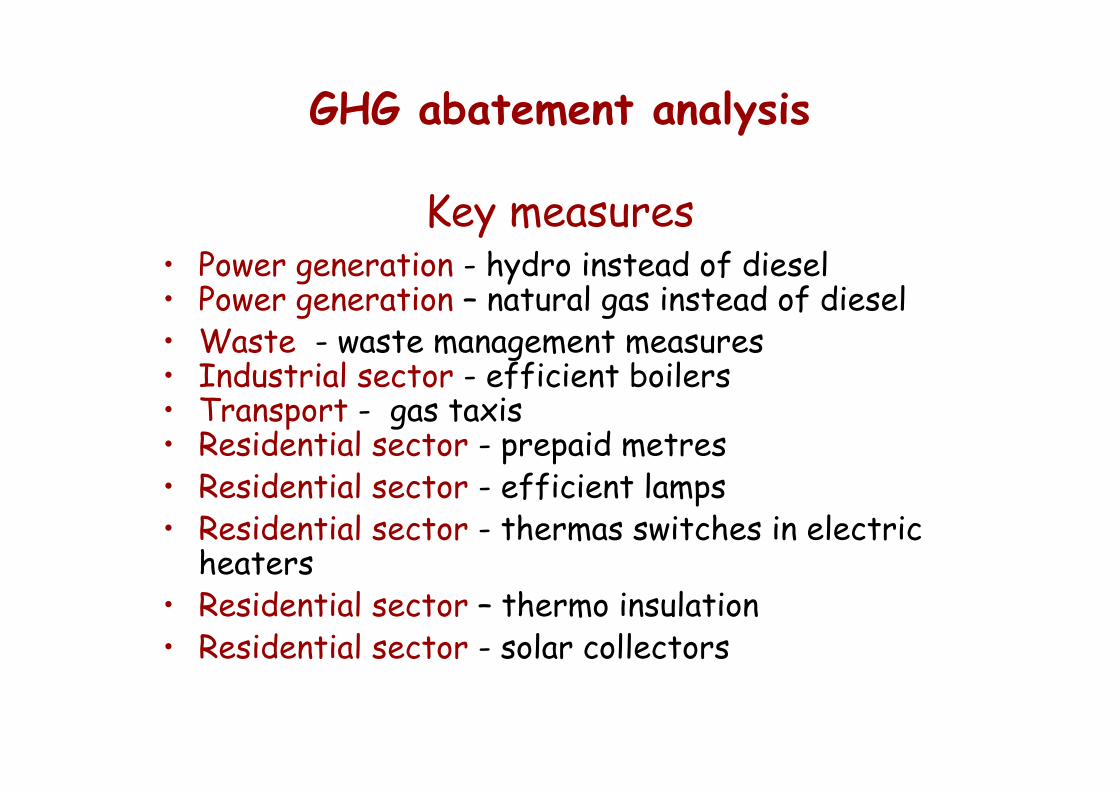
Overall potential for GHG abatementEnergy and transport
0
2
4
6
8
10
12
14
16
18
20
22
24
26
1994
1996
1998
2000
2002
2004
2006
2008
2010
2012
2014
2016
2018
2020
reduct io n o f GHG in energy trans fo rmatio n s e c to rreduct io n o f GHG fro m e nergy c o ns umptio n in trans po rtreduct io n o f GHG fro m e nergy c o ns umptio n in agriculturereduct io n o f GHG fro m e nergy c o ns umptio n in indus tryreduct io n o f GHG fro m e nergy c o ns umptio n in s e rvic ereduct io n o f GHG fro m e nergy c o ns umptio n in re s identia l
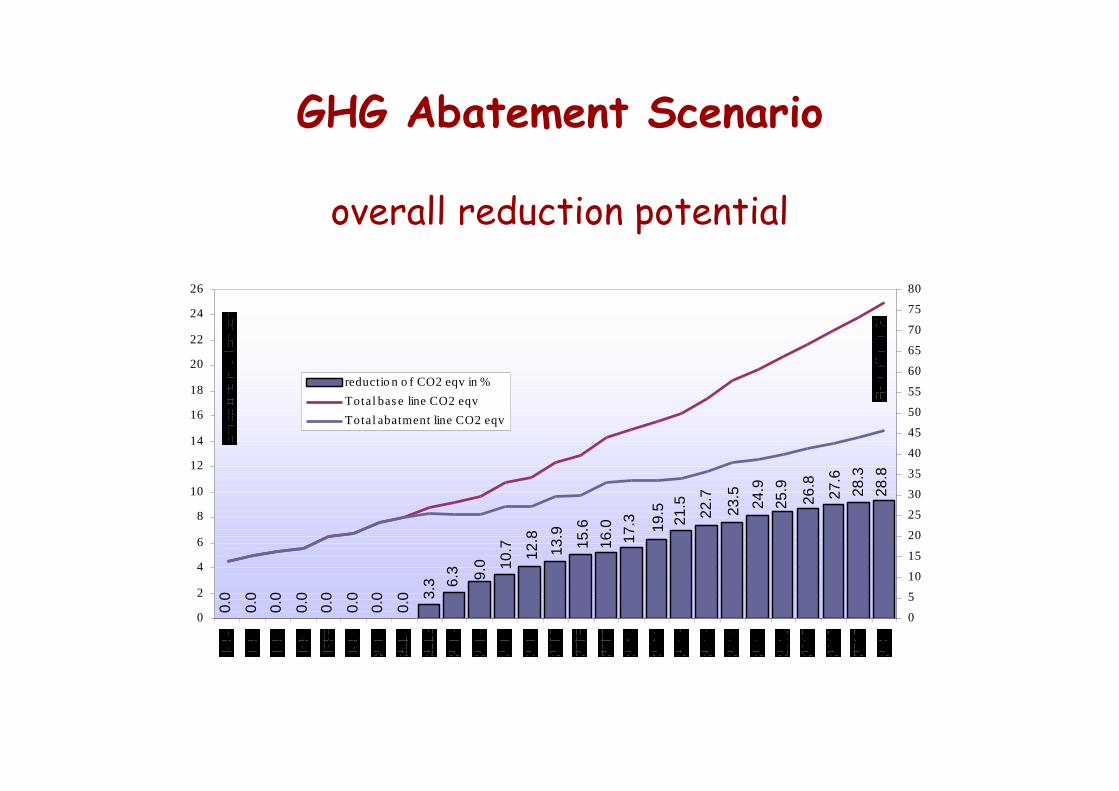
GHG Abatement Scenario
overall reduction potential
10.7
9.0 12
.8
13.9
15.6
16.0
17.3 19
.521
.5
22.7
23.5
24.9
25.9
26.8
27.6
28.3
28.8
6.3
3.3
0.0
0.0
0.0
0.0
0.0
0.0
0.0
0.0
0
2
4
6
8
10
12
14
16
18
20
22
24
26
0
5
10
15
20
25
30
35
40
45
50
55
60
65
70
75
80
reductio n o f CO2 eqv in %
Total bas e line CO2 eqv
Total abatment line CO2 eqv
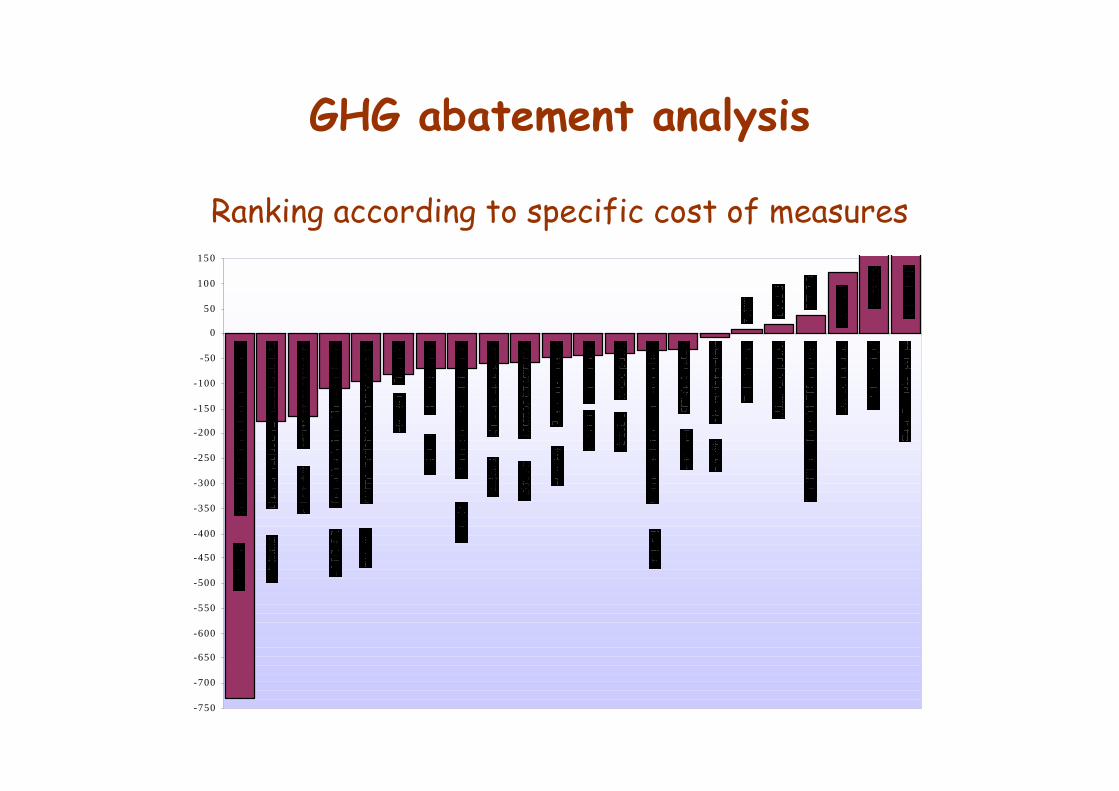
GHG abatement analysis
Ranking according to specific cost of measures
-750
-700
-650
-600
-550
-500
-450
-400
-350
-300
-250
-200
-150
-100
-50
0
50
100
150
Vulnerability and adaptation• Time horizons for CC Scenarios
– 2025, 2050, 2100• Methodology
– MAGIC/SCENGEN software for CC scenarios– IPCC technical guidelines for assessing CC Impacts and
adaptations, 1994– LEAP for impacts on Energy sector– Statistical models, expert judgment, regional analogies
• Focus on– Evaluation of current climate situation– Expected climate changes– Expected impacts of climate changes– Measures for adaptation
Vulnerability and adaptation
Climate Change Scenario
Annual temperature increaseup to 1 0C, 1.8 0C, 3.6 0C respectively by 2025,2050, 2100
Annual precipitation decreaseup to –3.8%, -6.1%, -12.5% respectively by 2025,2050, 2100
Vulnerability and adaptation
Expected annual temperature changes(increase)
Vulnerability and adaptationExpected annual precipitation changes
(decrease)
Vulnerability and adaptation
• Reduction of theamount of surfacewater flow
• Decrease of waterstorage used by HPPsfor energy production
• Reduction of thequality of drinkingwater
• High potential offlooding risk
• Increase of salinityof aquifers (CZ)
Impacts on water resources
-100
-80
-60
-40
-20
0
20
Time Horizons
The
ave
rage
cha
nge
in m
ean
seso
nal r
unof
f (%
)
Spring
Summer
Autumn
Winter
Annual
2025 2050 21002025 2050 21002025 2050 2100
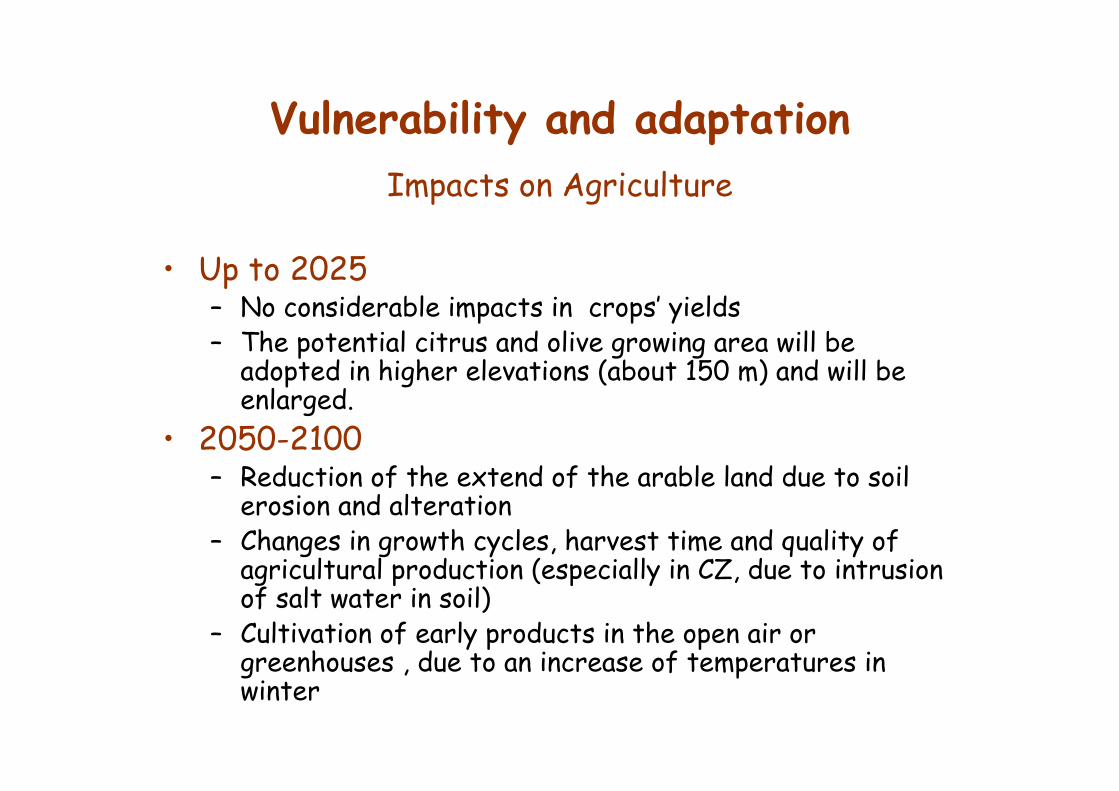
Vulnerability and adaptationImpacts on Agriculture
• Up to 2025– No considerable impacts in crops’ yields– The potential citrus and olive growing area will be
adopted in higher elevations (about 150 m) and will beenlarged.
• 2050-2100– Reduction of the extend of the arable land due to soil
erosion and alteration– Changes in growth cycles, harvest time and quality of
agricultural production (especially in CZ, due to intrusionof salt water in soil)
– Cultivation of early products in the open air orgreenhouses , due to an increase of temperatures inwinter
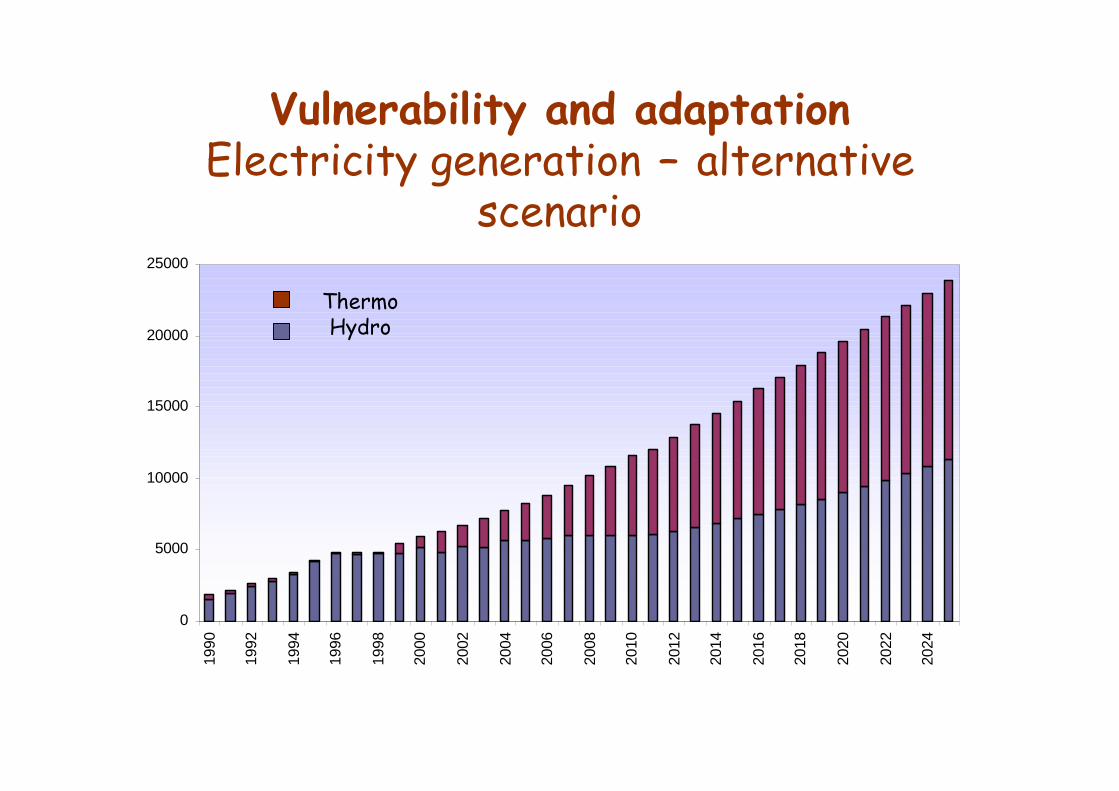
Vulnerability and adaptationImpacts on Energy
Energy consumption• An expected decrease in heating degree days• An expected increase in cooling degree days• An expected increased demand for energy for space cooling
during summer• An expected decreased demand for energy for space
heating during winterEnergy production• New Energy Scenario which consider Climate Change
– From 94% (hydro) versus 6%(thermo) – 47.7% (hydro) versus52.3% (thermo)
– Expected energy generation in 2025 – 23,816 GWh compared to1,795 GWh in 1990.
Vulnerability and adaptationElectricity generation – alternative
scenario
0
5000
10000
15000
20000
25000
1990
1992
1994
1996
1998
2000
2002
2004
2006
2008
2010
2012
2014
2016
2018
2020
2022
2024
ThermoHydro
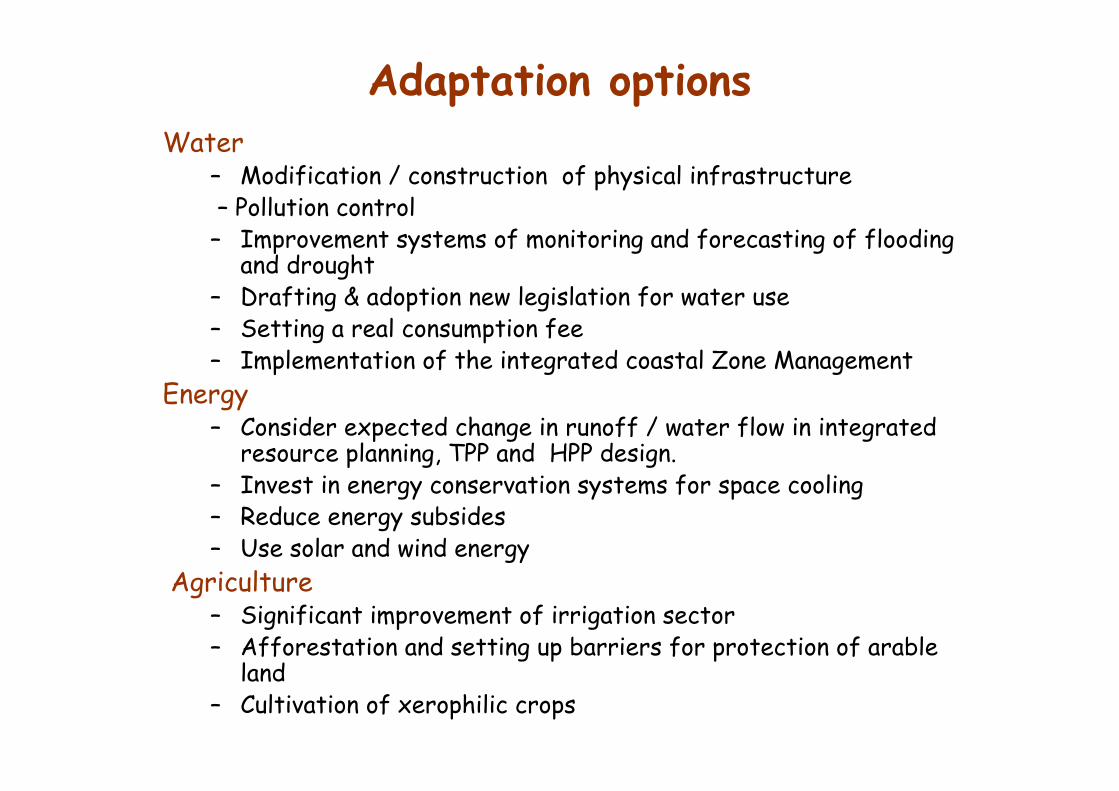
Adaptation optionsWater
– Modification / construction of physical infrastructure – Pollution control– Improvement systems of monitoring and forecasting of flooding
and drought– Drafting & adoption new legislation for water use– Setting a real consumption fee– Implementation of the integrated coastal Zone Management
Energy– Consider expected change in runoff / water flow in integrated
resource planning, TPP and HPP design.– Invest in energy conservation systems for space cooling– Reduce energy subsides– Use solar and wind energy
Agriculture– Significant improvement of irrigation sector– Afforestation and setting up barriers for protection of arable
land– Cultivation of xerophilic crops
National Climate Change Action Plan
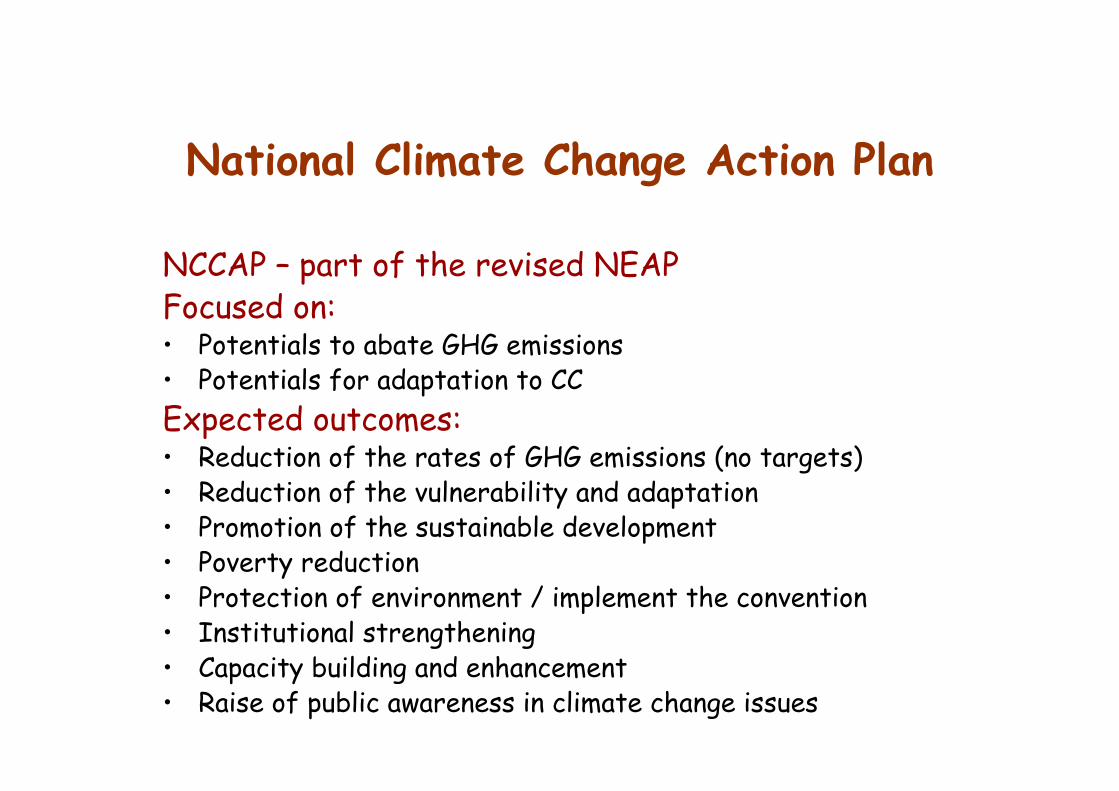
NCCAP – part of the revised NEAPFocused on:• Potentials to abate GHG emissions• Potentials for adaptation to CCExpected outcomes:• Reduction of the rates of GHG emissions (no targets)• Reduction of the vulnerability and adaptation• Promotion of the sustainable development• Poverty reduction• Protection of environment / implement the convention• Institutional strengthening• Capacity building and enhancement• Raise of public awareness in climate change issues
National Climate Change Action Plan• The main responsibility for implementation of the
NCCAP:– Ministry of Environment
• Period covered– up to 2020
• Revision according to:– New development plans and goals– Changes in legal framework– State-of-the-art data on climate change– National environmental strategy– Further developments in UNFCCC negotiations– Eligibility of funds under convention mechanisms and
other sources– Status of Albania under the Convention– Amount of funds allocated by the Government– Level of public awareness
Public awareness, education on CC
• The level of public awareness on CC is relatively low• Prior the start up of the project on NC, no public awareness
activities have been held• The project on NC has positively contributed on
awareness raising• Two national workshops organized:
• Initiation workshop for project on NC• Workshop on FNC
• Posters, newspaper articles, web page.• The level of education on CC is low, even for environmental
issues.• Some tendencies to introduce environmental education into
school curricula
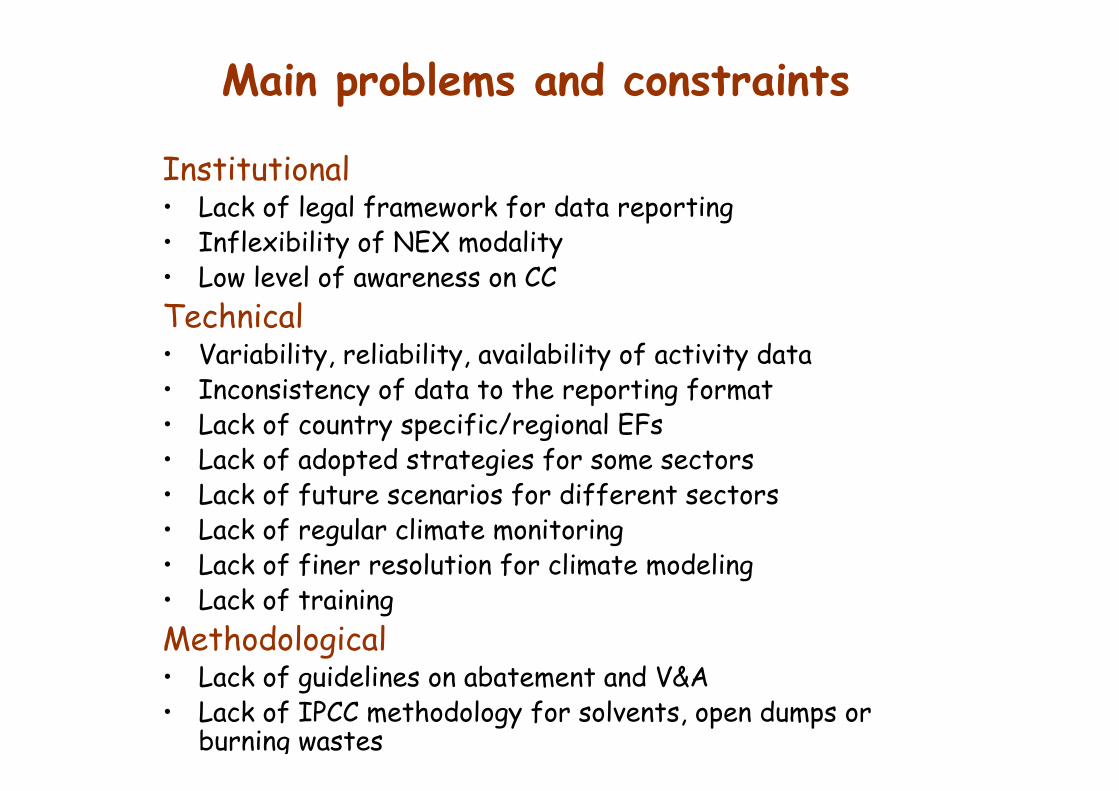
Main problems and constraints
Institutional• Lack of legal framework for data reporting• Inflexibility of NEX modality• Low level of awareness on CCTechnical• Variability, reliability, availability of activity data• Inconsistency of data to the reporting format• Lack of country specific/regional EFs• Lack of adopted strategies for some sectors• Lack of future scenarios for different sectors• Lack of regular climate monitoring• Lack of finer resolution for climate modeling• Lack of trainingMethodological• Lack of guidelines on abatement and V&A• Lack of IPCC methodology for solvents, open dumps or
burning wastes
Lessons learntWe recognize the importance of :• The selection of the most qualified national
experts in NC process• The sustainability and maintenance of the teams
– Training of trainers• Close collaboration of inventory and abatement
teams• Exchange of information and experience at
national, regional, international level– Technical support provided by NCSP, UNFCCC Sec
• Working in relationship with similar enablingactivities in the region/country
• Peer review of inventory, abatement and V&Astudies
• Raising public awareness among policy makers
Recommendations
• Establishment of permanent mechanism forNational Communications to serve as a nationalSecretariat for UNFCCC
• Maintenance and enhancement of nationalcapacities built in the area of Climate Change
• Strengthening of regional cooperation• Improvement of the existing guidelines for
preparation of the NCs from NAI Parties• Making funds available for the preparation of the
SNC from NAI Parties• Assist NAI Parties for the preparation of the