33
Presentation of Data Module 6 Basic Statistics
| Date post: | 01-Jun-2018 |
| Category: |
Documents |
| Upload: | rimel-dizon-evaristo |
| View: | 216 times |
| Download: | 0 times |

8/9/2019 Presentation of Data.pptx
http://slidepdf.com/reader/full/presentation-of-datapptx 1/33
Presentation of DataModule 6
Basic Statistics

8/9/2019 Presentation of Data.pptx
http://slidepdf.com/reader/full/presentation-of-datapptx 2/33
Presentation of Data
Objectives: At the end of the lesson, thestudents should be able to:
1. Prepare a stemandleaf plot
!. "escribe data in te#tual form
$. %onstruct fre&uenc' distribution table
(. %reate )raphs*. +ead and interpret )raphs and tables
8/9/2019 Presentation of Data.pptx
http://slidepdf.com/reader/full/presentation-of-datapptx 3/33
Ungrouped vs. Grouped Data
"ata can be classified as )rouped orun)rouped.
Ungrouped data are data that arenot or)anied, or if arran)ed, could
onl' be from hi)hest to lo-est orlo-est to hi)hest.
Grouped data are data that are
or)anied and arran)ed intodifferent classes or cate)ories.

8/9/2019 Presentation of Data.pptx
http://slidepdf.com/reader/full/presentation-of-datapptx 4/33
Presentation of Data
e#tual
Method• +earran)ement
from lo-est tohi)hest
• Stemandleaf
plot
abular
Method• /re&uenc'
distributiontable 0/"
• +elative /"• %umulative /"• %ontin)enc'
able
2raphical
Method• Bar %hart• 3isto)ram• /re&uenc'
Pol')on• Pie %hart• 4ess than,
)reater thanO)ive

8/9/2019 Presentation of Data.pptx
http://slidepdf.com/reader/full/presentation-of-datapptx 5/33

8/9/2019 Presentation of Data.pptx
http://slidepdf.com/reader/full/presentation-of-datapptx 6/33
Textual Presentation of Data
#ample. 7ou are as8ed to present theperformance of 'our section in the
Statistics test. he follo-in) are the testscores of 'our class:
$( (! !9 *9 1 ; $( ($
*9 1< $* ($ *9 !$ !$ $*
$ $< $< $; $; $< $< $;
!( !; !* !6 !< ! (( ((
(; (< (6 (* (* (6 (* (6

8/9/2019 Presentation of Data.pptx
http://slidepdf.com/reader/full/presentation-of-datapptx 7/33
/irst, arran)e the data in order for 'ou to
identif' the important characteristics. his can
be done in t-o -a's: rearran)in) from lo-estto hi)hest or usin) the stemandleaf plot.
Belo- is the rearran)ement of data from
lo-est to hi)hest:
; !$ !< $* $< ($ (* (<
1 !( !; $ $; ($ (* (;
1< !* $( $< $; (( (6 *9
!9 !6 $( $< $; (( (6 *9
!$ ! $* $< (! (* (6 *9
8/9/2019 Presentation of Data.pptx
http://slidepdf.com/reader/full/presentation-of-datapptx 8/33
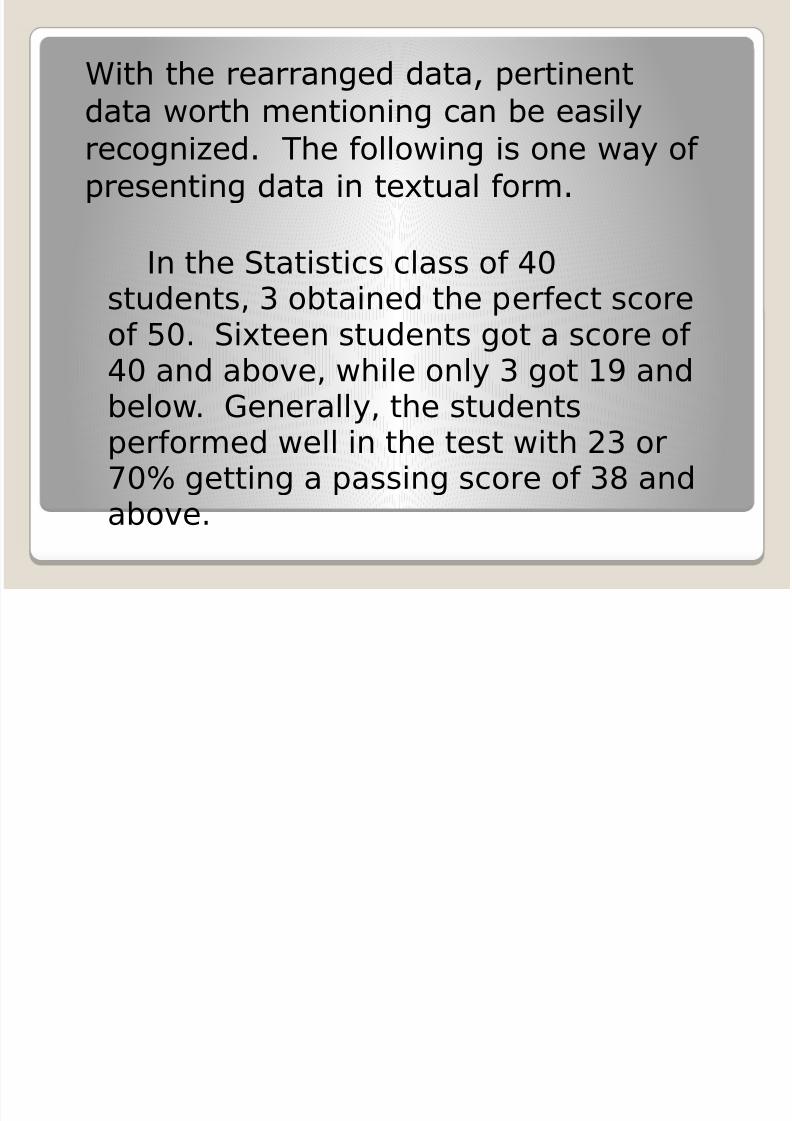
=ith the rearran)ed data, pertinent
data -orth mentionin) can be easil'
reco)nied. he follo-in) is one -a' ofpresentin) data in te#tual form.
In the Statistics class of 40students, 3 obtained the perfect scoreof 50. Sixteen students got a score of40 and above, while only 3 got 1 and
below. !enerally, the studentsperfor"ed well in the test with #3 or$0% getting a passing score of 3& andabove.
8/9/2019 Presentation of Data.pptx
http://slidepdf.com/reader/full/presentation-of-datapptx 9/33
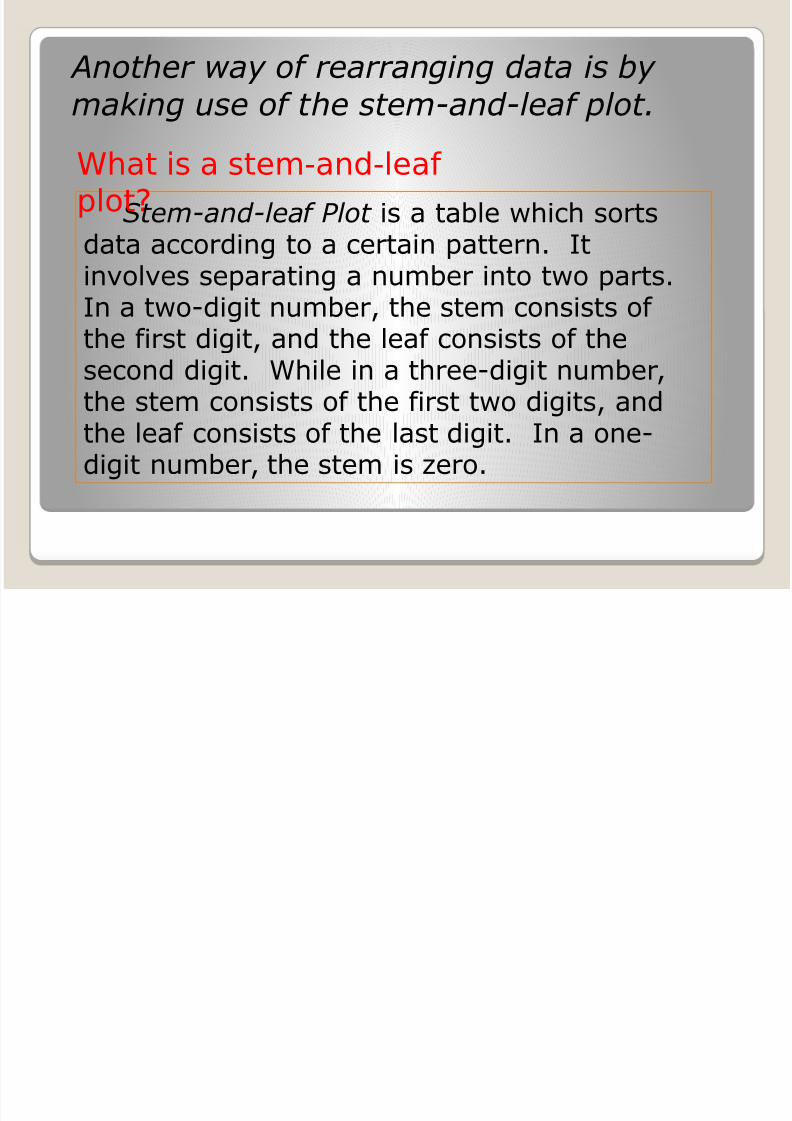
Another way of rearranging data is by
making use of the stem-and-leaf plot.
Stem-and-leaf Plot is a table -hich sortsdata accordin) to a certain pattern. 5t
involves separatin) a number into t-o parts.5n a t-odi)it number, the stem consists ofthe first di)it, and the leaf consists of thesecond di)it. =hile in a threedi)it number,
the stem consists of the first t-o di)its, andthe leaf consists of the last di)it. 5n a onedi)it number, the stem is ero.
'hat is a ste"(and(leafplot)
8/9/2019 Presentation of Data.pptx
http://slidepdf.com/reader/full/presentation-of-datapptx 10/33
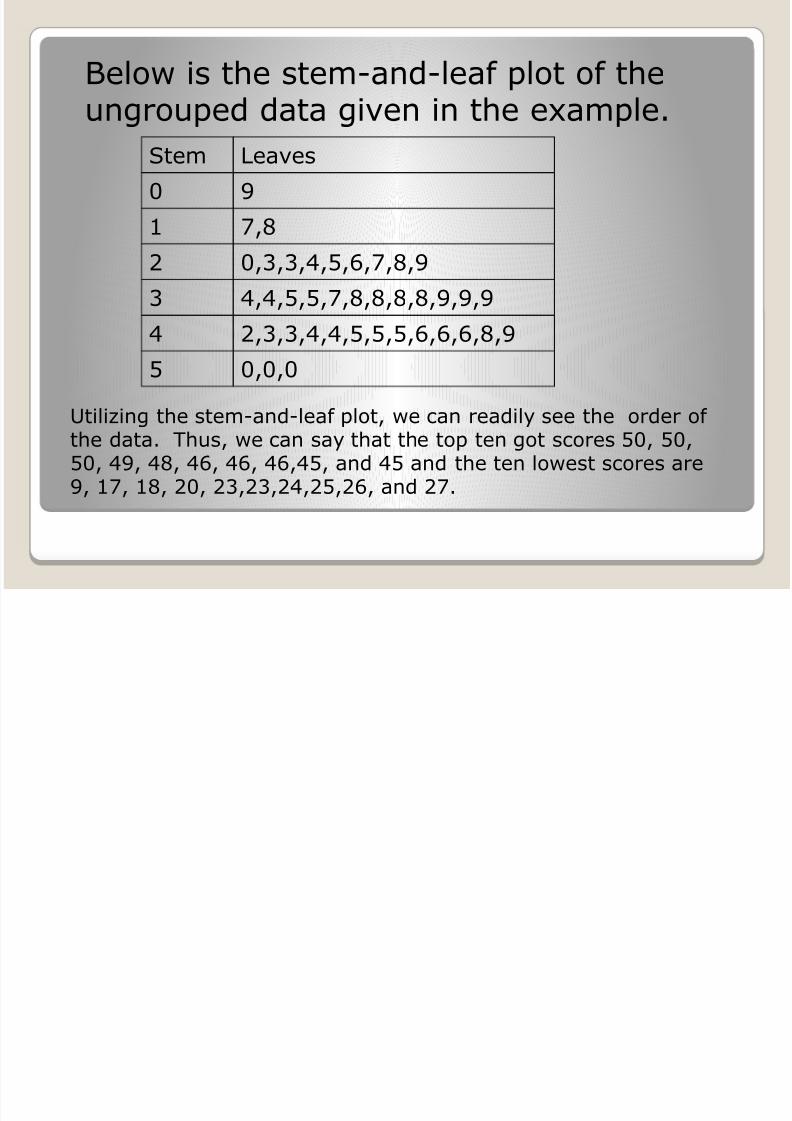
Belo- is the stemandleaf plot of theun)rouped data )iven in the e#ample.
Stem 4eaves
9 ;
1 ,<
! 9,$,$,(,*,6,,<,;
$ (,(,*,*,,<,<,<,<,;,;,;
( !,$,$,(,(,*,*,*,6,6,6,<,;
* 9,9,9
>tiliin) the stemandleaf plot, -e can readil' see the order ofthe data. hus, -e can sa' that the top ten )ot scores *9, *9,*9, (;, (<, (6, (6, (6,(*, and (* and the ten lo-est scores are;, 1, 1<, !9, !$,!$,!(,!*,!6, and !.
8/9/2019 Presentation of Data.pptx
http://slidepdf.com/reader/full/presentation-of-datapptx 11/33
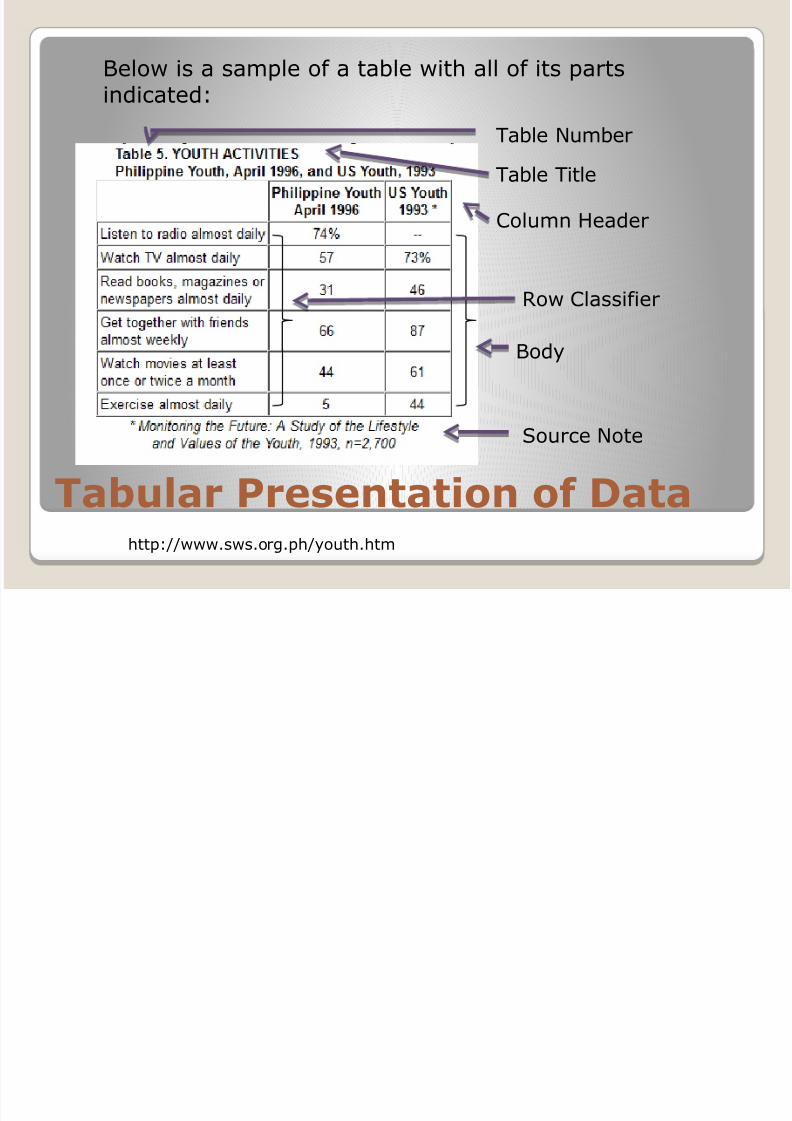
Tabular Presentation of Data http:??---.s-s.or).ph?'outh.htm
able @umber
able itle
%olumn 3eader
+o- %lassifier
Bod'
Source @ote
Belo- is a sample of a table -ith all of its partsindicated:

8/9/2019 Presentation of Data.pptx
http://slidepdf.com/reader/full/presentation-of-datapptx 12/33
Frequency Distribution Table
A fre&uenc' distribution table is a table-hich sho-s the data arran)ed into
different classes0or cate)ories and thenumber of cases0or fre&uencies -hich fallinto each class.
he follo-in) is an illustration of afre&uenc' distribution table for un)roupeddata:
8/9/2019 Presentation of Data.pptx
http://slidepdf.com/reader/full/presentation-of-datapptx 13/33
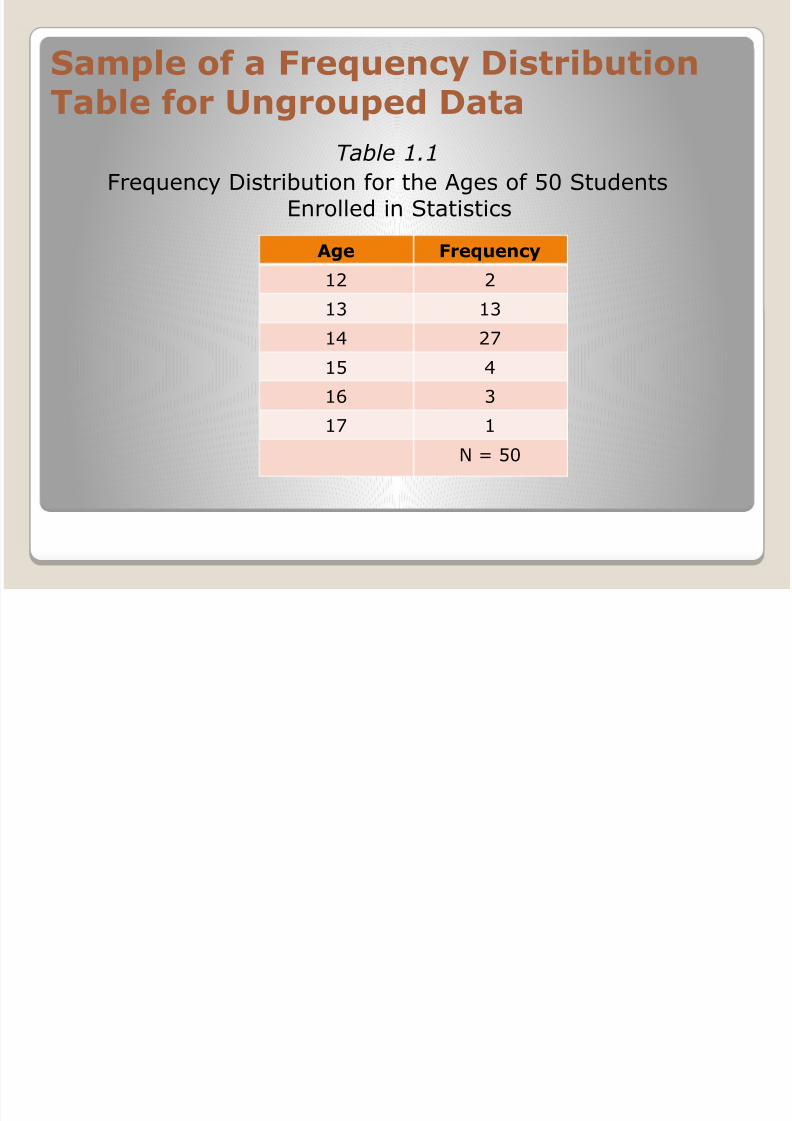
Sample of a Frequency DistributionTable for Ungrouped Data
Table 1.1
/re&uenc' "istribution for the A)es of *9 Studentsnrolled in Statistics
Age Frequency
1! !
1$ 1$
1( !
1* (
16 $
1 1
@ *9

8/9/2019 Presentation of Data.pptx
http://slidepdf.com/reader/full/presentation-of-datapptx 14/33
Sample of a Frequency Distribution
Table for Grouped Data
able 1.!
/re&uenc' "istribution able for the ui Scores of
*9 Students in 2eometr'
0 - 2 1
3 - 5 2
6 - 8 13
9 - 11 15
12 - 14 19
Scores Frequency

8/9/2019 Presentation of Data.pptx
http://slidepdf.com/reader/full/presentation-of-datapptx 15/33
are the smallest numbers that can actuall' belon)
to different classes
0 - 2 1
3 - 5 2
6 - 8 13
9 - 11 15
12 - 14 19
Rating Frequency
o!er "lass imits

8/9/2019 Presentation of Data.pptx
http://slidepdf.com/reader/full/presentation-of-datapptx 16/33
Lower Class
Liits
0 - 2 1
3 - 5 2
6 - 8 13
9 - 11 15
12 - 14 19
Rating Frequency
are the smallest numbers that can actuall' belon)
to different classes
o!er "lass imits

8/9/2019 Presentation of Data.pptx
http://slidepdf.com/reader/full/presentation-of-datapptx 17/33
0 - 2 1
3 - 5 2
6 - 8 13
9 - 11 15
12 - 14 19
Rating Frequency
are the lar)est numbers that can actuall' belon) to
different classes
Upper "lass imits

8/9/2019 Presentation of Data.pptx
http://slidepdf.com/reader/full/presentation-of-datapptx 18/33
!""er Class
Liits
0 - 2 1
3 - 5 2
6 - 8 13
9 - 11 15
12 - 14 19
Rating Frequency
are the lar)est numbers that can actuall' belon) to
different classes
Upper "lass imits

8/9/2019 Presentation of Data.pptx
http://slidepdf.com/reader/full/presentation-of-datapptx 19/33
are the numbers used to separate classes, but
-ithout the )aps created b' class limits
"lass #oundaries

8/9/2019 Presentation of Data.pptx
http://slidepdf.com/reader/full/presentation-of-datapptx 20/33
0 - 2 20
3 - 5 14
6 - 8 15
9 - 11 2
12 - 14 1
Rating Frequency
- 0#5
2#5
5#5
8#5
11#5
14#5
number separatin) classes
"lass #oundaries

8/9/2019 Presentation of Data.pptx
http://slidepdf.com/reader/full/presentation-of-datapptx 21/33
Class
$oun%aries
0 - 2 20
3 - 5 14
6 - 8 15
9 - 11 2
12 - 14 1
Rating Frequency
- 0#5
2#5
5#5
8#5
11#5
14#5
number separatin) classes
"lass #oundaries
8/9/2019 Presentation of Data.pptx
http://slidepdf.com/reader/full/presentation-of-datapptx 22/33
he %lass Mar8 or %lass Midpoint is the respective
avera)e of each class limits
"lass $idpoints
8/9/2019 Presentation of Data.pptx
http://slidepdf.com/reader/full/presentation-of-datapptx 23/33
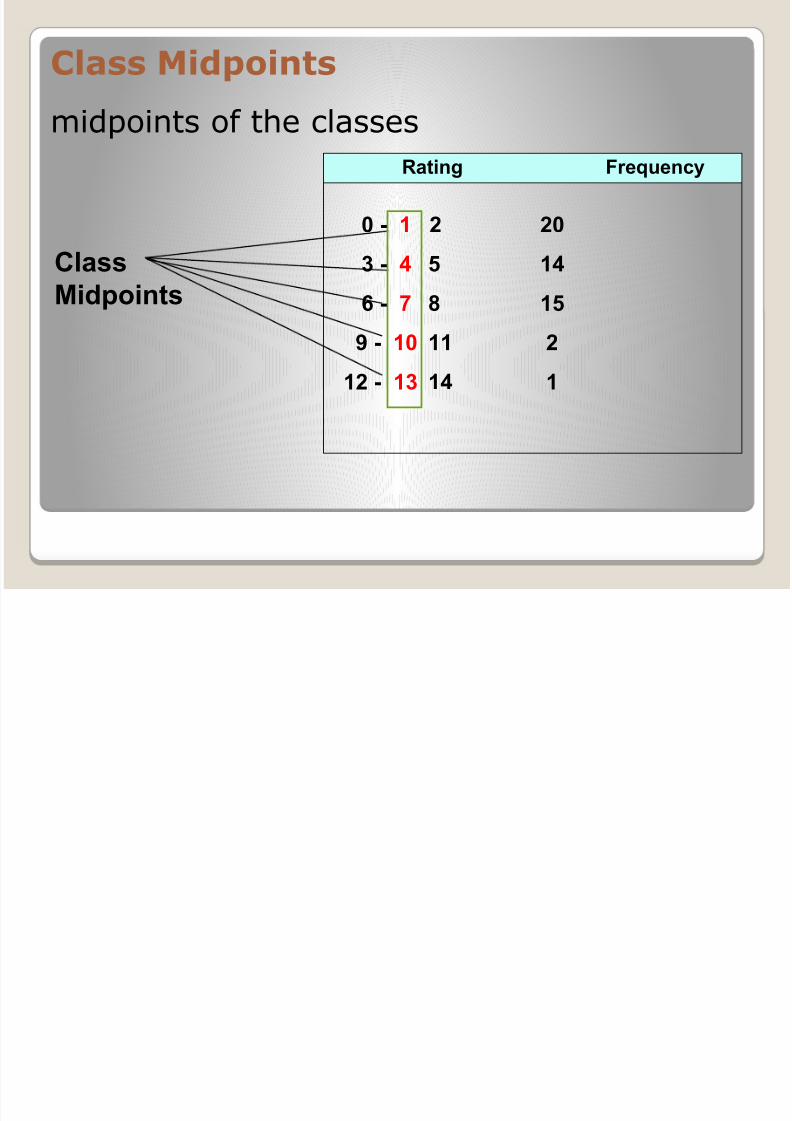
Class
&i%"oints
0 - 1 2 20
3 - 4 5 14
6 - ' 8 15
9 - 10 11 2
12 - 13 14 1
Rating Frequency
midpoints of the classes
"lass $idpoints

8/9/2019 Presentation of Data.pptx
http://slidepdf.com/reader/full/presentation-of-datapptx 24/33
0 - 2 20
3 - 5 14
6 - 8 15
9 - 11 2
12 - 14 1
Rating Frequency
is the difference bet-een t-o consecutive lo-er
class limits or t-o consecutive class boundaries
"lass %idt&

8/9/2019 Presentation of Data.pptx
http://slidepdf.com/reader/full/presentation-of-datapptx 25/33
Class
(i%t)
3 0 - 2 20
3 3 - 5 14
3 6 - 8 15
3 9 - 11 2
3 12 - 14 1
Rating Frequency
is the difference bet-een t-o consecutive lo-er
class limits or t-o consecutive class boundaries
"lass %idt&

8/9/2019 Presentation of Data.pptx
http://slidepdf.com/reader/full/presentation-of-datapptx 26/33
1. Be sure that the classes are mutuall' e#clusive.
!. 5nclude all classes, even if the fre&uenc' is ero.
$. r' to use the same -idth for all classes.
(. Select convenient numbers for class limits.
*. >se bet-een * and !9 classes.
6. he sum of the class fre&uencies must e&ual thenumber of ori)inal data values.
*ui%elines +or Frequency ,ales

8/9/2019 Presentation of Data.pptx
http://slidepdf.com/reader/full/presentation-of-datapptx 27/33
3. Select for the first lower limit either the lowest score or a convenient value slightlyless than the lowest score.
4. Add the class width to the starting point to get the second lower class limit, add the
width to the second lower limit to get the third, and so on.
5. List the lower class limits in a vertical column and enter the upper class limits.
6. Represent each score y a tally mar! in the appropriate class.
"otal tally mar!s to find the total fre#uency for each class.
Constructing . Frequency ,ale$. %ecide on the numer of classes .
&. %etermine the class width y dividing the range y the numer of classes'range ( highest score ) lowest score* and round up.
class wi%t) roun% up o+
range
nuer o+ classes
8/9/2019 Presentation of Data.pptx
http://slidepdf.com/reader/full/presentation-of-datapptx 28/33
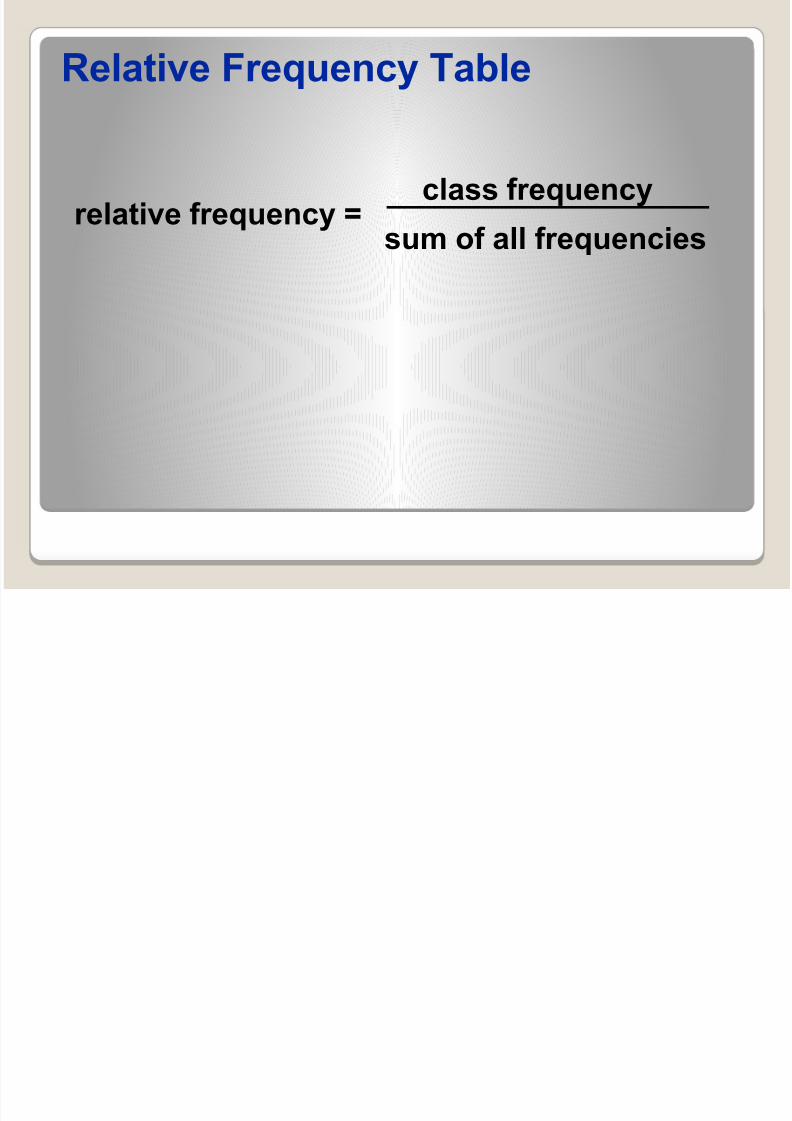
relati/e +requency class +requency
su o+ all +requencies
Relati/e Frequency ,ale

8/9/2019 Presentation of Data.pptx
http://slidepdf.com/reader/full/presentation-of-datapptx 29/33
0 - 2 20
3 - 5 14
6 - 8 15
9 - 11 2
12 - 14 1
Rating Frequency
0 - 2 38#5
3 - 5 26#9
6 - 8 28#8
9 - 11 3#8
12 - 14 1#9
RatingRelati/e
Frequency
2052 38#5
1452 26#9
etc#
Table 2-5,otal +requency 52
Relati/e Frequency ,ale

8/9/2019 Presentation of Data.pptx
http://slidepdf.com/reader/full/presentation-of-datapptx 30/33
Cuulati/e
Frequencies
0 - 2 20 20 52
3 5 14 34 32
6 8 15 49 18
9 11 2 51 3
12 14 1 52 1
Rating c+
Table 2-6
c+ Frequency
Cuulati/e Frequency ,ale

8/9/2019 Presentation of Data.pptx
http://slidepdf.com/reader/full/presentation-of-datapptx 31/33
Table 2-6Table 2-5Table 2-3
Frequency ,ales

8/9/2019 Presentation of Data.pptx
http://slidepdf.com/reader/full/presentation-of-datapptx 32/33
"omplete FDT
A complete /" has class mar8 or midpoint0#, class boundaries 0c.b, relative
fre&uenc' or percenta)e fre&uenc', and theless than cumulative fre&uenc' 0Ccf andthe )reater than cumulative fre&uenc'0Dcf.

8/9/2019 Presentation of Data.pptx
http://slidepdf.com/reader/full/presentation-of-datapptx 33/33
Table 2-6
Grouped Frequency Distribution for t&e TestScores of '( Students in Statistics
Co"lete Frequency ,ales


![[PPT]Title of presentation Title of presentation Title of …unstats.un.org/unsd/accsub/2012docs-20th/Presentation... · Web viewTitle Title of presentation Title of presentation](https://static.documents.pub/doc/80x56/5aec2a637f8b9ac3619019c7/ppttitle-of-presentation-title-of-presentation-title-of-viewtitle-title-of.jpg)


