34
UBS Commodities UBS Bloomberg CMCI Not for onward distribution August 2014
UBS Commodities UBS Bloomberg CMCI
Not for onward distribution
August 2014
1 1 1
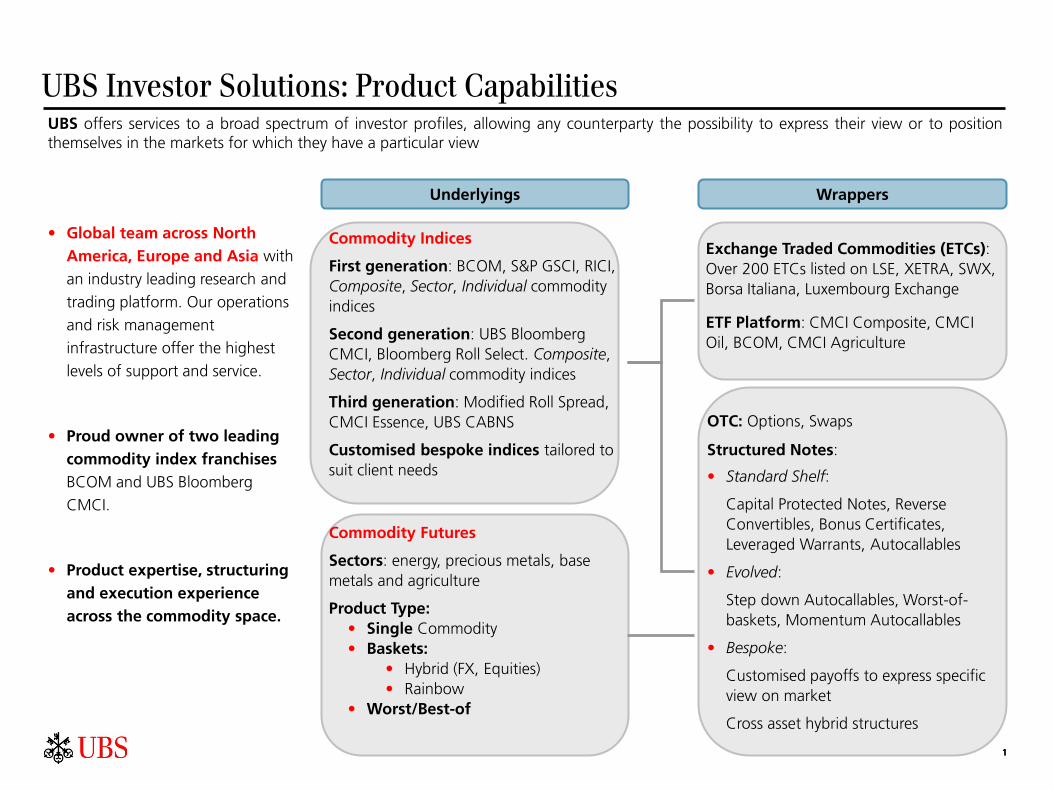
Commodity Indices
First generation: BCOM, S&P GSCI, RICI, Composite, Sector, Individual commodity indices
Second generation: UBS Bloomberg CMCI, Bloomberg Roll Select. Composite, Sector, Individual commodity indices
Third generation: Modified Roll Spread, CMCI Essence, UBS CABNS
Customised bespoke indices tailored to suit client needs
UBS Investor Solutions: Product Capabilities UBS offers services to a broad spectrum of investor profiles, allowing any counterparty the possibility to express their view or to position themselves in the markets for which they have a particular view
Commodity Futures
Sectors: energy, precious metals, base metals and agriculture
Product Type: • Single Commodity • Baskets:
• Hybrid (FX, Equities) • Rainbow
• Worst/Best-of
OTC: Options, Swaps
Structured Notes:
• Standard Shelf:
Capital Protected Notes, Reverse Convertibles, Bonus Certificates, Leveraged Warrants, Autocallables
• Evolved:
Step down Autocallables, Worst-of-baskets, Momentum Autocallables
• Bespoke:
Customised payoffs to express specific view on market
Cross asset hybrid structures
Underlyings Wrappers
• Global team across North America, Europe and Asia with
an industry leading research and
trading platform. Our operations
and risk management
infrastructure offer the highest
levels of support and service.
• Proud owner of two leading commodity index franchises BCOM and UBS Bloomberg
CMCI.
• Product expertise, structuring and execution experience across the commodity space.
Exchange Traded Commodities (ETCs): Over 200 ETCs listed on LSE, XETRA, SWX, Borsa Italiana, Luxembourg Exchange
ETF Platform: CMCI Composite, CMCI Oil, BCOM, CMCI Agriculture

Section 1
Roll Yield Concept

3
The Concept of Roll Yield Commodity investors are often limited to the use of commodities futures to gain exposure to the commodity space due to high costs of carry associated with holding a physical commodity.
+
Contango
If deferred futures prices are higher than spot futures prices, the curve is in contango and roll returns will be negative
Notes: Crude Oil curves; Source: UBS IB, Bloomberg
If deferred futures prices are below spot futures prices, the curve is in backwardation and roll returns will be positive
• One can invest in futures either by taking a long-dated futures position and holding until future contract’s maturity or by taking a position on a short-dated maturity and “rolling” the contract until the desired date in order to avoid physical delivery but still maintain exposure to the market
• Traditional commodity indices have been a popular investment vehicles that use the second approach to gain commodity exposure
Fundamentals: traditional commodity indices represent long only positions in a basket of exchange-traded commodity futures, referencing the first 2-3 nearby futures contracts
Index Rolling Mechanism: in order to avoid physical delivery yet maintain positions in the futures market, index investments require continuous replacement of the expiring front-month contract with a further-out contract (roll process)
Punctual Roll: Indices are rules-based, so the exact days of rolls are known (typically 5th to 9th business day of the month) for each index and are transparent to the market
• As a result of the above construction method, commodity index returns typically have two drivers behind them:
Roll returns: Can be either positive or negative (depending on the shape of the futures curve) and result from replacing an expiring contract with a further-out contract
Price returns: have commodity futures prices increased or decreased?
0
50
100
150
200
250
300
350
400
2001
2002
2003
2004
2005
2006
2007
2008
2009
2010
2011
2012
2013
2014
S&P GSCI Excess Return
S&P GSCI Price Index
4
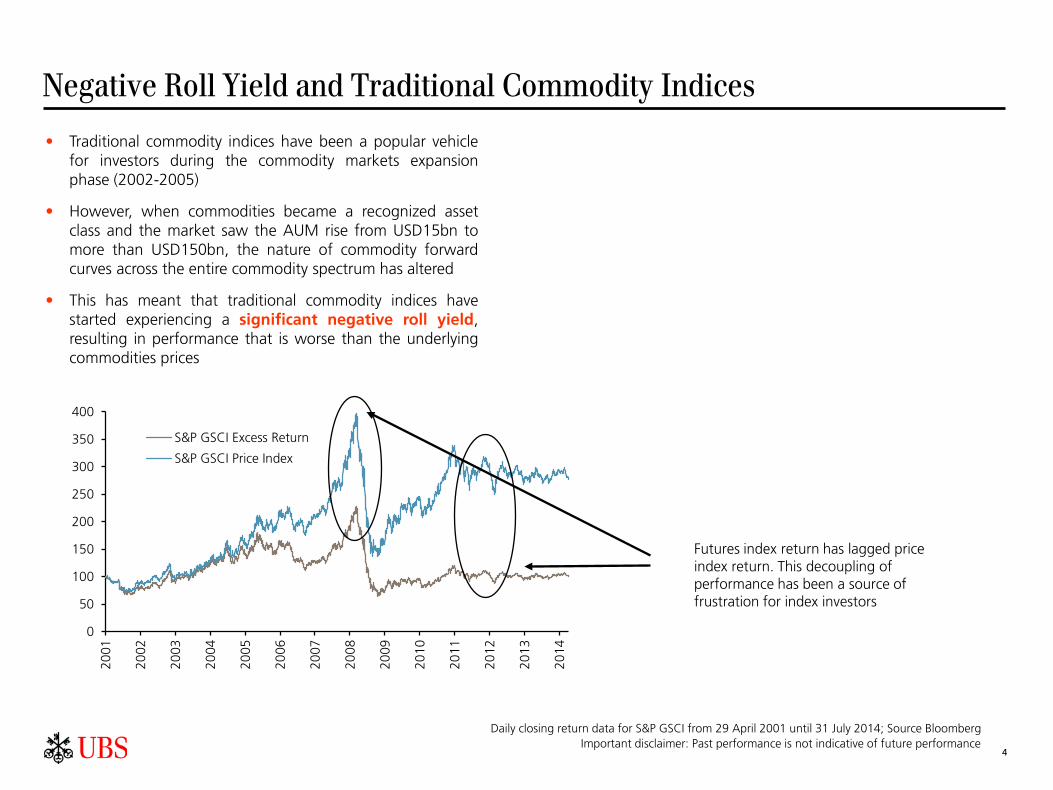
Negative Roll Yield and Traditional Commodity Indices
• Traditional commodity indices have been a popular vehicle for investors during the commodity markets expansion phase (2002-2005)
• However, when commodities became a recognized asset class and the market saw the AUM rise from USD15bn to more than USD150bn, the nature of commodity forward curves across the entire commodity spectrum has altered
• This has meant that traditional commodity indices have started experiencing a significant negative roll yield, resulting in performance that is worse than the underlying commodities prices
Daily closing return data for S&P GSCI from 29 April 2001 until 31 July 2014; Source Bloomberg Important disclaimer: Past performance is not indicative of future performance
Futures index return has lagged price index return. This decoupling of performance has been a source of frustration for index investors
5
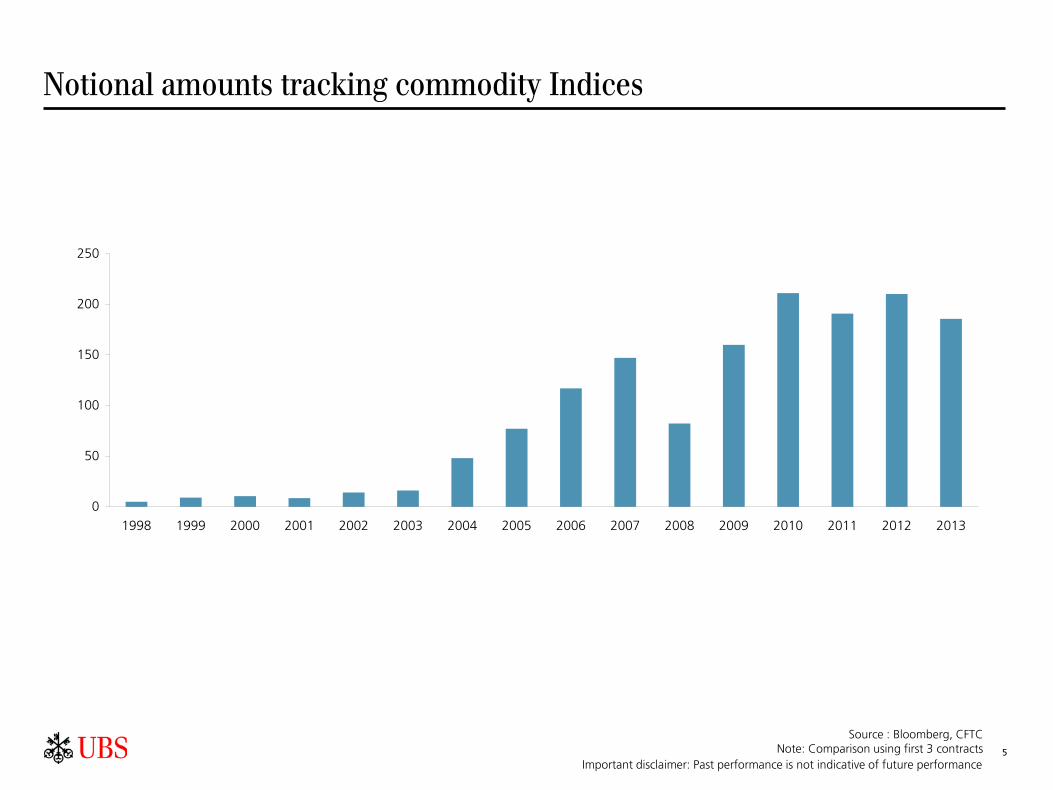
Notional amounts tracking commodity Indices
Source : Bloomberg, CFTC Note: Comparison using first 3 contracts
Important disclaimer: Past performance is not indicative of future performance
0
50
100
150
200
250
1998 1999 2000 2001 2002 2003 2004 2005 2006 2007 2008 2009 2010 2011 2012 2013

6 6
Commodity markets are liquid
Source: UBS, Bloomberg, *Daily Volumes and OI based on 5-year averages as of Jan 2013, Allocation based on CMCI Target weights for H1-2013 ² LME Data not readily available
• Commodity futures are incredibly liquid
• Using the UBS Bloomberg CMCI as an investment proxy, the table depicts the relative size of a USD 1 billion allocation to a broad based commodity index compared to the average volumes of commodity futures traded each day
• In all cases, the equivalent dollar notional allocated to each underlying commodity from a USD 1bn investment is less than 3% of average daily exchange traded volume and less than 0.6% of total open interest.
Example of a USD 1 billion investment in commodities as a percentage of daily traded volume and open interest
USD 1 billion allocation to UBS Bloomberg CMCI*
Commodity % of Avg Daily Volume % of Open Interest WTI Crude Oil 0.20% 0.08% WTI Crude Oil 0.24% 0.08% Brent Crude Oil 0.23% 0.11% Heating Oil 0.40% 0.13% Gasoil 0.34% 0.12% RBOB 0.53% 0.20% Natural Gas 0.49% 0.13%
Copper - 0.34% High Grade Copper 1.10% 0.32% Zinc - 0.35% Aluminum - 0.26% Nickel - 0.39% Lead - 0.58%
Gold 0.27% 0.08% Silver 0.35% 0.07%
Wheat 0.88% 0.16% Winter Wheat 1.52% 0.18% Corn 0.84% 0.17% Soybeans 0.73% 0.19% Soybean Meal 0.90% 0.25% Bean Oil 0.82% 0.21% Sugar 1.93% 0.29% Cocoa 2.57% 0.20% Coffee 0.99% 0.14% Cotton No. 2 1.40% 0.16%
Live Cattle 1.47% 0.20% Lean Hogs 1.92% 0.27%
Section 2
UBS Bloomberg CMCI

8
UBS Bloomberg CMCI - Summary
• Constant and stable outperformance with REAL track record
As a result of the methodology that minimises the impact of roll yield on returns, the CMCI has outperformed S&P GSCI by more than 35% since CMCI went live in January 2007 (in a backtest, the outperformance has been more than 250% since 30 November 1997) (Source: Bloomberg, UBS IB, Total Return Indices, 31 July 2014)
• Close tracking of commodity spot prices
The innovative calculation methodology of the CMCI, that involves daily rolling to comply with the Constant Maturity concept, not only ensures that the tracking error of the investment vehicle vs. actual performance of commodity markets is minimised, but also avoids the problems of having to roll large notionals over the short punctual roll period.
• Broad market coverage not only in terms of commodities but also tenors
CMCI not only covers a broad range of commodities, but also introduces a time dimension to commodity investment. Diversification not only among commodities, but also maturities for each individual commodity ranging from 3 months to 3 years allows for a high level of flexibility in making investment allocation decisions.
• Highly transparent and operationally stable
To ensure the stability of the CMCI, it is overseen by a committee (the CMCI Governance Committee, composed of UBS, Bloomberg and external members) established by the two Index Sponsors, which ensures the validation, determinations, changes to the composition and communication regarding the CMCI. The feature of a co-sponsor makes the index transparent and operationally stable.
• Highly liquid
As a result of selecting highly liquid futures contracts diversified along the forward curve, as well as the Constant Maturity methodology that involves daily rolling, CMCI avoids the potential problem of punctual roll (when high volumes are traded in announced transactions) and trades smaller volumes on a daily basis, having less impact on the market and hence not adversely affecting the performance that the index investor receives.
The UBS Bloomberg CMCI (“CMCI”) is a unique index that has been live since January 2007 and demonstrates:
Important disclaimer: Past performance is not indicative of future performance
-1.2%
-7.9%-7.3%
-10%
-5%
0%
CMCI S&P GSCI BCOM
Annualized Roll & Collateral* Performance vs. Price Return Indices
0
50
100
150
200
250
300
2004
2005
2006
2007
2008
2009
2010
2011
2012
2013
2014
CMCI S&P GSCI BCOM RICI
9
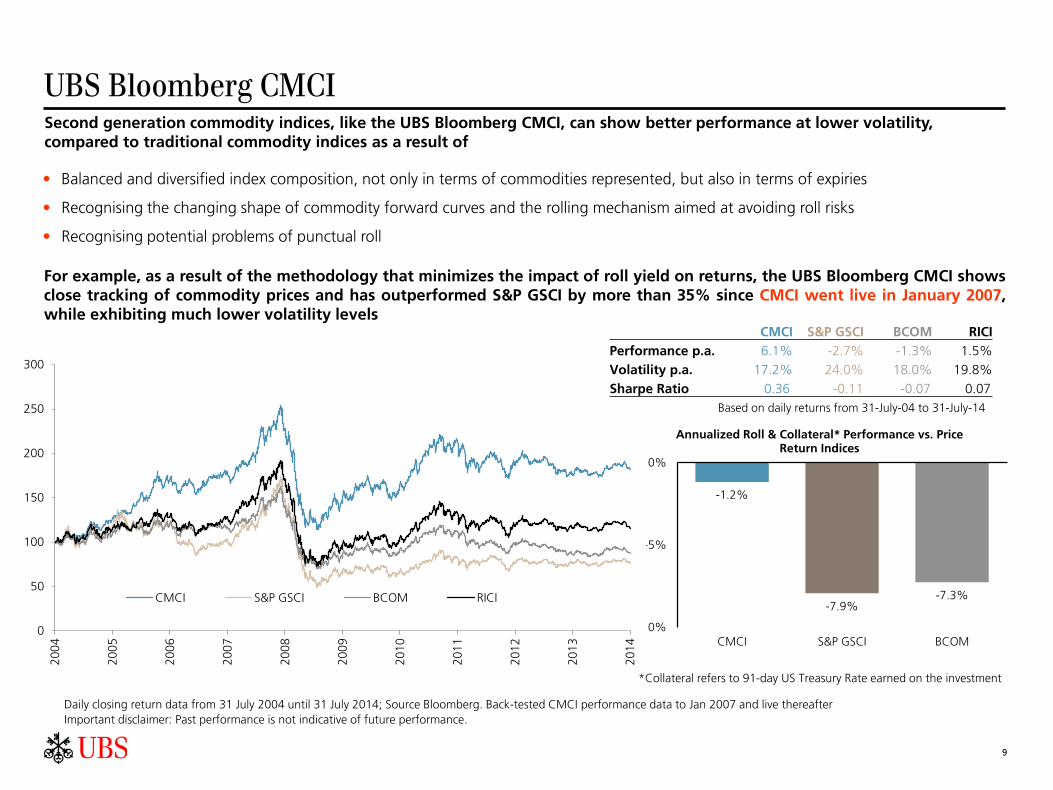
UBS Bloomberg CMCI Second generation commodity indices, like the UBS Bloomberg CMCI, can show better performance at lower volatility, compared to traditional commodity indices as a result of
• Balanced and diversified index composition, not only in terms of commodities represented, but also in terms of expiries
• Recognising the changing shape of commodity forward curves and the rolling mechanism aimed at avoiding roll risks
• Recognising potential problems of punctual roll
For example, as a result of the methodology that minimizes the impact of roll yield on returns, the UBS Bloomberg CMCI shows close tracking of commodity prices and has outperformed S&P GSCI by more than 35% since CMCI went live in January 2007, while exhibiting much lower volatility levels
Daily closing return data from 31 July 2004 until 31 July 2014; Source Bloomberg. Back-tested CMCI performance data to Jan 2007 and live thereafter Important disclaimer: Past performance is not indicative of future performance.
Based on daily returns from 31-July-04 to 31-July-14
*Collateral refers to 91-day US Treasury Rate earned on the investment
CMCI S&P GSCI BCOM RICI Performance p.a. 6.1% -2.7% -1.3% 1.5%
Volatility p.a. 17.2% 24.0% 18.0% 19.8%
Sharpe Ratio 0.36 -0.11 -0.07 0.07
-1.1%-0.3%
-2.9%
-4.6%
-0.6%
-8%
-3%
2%
CMCI DBLCI JPM CI MLCX CS CI
Annualized Roll & Collateral* Performance vs. Price Return Indices
0
50
100
150
200
250
300
2004
2005
2006
2007
2008
2009
2010
2011
2012
2013
2014
CMCI DBLCI JPM CI ML CX CS CI
10
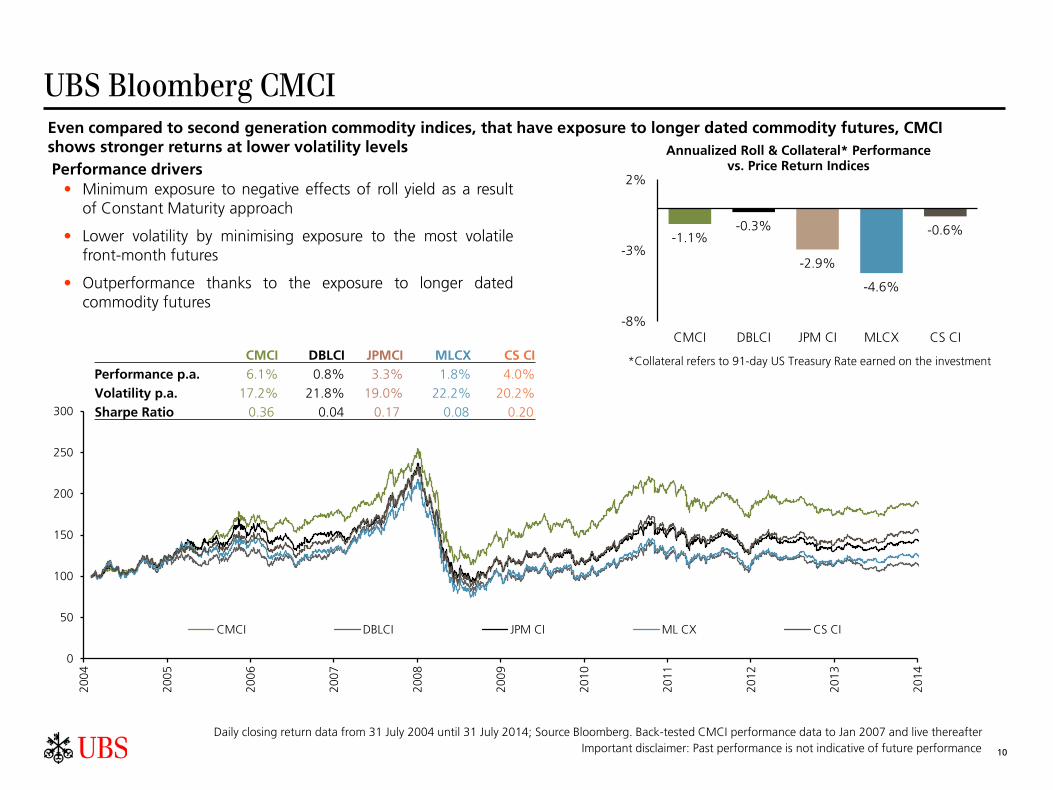
Even compared to second generation commodity indices, that have exposure to longer dated commodity futures, CMCI shows stronger returns at lower volatility levels Performance drivers • Minimum exposure to negative effects of roll yield as a result
of Constant Maturity approach
• Lower volatility by minimising exposure to the most volatile front-month futures
• Outperformance thanks to the exposure to longer dated commodity futures
Daily closing return data from 31 July 2004 until 31 July 2014; Source Bloomberg. Back-tested CMCI performance data to Jan 2007 and live thereafter Important disclaimer: Past performance is not indicative of future performance
*Collateral refers to 91-day US Treasury Rate earned on the investment
UBS Bloomberg CMCI
CMCI DBLCI JPMCI MLCX CS CI Performance p.a. 6.1% 0.8% 3.3% 1.8% 4.0%
Volatility p.a. 17.2% 21.8% 19.0% 22.2% 20.2%
Sharpe Ratio 0.36 0.04 0.17 0.08 0.20

Section 3
CMCI Methodology

12
CMCI Investment Universe
Source: UBS AG; Target Weights H2 2014 Average Tenor in the chart is reflected in months and refers to the average maturity of the CMCI Benchmark Index that includes all the available maturities from 3 months to 3 years
Each of the below bullets can be treated as a separate investable index. As such, investor has the ability to invest not only into a composite index, but also commodity sectors (i.e. agriculture) and individual commodities (i.e. crude oil)
Sector Weight Avg Tenor Commodity 3M 6M 1Y 2Y 3Y
Light Crude Oil 7.84% 20.53% 10.25 40.90% 20.66% 19.06% 12.39% 7.00%WTI Light Crude Oil 2.55% 6.69% 10.02 40.37% 22.92% 18.31% 11.56% 6.85%Brent Crude Oil 9.61% 25.18% 9.56 43.73% 21.84% 17.63% 10.17% 6.63%Heating oil 4.22% 11.05% 3.37 57.72% 27.25% 15.03%Gasoil 4.87% 12.77% 3.00 100.00%RBOB Gasoline 5.06% 13.26% 3.91 69.55% 30.45%Natural Gas 4.02% 10.52% 8.85 44.50% 23.85% 18.01% 8.23% 5.41%
LME Copper 8.85% 36.40% 10.83 37.72% 22.36% 18.95% 12.21% 8.76%High Grade Copper 3.52% 14.47% 3.79 73.54% 26.46%LME Zinc 2.25% 9.25% 5.47 53.80% 28.16% 18.05%LME Aluminium 6.11% 25.14% 13.77 33.69% 23.03% 21.82% 13.61% 7.85%LME Nickel 2.20% 9.03% 5.45 54.62% 27.19% 18.19%LME Lead 1.39% 5.70% 5.38 56.38% 25.79% 17.83%
Gold 4.35% 80.16% 6.37 61.56% 18.57% 11.32% 8.54%Silver 1.08% 19.84% 6.80 59.79% 16.87% 13.43% 9.91%
SRW Wheat 1.01% 3.62% 4.08 63.87% 36.13%Milling Wheat 0.80% 2.86% 4.29 57.14% 42.86%Hard Wheat 2.23% 7.96% 5.40 52.71% 30.85% 16.44%Corn 5.31% 19.00% 5.67 47.77% 33.87% 18.36%Soybeans 6.29% 22.51% 5.41 52.42% 31.26% 16.32%Soybean Meal 1.79% 6.39% 4.12 62.75% 37.25%Soybean Oil 1.51% 5.42% 4.11 63.00% 37.00%Sugar #11 4.63% 16.58% 6.08 41.91% 35.77% 22.32%Sugar #5 2.10% 7.51% 4.23 58.98% 41.02%Coffee “C” Arabica 1.02% 3.64% 5.12 57.15% 28.93% 13.92%Cotton 1.26% 4.52% 4.24 58.81% 41.19%
Live Cattle 2.32% 56.08% 4.11 62.92% 37.08%Lean Hogs 1.81% 43.92% 4.13 62.18% 37.82%
Agriculture 28.0% 5.18
Livestock 4.1% 4.12
Industrial Metals 24.3% 9.26
Precious Metals 5.4% 6.45
Overall Weight
Weight in Sector
Average Tenor (M)
Weights of Constant Maturities per Commodity
Energy 38.2% 7.39

13
CMCI engine designed to reflect the economic significance and market liquidity for each commodity
Economic Weights per sector
United States (US) (CPI (2/3) + PPI (1/3)) x GDP weight
European Union (EU) (CPI (2/3) + PPI (1/3)) x GDP weight
Japan (JPN) (CPI (2/3) + PPI (1/3)) x GDP weight
2/3 1/3
Liquidity Weights per sector
Sector Open Interest 50%
Sector Market Volume 50%
Step 1: Sector Weights
Consumption Weights per component
Dollar Value of Global Consumption for each Component
1/3 2/3
Liquidity Weights per component
Component Open Interest 50%
Component Market Volume 50%
Step 2: Component Weights
• Individual component weight cap (20%) and floor (0.60%) ensure diversification
• Weightings are revisited twice a year in October and April and the index re-balances on a monthly basis
CMCI Weighting Engine

S&P CMCI CMCI CMCIGSCI 3 Month 6 Month 1 Year
EnergyCrude Oil -0.6% 0.0% 0.2% 0.3%
Heating Oil -0.4% 0.0% 0.1% 0.2%
Natural Gas -2.9% -1.7% -0.9% -0.1%
Gas Oil -0.1% 0.1% 0.1% 0.2%
Brent Oil 0.0% 0.1% 0.3%
AgricultureCorn -1.0% -1.2% -0.9% -0.5%
Wheat -1.3% -0.9% -0.5% -0.4%
Soybean 0.2% 0.4% 0.4%
Cotton -0.9% -0.6% -0.4% -0.3%
Sugar -0.4% 0.0% 0.2% 0.1%
Coffee -1.3% -1.1% -1.0% -0.7%
Cocoa -0.3% -0.2% -0.2% -0.2%
MetalsAluminum -0.4% -0.3% -0.1% -0.1%
Copper 0.1% 0.2% 0.2% 0.3%
Lead -0.1% 0.1% 0.2% 0.2%
Nickel 0.1% 0.3% 0.4% 0.4%
Zinc -0.4% -0.3% -0.1% 0.0%
Precious MetalsGold -0.2% -0.2% -0.2% -0.2%
Silver -0.2% -0.2% -0.2% -0.1%
LivestockLive Cattle -0.6% -0.4% -0.2%
Lean Hogs -1.4% -0.7% 0.3%
Avg Monthly Roll Yield in %
14 Source: Bloomberg. Data from 31 July 2000 to 31 July 2014. Note; RBOB Gasoline, KC Wheat and Feeder
Cattle excluded. Back-tested CMCI performance data to Jan 2007 and live thereafter
CMCI Methodology UBS Bloomberg CMCI has been developed in order to deal with this problem of negative roll yield:
• Exposure to the whole commodity curve, which not only provides diversification, but also access to a less volatile part of the forward curve
• Index Rolling Mechanism that is based on the Constant Maturity approach, which involves daily rolling of a small proportion of underlying futures, avoids the problem of punctual roll and minimises the impact of roll yield on Index performance
Traditional Indices
Front month futures only Problem: congestion, risk to be positioned on the most volatile part of the curve, which historically exhibits more contango and less backwardation
Punctual roll Problem: high volumes, “announced“ transactions
UBS Bloomberg CMCI
Diversified along entire curve Advantage: diversified exposure, no congestion
Continuous roll Advantage: lower volumes, less influence, no “announced“ transactions
5 constant maturities: 3 months, 6 months, 1 year, 2 years and 3 years
AND: Longer dated futures are generally less volatile!
Monthly Tracking error

15
The Constant Maturity Approach
Source: UBS AG
The “constant maturity” concept is achieved by a continuous rolling process, where a weighted percentage of contracts are swapped for longer dated contracts on a daily basis. This not only gives more continuous exposure to the asset class, but also can minimise exposure to the negative effects of roll yield, making the index more representative of the underlying market price movements
Objective
• Hold a constant maturity (time to physical delivery) through time such that the index rolls smoothly through markets
Mechanics
• Hold two contracts surrounding the time of delivery in changing proportions such that average equals the desired constant maturity
• As time (a day) passes, the weights for the surrounding contracts shift in order to keep the average time constant
0 1 2 3 4 5
63
62
61
60
59
58
Constant Maturity
August Contract
0%
July Contract
100%
Months to delivery
Oil
Pric
e U
SD
0 1 2 3 4 5
63
62
61
60
59
58
Constant Maturity
August Contract
66.6%
July Contract
33.3%
Months to delivery
Oil
Pric
e U
SD
0 1 2 3 4 5
63
62
61
60
59
58
Constant Maturity
August Contract
33.3%
July Contract
66.6%
Months to delivery
Oil
Pric
e U
SD
0 1 2 3 4 5
63
62
61
60
59
58
Constant Maturity
August Contract
100%
July Contract
0%
Months to delivery
Oil
Pric
e U
SD
1st of April
20 Days Later
10 Days Later
1st of May
Section 4
CMCI Energy Index

-3.6%
-9.7%
-15%
-10%
-5%
0%
CMCI Energy TR S&P GSCI Energy TR
Annualized Roll & Collateral* Performance vs. Price Return Indices
17
CMCI Energy UBS Bloomberg CMCI Energy shows lower tracking error of realized returns when compared with movements in the underlying commodity spot prices market as a result of
• Balanced and diversified index composition, not only in terms of commodities represented, but also in terms of expiries
• Recognising the changing shape of commodity forward curves and the rolling mechanism aimed at avoiding roll risks
• Recognising potential problems of punctual roll
As a result of the methodology that minimizes the impact of roll yield on returns, the CMCI Energy shows close tracking of commodity prices and has outperformed S&P GSCI Energy by more than 20% since CMCI went live in January 2007, while exhibiting much lower volatility levels.
Daily closing return data from 31 July 2004 until 31 July 2014; Source Bloomberg. Back-tested CMCI performance data to Jan 2007 and live thereafter
Important disclaimer: Past performance is not indicative of future performance
*Collateral refers to 91-day US Treasury Rate earned on the investment
0
50
100
150
200
250
300
350
400
2004 2005 2006 2007 2008 2009 2010 2011 2012 2013 2014
S&P GSCI Energy TR
CMCI Energy TR
CMCI Energy TR S&P GSCI Energy TR
Performance p.a. 4.2% -2.7%
Volatility p.a. 24.4% 29.8%
Sharpe Ratio 0.17 -0.09
18
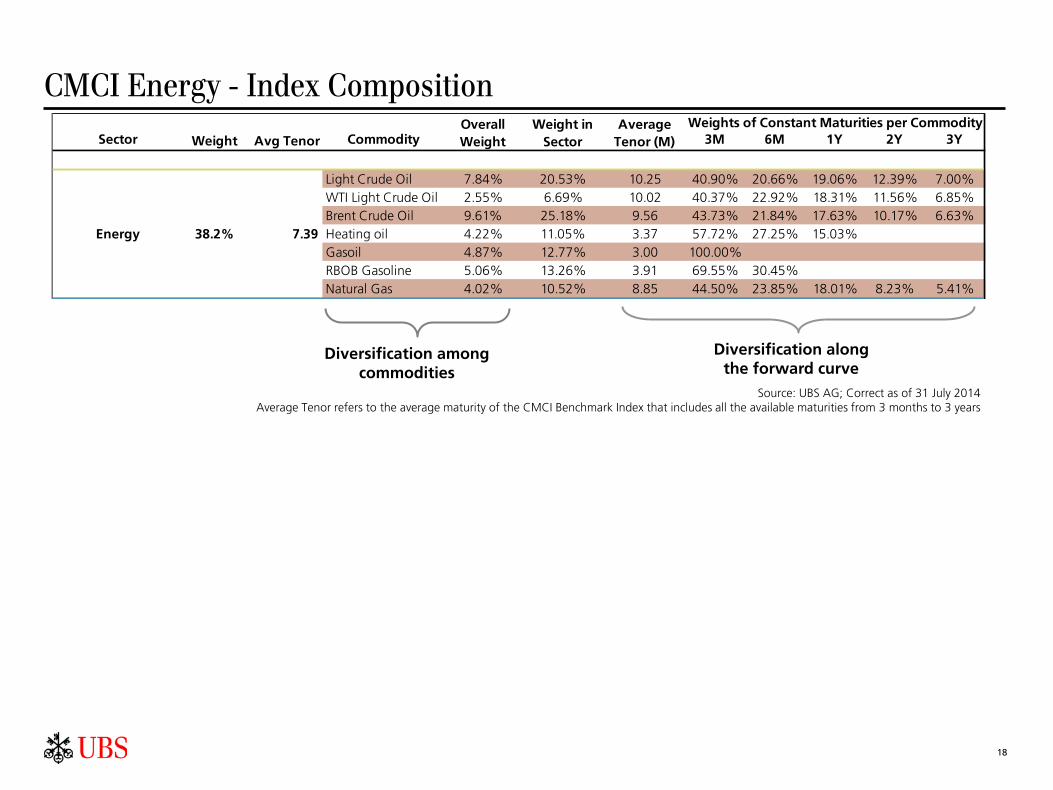
CMCI Energy - Index Composition
Source: UBS AG; Correct as of 31 July 2014 Average Tenor refers to the average maturity of the CMCI Benchmark Index that includes all the available maturities from 3 months to 3 years
Diversification among commodities
Diversification along the forward curve
Sector Weight Avg Tenor Commodity 3M 6M 1Y 2Y 3Y
Light Crude Oil 7.84% 20.53% 10.25 40.90% 20.66% 19.06% 12.39% 7.00%WTI Light Crude Oil 2.55% 6.69% 10.02 40.37% 22.92% 18.31% 11.56% 6.85%Brent Crude Oil 9.61% 25.18% 9.56 43.73% 21.84% 17.63% 10.17% 6.63%Heating oil 4.22% 11.05% 3.37 57.72% 27.25% 15.03%Gasoil 4.87% 12.77% 3.00 100.00%RBOB Gasoline 5.06% 13.26% 3.91 69.55% 30.45%Natural Gas 4.02% 10.52% 8.85 44.50% 23.85% 18.01% 8.23% 5.41%
Overall Weight
Weight in Sector
Average Tenor (M)
Weights of Constant Maturities per Commodity
Energy 38.2% 7.39
19
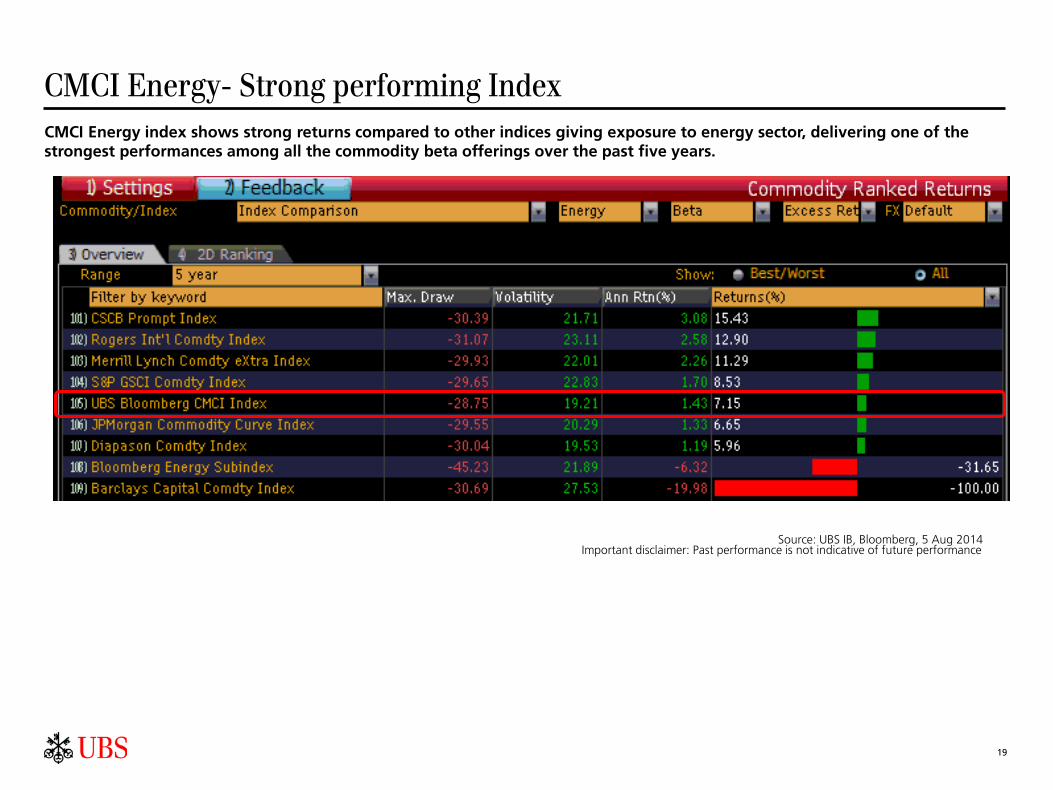
Important disclaimer: Past performance is not indicative of future performance
CMCI Energy index shows strong returns compared to other indices giving exposure to energy sector, delivering one of the strongest performances among all the commodity beta offerings over the past five years.
Source: UBS IB, Bloomberg, 5 Aug 2014
CMCI Energy- Strong performing Index

20
CMCI Crude Oil The innovative CMCI methodology, when applied to WTI crude oil investment, delivers close tracking of underlying commodity prices and has, as a result, outperformed S&P GSCI Crude Oil by more than 60% since CMCI went live in January 2007, while exhibiting much lower volatility levels
Daily closing return data from 31 July 2004 until 31 July 2014; Source Bloomberg. Back-tested CMCI performance data to Jan 2007 and live thereafter Important disclaimer: Past performance is not indicative of future performance
*Collateral refers to 91-day US Treasury Rate earned on the investment
0
50
100
150
200
250
300
350
400
450
500
2004 2005 2006 2007 2008 2009 2010 2011 2012 2013 2014
S&P GSCI WTI Crude Oil TR CMCI WTI Crude Oil TR
CMCI WTI Crude
Oil TR S&P GSCI WTI Crude Oil TR
Performance p.a. 7.1% -3.8%
Volatility p.a. 28.5% 33.7%
Sharpe Ratio 0.25 -0.11
-1.7%
-11.3%
-15%
-10%
-5%
0%
CMCI WTI Crude Oil TR S&P GSCI WTI Crude Oil TR
Annualized Roll & Collateral* Performance vs. Price Return Indices
Section 5
CMCI Industrial Metals Index

2.5%
0.6%
-5%
0%
5%
CMCI Industrial Metals TR S&P GSCI Industrial Metals TR
Annualized Roll & Collateral Performance vs. Price Return Indices
22
CMCI Industrial Metals UBS Bloomberg CMCI Industrial Metals shows lower tracking error of realized returns when compared with movements in the underlying commodity spot prices market as a result of
• Balanced and diversified index composition, not only in terms of commodities represented, but also in terms of expiries
• Recognising the changing shape of commodity forward curves and the rolling mechanism aimed at avoiding roll risks
• Recognising potential problems of punctual roll
As a result of the methodology that minimizes the impact of roll yield on returns, the CMCI Industrial Metals shows close tracking of commodity prices and has outperformed S&P GSCI Industrial Metals by more than 20% since CMCI went live in January 2007, while exhibiting much lower volatility levels.
Daily closing return data from 31 July 2004 until 31 July 2014; Source Bloomberg. Back-tested CMCI performance data to Jan 2007 and live thereafter Important disclaimer: Past performance is not indicative of future performance
*Collateral refers to 91-day US Treasury Rate earned on the investment
0
100
200
300
400
500
600
2004 2005 2006 2007 2008 2009 2010 2011 2012 2013 2014
S&P GSCI Industrial Metals TR
CMCI Industrial Metals TR
CMCI Industrial Metals TR
S&P GSCI Industrial Metals TR
Performance p.a. 10.5% 6.4%
Volatility p.a. 24.8% 26.3%
Sharpe Ratio 0.42 0.24
23
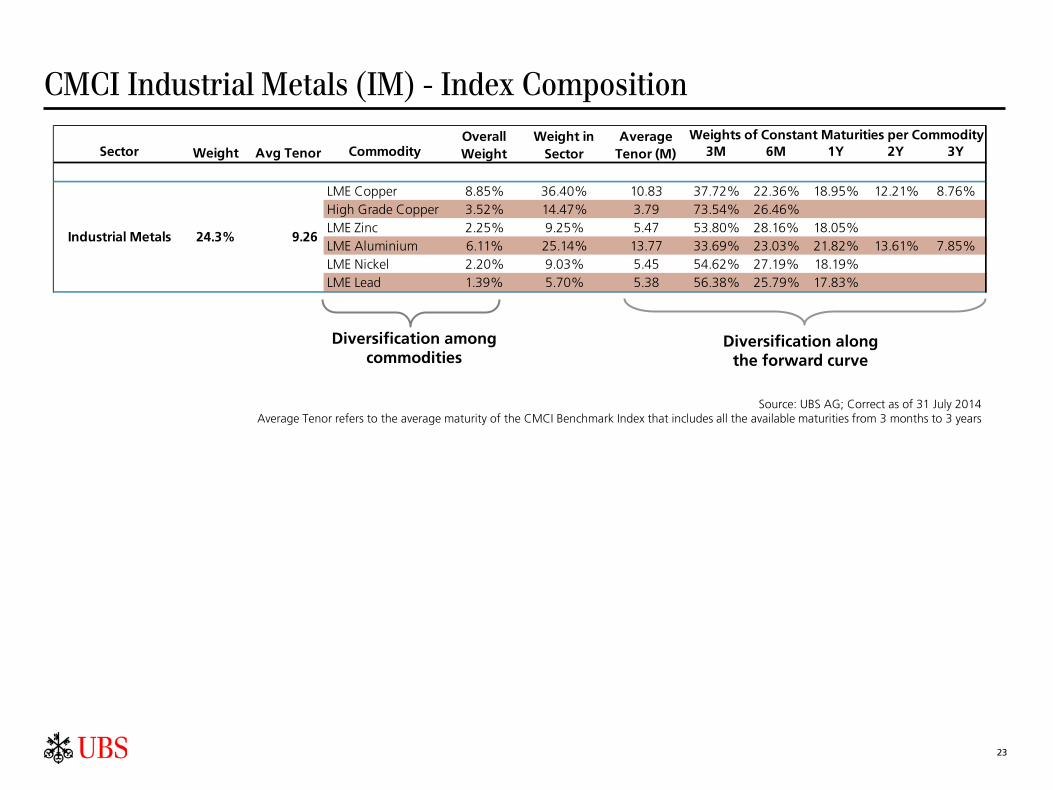
CMCI Industrial Metals (IM) - Index Composition
Source: UBS AG; Correct as of 31 July 2014 Average Tenor refers to the average maturity of the CMCI Benchmark Index that includes all the available maturities from 3 months to 3 years
Diversification among commodities
Diversification along the forward curve
Sector Weight Avg Tenor Commodity 3M 6M 1Y 2Y 3Y
LME Copper 8.85% 36.40% 10.83 37.72% 22.36% 18.95% 12.21% 8.76%High Grade Copper 3.52% 14.47% 3.79 73.54% 26.46%LME Zinc 2.25% 9.25% 5.47 53.80% 28.16% 18.05%LME Aluminium 6.11% 25.14% 13.77 33.69% 23.03% 21.82% 13.61% 7.85%LME Nickel 2.20% 9.03% 5.45 54.62% 27.19% 18.19%LME Lead 1.39% 5.70% 5.38 56.38% 25.79% 17.83%
Industrial Metals 24.3% 9.26
Overall Weight
Weight in Sector
Average Tenor (M)
Weights of Constant Maturities per Commodity

24
CMCI Industrial Metals index shows strong returns compared to other industrial metals indices, delivering the strongest performances among all the commodity beta offerings over the past 5 years.
Important disclaimer: Past performance is not indicative of future performance Source: UBS IB, Bloomberg, 5 Aug 2014
CMCI-IM Top Performing Index
Section 6
CMCI Agriculture Index
-1.1%
-6.1%
-10%
-5%
0%
CMCI Agriculture TR S&P GSCI Agriculture TR
Annualized Roll & Collateral Performance vs. Price Return Indices
26
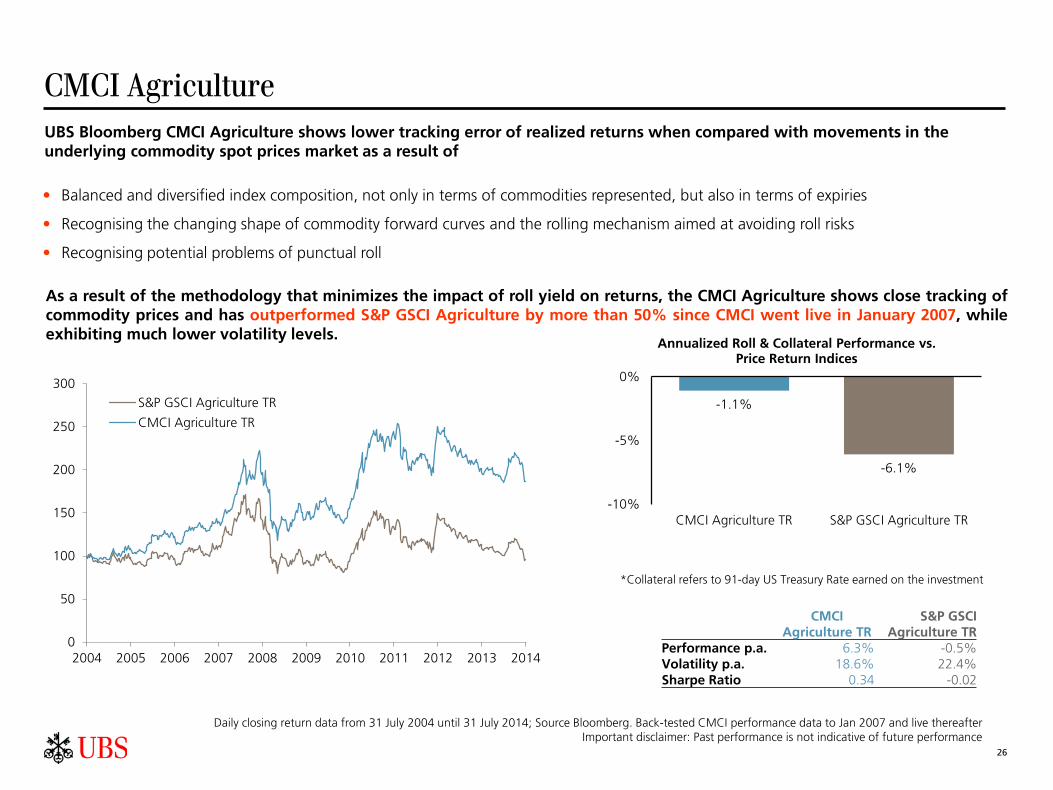
CMCI Agriculture UBS Bloomberg CMCI Agriculture shows lower tracking error of realized returns when compared with movements in the underlying commodity spot prices market as a result of
• Balanced and diversified index composition, not only in terms of commodities represented, but also in terms of expiries
• Recognising the changing shape of commodity forward curves and the rolling mechanism aimed at avoiding roll risks
• Recognising potential problems of punctual roll
As a result of the methodology that minimizes the impact of roll yield on returns, the CMCI Agriculture shows close tracking of commodity prices and has outperformed S&P GSCI Agriculture by more than 50% since CMCI went live in January 2007, while exhibiting much lower volatility levels.
Daily closing return data from 31 July 2004 until 31 July 2014; Source Bloomberg. Back-tested CMCI performance data to Jan 2007 and live thereafter
Important disclaimer: Past performance is not indicative of future performance
*Collateral refers to 91-day US Treasury Rate earned on the investment
0
50
100
150
200
250
300
2004 2005 2006 2007 2008 2009 2010 2011 2012 2013 2014
S&P GSCI Agriculture TR
CMCI Agriculture TR
CMCI
Agriculture TR S&P GSCI
Agriculture TR Performance p.a. 6.3% -0.5% Volatility p.a. 18.6% 22.4% Sharpe Ratio 0.34 -0.02
27
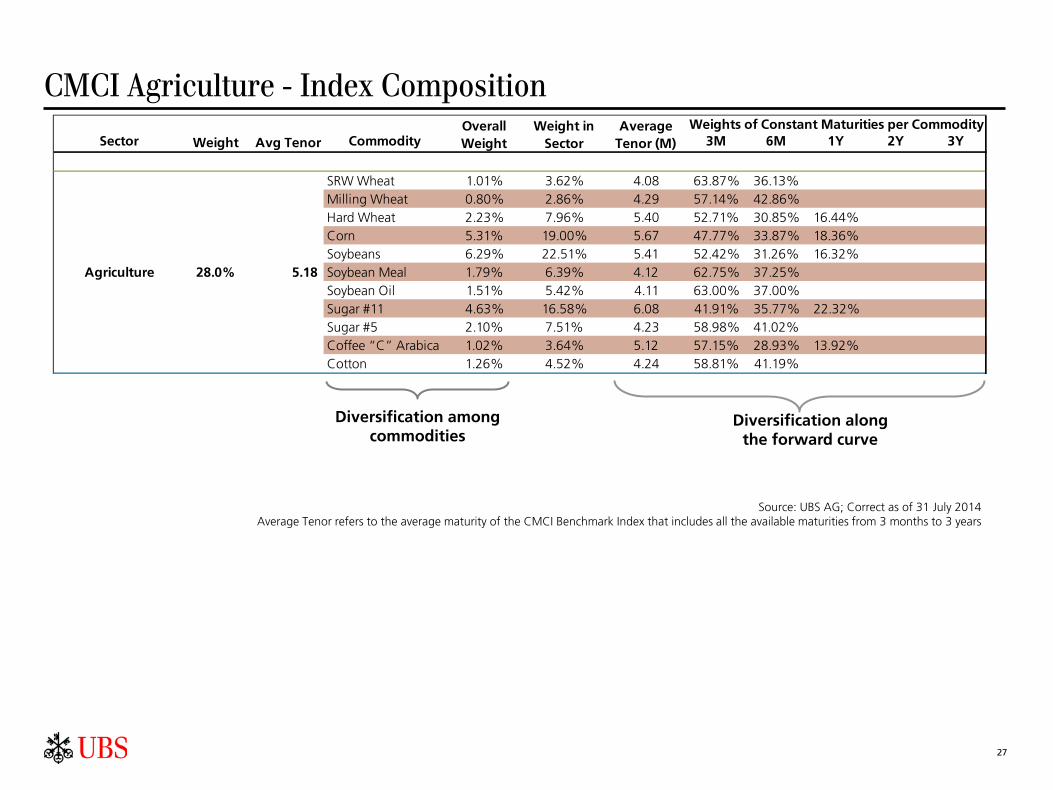
CMCI Agriculture - Index Composition
Source: UBS AG; Correct as of 31 July 2014 Average Tenor refers to the average maturity of the CMCI Benchmark Index that includes all the available maturities from 3 months to 3 years
Diversification among commodities
Diversification along the forward curve
Sector Weight Avg Tenor Commodity 3M 6M 1Y 2Y 3Y
SRW Wheat 1.01% 3.62% 4.08 63.87% 36.13%Milling Wheat 0.80% 2.86% 4.29 57.14% 42.86%Hard Wheat 2.23% 7.96% 5.40 52.71% 30.85% 16.44%Corn 5.31% 19.00% 5.67 47.77% 33.87% 18.36%Soybeans 6.29% 22.51% 5.41 52.42% 31.26% 16.32%Soybean Meal 1.79% 6.39% 4.12 62.75% 37.25%Soybean Oil 1.51% 5.42% 4.11 63.00% 37.00%Sugar #11 4.63% 16.58% 6.08 41.91% 35.77% 22.32%Sugar #5 2.10% 7.51% 4.23 58.98% 41.02%Coffee “C” Arabica 1.02% 3.64% 5.12 57.15% 28.93% 13.92%Cotton 1.26% 4.52% 4.24 58.81% 41.19%
Agriculture 28.0% 5.18
Overall Weight
Weight in Sector
Average Tenor (M)
Weights of Constant Maturities per Commodity
28
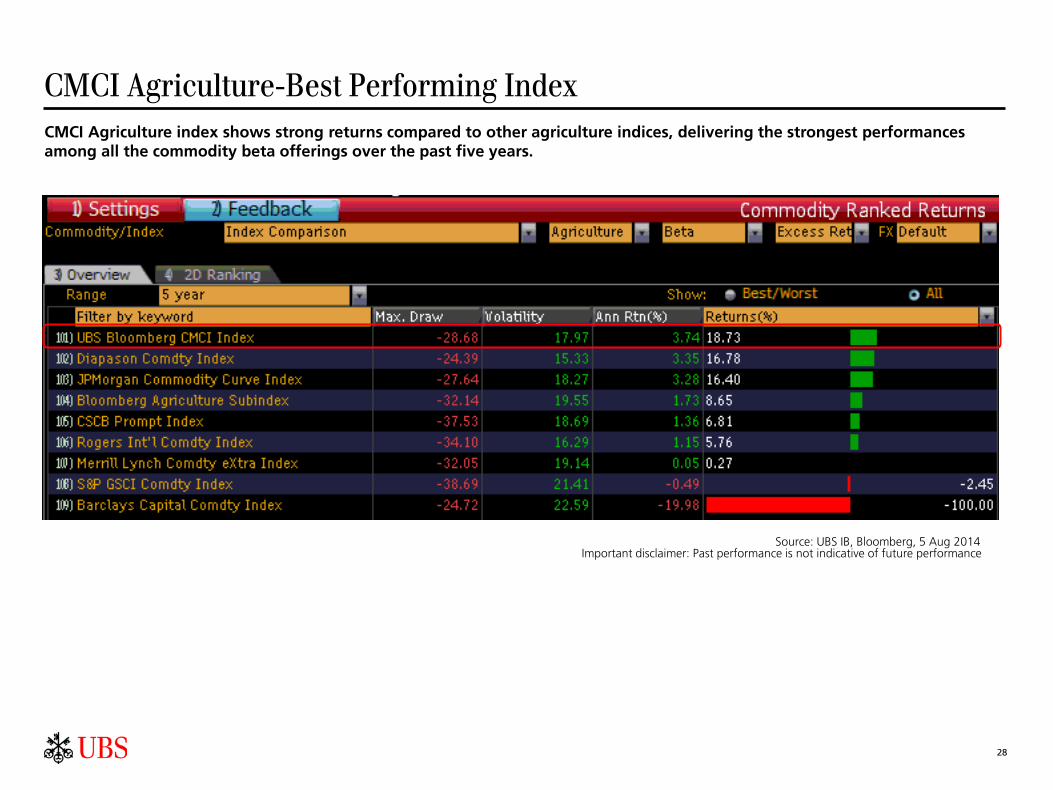
CMCI Agriculture index shows strong returns compared to other agriculture indices, delivering the strongest performances among all the commodity beta offerings over the past five years.
Important disclaimer: Past performance is not indicative of future performance Source: UBS IB, Bloomberg, 5 Aug 2014
CMCI Agriculture-Best Performing Index

Appendix
Other Information
30
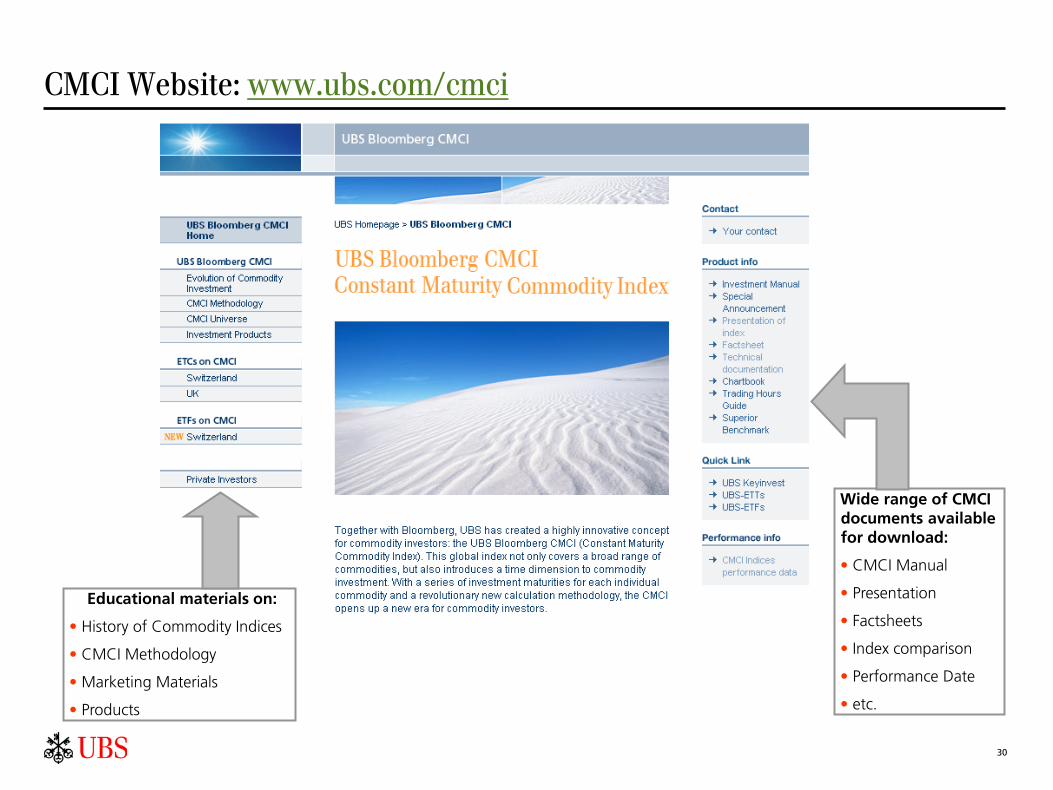
Wide range of CMCI documents available for download:
• CMCI Manual
• Presentation
• Factsheets
• Index comparison
• Performance Date
• etc.
Educational materials on:
• History of Commodity Indices
• CMCI Methodology
• Marketing Materials
• Products
CMCI Website: www.ubs.com/cmci

• Edmund Carroll, Managing Director, Global Head of Commodities
o 10 years of experience in the commodities space at UBS, most recently as head of the UBS Bloomberg CMCI index business. Ed has a strong trading background from his time overseeing the options and derivatives side of the commodity index space. Ed also has key experience developing retail and institutional businesses at UBS, which includes the acquisition of the Bloomberg commodity indexSM
E-mail: [email protected]
31
UBS Global Commodities Contact Information
Trading Ashish Gupta +44 207 567 7658 Richard Crampton +44 207 567 6476 Rob Thomson +44 207 567 3813 Pierre Sirand +44 207 567 1860 Vlad Stoyanov
Europe & Asia US
Marketing Virat Agarwal +44 207 567 7983 Liting Yung +44 207 568 8320 Abhinava Garg +852 29718750 Yaobo Gu
Trading Edmund Carroll +1 203-719-2836 Ted Kuo +1 203-719-7699
Marketing John Kowalik +1 203 719-2516 Aubrie Fine +1 203 719-2119
Group Email: [email protected]

32
Disclaimer Issued by UBS AG and/or affiliates to institutional investors; it is not for private persons. The securities described herein may not be eligible for sale in all jurisdictions or to certain categories of investors. This material has been prepared by sales or trading personnel and it is not a product of the UBS Research Department. It is for distribution only under such circumstances as may be permitted by applicable law. This material is proprietary commentary produced in conjunction with the UBS trading desks that trade as principal in instruments mentioned within. This commentary is therefore not independent from the proprietary interests of UBS or connected parties which may conflict with your interests. UBS may have accumulated a long or short position in the subject security, or derivative securities thereof, on the basis of this material prior to its dissemination. This material constitutes an invitation to consider entering into a derivatives transaction under U.S. CFTC Regulations §§ 1.71 and 23.605, where applicable, but is not a binding offer to buy/sell any financial instrument. UBS may trade as principal or otherwise act or have acted as market-maker in the securities or other financial instruments discussed in this material. Securities referred to may be highly illiquid which may adversely impact the price and speed of execution of orders in those securities. Furthermore, UBS may have or have had a relationship with or may provide or has provided investment banking, capital markets and/or other financial services to the relevant companies. Neither UBS nor any of its affiliates, nor any of UBS’ or any of its affiliates, directors, employees or agents accepts any liability for any loss or damage arising out of the use of all or any part of this material. UBS has policies designed to manage conflicts of interest. UBS relies on information barriers to control the flow of information contained in one or more areas within UBS, into other areas, units, groups or affiliates of UBS. Additional information may be made available upon request. Opinions expressed may differ from the opinions expressed by other divisions of UBS, including those of the Research Department. For access to UBS Research, including important disclosures, go to the ResearchWeb at www.ubs.com. This material has no regard to the specific investment objectives, financial situation or particular needs of any specific recipient. UBS does not undertake any obligation to update this material. This material is prepared from information believed to be reliable, but UBS makes no representations as to its accuracy or completeness or reliability of the information contained herein, nor is it intended to be a complete statement or summary of the securities, markets or developments referred to in the materials. It should not be regarded by recipients as a substitute for the exercise of their own judgment. Any prices or quotations contained herein are indicative only and not for valuation purposes. This material has been prepared for informational purposes only and is not an offer to buy or sell or a solicitation of an offer to buy or sell any security or instrument or to participate in any particular trading strategy. This material is not an official confirmation of terms. Prior to entering into a transaction you should consult with your own legal, regulatory, tax, financial and accounting advisers to the extent you deem necessary to make your own investment, hedging and trading decisions. Communications may be monitored. Statement of Risk: Options, structured derivative products and futures are not suitable for all investors, and trading in these instruments is considered risky and may be appropriate only for sophisticated investors. Mortgage and asset-backed securities may involve a high degree of risk and may be highly volatile in response to fluctuations in interest rates and other market conditions. Past performance is not necessarily indicative of future results. Various theoretical explanations of the risks associated with these instruments have been published. Prior to buying or selling an option, and for the complete risks relating to options, U.S. investors must receive a copy of 'The Characteristics and Risks of Standardized Options.' You may read the document at http://www.theocc.com/publications/risks/riskchap1.jsp or ask your salesperson for a copy. United Kingdom and rest of Europe: Except as otherwise specified herein, this material is communicated by UBS Limited, a subsidiary of UBS AG, to persons who are eligible counterparties or professional clients (as detailed in the FCA Rules) and is only available to such persons. The information contained herein does not apply to, and should not be relied upon by retail clients. UBS Limited is authorised by the Prudential Regulation Authority and regulated by the Financial Conduct Authority and the Prudential Regulation Authority. Turkey: Prepared by UBS Menkul Degerler AS on behalf of and distributed by UBS Limited. Russia: Prepared and distributed by UBS Securities CJSC. South Africa: UBS South Africa (Pty) Limited (Registration No. 1995/011140/07) is a member of the JSE Limited, the South African Futures Exchange and the Bond Exchange of South Africa. UBS South Africa (Pty) Limited is an authorised Financial Services Provider. Details of its postal and physical address and a list of its directors are available on request or may be accessed at http:www.ubs.co.za. Switzerland: This material is distributed in Switzerland by UBS AG to institutional investors only. United States: In the U.S., securities underwriting, trading and brokerage activities and M&A advisory activities are conducted by UBS Securities LLC, a wholly owned subsidiary of UBS AG that is a registered broker-dealer and a member of the New York Stock Exchange and other principal exchanges and SIPC. Canada: This material is distributed by UBS Securities Canada Inc., a subsidiary of UBS AG and a member of the principal Canadian stock exchanges & CIPF. Japan: This material is distributed in Japan by UBS Securities Japan Ltd, a registered securities company, or by UBS AG, Tokyo Branch, a licensed bank. For further details of our local services, please call your regular contact at UBS in Japan. Hong Kong: This material is distributed in Hong Kong by UBS Securities Asia Limited or by UBS AG, Hong Kong Branch. Singapore: This material is distributed in Singapore by UBS Securities Pte. Ltd or UBS AG, Singapore Branch. Asian jurisdictions (excluding HK, Singapore & Japan): This material is not to be construed as a solicitation or an offer to buy or sell any securities, related financial instruments or services. Please also note that the products have not be intended for marketing to the public. Australia: These materials are distributed in Australia by UBS AG (Holder of Australian Financial Services Licence No. 231087) and UBS Securities Australia Ltd (Holder of Australian Financial services Licence No. 231098) to persons who satisfy the definition of wholesale client for the purposes of the Corporations Act 2001 (Cth) and not intended for distribution to any retail clients. UBS AG, Australia Branch is an authorised foreign Authorised Deposit-taking Institution under the Banking Act 1959 (Cth), and is supervised by the Australian Prudential Regulation Authority. However, it is important for you to note that any products or transactions described herein are not deposit products and will not be covered by the depositor protection provisions set out in Division 2 of the Banking Act 1959 (Cth), as these provisions do not apply to foreign Authorised Deposit-Taking Institutions. New Zealand: This material is distributed in New Zealand by UBS New Zealand Ltd. An investment adviser and investment broker disclosure statement is available on request and free of charge by writing to PO Box 45, Auckland, NZ. Israel: UBS AG and its affiliates incorporated outside Israel are not licensed under the Investment Advice Law and are therefore operating under the Sophisticated Investor exemption. Whilst UBS AG holds insurance for its activities, it does not hold the same insurance that would be required for an investment advisor or investment marketer under the relevant Investment Advice Law Regulations. Dubai: UBS AG Dubai Branch is regulated by the DFSA. This material is intended for Professional Clients only. Any securities mentioned herein that have not been registered under the Securities Act of 1933 may not be offered or sold in the United States except pursuant to an exception from the registration requirements of the Securities Act and applicable state securities laws and in such circumstances as may be permitted by applicable law. UBS specifically prohibits the redistribution or reproduction of this material in whole or in part without the written permission of UBS and UBS accepts no liability whatsoever for the actions of third parties in this respect. © UBS 2014. All rights reserved. UBS Bloomberg Constant Maturity Commodity Index The Index Sponsors make no representation or warranty, express or implied, regarding the appropriateness of investing in products referenced to the CMCI, or any Index or derivative index thereof, commodity products in general or of the ability of the CMCI or any other sub-index to track commodity market performance. In determining the constituents of the CMCI and any amendment thereto, the Index Sponsors have no obligation to consider the needs of any counterparties that have products referenced to the CMCI. The Index Sponsors have all proprietary rights with respect to the CMCI. Any third party product based on or in relation to the CMCI (“Product”) may only be issued upon the prior written approval of UBS and upon the execution of a license agreement between UBS and the party intending to launch a Product. In no way does UBS, endorse or have any other involvement in the issue and offering of a Product. UBS makes no representation or warranty, express or implied, to the holders of the Products or any member of the public regarding the advisability of investing in the Product or commodities generally or in futures particularly, or as to results to be obtained from the use of the Index or from the Product. Past performance of the CMCI is not necessarily indicative of future results. The Index is © UBS 2014. The key symbol and UBS are among the registered and unregistered trademarks of UBS. Bloomberg is a trademark of Bloomberg L.P. UBS Bloomberg Constant Maturity Commodity Index, UBS Bloomberg CMCI and CMCI are service marks of UBS and/or Bloomberg. Patent pending in respect of the Index and all rights reserved in respect of the Index. THE INDEX SPONSORS DO NOT GUARANTEE THE QUALITY, ACCURACY AND/OR THE COMPLETENESS OF THE CMCI OR ANY DATA INCLUDED THEREIN AND SHALL NOT HAVE ANY LIABILITY FOR ANY ERRORS OR OMISSION OR INTERRUPTIONS IN THE CALCULATION AND/OR DISSEMINATION OF THE CMCI. THE INDEX SPONSORS MAKE NO WARRANTY, EXPRESS OR IMPLIED, AS TO RESULTS TO BE OBTAINED BY OR FROM THE USE OF THE CMCI OR ANY DATA INCLUDED THEREIN OR FOR ANY OTHER USE (WHETHER DIRECTLY OR VIA ANY PRODUCT REFERENCED THERETO). UBS MAKES NO EXPRESS OR IMPLIED WARRANTIES, AND TO THE EXTENT PERMITTED BY LAW HEREBY EXPRESSLY DISCLAIMS ALL WARRANTIES OF MERCHANTABILITY OR FITNESS FOR A PARTICULAR PURPOSE OR USE WITH RESPECT TO THE CMCI OR ANY DATA INCLUDED THEREIN. WITHOUT LIMITING ANY OF THE FOREGOING, TO THE EXTENT PERMITTED BY LAW UBS DISCLAIMS ANY LIABILITY FOR ANY PUNITIVE, INDIRECT, SPECIAL, OR CONSEQUENTIAL DAMAGES (INCLUDING LOST PROFITS), EVEN IF NOTIFIED OF THE POSSIBILITY OF SUCH.

33
Disclaimer S&P GSCI Commodity IndexesSM
The S&P GSCI is a product of S&P Dow Jones Indices LLC (“SPDJI”), and has been licensed for use by UBS. Standard & Poor’s® and S&P® are registered trademarks of Standard & Poor’s Financial Services LLC (“S&P”); Dow Jones® is a registered trademark of Dow Jones Trademark Holdings LLC (“Dow Jones”); These trademarks have been licensed for use by SPDJI and sublicensed for certain purposes by UBS. UBS's Product(s) are not sponsored, endorsed, sold or promoted by SPDJI, Dow Jones, S&P, their respective affiliates and none of such parties make any representation regarding the advisability of investing in such product(s) nor do they have any liability for any errors, omissions, or interruptions of the S&P GSCI.
“Bloomberg®”, “Bloomberg Commodity IndexSM” are service marks of Bloomberg Finance L.P. and its affiliates (collectively, “Bloomberg”) and have been licensed for use for certain purposes by UBS. Neither Bloomberg nor UBS Securities LLC and its affiliates (collectively, “UBS”) are affiliated with any licensee, and Bloomberg and UBS do not approve, endorse, review, or recommend any Bloomberg Commodity Index. Neither Bloomberg nor UBS guarantees the timeliness, accurateness, or completeness of any data or information relating to any Bloomberg Commodity Index.


