Uganda Workshop Report Presentation of Vital Signs’ Exploratory and Decision Support Tools and Data Presently Held by MAAIF, for Sustainable Agricultural Development Ridar Hotel, Seeta, Uganda 22 nd and 23 rd June 2015
Transcript
Uganda Workshop Report
Presentation of Vital Signs’ Exploratory and Decision Support Tools
and Data Presently Held by MAAIF, for Sustainable Agricultural
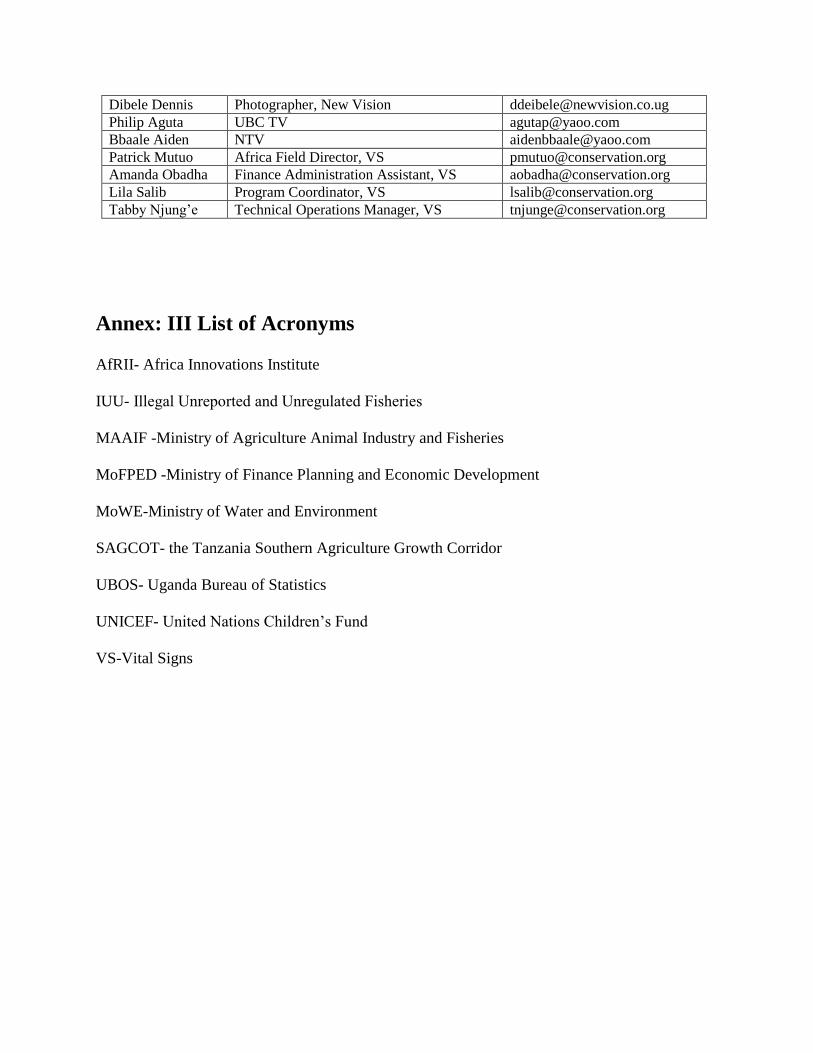
Annex II: List of Participants ...............................................................................................................1
Annex: III List of Acronyms .................................................................................................................2
Introduction Ministry and other government bodies (specifically MoWE and Uganda Bureau of Statistics
(UBOS), have assembled significant time series data on various aspects of agriculture and the
environment. Such data could supplement what is being collected by Vital Signs Uganda and
similarly, the Vital Signs data could supplement that of the Ministry. In order to catalog
available data and determine data deficits, a workshop was held on the 22nd
and 23rd
of June
2015, at the Ridar Hotel. It was officially opened by Hon. Tress Bucyanayandi, Minister for
Agriculture, Animal Industry and Fisheries, and officially closed by Hon. David Bahati, Minister
of State for Planning.
In total, thirty-two stakeholders attended the workshop including government officials from
MAAIF and MoFPED (16), academics (2), media representatives (4), and AfRII (8) and
UNICEF (1).
Objectives
This workshop was organized jointly by the Ministry of Agriculture, Animal Industries and
Fisheries, the Africa Innovations Institute (AfRII) and Vital Signs (Uganda and Nairobi) with the
following objectives:
To present the User Interface, Atlases and Decision Support Tools developed by Vital Signs
Present how Vital Signs will facilitate availability and access to data and tools
Discuss time series data that MAAIF has assembled on agriculture and the environment and
identify the key data sets that can supplement Vital Signs data
Agree on the next steps for Vital Signs and AfrII to work with the Ministry in implementing
the Vital Signs project in Uganda and for building the capacity of the Ministry’s staff so that
they may use the data in their planning process
Introduction to Vital Signs
The introduction to Vital Signs was made by the Vital Signs (VS) Africa Field Director, Dr.
Patrick Mutuo, where he presented on the various scales for which Vital Signs collects data, the
thread for agricultural intensification, as well as the Vital Signs key support indices.
He also presented VS areas of continuing progress; for example, by partnering with AfrII, in-
country capacity is being built. He also presented on current VS work within Tanzania and
Ghana, and the plans for programmatic expansion into Kenya and Uganda. Using practical
examples, Dr. Mutuo discussed three key questions that Vital Signs can answer: What is the
value of nature to farmers? Where agriculture should be intensified? What interventions will
increase the resilience of agricultural productions to climate variability and shocks?
Vital Signs Preliminary User Interface and Data Visualizations Next, Dr. Mutuo presented the Vital Signs Dashboard by focusing on agricultural production
resilience to climate and shocks and exploring soil health using phosphorus as examples. The
participants were reminded that the visualizations being presented contained data from Tanzania
because this was the furthest progressed VS data aggregate.
Feedback and additional clarification on Vital Signs presentations:
The system is open access and there are no conditions for use. A request for password must
be made on the website, after which one is free to use and download the data as necessary.
Currently, Vital Signs’ scientific approach does not consider the existing cultural attachments
to foods, for example, in determining the most suitable area to invest in a certain crop.
Instead, Vital Signs records all crops but only takes yield samples for key crops, which are
cassava, bananas, sweet potatoes, sorghum and maize in Uganda. A ministry member argued
that it was no longer advisable to defer heavily to traditional practices, e.g. making
agricultural investment decisions where scientific data recommends otherwise. Culturally
sensitive strategies to broaden traditional preferences include getting community buy in by
incubating trial groups who will subsequently demonstrate success to others.
The data for Uganda will be available in six months at the earliest.
Vital Signs plans to acquire data sold by local agencies: In some instances, Vital Signs
purchases data from certain sources, but those data will remain freely available through the
dashboard regardless of the procurement method.
To ensure sustainability of the project, Vital Signs is pursuing a Memorandum of
Understanding (MoU) with MAAIF and is in partnership with Uganda Bureau of Statistics
(UBOS). It will also continue to pursue other partnerships as necessary.
Vital Signs currently aggregate data on consumption patterns of fish through the household
survey protocols.
It was suggested that data generated on climate resilience should be presented in a way that
can be used to plan for the next agricultural season, perhaps with prediction maps.
People may have access to information but may not know how to use it. It was suggested that
capacity building or training resource for the dashboard also be considered.
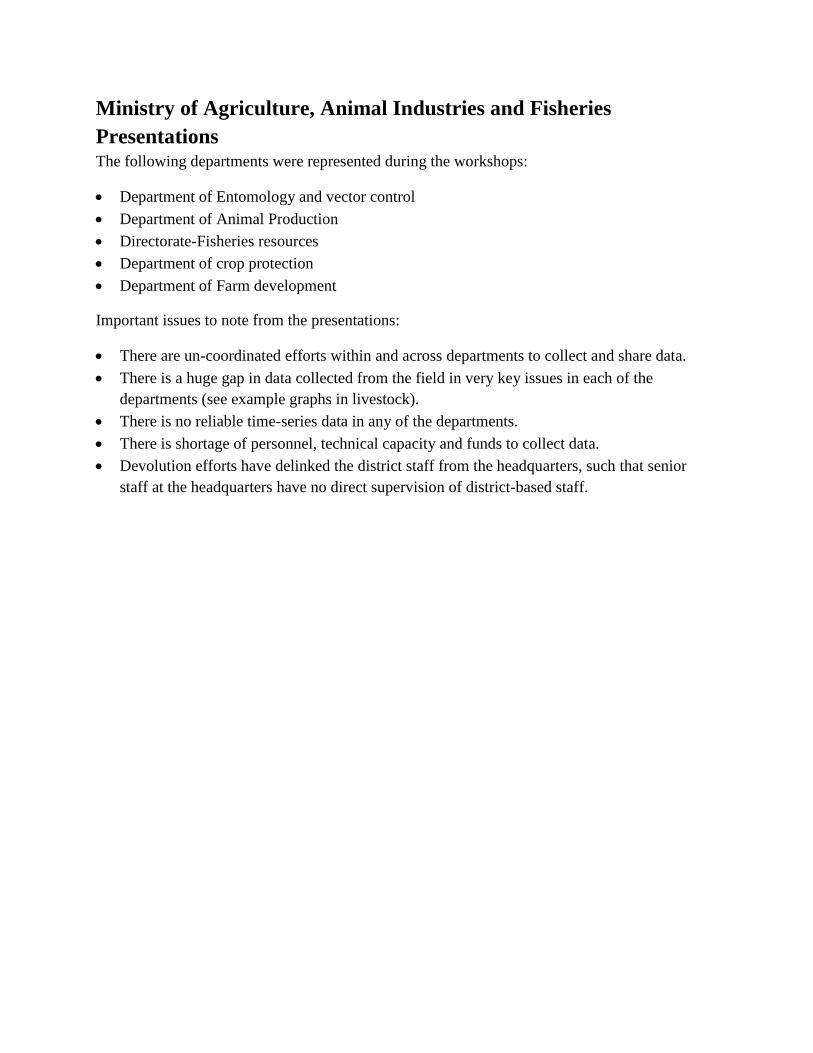
Ministry of Agriculture, Animal Industries and Fisheries
Presentations The following departments were represented during the workshops:
Department of Entomology and vector control
Department of Animal Production
Directorate-Fisheries resources
Department of crop protection
Department of Farm development
Important issues to note from the presentations:
There are un-coordinated efforts within and across departments to collect and share data.
There is a huge gap in data collected from the field in very key issues in each of the
departments (see example graphs in livestock).
There is no reliable time-series data in any of the departments.
There is shortage of personnel, technical capacity and funds to collect data.
Devolution efforts have delinked the district staff from the headquarters, such that senior
staff at the headquarters have no direct supervision of district-based staff.
Breakout Session One
Review of Vital Signs Indices and Metrics The session aimed at getting the participant feedback on the existing Vital Signs indicators and
metrices being measured. The biggest point of consensus centered on the need for fisheries to
have its own indicator.
Missing metrics Metrics already
collected by VS
Indicator Group 1 Group 2 Group 3
Fisheries
(additional
indicators
suggested to
be measured)
Source of
fish -wild or
aquaculture
Production
Mode of
feeding
Yield and
market
price
Production
(capture and
aquaculture)
Average per
capita
consumption
Type
Market access
Health Common
diseases
Access to
healthcare
Amount
spent on
healthcare
Gender
aspects
(who gets
sick or
undertakes
responsibilit
y)
Landscape
structure and
composition
Elevation
Land cover types
Slope
Water
availability Undergroun
d aquifers
(type and
use)
Water source type
(borehole, river
etc.)
Accessibility
(distance from
water source)
Water quality Heavy
metal
contaminati
on (zone of
the source)
Presence of
heavy metals
Potassium mg/l
Biochemical
oxygen demand
Eutrophication
Turbidity
Physical
measurement (e.g.
smell and taste)
Soil health Macro and
micro fauna
Soil
elements
like zinc
and
magnesium
(necessary
for rice
growth)
Microelements
Soil micro-
organisms
Soil
biodiversity
Soil texture
Soil water content
Agriculture Gender
(land
ownership)
Three major
pests per
crop
Identificatio
n of
underutilize
d but
nutritious
food
Crop
storage
practices
GMOs (type
and nature)
Crop loss
before harvest
Value addition
Pest and
diseases
Access to extension
services
Market access
Farmers input in
terms of labor (is it
hired, mechanized
or manual)
Post-harvest loss
due to pests,
diseases and other
large animals
Profitability/price
Use of improved
seeds
Crop protection
products like
pesticides and urea
Byproducts (how
are they using it)
Economic
valuation of crop
yield
Livestock
and
rangeland
Distribution of
watering points
Access to
infrastructure
such as cattle
dips
Range
conditions
(quality of
rangeland,
forage material,
invasive
species,
Inputs
(drug and
extension
work)
Livestock product
and yield
livestock
diseases and
pests
Fuel wood
efficiency
Species used in
relation to
amount of
energy
produced
Mean
annual increment
Carbon
stocks above
and below
ground
Carbon
trade
potential
(major
buyer and
cost of
carbon
trade)
Litter coverage
Climate and
climate
forcing
Interested
in scale of
time
(rather than
spatial)
Humidity
Wind speed
Biodiversity Species
diversity
(fauna)
Species diversity
(flora)
Wild food
source
availability
Herbs (kg)
Livestock
and
rangeland
Food security Food
preference
Poverty Access to
medical
facilities
Access to
school and
who pays
Clothing Access to
services (e.g.
health and
schools.)
Household income
(calculated using
the factors already
listed)
Review of Key Policies The participants discussed the following questions:
Question Crop protection Fisheries Livestock
Identify
two key
policy
issues
(questions)
of utmost
importance
Low crop
productivity
Lack of sustainable
and dependable
market (suggestion
that focus should be
on value addition)
Sustainable management
of fisheries resources
Control environmental
degradation (relate with
other Ministries and
agencies
Access to extension
services
Livestock production
Consolidate
data gaps
in order of
priority
Inadequate
information on key
pests and disease
occurrence
Information on
quality of agro-inputs
& access by farmers
Inadequate extension
services
Limited information
on market access
Impact of climate
variability on
agricultural
productivity &
sustainability
Information on
current land tenure
system & impact on
productivity
Loses incurred per
season per crop due
to poor post- harvest
handling
Identify and map fish
breeding areas
Continuous data
collection (oxygen,
temp., PH and
ammonia) to enable
proper mapping of the
identified areas
(ammonia is key as fish
survive best when their
levels are low)
Training of fish farmers
(subsistence to
commercialization)
Lack of geo referenced
data
Weed infestations at
Lake Kyoga
Absence of regional and
local fish trade data by
volume and value
Identify the hotspot
areas for IUU
Uptake on livestock
number in terms of
species, types and
breeds
Production data (from
the wild and
aquaculture)
Map the fish breeding
areas
Livestock numbers
Pests vectors and
diseases
Uptake on livestock
number in terms of
species, types and
breeds
Information on
diseases and pests
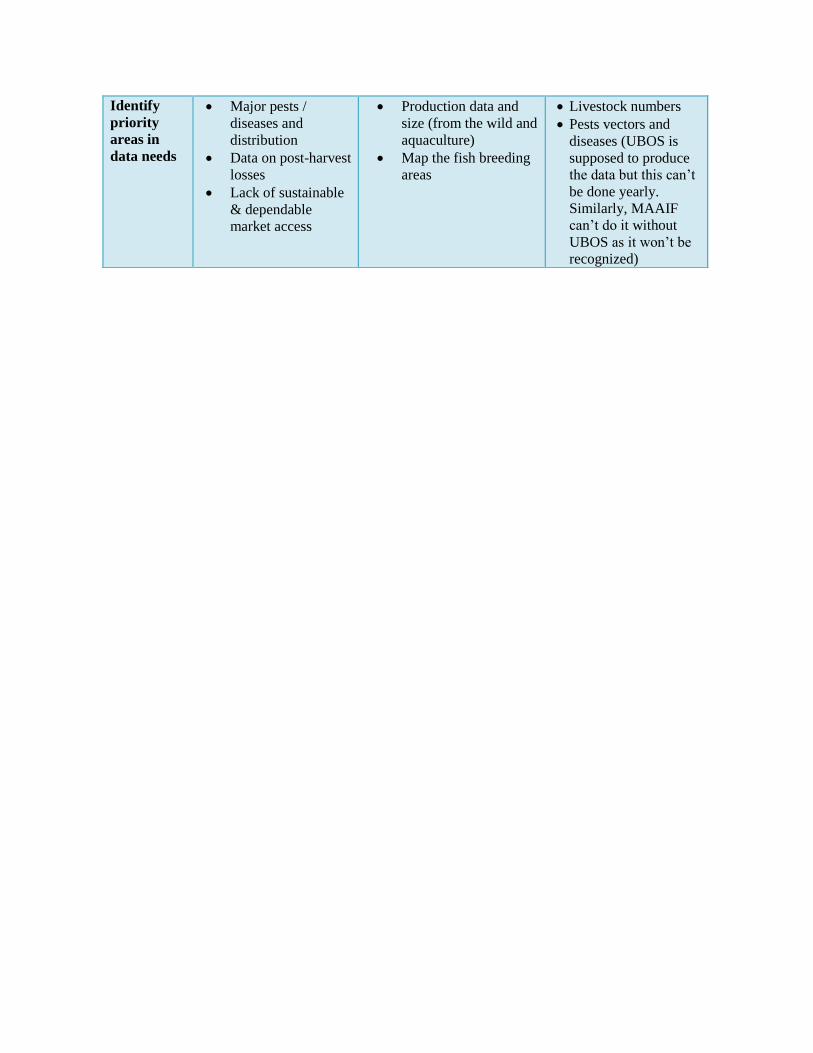
Identify
priority
areas in
data needs
Major pests /
diseases and
distribution
Data on post-harvest
losses
Lack of sustainable
& dependable
market access
Production data and
size (from the wild and
aquaculture)
Map the fish breeding
areas
Livestock numbers
Pests vectors and
diseases (UBOS is
supposed to produce
the data but this can’t
be done yearly.
Similarly, MAAIF
can’t do it without
UBOS as it won’t be
recognized)
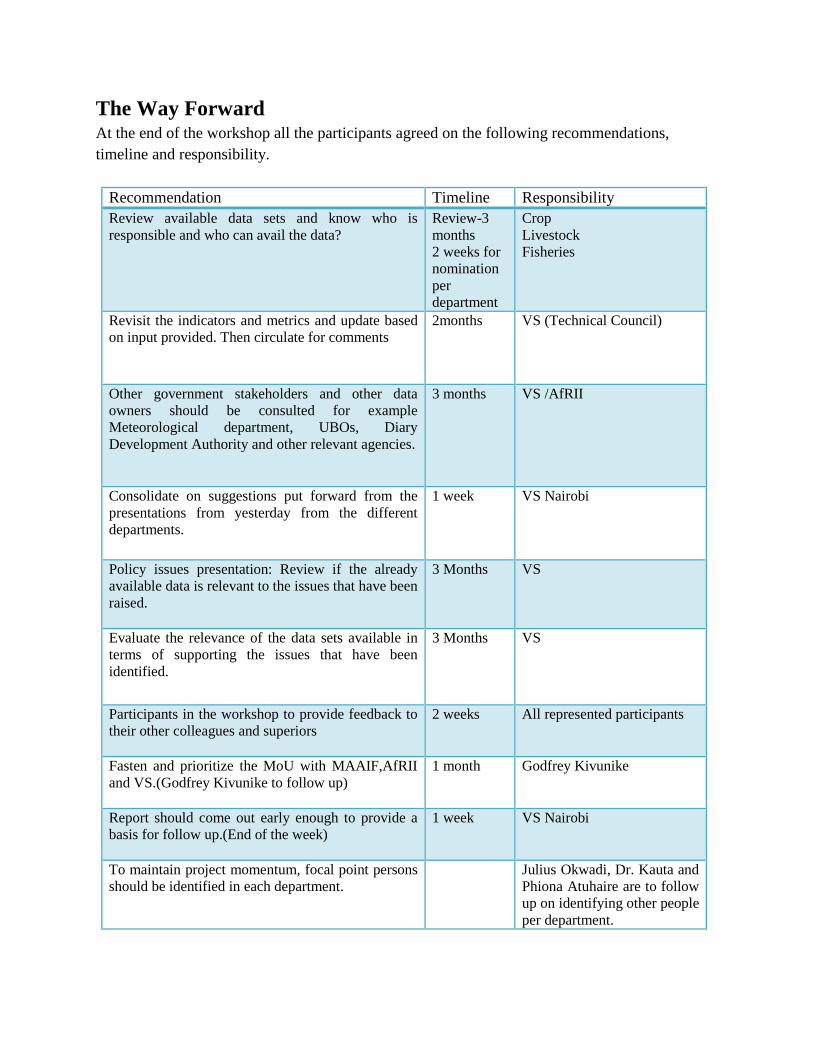
The Way Forward At the end of the workshop all the participants agreed on the following recommendations,
timeline and responsibility.
Recommendation Timeline Responsibility
Review available data sets and know who is
responsible and who can avail the data?
Review-3
months
2 weeks for
nomination
per
department
Crop
Livestock
Fisheries
Revisit the indicators and metrics and update based
on input provided. Then circulate for comments
2months VS (Technical Council)
Other government stakeholders and other data
owners should be consulted for example
Meteorological department, UBOs, Diary
Development Authority and other relevant agencies.
3 months VS /AfRII
Consolidate on suggestions put forward from the
presentations from yesterday from the different
departments.
1 week VS Nairobi
Policy issues presentation: Review if the already
available data is relevant to the issues that have been
raised.
3 Months VS
Evaluate the relevance of the data sets available in
terms of supporting the issues that have been
identified.
3 Months VS
Participants in the workshop to provide feedback to
their other colleagues and superiors
2 weeks All represented participants
Fasten and prioritize the MoU with MAAIF,AfRII
and VS.(Godfrey Kivunike to follow up)
1 month Godfrey Kivunike
Report should come out early enough to provide a
basis for follow up.(End of the week)
1 week VS Nairobi
To maintain project momentum, focal point persons
should be identified in each department.
Julius Okwadi, Dr. Kauta and
Phiona Atuhaire are to follow
up on identifying other people
per department.
Annex I: Publications “New Study of Uganda Soils Begins”