48
Idemitsu Kosan Co., Ltd. May 2, 2013 Presentation on Results for FY 2012

Idemitsu Kosan Co., Ltd. May 2, 2013
Presentation on Results for FY 2012
Copyright©2013 Idemitsu Kosan Co., Ltd. All Rights Reserved.
Table of Contents
1. FY 2012 Financials
(1) Overview
(2) Segment Information
2. Forecast for FY 2013 Performance
(1) Overview
(2) Segment Information
3. Reference Materials
1

Copyright©2013 Idemitsu Kosan Co., Ltd. All Rights Reserved. 2
Crude Oil Price Trends <Monthly Dubai Crude Oil Price Trends>
FY 2011 Actual
(USD/Bbl.)
FY 2012 Actual
FY 2012 Average: US$107.1/Bbl.
FY 2011 Average: US$110.1/Bbl.
Apr May Jun Jul Aug Sep Oct Nov Dec Jan Feb Mar

Copyright©2013 Idemitsu Kosan Co., Ltd. All Rights Reserved. 3
JPY/USD Exchange Rate (TTS) Trends <Monthly JPY/USD (TTS) Trends>
FY 2011 Actual FY 2012 Actual
FY 2012 Average: 84.1 JPY/USD
FY 2011 Average: 80.1 JPY/USD
(JPY/USD)
Apr May Jun Jul Aug Sep Oct Nov Dec Jan Feb Mar

Copyright©2013 Idemitsu Kosan Co., Ltd. All Rights Reserved.
Overview
4
<FY2012 Financials> ■ Operating income and net income decreased by ¥27.4 billion to ¥110.7 billion
and by ¥14.2 billion to ¥50.2 billion due to reduced refining margin, declinig coal prices and decrease in inventory valuation
■We achieved net income, equity ratio and other targets through the third medium-term plan
■Streamlining targets, the company-wide goal of reducing costs by ¥50 billion relative to FY2009 were also achieved. Additional streamlining of 20 billion is planed in the fourth medium-term plan
<Forecast for FY 2013 Performance> ■ We assume a Dubai crude oil price of $105 and a foreign exchange rate of 95
JPY/USD. As a result, we forecast a ¥13.1 billion year-on-year earnings decrease from inventory-related factors and a ¥14.9 billion decrease in earnings from the resources segment
■ We forecast FY2013 operating profit of ¥79.0 billion (-¥31.7 billion year-on- year). We forecast net income of ¥51.0 billion (+¥0.8 billion year-on-year), in part due to an expected ¥24.3 billion increase in extraordinary profit

1. FY 2012 Financials

Copyright©2013 Idemitsu Kosan Co., Ltd. All Rights Reserved. 5
110.1 107.1 (3.0) (2.7%) 111.3 111.6 0.3 0.3%
971 965 (6) (0.6%) 80.1 84.1 4.0 5.0%
4,310.3 4,374.7 64.3 1.5% 138.1 110.7 (27.4) (19.8%) 34.1 26.1 (8.1) (23.7%)
103.9 84.6 (19.3) (18.6%)
(4.5) (1.6) 3.0 - 133.6 109.1 (24.4) (18.3%) (11.0) (7.8) 3.2 -
64.4 50.2 (14.2) (22.1%)
2) Consolidated Income Statement (Summary)
1) Crude Oil / Exchange Rates
(1) Overview
* Gross average method of inventory valuation * “Inventory impact” represents the impact of inventory valuation and the reduction in book value of inventory assets * Figures rounded to the nearest 0.1 billion yen
* Brent prices are averages based on the calendar year (January-December).
(Units: $/Bbl., $/Ton, ¥/$)
(Units: ¥ billions)
Crude Oil (DB)
Crude Oil (Brent) Naphtha Price (Customs) Exchange Rate (TTS)
FY2011l FY2012 Change
FY2011 FY2012 Change
Non-operating Income/Loss
Ordinary Income Extraordinary Gain/Loss Net Income
Net Sales Operating Income
(Inventory impact)
(Excluding inventory impact)

Copyright©2013 Idemitsu Kosan Co., Ltd. All Rights Reserved. 6
(2) Segment Information 1) Operating Income
87.4 72.9 (14.5) (16.6%)
52.9 47.9 (4.9) (9.4%)
12.8 17.1 4.3 34.0%
13.2 16.0 2.9 21.9%
42.6 22.9 (19.7) (46.4%)
27.9 25.6 (2.3) (8.3%)
14.7 (2.8) (17.4) -
0.8 1.8 1.0 124.3%
(5.5) (4.0) 1.5 -
138.1 110.7 (27.4) (19.8%) 103.9 84.6 (19.3) (18.6%)
* Fiscal years for Oil Exploration and Production included in the Resources Business as well as the Australian coal operations end in December
FY2011 FY2012 Change
(Excluding inventory impact)
(Excluding inventory impact)
(Excluding inventory impact)
Petroleum Products
Petrochemical Products
Resources Oil Exploration
and Production
Coal, etc.
Others
Reconciliation
Total
(Units: ¥ billions)

Copyright©2013 Idemitsu Kosan Co., Ltd. All Rights Reserved. 7
(2) Segment Information 2) Factors Causing Changes in Operating Income (YoY) (Units: ¥ billion)
Petroleum Products Petrochemical Products
Oil Exploration and Production Coal/Others
Resources, etc.
FY2011 FY2012
Inventory impact
Inventory impact
Decrease in sales volume
Cost-
related
Improved product margins
Stream-lining,
refinery fuel oil costs,
time lag, etc.
Stream-lining,
refinery fuel oil costs,
time lag, etc.
Decrease in sales volume, product margins
Crude oil sales
volume
Coal sales
volume
Others, Reconcili-
ation
Price, foreign
exchange
Price, foreign
exchange, cost-related
(14.5) (17.2) +4.3
2. Forecast for FY 2013 Performance
Copyright©2013 Idemitsu Kosan Co., Ltd. All Rights Reserved. 8
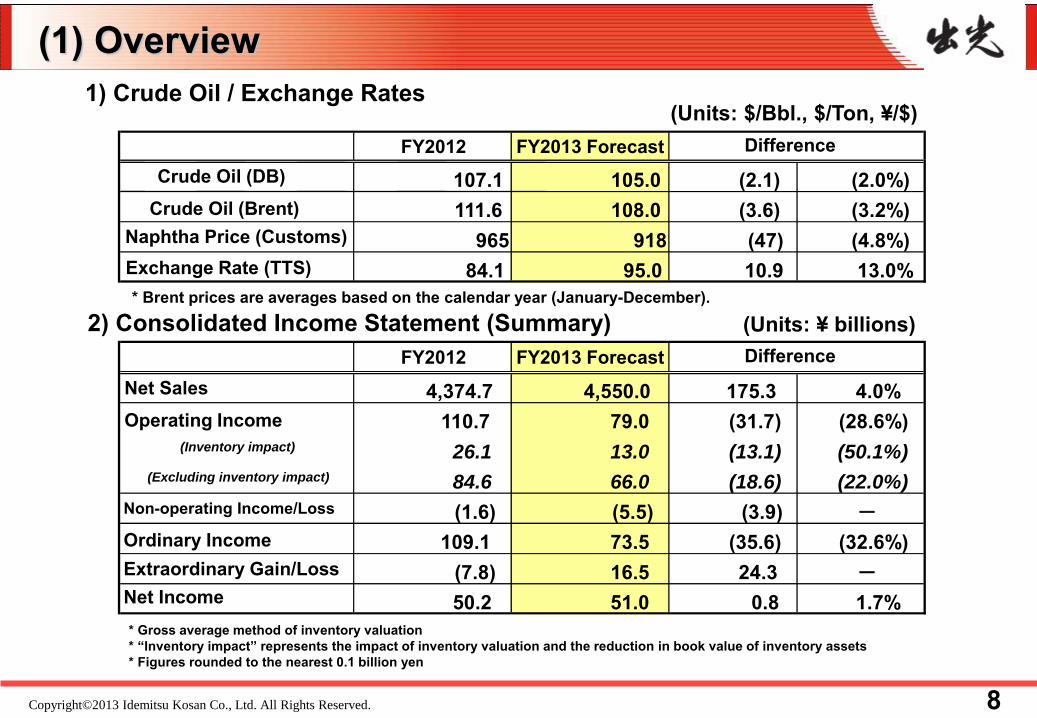
107.1 105.0 (2.1) (2.0%) 111.6 108.0 (3.6) (3.2%)
965 918 (47) (4.8%) 84.1 95.0 10.9 13.0%
4,374.7 4,550.0 175.3 4.0% 110.7 79.0 (31.7) (28.6%)
26.1 13.0 (13.1) (50.1%)
84.6 66.0 (18.6) (22.0%)
(1.6) (5.5) (3.9) - 109.1 73.5 (35.6) (32.6%)
(7.8) 16.5 24.3 - 50.2 51.0 0.8 1.7%
2) Consolidated Income Statement (Summary)
1) Crude Oil / Exchange Rates
(1) Overview
* Gross average method of inventory valuation * “Inventory impact” represents the impact of inventory valuation and the reduction in book value of inventory assets * Figures rounded to the nearest 0.1 billion yen
* Brent prices are averages based on the calendar year (January-December).
(Units: $/Bbl., $/Ton, ¥/$)
(Units: ¥ billions)
Crude Oil (DB) Crude Oil (Brent)
Naphtha Price (Customs) Exchange Rate (TTS)
Non-operating Income/Loss
Ordinary Income Extraordinary Gain/Loss Net Income
Net Sales Operating Income
(Inventory impact)
(Excluding inventory impact)
FY2012 FY2013 Forecast Difference
FY2012 FY2013 Forecast Difference

Copyright©2013 Idemitsu Kosan Co., Ltd. All Rights Reserved. 9
72.9 59.0 (13.9) (19.1%)
47.9 46.0 (1.9) (4.0%)
17.1 15.0 (2.1) (12.3%)
16.0 15.0 (1.0) (6.5%)
22.9 8.0 (14.9) (65.0%)
25.6 13.5 (12.1) (47.3%)
(2.8) (5.5) (2.7) -
1.8 2.0 0.2 9.3%
(4.0) (5.0) (1.0) -
110.7 79.0 (31.7) (28.6%) 84.6 66.0 (18.6) (22.0%)
(2) Segment Information 1) Operating Income
* Fiscal years for Oil Exploration and Production included in the Resources Business as well as the Australian coal operations end in December
FY2012 FY2013 Forecast Difference
(Excluding inventory impact)
(Excluding inventory impact)
(Excluding inventory impact)
Petroleum Products
Petrochemical Products
Resources
Oil Exploration
and Production
Coal, etc.
Others
Reconciliation
Total
(Units: ¥ billions)

Copyright©2013 Idemitsu Kosan Co., Ltd. All Rights Reserved. 10
Petroleum Products Petrochemical Products
Oil Exploration and Production Coal/Others
Resources, etc.
(2) Segment Information 2) Factors Causing Changes in Operating Income (YoY) (Units: ¥ billion)
Inventory impact
Stream-lining
Increase in sales
volume Sales volume
Refinery fuel oil
costs, etc.
Crude oil volume
Inventory impact
Reduced product margins
(13.9) (2.1) (15.7) FY2012
Operating Profit FY2013
Forecast
Manufactu-ring fuel oil costs, time
lag, etc. Stream-
lining Cost-
related
Coal
volume
Price, foreign
exchange
Price, foreign
exchange
Stream-lining, cost -related,
other

3. Reference Materials

Copyright©2013 Idemitsu Kosan Co., Ltd. All Rights Reserved. 11
Table of Contents
1. Third Medium-term Plan Results /
Fourth Medium-term Plan
2. Basic policy on allocation of
profits/dividends
3. Financial Reporting
(1) FY 2012 Financials (vs. 2/5 forecasts)
(2) Net Sales by Segment
(3) Extraordinary Gains/Losses
(4) Consolidated Balance Sheet
(5) Consolidated Statement of Cash Flows
4. Sensitivity
5. Sales and Production
(1) Sales/Production Volume
(2) Sales/Production Volume Forecast
6. Foreign Exchange
7. Market Conditions
8. Capacity Utilization at Refineries
9. Number of Service Stations

Copyright©2013 Idemitsu Kosan Co., Ltd. All Rights Reserved. 12
1. Third Medium-term Plan Results / Fourth Medium-term Plan 1) Management Indicators
FY2012
(Units: ¥ billions, %) Plan Results 3,750.0 4,374.7
120.0 122.2 48.0 50.2 (90.0) (173.3) 8.0% 7.7%
22.0% 24.0% 1.5 1.2
80.0$/bbl 107.1$/bbl 740$/t 965$/t 90.0 84.1
Net Sales Operating Income *
Net Income (2010-2012 Cumulative)
ROIC **
Equity Ratio
Net D/E Ratio
* Operating Income: Includes equity-method investment income/losses and dividends received ** ROIC (Return on Invested Capital): Shareholders’ equity + interest-bearing debt + minority interests
<Major Assumptions>
Crude Oil Price (DB)
Naphtha Price (Customs)
Exchange Rate (JPY/USD)

Copyright©2013 Idemitsu Kosan Co., Ltd. All Rights Reserved. 13
2) Operating Profit by Strategic Segment
FY2012 Results
FY2013 Plan
FY2015 Plan
65.4 60.0 64.0 (68%) (79%) (43%)
21.5 7.0 54.0 (22%) (9%) (36%)
12.3 13.0 36.0 (13%) (17%) (24%)
(3.1) (4.0) (4.0) 96.1 76.0 150.0 26.1 13.0 0.0
122.2 89.0 150.0 * Operating Income: Includes equity-method investment income/losses and dividends received
(Units: ¥ billions)
Core (% of Total)
Resources (% of Total)
Functional Materials (% of Total)
Shared Subtotal
(Excluding inventory impact)
Inventory Impact Total
1. Third Medium-term Plan Results / Fourth Medium-term Plan

Copyright©2013 Idemitsu Kosan Co., Ltd. All Rights Reserved. 14
3) Streamlining
Petroleum Products 34.0 34.5 40.0
8.0 8.5 10.0
- 4.0 7.0
8.0 11.0 12.0
Total 50.0 58.0 70.0
vs. FY2012 - 8.0 20.0
FY2012 Results
FY2013 Plan
FY2015 Plan
Petrochemical Products
Resources
Indirect Divisions
* Cost reduction targets and progress vs. FY2009 (Units: ¥ billions)
・ Enhanced efficiency in facilities management ・ Energy conservation/rationalization at refineries ・ Rationalization of sales and logistics divisions
etc.
・ Enhanced efficiency in facilities management etc.
・ Streamlining of administrative divisions etc.
・ Enhanced efficiency in Australian coal mines ・ Streamlining of oil exploration and production etc.
1. Third Medium-term Plan Results / Fourth Medium-term Plan

Copyright©2013 Idemitsu Kosan Co., Ltd. All Rights Reserved. 15
4) Investments
FY2013 FY2013-2015
Plan Actual Plan Plan
Core 90.0 40.9 37.0 146.0 Resources 156.0 118.3 63.0 159.0
Functional Materials 44.0 34.4 10.0 35.0
Total Strategic Investments 290.0 193.6 110.0 340.0
Maintenance and Renewals 80.0 71.7 37.0 110.0
Total 370.0 265.3 147.0 450.0
FY2010-2012
Strategic Segment
(Units: ¥ billions)
1. Third Medium-term Plan Results / Fourth Medium-term Plan

Copyright©2013 Idemitsu Kosan Co., Ltd. All Rights Reserved. 16
2. Basic policy on allocation of profits/dividends
■The Company considers the return of profits to shareholders as one of the most important management issues and will continue to pay stable dividends to shareholders after taking into consideration the fulfillment of internal reserves for strategic investment to enhance existing businesses and to develop future business operations, the improvement of the corporate financial structure, and the balance with business performances
■With respect to the payment of an annual dividend for fiscal 2012, the Company decided to pay an ordinary dividend of ¥200 per share. For the fiscal year 2013, the Company plans to pay an annual dividend of ¥200 per share

Copyright©2013 Idemitsu Kosan Co., Ltd. All Rights Reserved.
3. Financial Reporting
17
(1) FY2012 Results (vs. February 5 forecasts)
Feb 5 Forecast FY2012
106.3 107.1 0.8 0.8% 111.6 111.6 0.0 0.0% 959 965 6 0.6% 83.2 84.1 0.9 1.1%
4,360.0 4,374.7 14.7 0.3% 87.5 110.7 23.2 26.5% 10.0 26.1 16.1 160.7%
77.5 84.6 7.1 9.2%
0.0 (1.6) (1.6) - 87.5 109.1 21.6 24.7% (6.5) (7.8) (1.3) - 38.0 50.2 12.2 32.0%
Difference
Feb 5 Forecast FY2012 Difference
Crude Oil (DB) Crude Oil (Brent)
Naphtha Price (Customs) Exchange Rate (TTS)
Non-operating Income/Loss
Ordinary Income Extraordinary Gain/Loss Net Income
Net Sales Operating Income
(Inventory impact)
(Excluding inventory impact)
* Gross average method of inventory valuation * “Inventory impact” represents the impact of inventory revaluation and the reduction in book value of inventory assets * Figures rounded to the nearest billion yen
* Brent prices are averages based on the calendar year (January-December).
(Units: $/Bbl., $/Ton, ¥/$)
(Units: ¥ billions) 2) Consolidated Income Statement (Summary)
1) Crude Oil / Exchange Rates

Copyright©2013 Idemitsu Kosan Co., Ltd. All Rights Reserved. 18
3) Operating Income by Segment
Feb 5 Forecast FY2012
57.0 72.9 15.9 27.9%
47.0 47.9 0.9 1.9%
11.5 17.1 5.6 48.7%
11.5 16.0 4.5 39.5%
22.0 22.9 0.9 3.9%
25.0 25.6 0.6 2.4%
(3.0) (2.8) 0.2 -
2.0 1.8 (0.2) (8.5%) (5.0) (4.0) 1.0 - 87.5 110.7 23.2 26.5% 77.5 84.6 7.1 9.2%
Difference
3. Financial Reporting
(Units: ¥ billions)
(1) FY2012 Results (vs. February 5 forecasts)
* Fiscal years for Oil Exploration and Production included in the Resources Business as well as the Australian coal operations end in December
(Excluding inventory impact)
(Excluding inventory impact)
(Excluding inventory impact)
Petroleum Products
Petrochemical Products
Resources
Oil Exploration
and Production
Coal, etc.
Others
Reconciliation
Total

Copyright©2013 Idemitsu Kosan Co., Ltd. All Rights Reserved. 19
FY2011 FY2012
3,588.7 3,647.5 58.8 1.6%
508.1 528.4 20.3 4.0%
183.7 162.3 (21.4) (11.6%)
95.7 80.4 (15.3) (16.0%)
88.0 81.9 (6.1) (6.9%)
29.8 36.5 6.7 22.5%
4,310.3 4,374.7 64.3 1.5%
Change
3. Financial Reporting
(Units: ¥ billions)
(2) – 1. FY2012 Net Sales by Segment
Oil Exploration
and Production
Coal, etc.
Petroleum Products
Petrochemical Products
Resources
Others/Reconciliation
Total

Copyright©2013 Idemitsu Kosan Co., Ltd. All Rights Reserved. 20
FY2012 FY2013(E)
3,647.5 3,770.0 122.5 3.4%
528.4 550.0 21.6 4.1%
162.3 180.0 17.7 10.9%
80.4 80.0 (0.4) (0.5%)
81.9 100.0 18.1 22.1%
36.5 50.0 13.5 36.8%
4,374.7 4,550.0 175.3 4.0%
Difference
3. Financial Reporting
(Units: ¥ billions)
(2) – 2. FY2013 Net Sales Forecast by Segment
Oil Exploration
and Production
Coal, etc.
Petroleum Products
Petrochemical Products
Resources
Total
Others/Reconciliation

Copyright©2013 Idemitsu Kosan Co., Ltd. All Rights Reserved. 21
FY2011 FY2012 Change
1.3 1.4 0.1 1.3 0.2 (1.1) 2.6 1.5 (1.0) 4.4 3.8 (0.6) 1.9 4.4 2.5 7.2 1.1 (6.1)
13.6 9.3 (4.3) (11.0) (7.8) 3.2
3. Financial Reporting
(3) Extraordinary Gains/Losses
Gain on Sale of Fixed Assets
Other
Total Extraordinary Gains
Loss on Sale and Depletion of Fixed Assets Impairment Loss on Fixed Assets
Total Extraordinary Losses
Total Extraordinary Gains/Losses
Other
(Units: ¥ billions)

Copyright©2013 Idemitsu Kosan Co., Ltd. All Rights Reserved. 22
171.5 116.8 (54.6) 407.5 405.3 (2.2) 452.3 425.9 (26.4) 368.6 379.2 11.4 585.6 646.4 60.9 402.0 399.6 (2.4) 121.2 122.0 0.8 1,178.1 1,184.1 6.8
547.3 513.9 (34.2) 342.2 342.5 0.3
1,330.6 1,311.2 (19.3) 889.5 856.4 (33.9) 986.1 1,030.3 44.2 2,067.6 2,040.5 (27.1) 601.4 596.0 (5.4) 468.4 511.1 42.8 384.7 434.3 49.6 118.2 142.4 24.2 365.5 386.9 21.5 27.9 34.4 6.4
1,351.6 1,417.3 65.7 614.5 687.9 73.4 2,682.1 2,728.5 46.3 2,682.1 2,728.5 46.3
919.8 896.4 (23.4) 21.9% 24.0% 2.1%
Cash and Deposits
Receivables
Inventory
Other Current Assets
Total Current Assets
(Land)
Tangible Fixed Assets
Other Fixed Assets
(Other)
Total Fixed Assets
Total Assets
Payables
Short-term Borrowings
Other Current Liabilities
Total Current Liabilities
Long-term Borrowings
Other Fixed Liabilities
Total Fixed Liabilities
Total Liabilities
Shareholders’ Equity Valuation and Translation Adjustment
Total Net Assets Total Liabilities and Net Assets
Minority Interests
Total Interest-bearing Debt
Equity Ratio
3/31/2012 3/31/2013 Change 3/31/2012 3/31/2013 Change
(Units: ¥ billions)
3. Financial Reporting (4) Consolidated Balance Sheet

Copyright©2013 Idemitsu Kosan Co., Ltd. All Rights Reserved. 23
159.7 50.8 (108.9) 122.5 101.4 (21.2)
61.1 54.0 (7.1) (139.9) (21.7) 118.1 116.0 (82.8) (198.8) (59.1) (70.9) (11.8) (55.1) (58.1) (3.0)
(4.0) (12.8) (8.8) (79.5) (45.7) 33.8 (70.2) (34.1) 36.1
(9.3) (11.6) (2.3) (4.8) 11.1 16.0 16.3 (54.6) (71.0)
154.7 171.1 16.3 171.1 116.4 (54.6)
3. Financial Reporting
(Units: ¥ billions)
(5) Consolidated Statement of Cash Flows
FY2011 FY2012 Change CF from Operating Activities
Net Income before Tax Adjustments
Depreciation Expense Increase in Sales Receivables and Inventory Other
CF from Investing Activities Purchase of Tangible Fixed Assets Other
CF from Financing Activities Increase (Decrease) in Borrowings
Other
Translation Gains/Losses
Increase in Cash and Cash Equivalents
Cash and Cash Equivalents - Ending Balance
Cash and Cash Equivalents - Beginning Balance

Copyright©2013 Idemitsu Kosan Co., Ltd. All Rights Reserved. 24
4. Sensitivity (1) Impact of a US$1/bbl. Increase in Crude Oil Prices on FY Earnings
(2) Impact of a 1 JPY/USD Depreciation on FY Earnings
* In addition to the above, the resources and other businesses are impacted by fluctuations in exchange rates with other currencies (NOK, AUD, GBP, etc.)
Petroleum Increase in refineryfuel costs, etc. (¥0.3 billion)
Products Inventory impact ¥2.4 billion¥2.1 billion
Oil Exploration & Production ¥0.7billion
Petroleum Increase in refineryfuel costs, etc. (¥0.4 billion)
Products Inventory impact ¥2.8 billion¥2.4 billion
Oil Exploration & Production -

Copyright©2013 Idemitsu Kosan Co., Ltd. All Rights Reserved. 25
3.Sales and Production
(1)-1.Sales Volume (Domestic Fuel Oil Sales Volume: Non-consolidated) (Units:Thousand KL,%) (Units:Thousand KL,%)
FY 2011 FY 2012
Gasoline 8,754 8,563 (191) (2.2%)(Prmium-Unleaded) 1,086 1,049 (37) (3.4%)(Regular-Unleaded) 7,668 7,514 (154) (2.0%)
Naphtha 273 246 (27) (9.7%)Jet Fuel 1,389 1,504 115 8.3%Kerosene 3,255 3,184 (71) (2.2%)Diesel Oil 5,706 5,814 108 1.9%Heavy Fuel Oil A 2,942 2,954 12 0.4%Heavy Fuel Oil C 3,582 4,294 712 19.9%Toal Domestic Sales Volume 25,902 26,560 658 2.5%Exported Volume 4,139 3,773 (366) (8.8%)
(General Exports) 1,745 1,089 (656) (37.6%)Total Sales Volume 30,040 30,333 292 1.0%
Change
Copyright©2013 Idemitsu Kosan Co., Ltd. All Rights Reserved. 26
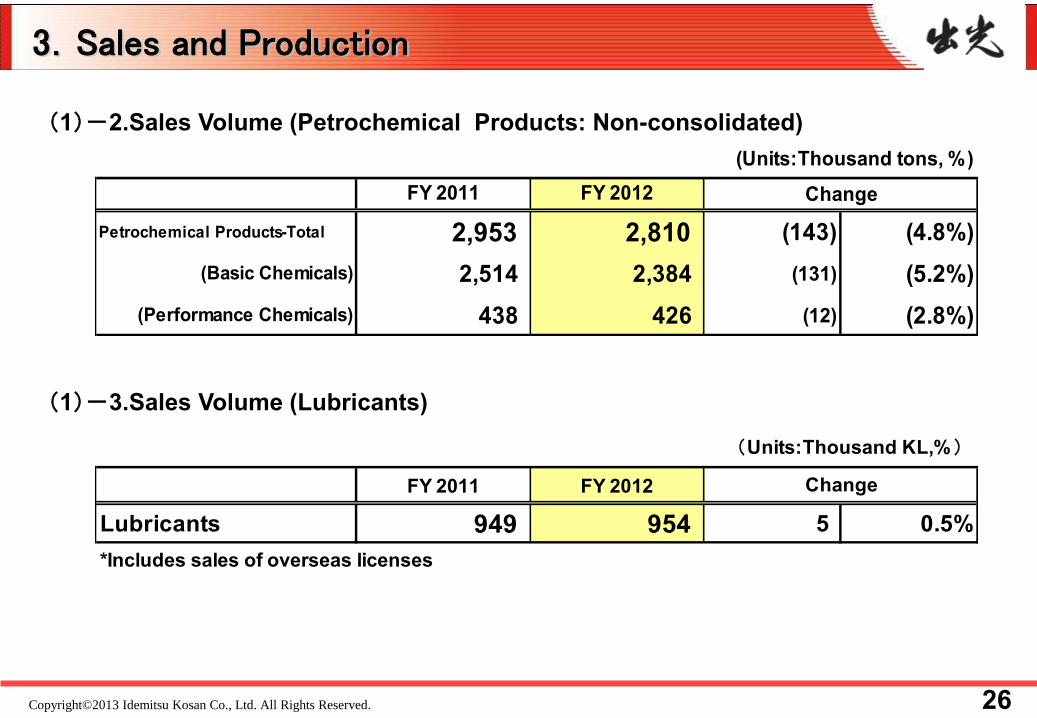
3.Sales and Production
(1)-2.Sales Volume (Petrochemical Products: Non-consolidated)
(1)-3.Sales Volume (Lubricants)
(Units:Thousand tons, %) (Units:Thousand tons, %)FY 2011 FY 2012
Petrochemical Products-Total 2,953 2,810 (143) (4.8%)(Basic Chemicals) 2,514 2,384 (131) (5.2%)
(Performance Chemicals) 438 426 (12) (2.8%)
Change
(Units:Thousand KL,%) (Units:Thousand KL,%)
FY 2011 FY 2012
Lubricants 949 954 5 0.5%*Includes sales of overseas licenses
Change

Copyright©2013 Idemitsu Kosan Co., Ltd. All Rights Reserved. 27
3.Sales and Production
(1)-4.Oil Exploration & Production – Production Volume (including Gas)
(1)-5. Coal – Production Volume (Units:Thousand tons) (Units:Thousand tons)
FY 2011 FY 2012 Change
Ensham(85%) 3,724 3,682 (42) (1.1%)Muswellbrook 1,264 1,122 (142) (11.2%)Boggabri 2,978 3,779 801 26.9%Tarawonga(30%) 467 556 89 19.1%
Total Production Volume 8,433 9,139 706 8.4%*Figures based on interst owned by Idemitsu Group*Fiscal years for Oil Exploration and Production and Australian coal operations end in December
(Units:Thousand BOED) (Units:Thousand BOED)FY 2011 FY 2012 Change
Norway 26.4 22.3 (4.1) (15.6%)United Kingdom 3.6 2.8 (0.8) (22.6%)Vietnam 0.5 0.4 (0.0) (2.7%)
Total('000BOED) 30.5 25.5 (4.9) (16.2%)Total('000BOE) 11,115 9,339 (1,776) (16.0%)
*Figures based on interst owned by Idemitsu Group

Copyright©2013 Idemitsu Kosan Co., Ltd. All Rights Reserved. 28
3.Sales and Production
(2)-1.Sales Forecasts (Domestic Fuel Oil Sales Volume: Non-consolidated) (Units:Thousand KL,%) (Units:Thousand KL,%)
FY 2012 FY 2013(E)
Gasoline 8,563 8,540 (23) (0.3%)(Prmium-Unleaded) 1,049 1,040 (9) (0.9%)(Regular-Unleaded) 7,514 7,500 (14) (0.2%)
Naphtha 246 250 4 1.5%Jet Fuel 1,504 1,560 56 3.7%Kerosene 3,184 3,260 76 2.4%Diesel Oil 5,814 5,630 (184) (3.2%)Heavy Fuel Oil A 2,954 2,940 (14) (0.5%)Heavy Fuel Oil C 4,294 3,440 (854) (19.9%)Toal Domestic Sales Volume 26,560 25,620 (940) (3.5%)Exported Volume 3,773 4,360 587 15.6%
(General Exports) 1,089 1,300 211 19.4%Total Sales Volume 30,333 29,980 (353) (1.2%)
Difference

Copyright©2013 Idemitsu Kosan Co., Ltd. All Rights Reserved. 29
3.Sales and Production
(2)-2.Sales Forecasts (Petrochemical Products: Non-consolidated)
(2)-3.Sales Forecasts (Lubricants)
(Units:Thousand tons, %) (Units:Thousand tons, %)
FY 2012 FY 2013(E)
Petrochemical Products-Total 2,810 3,230 420 14.9%(Basic Chemicals) 2,747 3,160 413 15.0%
(Performance Chemicals) 63 70 7 11.0%
Difference
(Units:Thousand KL,%) (Units:Thousand KL,%)
FY 2012 FY 2013(E)
Lubricants 954 1,080 126 13.2%*Includes sales of overseas licenses
Difference
*Classification is reviewed from P26
Copyright©2013 Idemitsu Kosan Co., Ltd. All Rights Reserved. 30
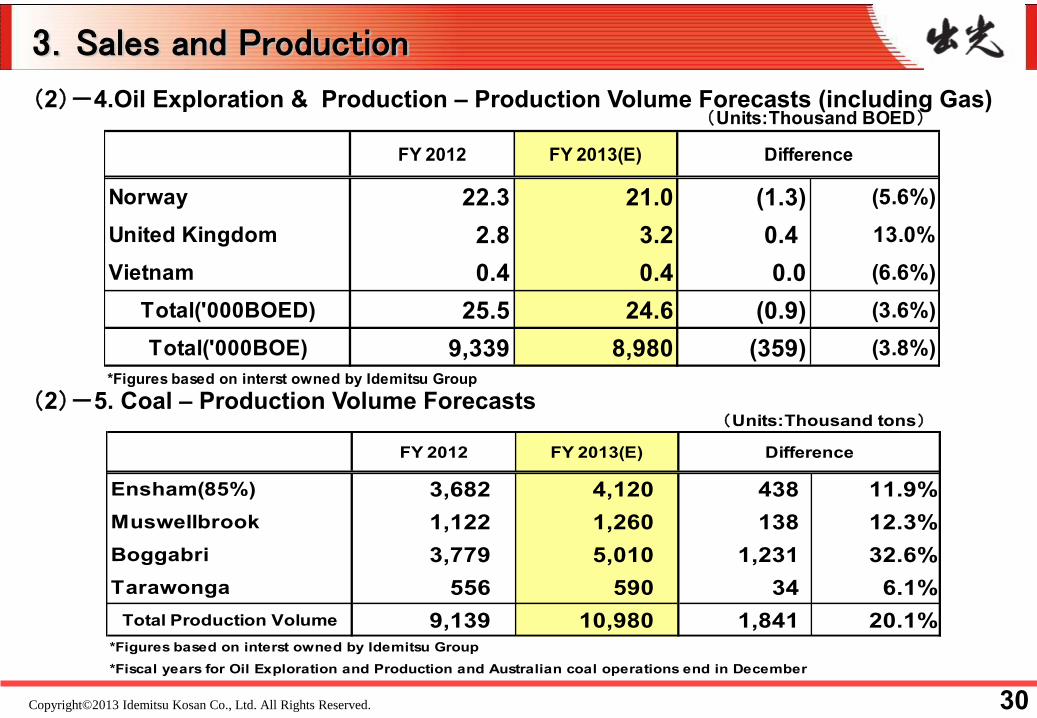
3.Sales and Production
(2)-4.Oil Exploration & Production – Production Volume Forecasts (including Gas)
(2)-5. Coal – Production Volume Forecasts (Units:Thousand tons) (Units:Thousand tons)
FY 2012 FY 2013(E)
Ensham(85%) 3,682 4,120 438 11.9%Muswellbrook 1,122 1,260 138 12.3%Boggabri 3,779 5,010 1,231 32.6%Tarawonga 556 590 34 6.1%
Total Production Volume 9,139 10,980 1,841 20.1%*Figures based on interst owned by Idemitsu Group*Fiscal years for Oil Exploration and Production and Australian coal operations end in December
Difference
(Units:Thousand BOED) (Units:Thousand BOED)
FY 2012 FY 2013(E)
Norway 22.3 21.0 (1.3) (5.6%)United Kingdom 2.8 3.2 0.4 13.0%Vietnam 0.4 0.4 0.0 (6.6%)
Total('000BOED) 25.5 24.6 (0.9) (3.6%)Total('000BOE) 9,339 8,980 (359) (3.8%)
*Figures based on interst owned by Idemitsu Group
Difference

Copyright©2013 Idemitsu Kosan Co., Ltd. All Rights Reserved. 31
4.Foreign Exchange
(1)USD

Copyright©2013 Idemitsu Kosan Co., Ltd. All Rights Reserved. 32
4.Foreign Exchange
(2)Norwegian Krone

Copyright©2013 Idemitsu Kosan Co., Ltd. All Rights Reserved. 33
4.Foreign Exchange
(3)Norwegian Krone

Copyright©2013 Idemitsu Kosan Co., Ltd. All Rights Reserved. 34
(4)Australian Dollar 4.Foreign Exchange

Copyright©2013 Idemitsu Kosan Co., Ltd. All Rights Reserved. 35
4.Foreign Exchange
(5)Australian Dollar

Copyright©2013 Idemitsu Kosan Co., Ltd. All Rights Reserved. 36
5.Market Conditions
(1)Crude Oil Prices (Dubai and Brent)
Copyright©2013 Idemitsu Kosan Co., Ltd. All Rights Reserved. 37
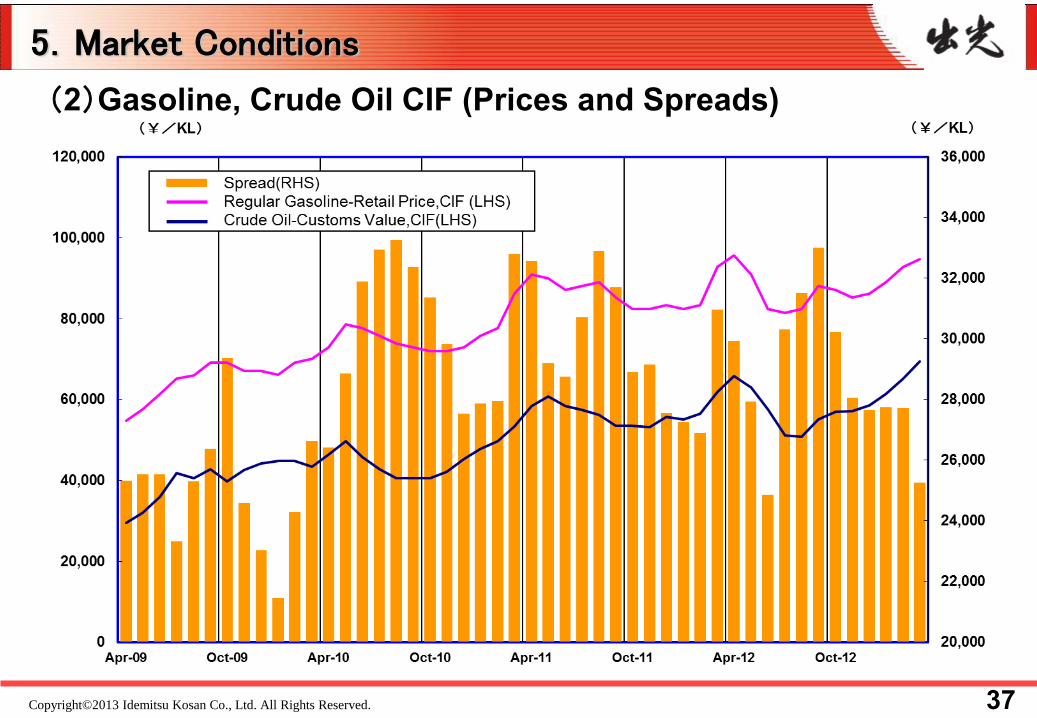
5.Market Conditions
(2)Gasoline, Crude Oil CIF (Prices and Spreads)

Copyright©2013 Idemitsu Kosan Co., Ltd. All Rights Reserved. 38
5.Market Conditions
(3)Diesel Oil – Crude Oil CIF (Prices and Spreads)

Copyright©2013 Idemitsu Kosan Co., Ltd. All Rights Reserved. 39
5.Market Conditions
(4)Paraxylene, Naptha (Prices and Spreads)
Copyright©2013 Idemitsu Kosan Co., Ltd. All Rights Reserved. 40
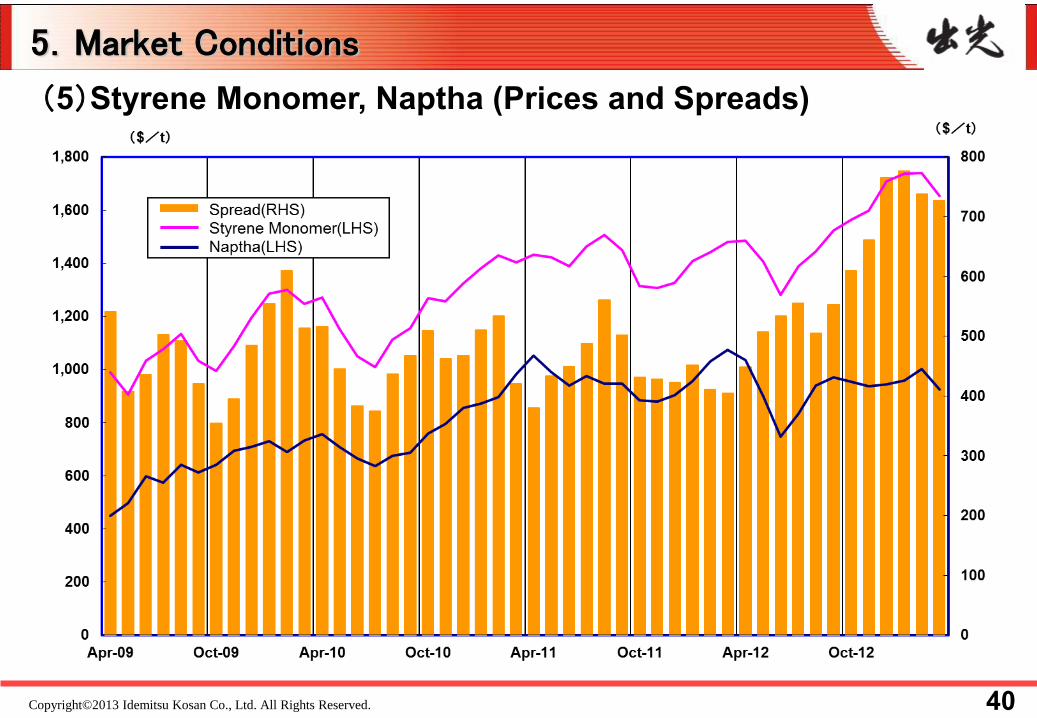
5.Market Conditions
(5)Styrene Monomer, Naptha (Prices and Spreads)
Copyright©2013 Idemitsu Kosan Co., Ltd. All Rights Reserved. 41
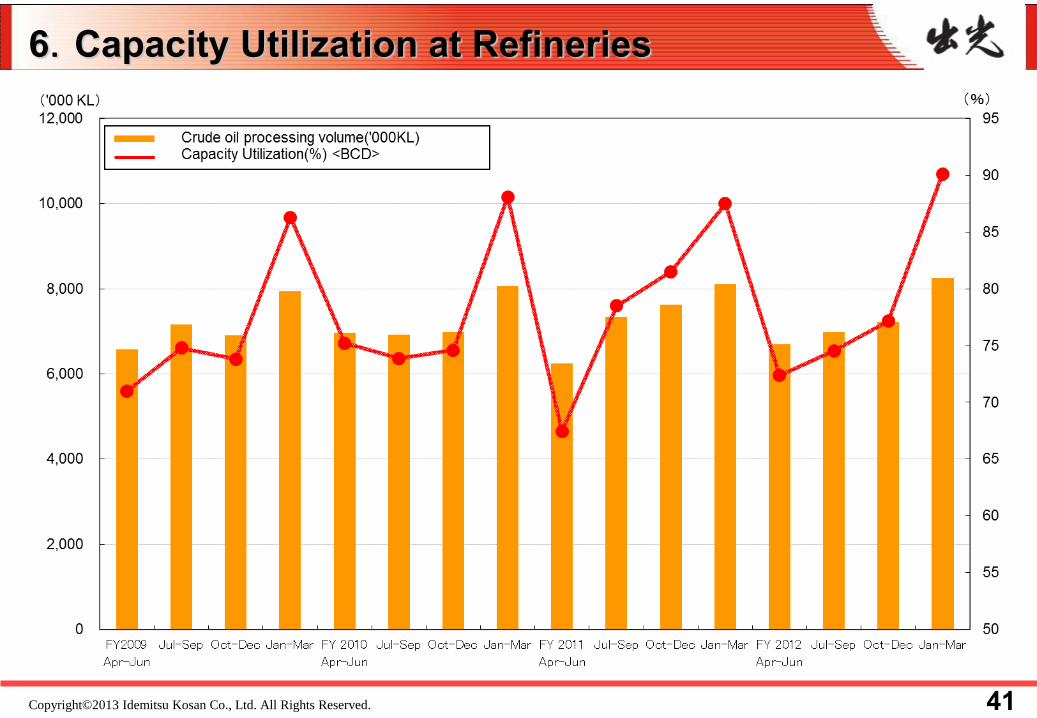
6.Capacity Utilization at Refineries

Copyright©2013 Idemitsu Kosan Co., Ltd. All Rights Reserved. 42
7.Number of Service Stations

Copyright©2013 Idemitsu Kosan Co., Ltd. All Rights Reserved. 43
Cautionary warnings about forecasts
Any information about forecasts for the Company’s operating results, management strategy and management policy contained in this documents other than historical facts is prepared according to decisions made by the top management of the Company based on information available as of the publication of the document. (See assumption on P8 of this presentation.)
Actual business environments contain potential risk factors and uncertainties including economic situations, crude oil prices, trends in petrochemical products, markets conditions, currency exchange rates and interest rates. Consequently, actual operating results of the Company may substantially differ from forecasts due to changes in the important factors mentioned above.