99
The Social Determinants of Health The Way Forward! BCASW Education Day September 20, 2103 Vancouver, BC

The Social Determinants of
Health
The Way Forward!
BCASW Education Day
September 20, 2103
Vancouver, BC
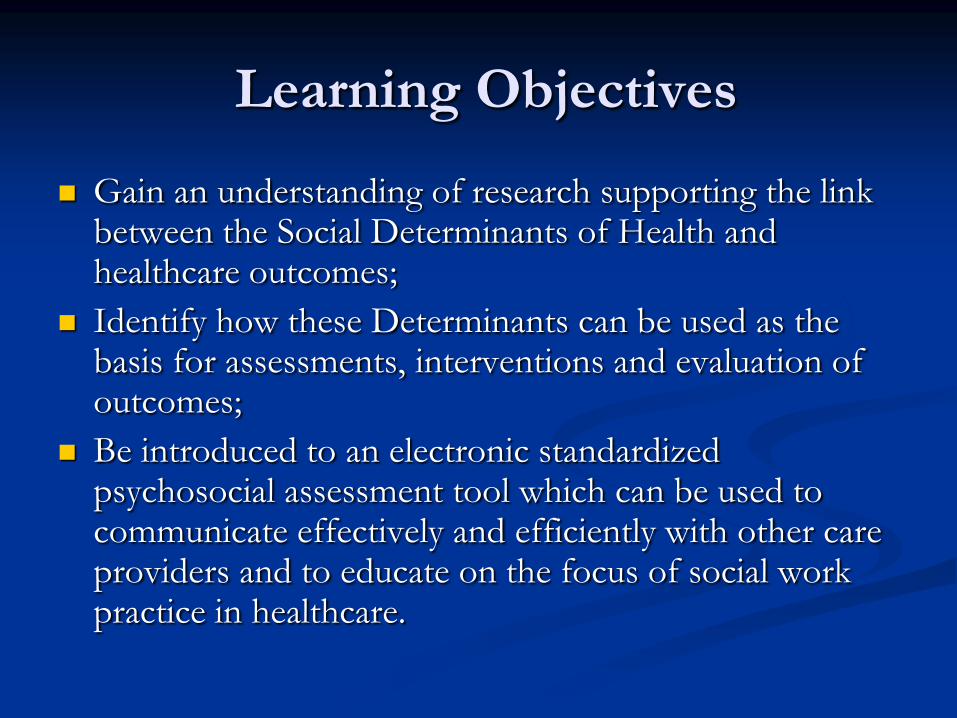
Learning Objectives
Gain an understanding of research supporting the link between the Social Determinants of Health and healthcare outcomes;
Identify how these Determinants can be used as the basis for assessments, interventions and evaluation of outcomes;
Be introduced to an electronic standardized psychosocial assessment tool which can be used to communicate effectively and efficiently with other care providers and to educate on the focus of social work practice in healthcare.

Context
A brief history of social work in health
Challenges facing Canadian healthcare system
Roles of social workers associated directly and
indirectly with healthcare
Challenges and opportunities facing social work
in this milieu
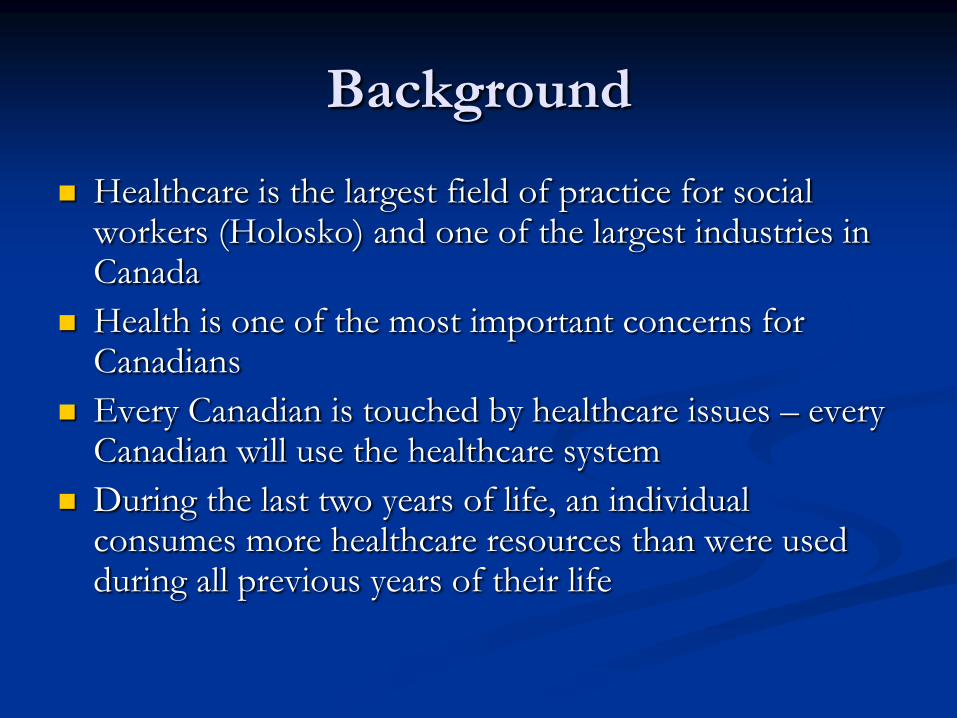
Background
Healthcare is the largest field of practice for social workers (Holosko) and one of the largest industries in Canada
Health is one of the most important concerns for Canadians
Every Canadian is touched by healthcare issues – every Canadian will use the healthcare system
During the last two years of life, an individual consumes more healthcare resources than were used during all previous years of their life
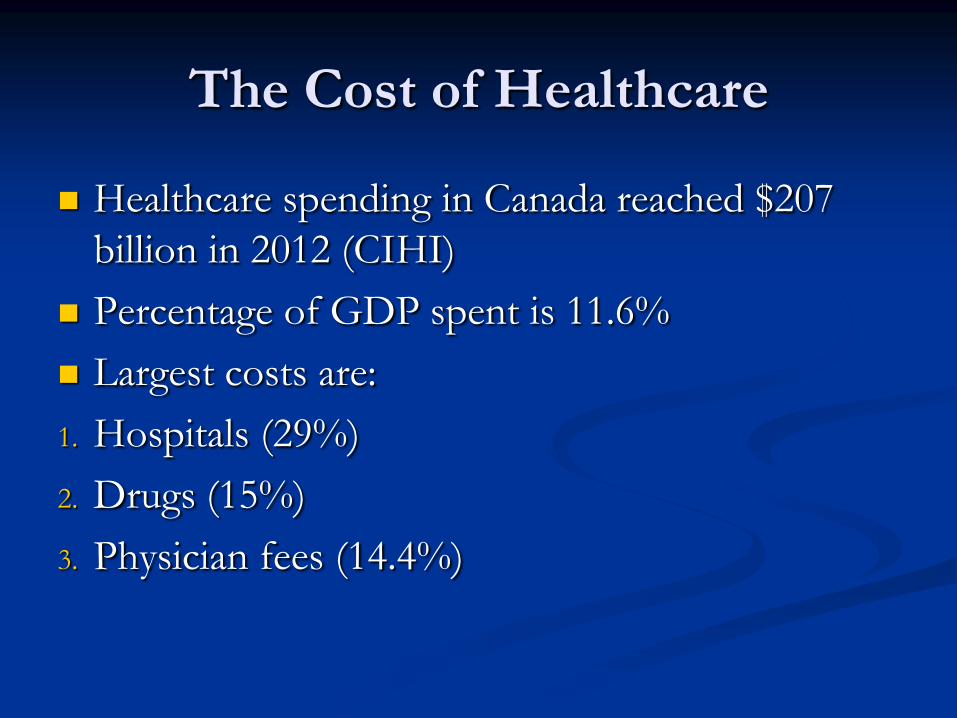
The Cost of Healthcare
Healthcare spending in Canada reached $207
billion in 2012 (CIHI)
Percentage of GDP spent is 11.6%
Largest costs are:
1. Hospitals (29%)
2. Drugs (15%)
3. Physician fees (14.4%)

Health Spending by Province
In 2011 health care accounted for 38% of
provincial/territorial spending
Quebec spends least (30.1%)
Nova Scotia spends most (47.9%)

Average Annual Growth Rate

Cost per Canadian 1975-2012
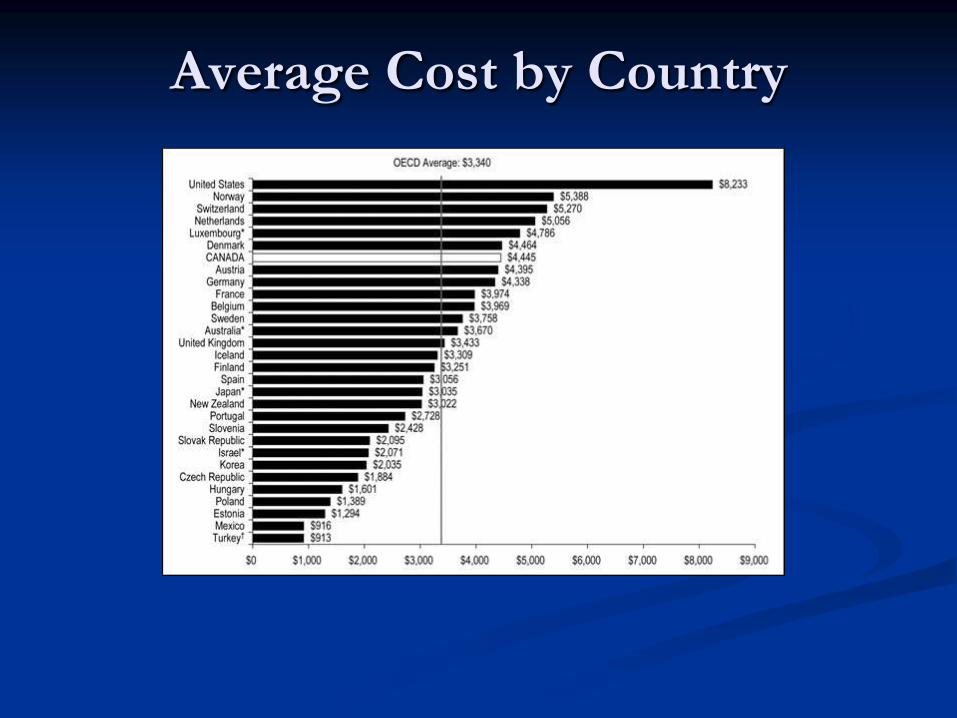
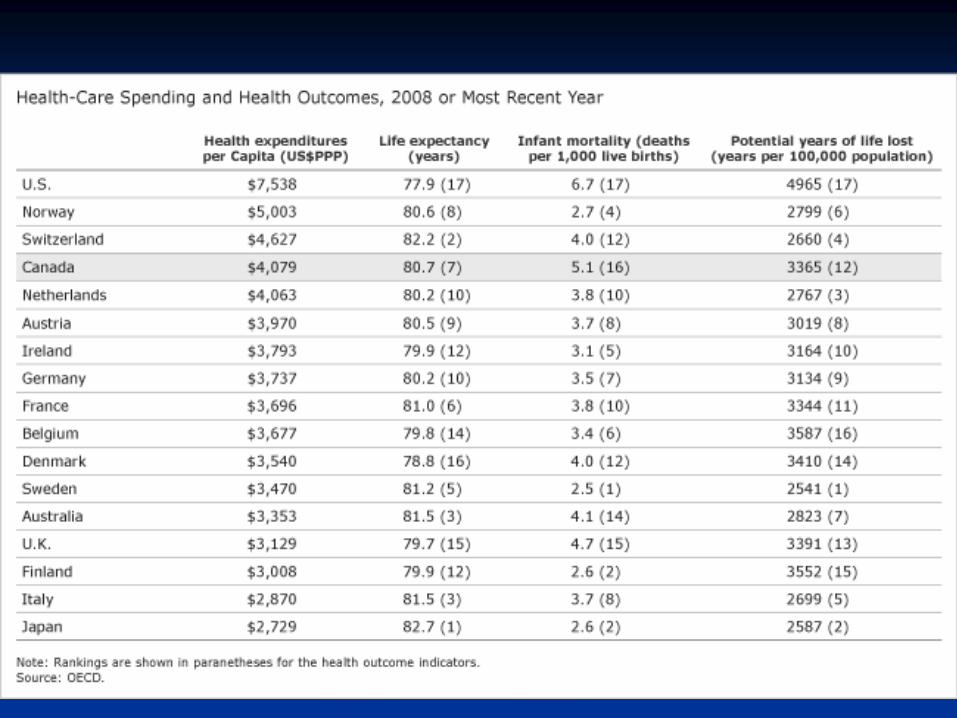
Average Cost by Country

Value for Money?
Canada is second only to the US in per capita
spending ($5948 per person) (CIHI 2012)
Canada now ranks 10th among 17 countries in
terms of outcomes
Japan, Switzerland and Italy ranked higher
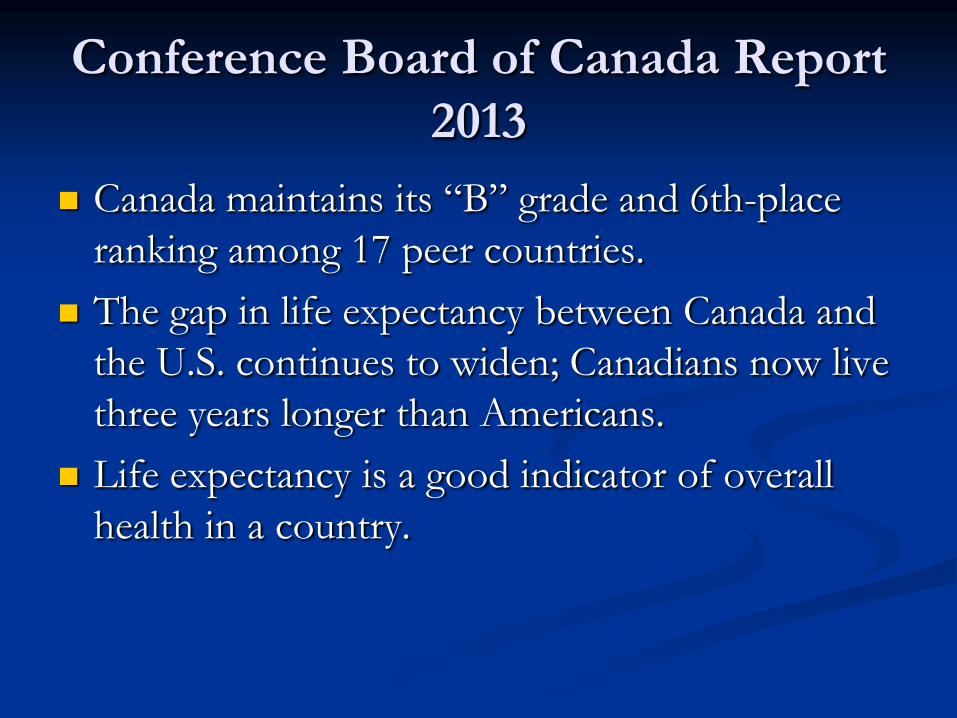
Conference Board of Canada Report
2013
Canada maintains its “B” grade and 6th-place
ranking among 17 peer countries.
The gap in life expectancy between Canada and
the U.S. continues to widen; Canadians now live
three years longer than Americans.
Life expectancy is a good indicator of overall
health in a country.
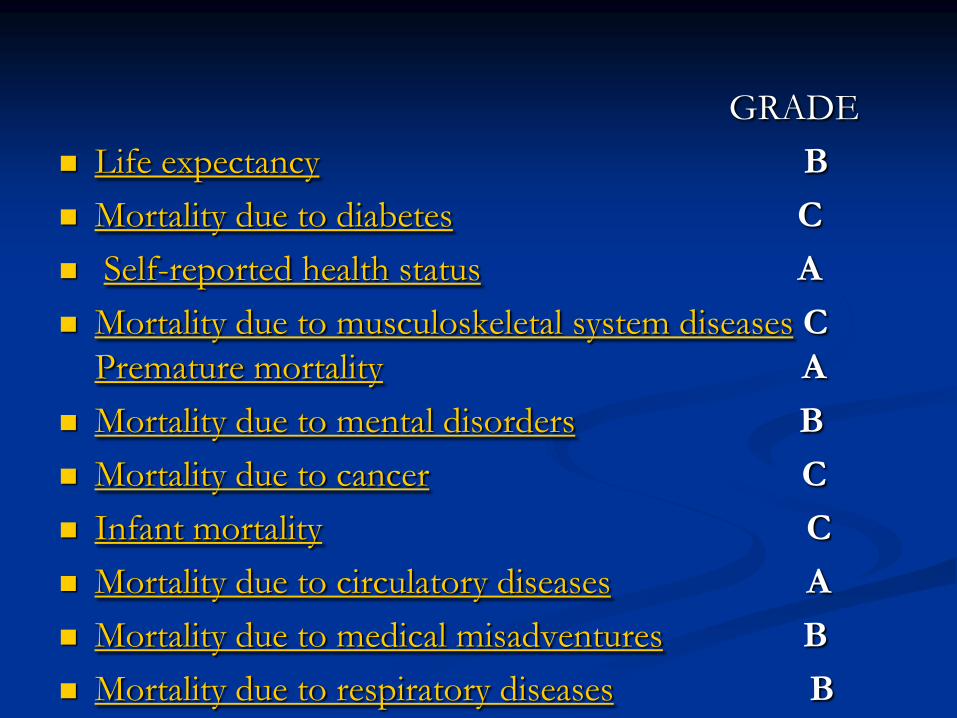
GRADE
Life expectancy B
Mortality due to diabetes C
Self-reported health status A
Mortality due to musculoskeletal system diseases C
Premature mortality A
Mortality due to mental disorders B
Mortality due to cancer C
Infant mortality C
Mortality due to circulatory diseases A
Mortality due to medical misadventures B
Mortality due to respiratory diseases B

WHO Definition of Health
“Health is a state of complete physical, mental and
social well-being and not merely the absence of disease
or infirmity”
Social Determinants of Health are the economic and
social conditions that influence the health of individual,
communities and jurisdictions as a whole
SDOH are about the quantity and quality of a variety of
resources that society makes available to its members (D. Raphael, 2011)

Social Work’s Roots
Social Workers as “sanitary visitors” in US– took note of income, living conditions, education, employment
Early training of US physicians and nurses included home visits
UK social workers first called “almoners” referring to work with the poor
Role was to “screen by a competent person of education and refinement who could consider the position and circumstances of patients” (Gehlert&Brown, 2012)
Further Elaboration of Purpose
“The social worker seeks to remove those obstacles, either in the patient’s surroundings or in his mental attitude, that interfere with successful treatment, thus freeing the patient to aid in his recovery” (Ida Cannon, 1923)
Treating the whole person: Social Work’s primary role
Person in Environment (Keefler, Duder & Lechman, 2001)
What is the Link?
Strong empirical relationship between living circumstances and health and social problems in Canada
Countries with the greatest wealth are not necessarily healthiest – US spends more per capita than any other country in the OECD but has poorer health
The wider the income gap within a society the higher its mortality and morbidity rates (Picket & Wilkinson, 2009)
Medical care plays a limited role in reducing mortality in Western nations compared to increased income, nutrition and public health efforts ((Moniz & Gorin, 2010)
Health and social problems are a result of adverse living circumstances and these are shaped by public policy!
Half of all healthcare outcomes are linked to the social determinants
Only 15 % of outcomes are linked to biology and genetics
Only 10% of outcomes are linked to environmental factors
One in 5 healthcare dollars is spent addressing problems related to POVERTY
Action taken to reduce health inequalities will have economic benefits (Marmot, 2010)
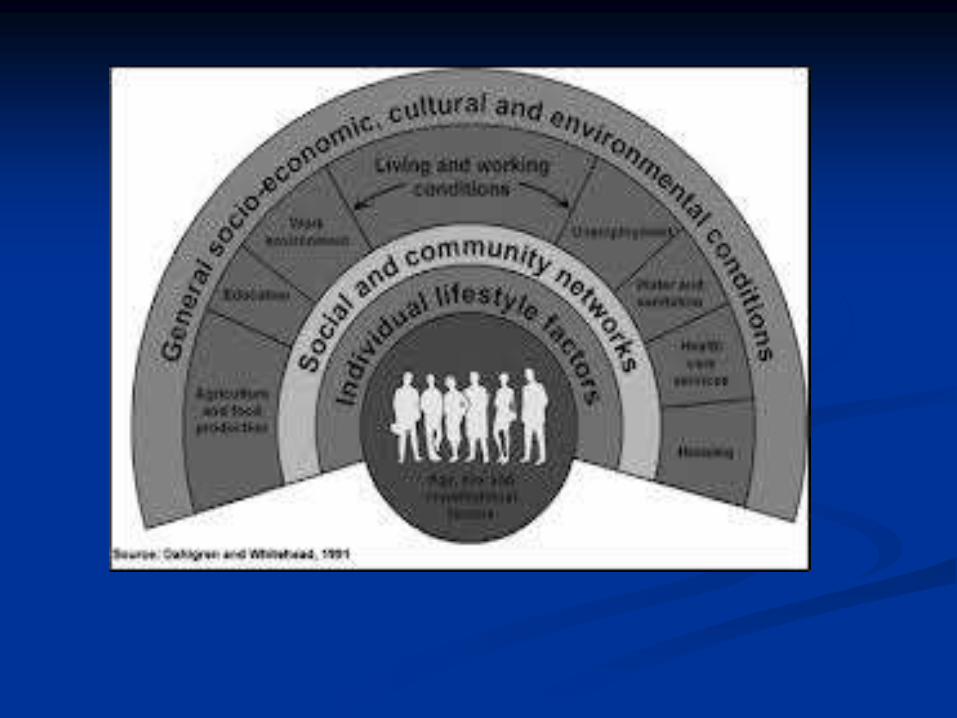

At every stage in life, health is determined by
complex interactions between social and
economic factors, the physical environment and
behavior. They do not exist in isolation from
each other.
It is the combined influence of the determinants
of health that determines health status (Public Health Agency of Canada, 2011)

What determines health?
Why is Jason in the hospital?
Because he has a bad infection in his leg.
But why does he have an infection?
Because he has a cut on his leg and it got infected.
But why does he have a cut on his leg?
Because he was playing in the junk yard next to his apartment building
and there was some sharp, jagged steel there that he fell on.
But why was he playing in a junk yard?
Because his neighbourhood is kind of run down. A lot of kids play there
and there is no one to supervise them.
But why does he live in that neighbourhood?
Because his parents can't afford a nicer place to live.
But why can't his parents afford a nicer place to live?
Because his Dad is unemployed and his Mom is sick.
But why is his Dad unemployed?
Because he doesn't have much education and he can't find a job.
But why ...?
‘Toward a healthy future’ (www.phac-aspc.gc.ca)

Social Determinants of Health
1. Income and Income Distribution
2. Education
3. Unemployment and Job Security
4. Employment and Working Conditions
5. Early Childhood Development
6. Food Security

continued
7. Housing
8. Social Exclusion
9. Social Safety Network
10. Health Care Services
11. Aboriginal Status
12. Gender (York University SDOH Across the Lifespan Conference 2004)

Wealth = Health!
Poor Canadians are twice as likely to die as affluent
Canadians 10 years after suffering a heart attack despite
having similar access to quality medical care
The risk for almost any ailment from mental illness to
infant mortality to asthma falls with each rung on the
socioeconomic ladder a person climbs
In Ottawa a study poor people are twice as likely to be
hospitalized for mental illness than those in higher
income groups

Income and Income Distribution
Health improves with each rung of the
socioeconomic ladder climbed
Whitehall Studies
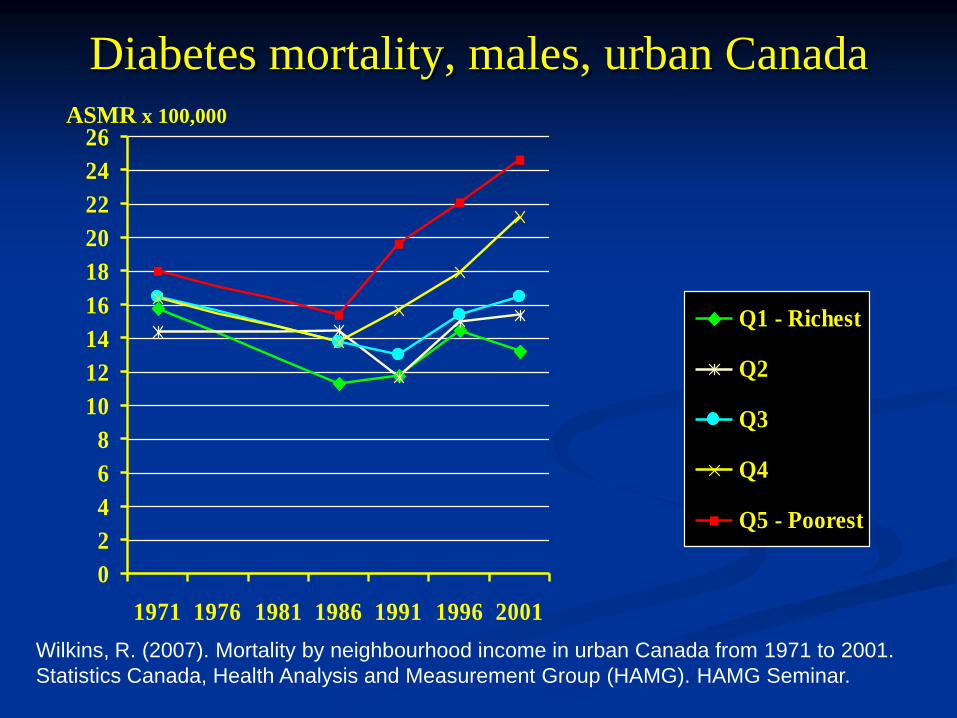
Diabetes mortality, males, urban Canada
0
2
4
6
8
10
12
14
16
18
20
22
24
26
1971 1976 1981 1986 1991 1996 2001
Q1 - Richest
Q2
Q3
Q4
Q5 - Poorest
ASMR x 100,000
Wilkins, R. (2007). Mortality by neighbourhood income in urban Canada from 1971 to 2001.
Statistics Canada, Health Analysis and Measurement Group (HAMG). HAMG Seminar.

Heart Attack Admission Rates by Area
Income, Ontario, 1994 - 1997
4614
8090
11837
1393513115
0
2000
4000
6000
8000
10000
12000
14000
Highest Income
Quintile
2nd Quintle Middle Quintile 4th Quintile Lowest Income
Quintile
Source: Alter, D. A. et al. (1999). Effects of socioeconomic status o access to invasive cardiac
procedures and on mortality after acute myocardial infarction. NEJM, 341, 1360-1367.

Figure 1-1. Life Expectancy of Males and Females by
Income Quintile of Neighbourhood, Urban Canada,
2001
79
78.6
77.8
77.1
82.8
82.8
82.6
82.3
80.974.7
70 75 80 85
Q1 - Richest
Q2
Q3
Q4
Q5 - Poorest
Life Expectancy in Years
Females
Males
Wilkins, R. (2007). Mortality by neighbourhood income in urban Canada from 1971 to 2001.
Statistics Canada, Health Analysis and Measurement Group (HAMG). HAMG Seminar, and special
compilations.

Education
Strong factor in achieving employment and
therefore income
38% of university grads rated their health as
excellent compared to 19% of those with less
than high school
Ability to understand goals of treatment and
follow direction
Unemployment and Employment
Security
Unemployment and underemployment linked to
poor health
Link between unemployment and income
Unemployment and self esteem
Impact of potential job loss
Employment and Working
Conditions
Double edged sword
Toxic working conditions
Unsafe working conditions
Work stress
Unpaid work
Early Childhood Development
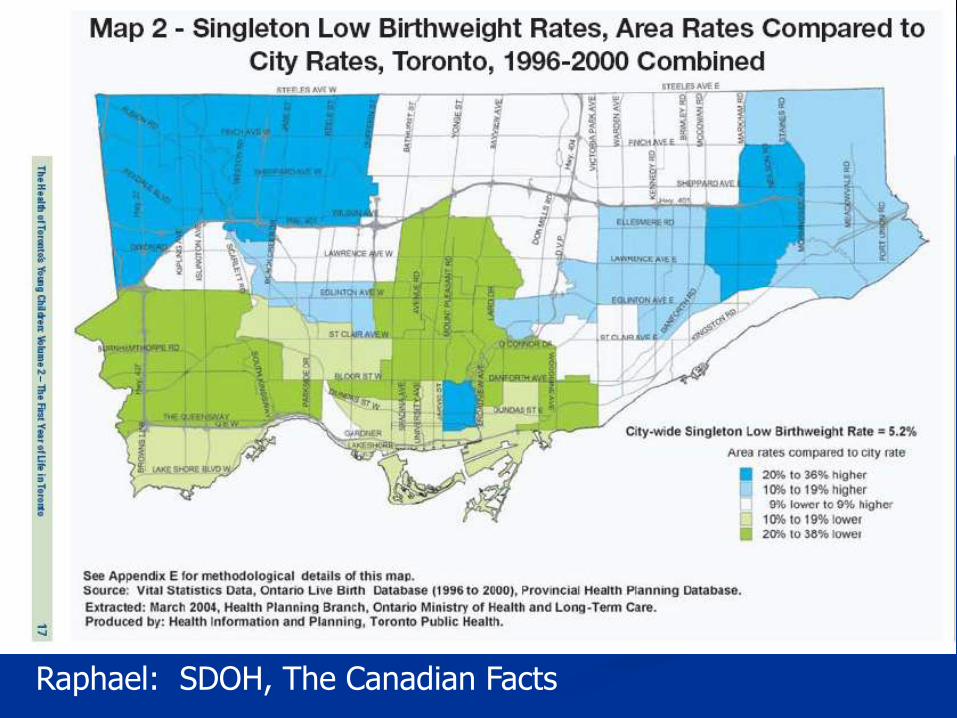
Prenatal health
Emotional attachment
Birth weight and income
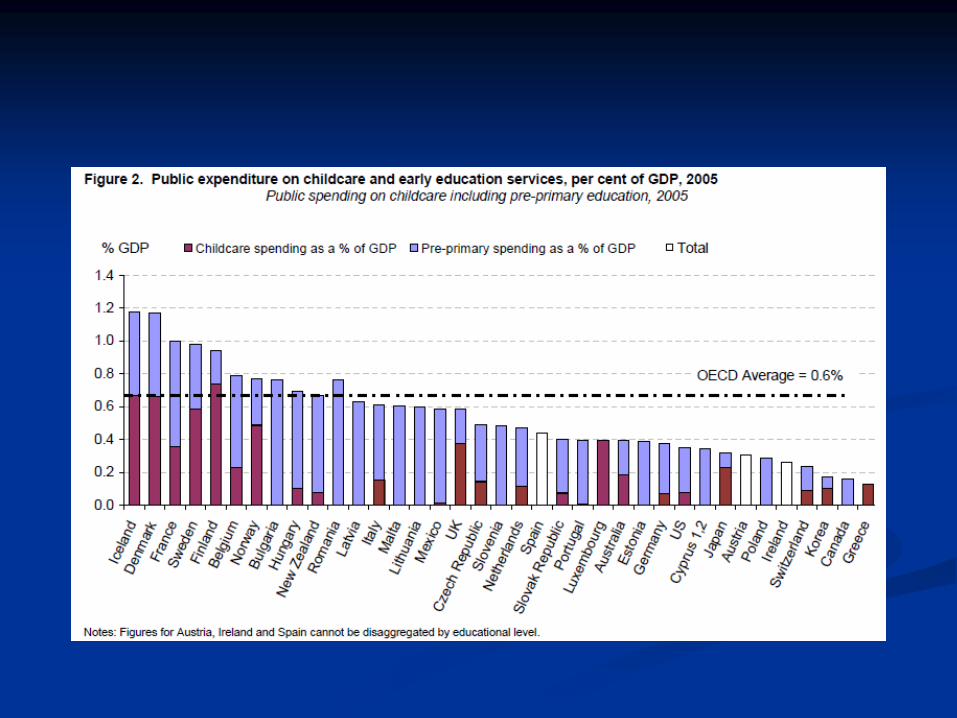
Day care and early learning programs
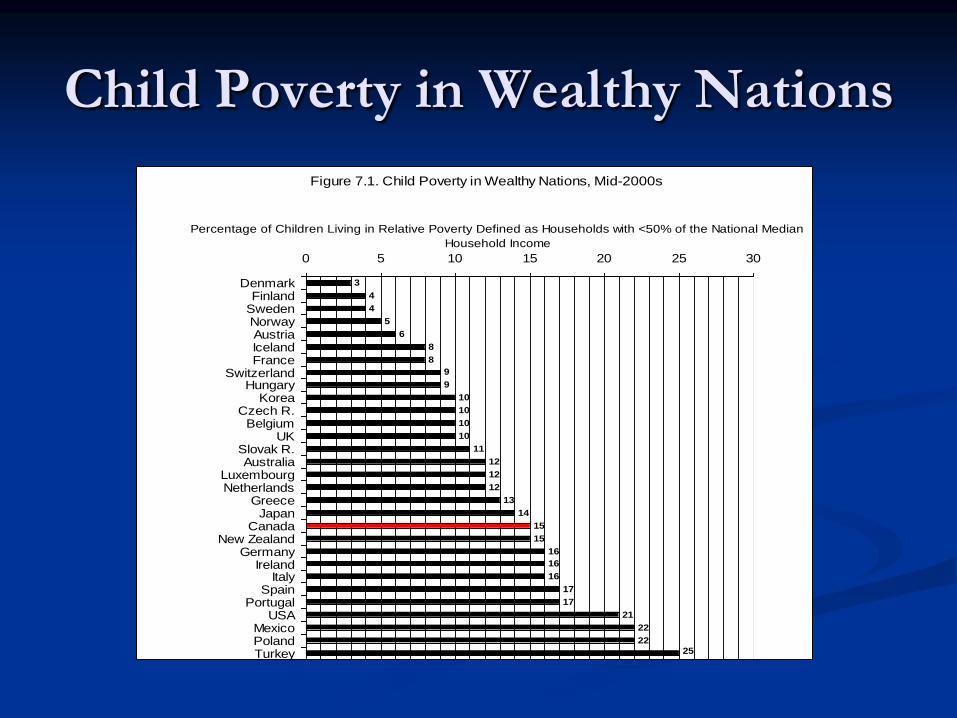
Child Poverty in Wealthy Nations
Figure 7.1. Child Poverty in Wealthy Nations, Mid-2000s
3
4
4
5
6
8
8
9
9
10
10
10
10
11
12
12
12
13
14
15
15
16
16
16
17
17
21
22
22
25
0 5 10 15 20 25 30
DenmarkFinland
SwedenNorwayAustriaIcelandFrance
SwitzerlandHungary
KoreaCzech R.
BelgiumUK
Slovak R.Australia
LuxembourgNetherlands
GreeceJapan
CanadaNew Zealand
GermanyIreland
ItalySpain
PortugalUSA
MexicoPolandTurkey
Percentage of Children Living in Relative Poverty Defined as Households with <50% of the National Median
Household Income

13.4
8.68.1 8.3
5.1
0
2
4
6
8
10
12
14
<20,000 20,000-39,999 40,000-59,999 60,000-79,999 >80,000
Average Family Income and Percentage of
Children with Poor Health
Raphael: SDOH, The Canadian Facts

Food Security
One in eight families have inadequate access to
regular healthy meals
1.1 million children living in a home with food
insecurity
Link to development of chronic diseases
Increased use of food banks

Figure 5. Number of Canadians Assisted by Food Banks:
1989-2010 (March of Each Year)
0
200,000
400,000
600,000
800,000
1,000,000
89 97 98 99 00 01 02 03 04 05 06 07 08 09 10
Year
Nu
mb
er
Ass
iste
d
Housing
Lack of a housing framework although promised
since 2005
Successful Mental Health Commission Initiative
- Housing First (Chez Soi)
Costs of homelessness
Rental costs
Unsafe housing
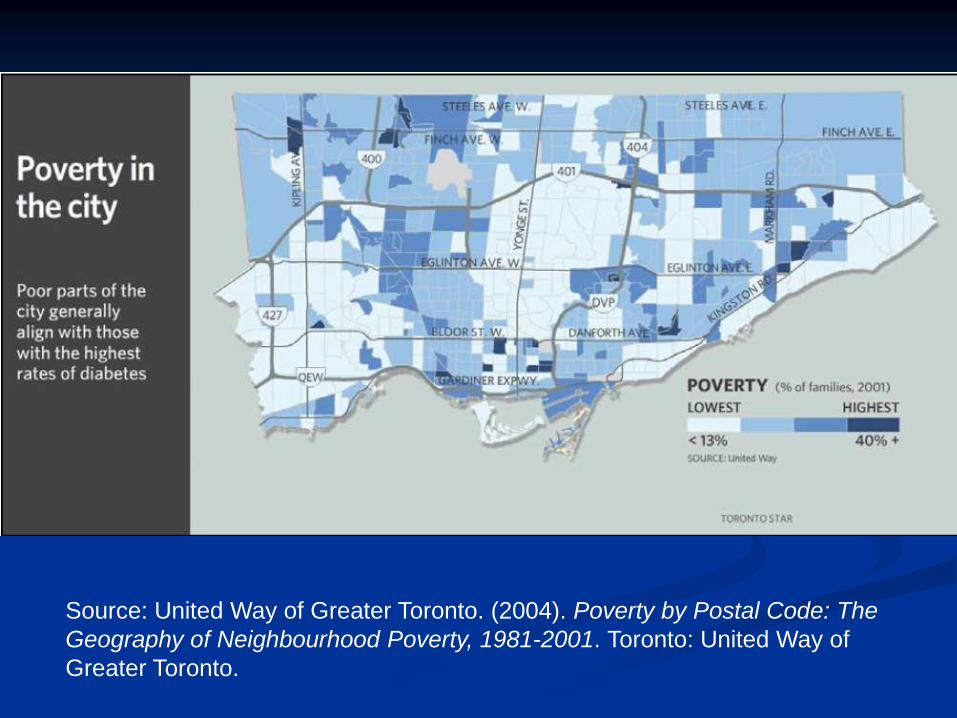
Source: United Way of Greater Toronto. (2004). Poverty by Postal Code: The
Geography of Neighbourhood Poverty, 1981-2001. Toronto: United Way of
Greater Toronto.
Social Exclusion
Importance of family support
Value of community connections/support
Link between social connections and lower
premature death rates
Impact of volunteering and community
programming
Social Safety Net
Social Assistance funding decreases as cost of
living increases
Deterioration of the traditional social safety net
Impact of aging population

Figure 3.5: Total Average Income by Income
Quintile, All Family Units, Canada, 1995-2008
15,00013,100
55,10047,500
169,000
128,400
0
20,000
40,000
60,000
80,000
100,000
120,000
140,000
160,000
180,000
1995
1996
1997
1998
1999
2000
2001
2002
2003
2004
2205
2006
2007
2008
Lowest Quintile Second Quintile Middle Quintile
Fourth Quintile Highest Quintile
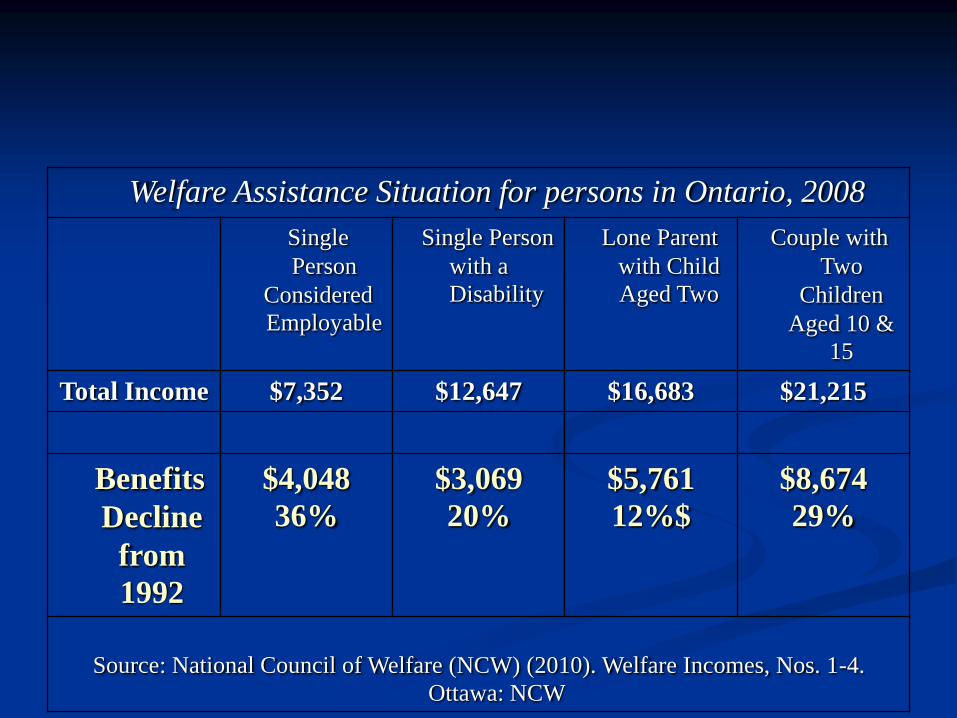
Welfare Assistance Situation for persons in Ontario, 2008
Single
Person
Considered
Employable
Single Person
with a
Disability
Lone Parent
with Child
Aged Two
Couple with
Two
Children
Aged 10 &
15
Total Income $7,352 $12,647 $16,683 $21,215
Benefits
Decline
from
1992
$4,048
36%
$3,069
20%
$5,761
12%$
$8,674
29%
Source: National Council of Welfare (NCW) (2010). Welfare Incomes, Nos. 1-4.
Ottawa: NCW
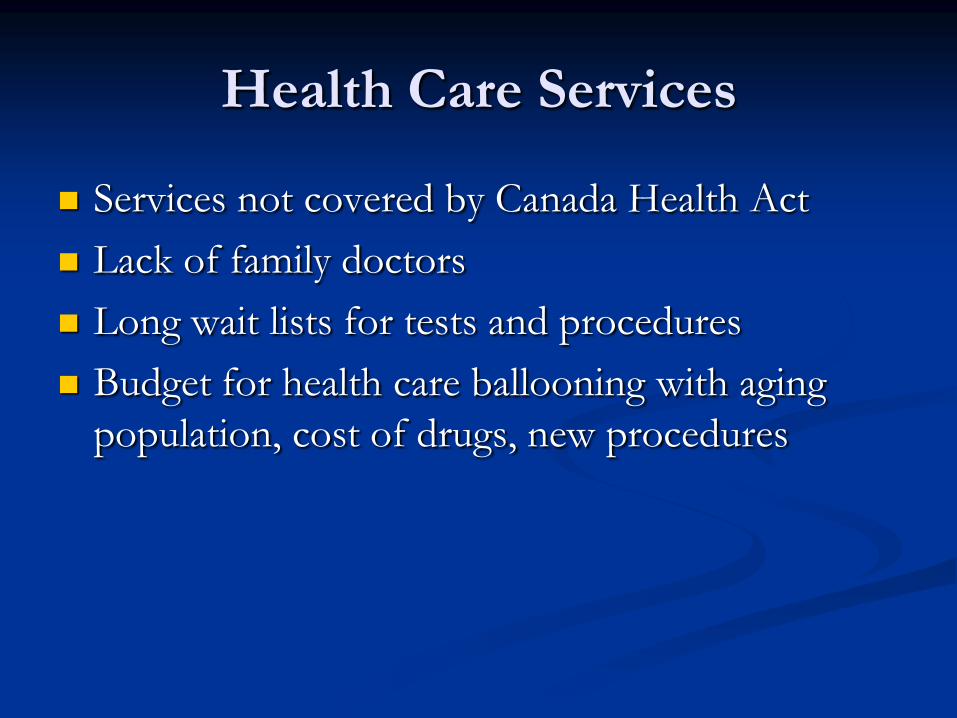
Health Care Services
Services not covered by Canada Health Act
Lack of family doctors
Long wait lists for tests and procedures
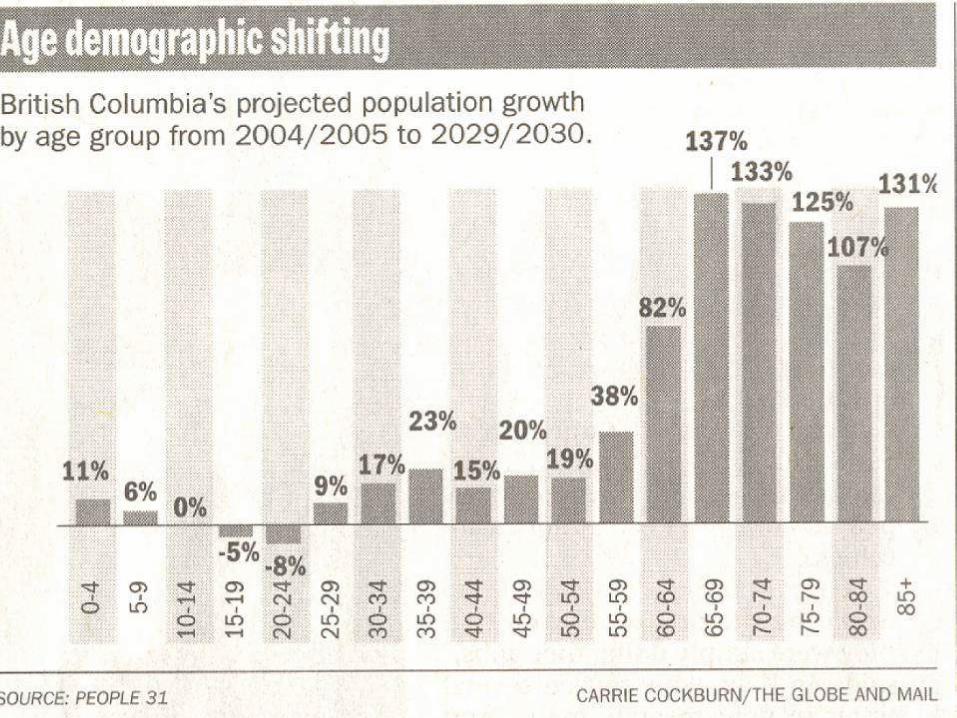
Budget for health care ballooning with aging
population, cost of drugs, new procedures

Aboriginal Status
Prevalence of all major chronic disease higher in
Aboriginal communities
Higher rates of infection
High mental health, addiction and suicide rates
Life expectancies are 5-14 years less than those
of total population
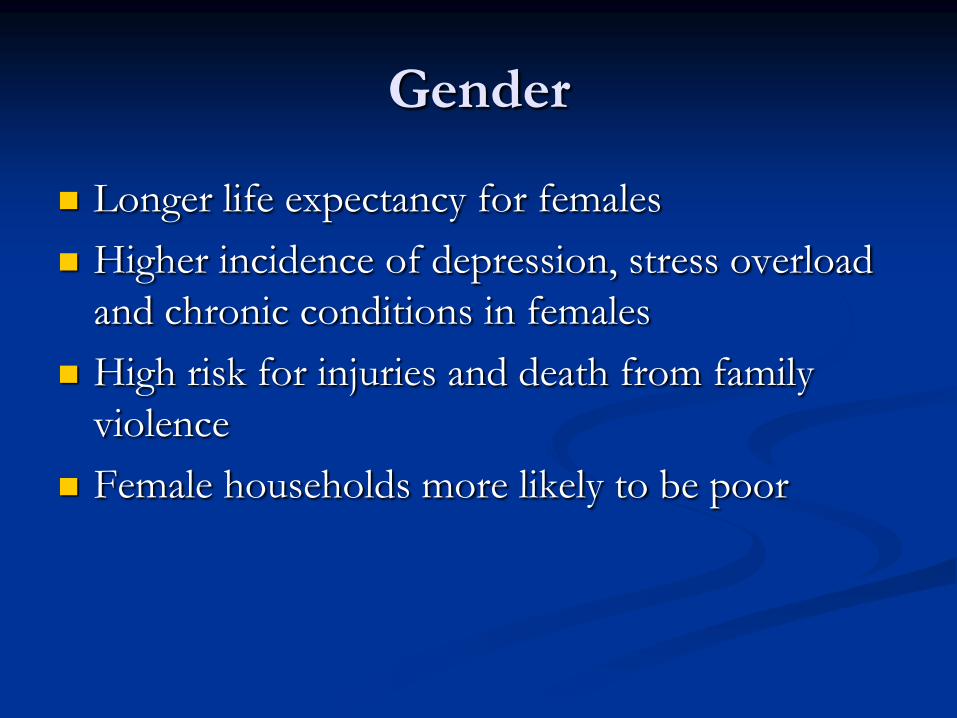
Gender
Longer life expectancy for females
Higher incidence of depression, stress overload
and chronic conditions in females
High risk for injuries and death from family
violence
Female households more likely to be poor
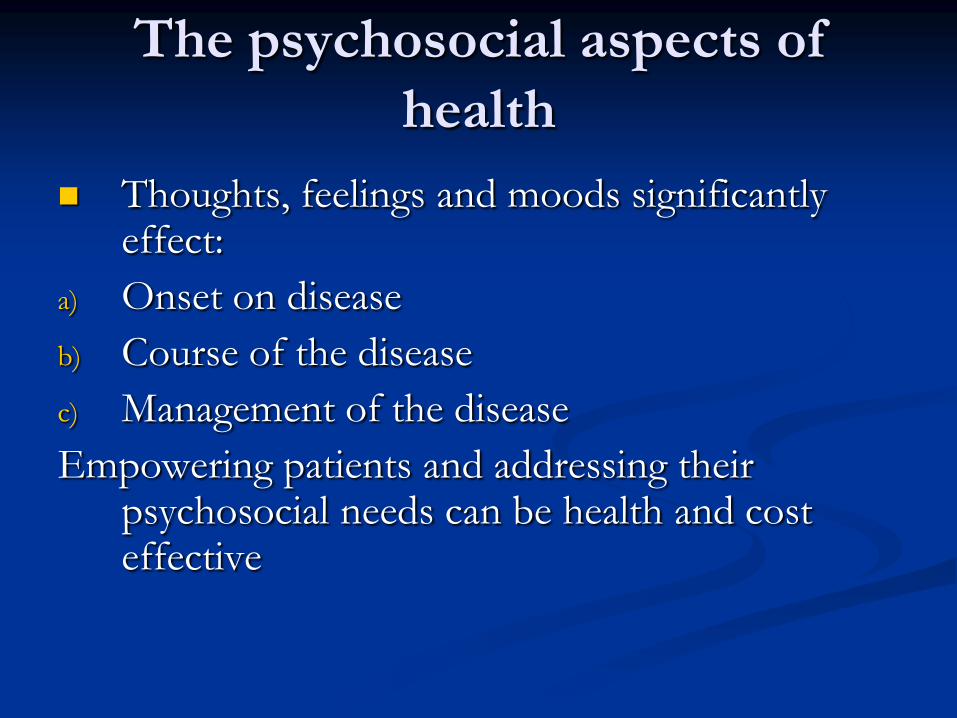
The psychosocial aspects of
health
Thoughts, feelings and moods significantly effect:
a) Onset on disease
b) Course of the disease
c) Management of the disease
Empowering patients and addressing their psychosocial needs can be health and cost effective
Relationship between perceived health and future health
Impact of self-determination and sense of control on illness
Need to reorganize the health care hierarchy

Equity and Inequity
This year, the richest one per cent of Canadians
are each taking home $180,000 more annually
today than they did in 1982. But the bottom 90
per cent of Canadians saw income gains of just
$1,700 a year, 10.6 per cent of the increase
enjoyed by their wealthiest fellow citizens.


Improving Health
Guaranteed annual income
Living wage
National food security program
Affordable housing
Accessible housing, transportation
Pharmacare
Where are our Allies?
What makes Canadians sick? Poverty, says a report from the Canadian Medical Association (Ottawa Citizen, July 2013)
Public Health Agency of Canada’s 2011 report concluded “public health policy needs to be broadened to explore interventions that address socioeconomic determinants”
Canadian Institute for Health Information 2008 report “people in lower socioeconomic groups were far more likely to be hospitalized for mental illness and childhood asthma”

What Can We Do About It?
The World Health Organization suggests all nations establish policies and programs to:
1. Improve the conditions of daily life
2. Tackle the inequitable distribution of power, money and resources
3. Measure the problem, evaluate action, expand the knowledge base, DEVELOP A WORKFORCE TRAINED IN THE SDOH
4. Raise public awareness about the SDOH
(WHO, 2008, p.6)

Implications for Social Work
Interventions
Every intervention should be tied to a social
determinant
The outcomes should be identified
The healthcare team should see how the
intervention has the potential to improve health
/ quality of life and/or reduce the number of
interfaces with the health care system
Evaluation
1. Which social determinants were influenced by the social work intervention?
2. What was the outcome?
Reduced visits to the ER?
Reduced visits to family physician?
Reduced admissions to hospital?
Improved self reported QOL?
Decreased stress levels or symptom levels?
(ESAS scores)

Making the Connection
Attention to concrete needs and ecological risks often is undervalued, but it is part of social work’s “uncelebrated strength” (Johnson, 1999)
Attention can lead to improved quality of life, reduced psychological stress and IMPROVED PHYSICAL HEALTH
Identifying potential resources and services, discussing them with the client and facilitating referrals are important functions for social work and fulfill one of social worker’s key role: linking people to resources (Hepworth et al., 2002)

Hamilton Spectator Letter to Editor
Aug 23, 2013
Social workers key to health care
Health care challenges
Dr. Anna Reid, president of the Canadian Medical Association, was quoted this week as saying "an estimated one in every five dollars spent on health is directly attributable to the social determinants of health."
Given this fact, it is imperative that social workers be part of the solution to this health care challenge. Social workers bring expertise and training in the social determinants of health which will impact the quality of people's lives and their health care outcomes. They work directly with patients, advocating on their behalf to find housing, access financial supports and connect with family and community agencies.
Through their activities, social workers are able to reduce pressures on the health care system by preventing readmission to hospital and assisting people to remain in the community.
Joan MacKenzie Davies, Executive Director, Ontario Association of Social Workers
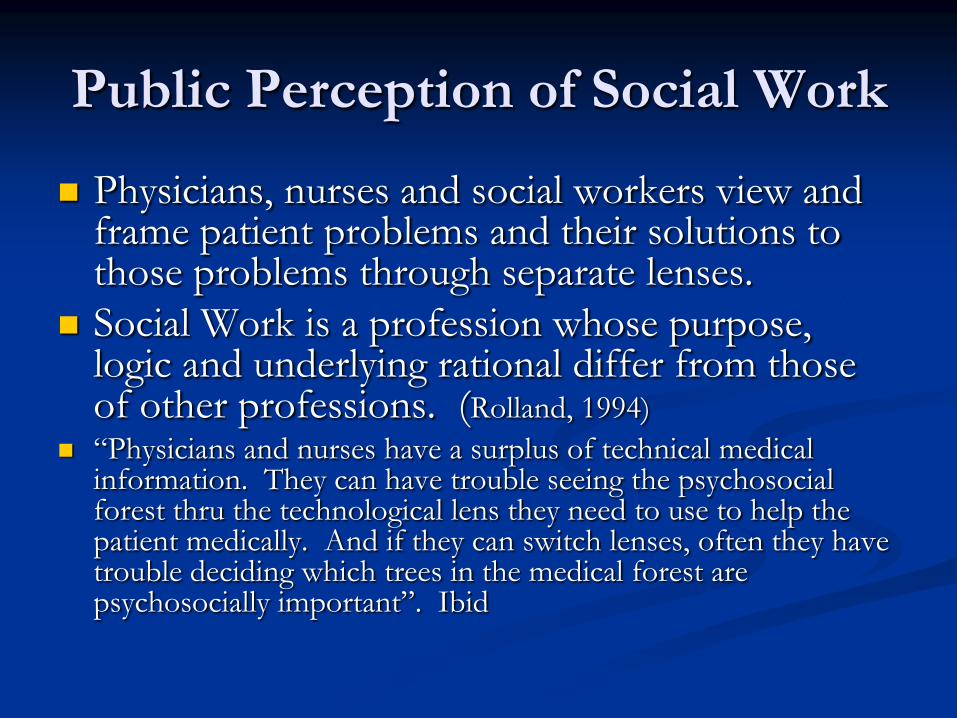
Public Perception of Social Work
Physicians, nurses and social workers view and frame patient problems and their solutions to those problems through separate lenses.
Social Work is a profession whose purpose, logic and underlying rational differ from those of other professions. (Rolland, 1994)
“Physicians and nurses have a surplus of technical medical information. They can have trouble seeing the psychosocial forest thru the technological lens they need to use to help the patient medically. And if they can switch lenses, often they have trouble deciding which trees in the medical forest are psychosocially important”. Ibid
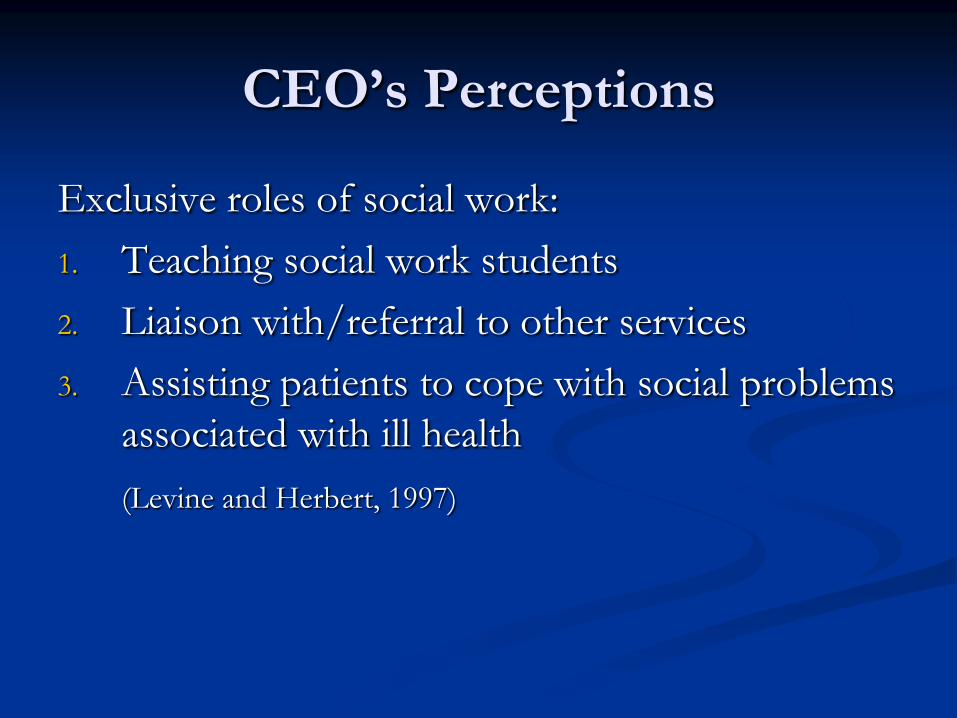
CEO’s Perceptions
Exclusive roles of social work:
1. Teaching social work students
2. Liaison with/referral to other services
3. Assisting patients to cope with social problems
associated with ill health
(Levine and Herbert, 1997)
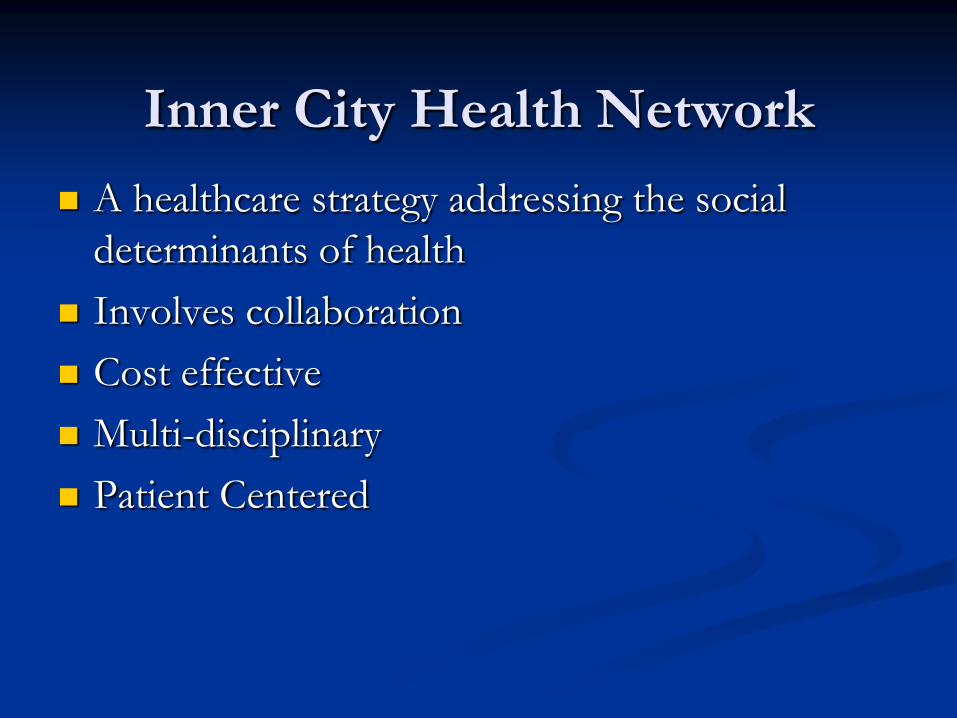
Inner City Health Network
A healthcare strategy addressing the social
determinants of health
Involves collaboration
Cost effective
Multi-disciplinary
Patient Centered
Putting the Social Determinants into
Action
Places of influence for social work:
1. Primary care
2. Family Health Teams
3. Community Health Centres
4. Community Care Agencies
5. Retirement homes, Nursing Homes
6. Social Planning Agencies
7. Community Mental Health
8. Seniors Centres
9. Hospitals especially ER
“Social Work occupies a unique position in that
it has its feet in health and mental health, its
hands in the social sciences, its viscera in clinical
intervention skills, and its head and heart in a
commitment to the issues of the quality of life
of….persons in society”. (Romano, 1981)

Screening for SDOH
Case Example:
A 41 year old woman with no documented medical history or family history of disease presents with occasional chest pains on exertion.
Also is a smoker and high cholesterol
Earns less than $12,000 per year though part time work and rents a $600/month bachelor apartment
Which of these factors will prove most important when addressing her health?

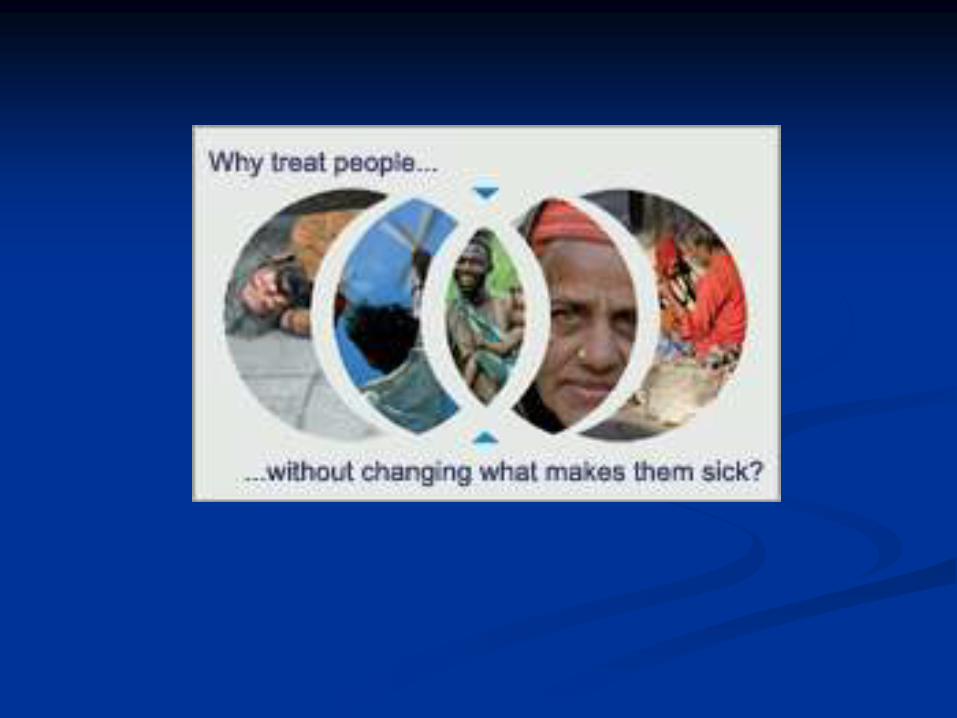
“Let’s Talk About Health Without Talking
About Healthcare” – Sudbury Public Health
Department

Development and Use of
Standardized Social Work
Documentation Tools
The Ottawa Hospital Experience

Healthcare Providers Against
Poverty “Just as screening is important for other conditions or risk
factors, like smoking, high cholesterol or domestic violence, so too is screening for poverty”
“ The evidence shows that poverty is a major health condition and the biggest determinant of health”
Ontario College of Family Physicians has produced a primary care intervention tool on poverty for use by every Family Physician in Ontario and is lobbying to have screening for poverty as a risk factor for health as standard practice.
Opportunities for interventions that can increase income while advocating for government policies that can improve income supports and reduce income inequality

Assessing Psychosocial Conditions
Accurate assessment is at the heart of effective
social intervention
Assessment involves “the thinking process that
seeks out the meaning of case situations, puts
the particulars of the case in some order and
leads to appropriate interventions” (Meyer, 1993)
Social Workers as the “screener” for the SDOH
on the part of the team

Environmental Scan
130 social workers in large tertiary setting providing
inpatient and outpatient care including trauma, ICU,
rehabilitation, Family Health Teams, mental health
services, cancer care, cardiac care
Independence in style observed thru Chart Audits
Ontario College of Social Work and Social Services
Work guidelines
Many and varied consumers of information

Pain Points
Lack of time
Lack of consistency
Disorganization
Illegible handwriting
Poor or non existent relationship between
assessment and interventions
Limited use by consumers
Intercampus Charting Initiative
Action Team (CIAT)
Goals:
1. Improve the clarity, efficiency, clinical reflection and communication aspects of socila work assessments
2. Improve interprofessional communication and quality of care planning
3. Make documentation more widely accessible through use of technology (a secondary goal and benefit)
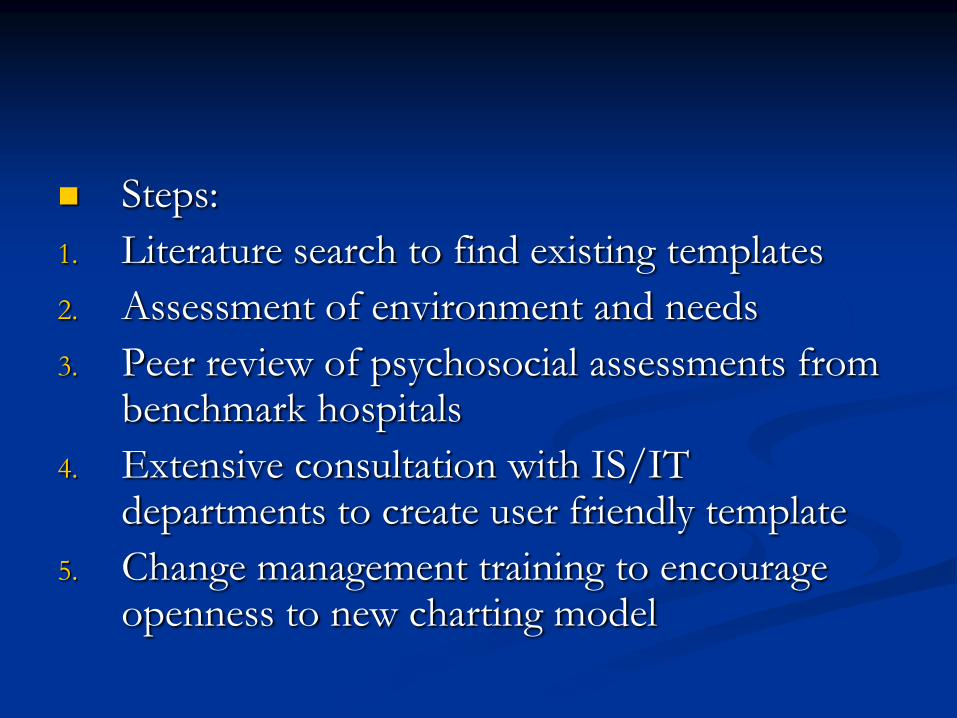
Steps:
1. Literature search to find existing templates
2. Assessment of environment and needs
3. Peer review of psychosocial assessments from benchmark hospitals
4. Extensive consultation with IS/IT departments to create user friendly template
5. Change management training to encourage openness to new charting model
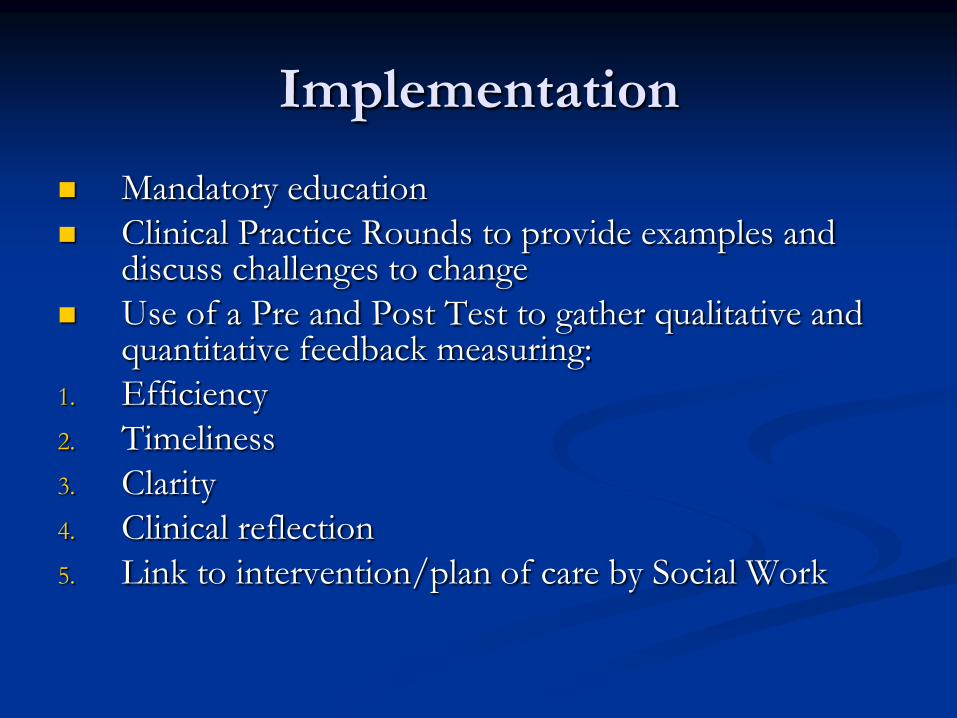
Implementation
Mandatory education
Clinical Practice Rounds to provide examples and discuss challenges to change
Use of a Pre and Post Test to gather qualitative and quantitative feedback measuring:
1. Efficiency
2. Timeliness
3. Clarity
4. Clinical reflection
5. Link to intervention/plan of care by Social Work

Electronic Templates
1. Assessment
2. Summary of Involvement
3. Discharge Summary
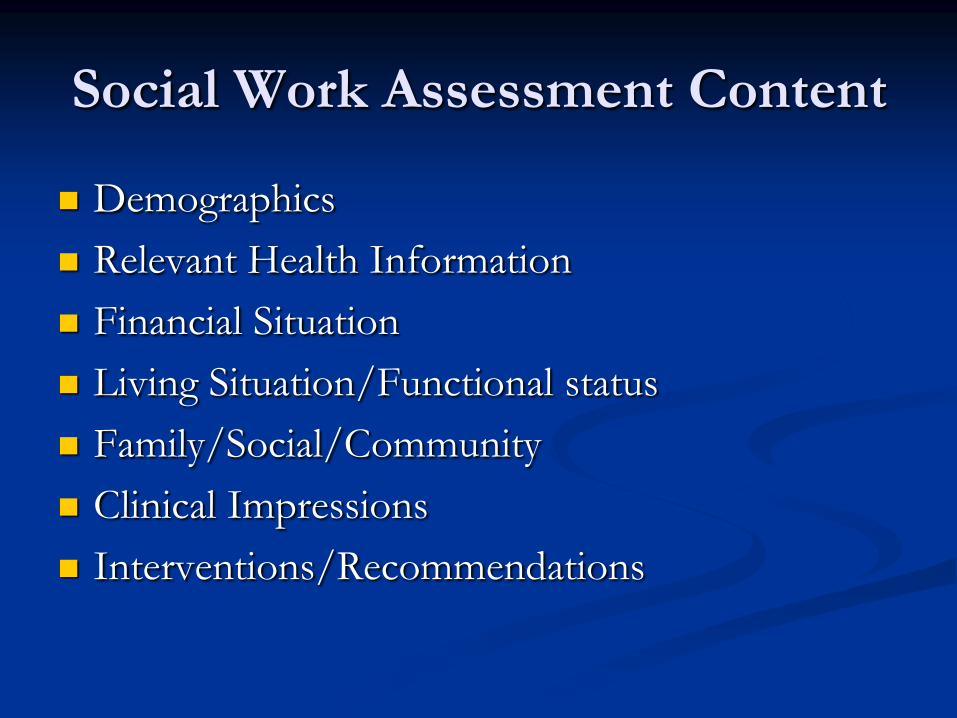
Social Work Assessment Content
Demographics
Relevant Health Information
Financial Situation
Living Situation/Functional status
Family/Social/Community
Clinical Impressions
Interventions/Recommendations
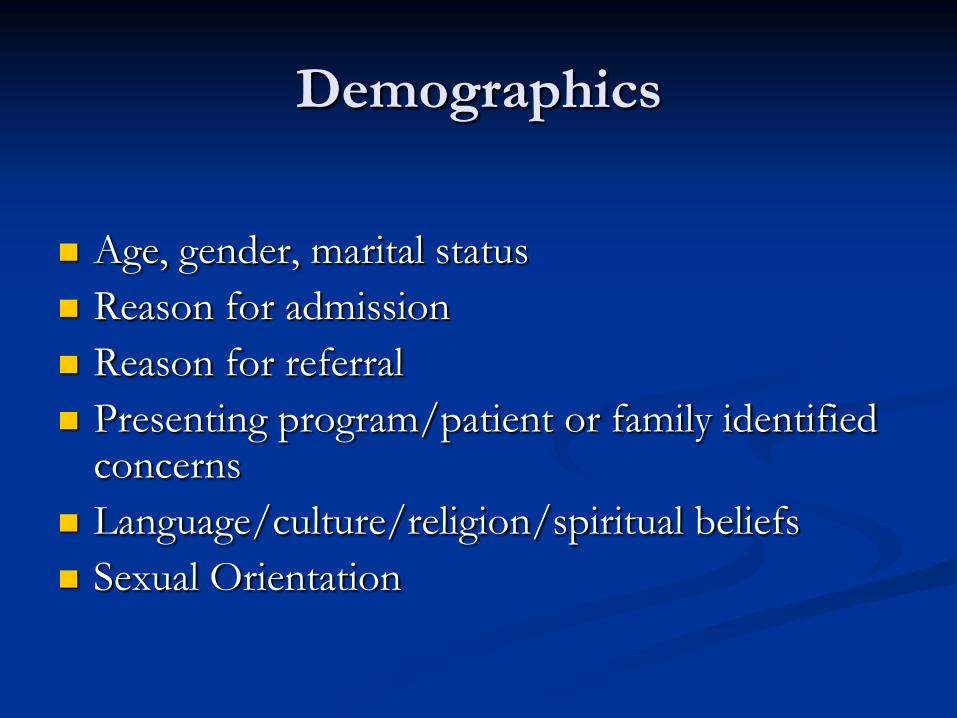
Demographics
Age, gender, marital status
Reason for admission
Reason for referral
Presenting program/patient or family identified concerns
Language/culture/religion/spiritual beliefs
Sexual Orientation

Relevant Health Information
Past medical history
Mental health history
Course in hospital
Substance abuse history
Cognition
Family medical history
Special diet
Medication/treatment adherence

Financial Situation
Source of income
Employment/profession
Household income
Extended health coverage
Expected time away from work
Education
POA/PGT involvement
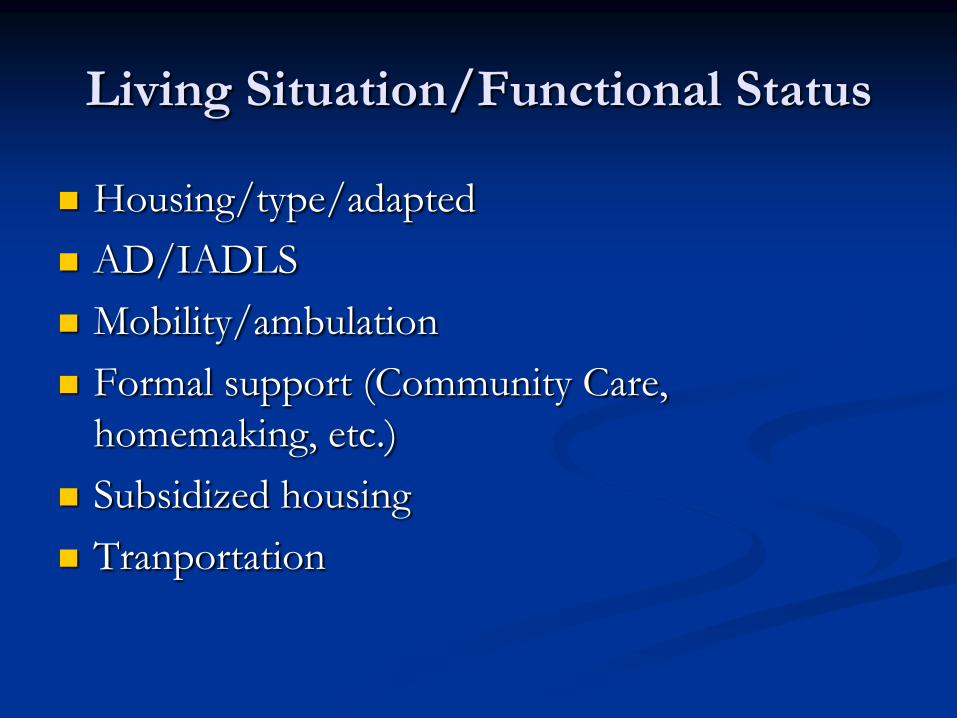
Living Situation/Functional Status
Housing/type/adapted
AD/IADLS
Mobility/ambulation
Formal support (Community Care,
homemaking, etc.)
Subsidized housing
Tranportation
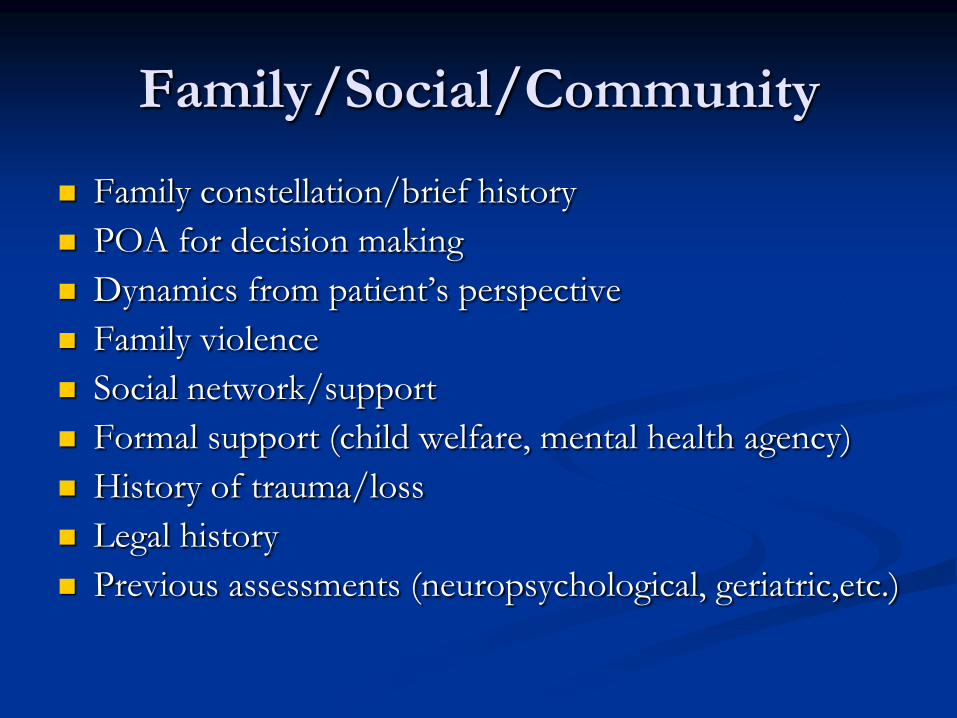
Family/Social/Community
Family constellation/brief history
POA for decision making
Dynamics from patient’s perspective
Family violence
Social network/support
Formal support (child welfare, mental health agency)
History of trauma/loss
Legal history
Previous assessments (neuropsychological, geriatric,etc.)
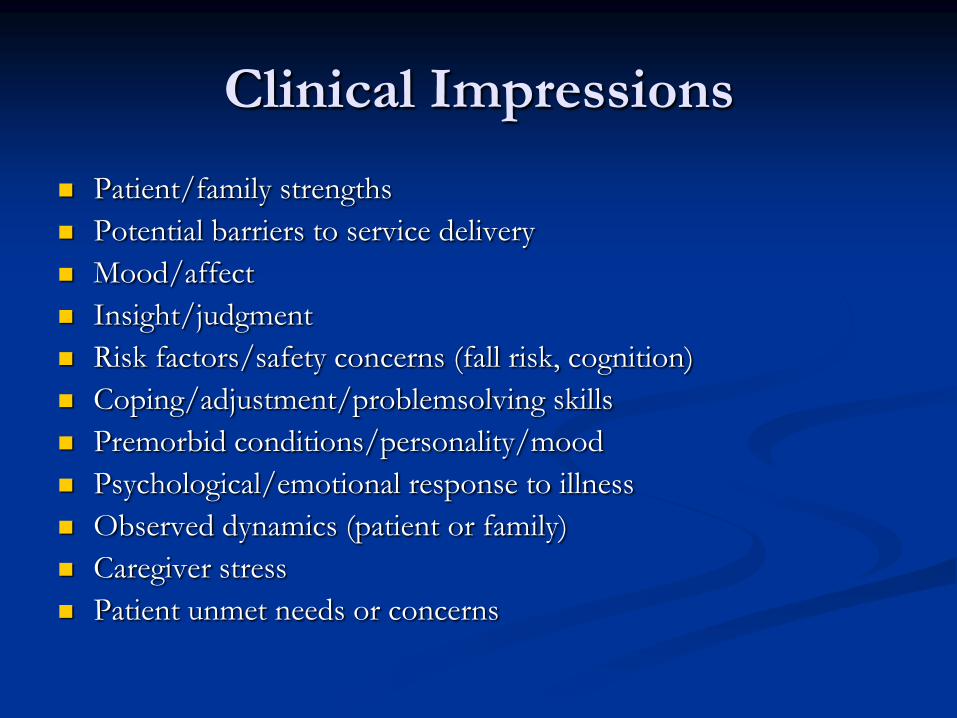
Clinical Impressions
Patient/family strengths
Potential barriers to service delivery
Mood/affect
Insight/judgment
Risk factors/safety concerns (fall risk, cognition)
Coping/adjustment/problemsolving skills
Premorbid conditions/personality/mood
Psychological/emotional response to illness
Observed dynamics (patient or family)
Caregiver stress
Patient unmet needs or concerns
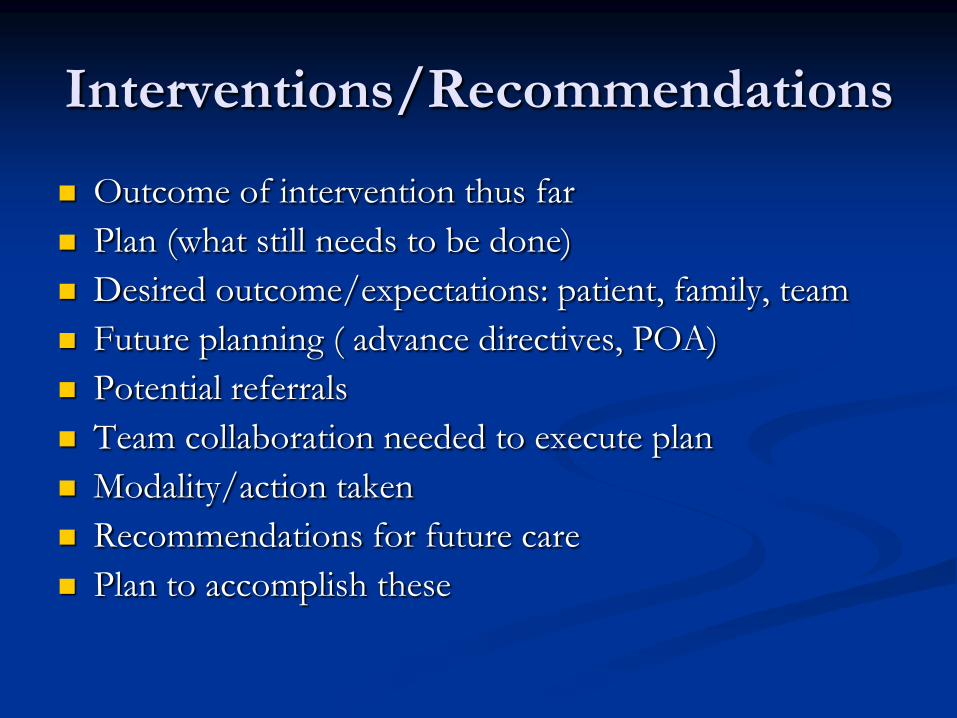
Interventions/Recommendations
Outcome of intervention thus far
Plan (what still needs to be done)
Desired outcome/expectations: patient, family, team
Future planning ( advance directives, POA)
Potential referrals
Team collaboration needed to execute plan
Modality/action taken
Recommendations for future care
Plan to accomplish these

Summary of Involvement
Used for brief interactions where patient may have
been discharged before assessment completed
If original assessment has been done by a previous
worker
Follow up contacts
ALL social work referrals must be accompanied by
some form of e-charting
All social work interventions must be proceeded by a
Social Work Assessment online
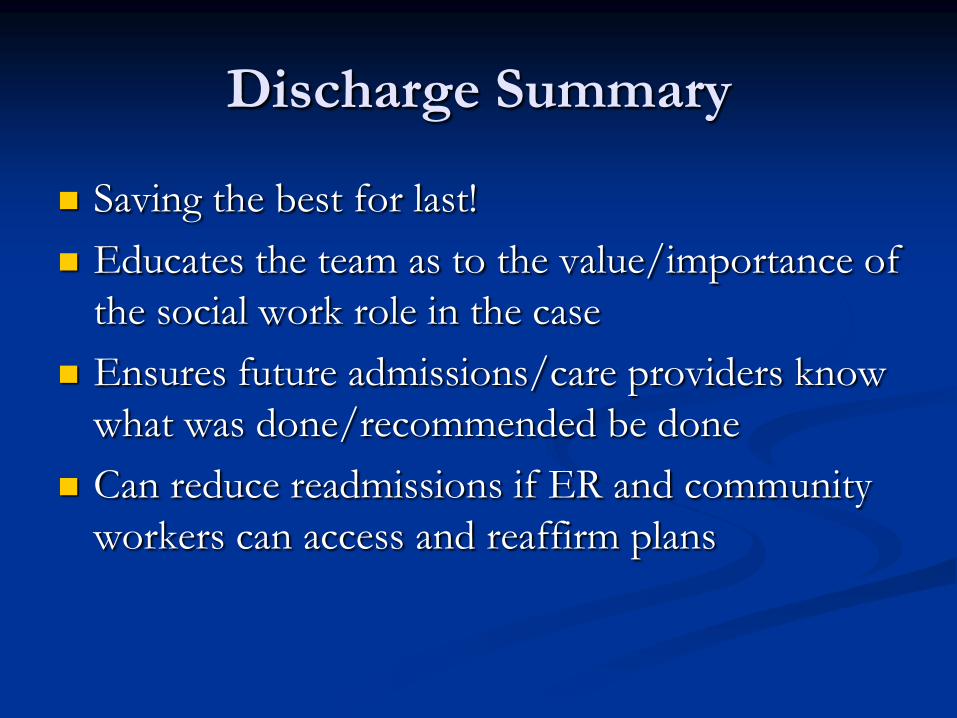
Discharge Summary
Saving the best for last!
Educates the team as to the value/importance of
the social work role in the case
Ensures future admissions/care providers know
what was done/recommended be done
Can reduce readmissions if ER and community
workers can access and reaffirm plans
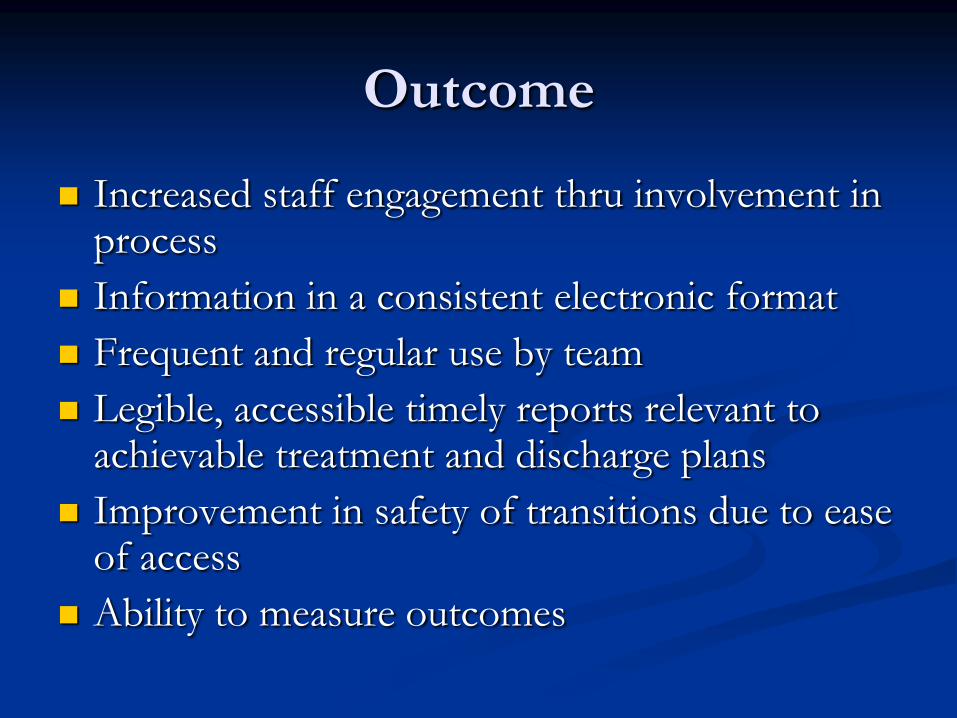
Outcome
Increased staff engagement thru involvement in process
Information in a consistent electronic format
Frequent and regular use by team
Legible, accessible timely reports relevant to achievable treatment and discharge plans
Improvement in safety of transitions due to ease of access
Ability to measure outcomes

Results
Improvements:
Efficiency
Simplicity
Clarity
Clinical Reflection
Education showcasing the impact of SW intervention
Social Workers’ perception that teams showed more understanding of patients’ social situations
Challenges:
Initially more time consuming due to learning curve
Use of Dragon (voice dictation) to increase speed
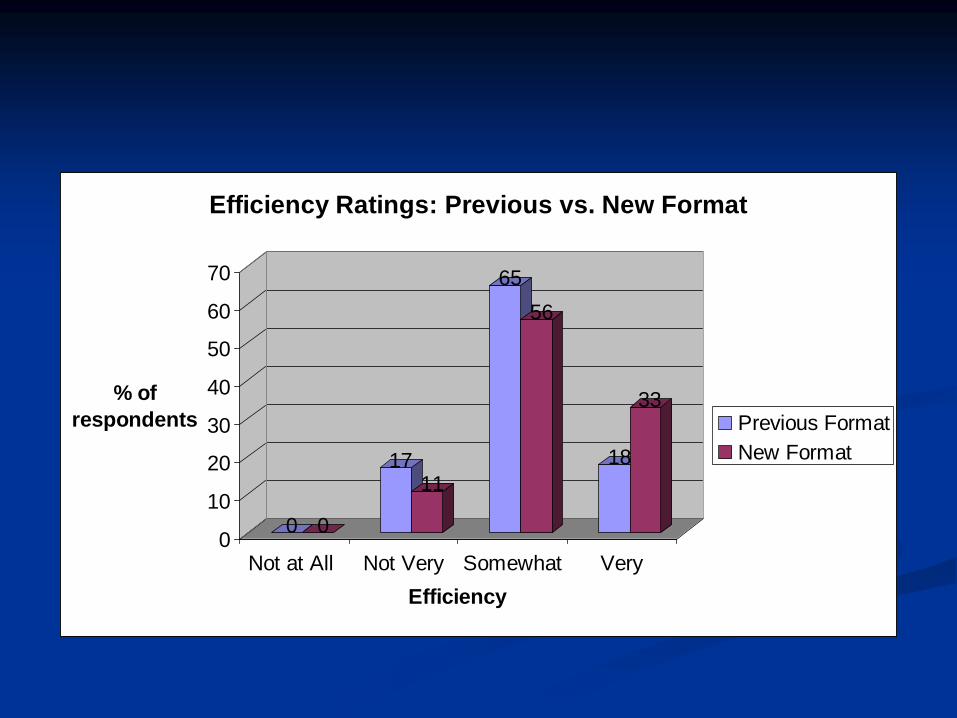
0 0
1711
65
56
18
33
0
10
20
30
40
50
60
70
% of
respondents
Not at All Not Very Somewhat Very
Efficiency
Efficiency Ratings: Previous vs. New Format
Previous Format
New Format

0 0
20
8
52
36
28
56
0
10
20
30
40
50
60
% of
respondents
Not at All Not Very Somewhat Very
Simplicity
Simplicity Ratings: Previous vs. New Format
Previous Format
New Format

1 0
15
5
42
13
42
82
0
10
20
30
40
50
60
70
80
90
% of
respondents
Not at All Not Very Somewhat Very
Clarity
Clarity Ratings: Previous vs. New Format
Previous Format
New Format

1 0
22
7
47
41
30
52
0
10
20
30
40
50
60
% of
respondents
Not at All
Useful
Not Very
Useful
Somewhat
Useful
Very
Useful
Usefulness re Clinical Reflection
Clinical Reflection Ratings: Previous vs. New Format
Previous Format
New Format
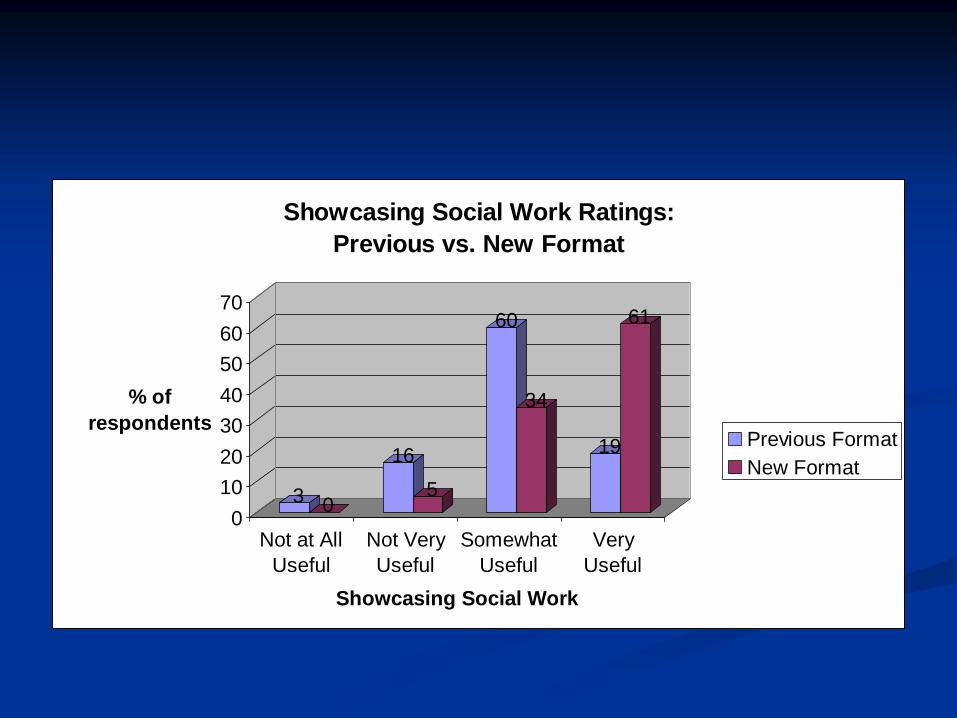
3 0
16
5
60
34
19
61
0
10
20
30
40
50
60
70
% of
respondents
Not at All
Useful
Not Very
Useful
Somewhat
Useful
Very
Useful
Showcasing Social Work
Showcasing Social Work Ratings:
Previous vs. New Format
Previous Format
New Format
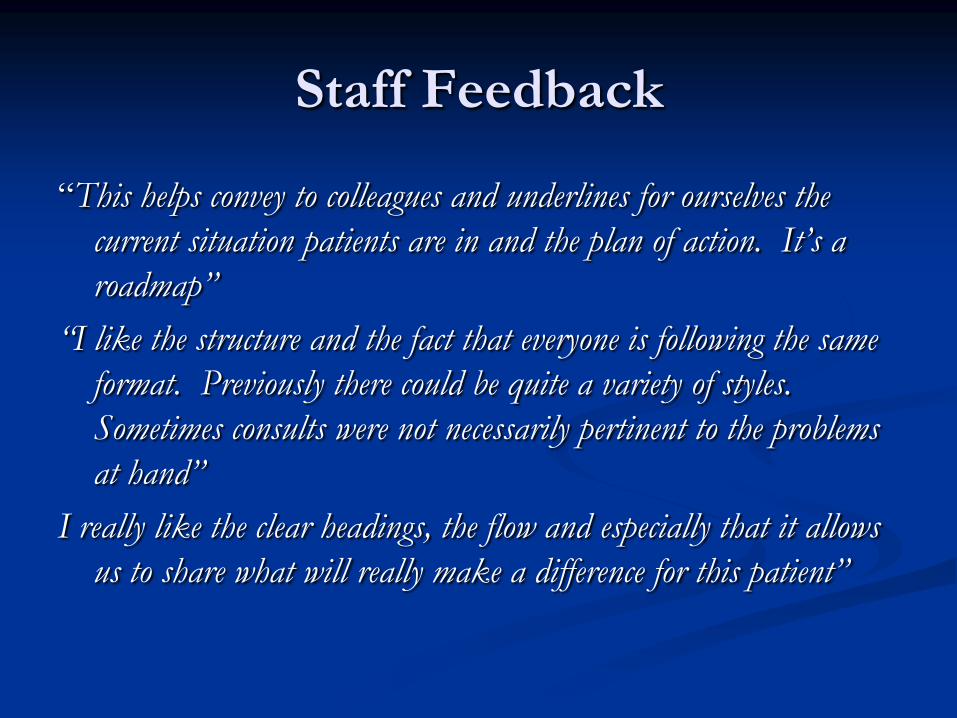
Staff Feedback
“This helps convey to colleagues and underlines for ourselves the
current situation patients are in and the plan of action. It’s a
roadmap”
“I like the structure and the fact that everyone is following the same
format. Previously there could be quite a variety of styles.
Sometimes consults were not necessarily pertinent to the problems
at hand”
I really like the clear headings, the flow and especially that it allows
us to share what will really make a difference for this patient”

The Way Forward!
Social Workers must:
1. Identify ourselves as the profession knowledgeable about the SDOH
2. Identify ourselves as the profession who is trained to intervene to address the SDOH
3. Conduct research to show how our interventions improve quality of life and produce savings for the healthcare system
4. Demonstrate through our recording how we have identified and addressed the SDOH in our cases
5. Advocate individually and through our professional organizations for policy changes to address poverty and all other determinants influencing health and health outcomes
Questions
For more information:
Karen Nelson, MBA, MSW, RSW
The Ottawa Hospital
Email: [email protected]
Linkedin: http://ca.linkedin.com/pub/karen-nelson/25/5aa/6a4/


